Embed Size (px)
Citation preview

RESEARCH SEMINAR IN INTERNATIONAL ECONOMICS RESEARCH SEMINAR IN INTERNATIONAL ECONOMICS
Gerald R. Ford School of Public Policy Gerald R. Ford School of Public Policy The University of Michigan The University of Michigan
Ann Arbor, Michigan 48109-1220 Ann Arbor, Michigan 48109-1220
Discussion Paper No. 533 Discussion Paper No. 533
Cross-Border Trading Cross-Border Trading as a Mechanism for Implicit Capital Flight: as a Mechanism for Implicit Capital Flight:
ADRs and the Argentine Crisis ADRs and the Argentine Crisis
Sebastian Auguste Sebastian Auguste FIEL FIEL
Kathryn M.E. Dominguez Kathryn M.E. Dominguez University of Michigan University of Michigan
Herman Kamil Herman Kamil University of Michigan University of Michigan
Linda L. Tesar Linda L. Tesar University of Michigan University of Michigan
February 2005 February 2005
Recent RSIE Discussion Papers are available on the World Wide Web at: http://www.spp.umich.edu/rsie/workingpapers/wp.html
Recent RSIE Discussion Papers are available on the World Wide Web at: http://www.spp.umich.edu/rsie/workingpapers/wp.html

Cross-Border Trading as a Mechanism for Implicit Capital Flight: ADRs and the Argentine Crisis
Sebastian Auguste FIEL
Kathryn M.E. Dominguez
University of Michigan and NBER
Herman Kamil University of Michigan
Linda L. Tesar
University of Michigan and NBER
Abstract Cross-listed shares may confound government efforts to control capital outflows by providing a legal means through which investors can transfer their wealth outside the country. We study the recent experience of investors in Argentina and Venezuela who while subject to capital controls, were able to purchase cross-listed shares using local currency, convert the shares into dollar-denominated shares, re-sell them in New York and deposit the dollar proceeds in U.S. bank accounts. We show that capital controls drive a wedge between the price of local shares and their corresponding cross-listed shares. This anomalous wedge provides a measure of the market’s implicit devaluation forecast and the value of capital control circumvention. We also find that the imposition of controls in Argentina led to changes in the underlying pricing structure of cross-listed shares in Buenos Aires and New York.
Revised: February 2005 We are grateful to Ariel Burstein and Juan Carlos Hallak for planting the seed for this paper. We would also like to thank the editor, David Backus, our referee, seminar participants at the University of Michigan Business School Argentina Conference, the University of Wisconsin, USC, the International Finance Division of the Board of Governors of the Federal Reserve System, the Research Division at the International Monetary Fund, the University of Oslo, the London School of Economics, the Inter-American Development Bank, LACEA, the NBER, the 2004 ASSA meetings, and Domingo Cavallo, Ben Chabot, Stijn Claessens, Sebastian Edwards, Gaston Gelos, Andrew Karolyi, Patrick Kehoe, Sergio Schmukler and Ashley Taylor for helpful suggestions and comments. We also thank Alberto Balayla, Augusto Darget, Jack Ferrer, Miguel Octavio, Silene Rodriguez, Miguel Santos, and especially Juan Ignacio Gomez Vega for help with finding data.
1. Introduction
The role and consequences of capital controls continues to be a subject of controversy for
many developing countries. Governments that under normal circumstances advocate financial
integration with global markets are often tempted to resort to capital controls in the face of
economic crisis. Argentina and Venezuela are two recent cases in point. In December 2001,
after a decade of open capital markets, the Argentine government imposed a series of financial
market controls in an ultimately unsuccessful bid to forestall economic crisis. In early 2003,
Venezuela established capital controls in the wake of a 20% devaluation. These experiences with
capital controls afford an opportunity to examine the reactions of investors within and outside of
the country to a drastic change in financial market conditions.
The same economic conditions that encourage governments to impose capital controls
also give residents and investors in these countries incentives to remove their wealth. Capital
flight can be accomplished through various channels. In this paper we examine one potential
channel for capital flight that is made possible by the existence of cross-listed shares. By
converting locally-purchased shares into their corresponding shares listed in the United States,
investors can effectively move their wealth out of the country confounding government efforts to
control capital outflows.
There is an extensive literature on cross-listed shares and their role in the global
integration of financial markets (see, for example, the survey by Karolyi (1998)). Cross-listing of
shares on the US stock market allows firms to enjoy the advantages of greater liquidity,
transparency and access to the US capital market.1 From the perspective of U.S. investors, cross-
listed shares are a convenient way of obtaining global diversification.2 This paper describes a
new, and largely unstudied, role for cross-listed shares as a mechanism for capital flight.3
In the absence of capital controls, the law of one price should hold for cross-listed shares
after controlling for the exchange rate and various transaction costs. When capital controls are in
place, however, the factors that determine demand for cross-listed shares in the home market may
diverge from those in the foreign market resulting in a wedge between the two prices. In Section
1 See, for example, Alexander, Eun and Jankiramanan (1987), Foerster and Karolyi (1999), Miller (1999), Ahearne, Griever, and Warnock (2004), Melvin and Valero-Tonone (2003),and Doidge, Karolyi and Stulz (2001). 2 See, for example, Officer and Hoffmeister (1987), Wahab and Khandala (1993), and Jiang (1998). Domovitz, Glen and Madhavan (1997), Errunza, Hogan and Hung (1999), and Karolyi and Stulz (2003) examine the broader influences of cross-listed shares on the development and integration of markets.
1
2 below, we show how controls on capital inflows into the firm’s home market will result in a
premium on the firm’s cross-listed shares in the foreign market relative to the corresponding
shares in the local market, while controls on capital outflow will lead to a premium on shares in
the local market relative to their corresponding cross-listed shares in the foreign market. We test
this relationship in a cross-section of countries and find limited evidence of a systematic link
between capital controls and a gap between the local price of shares and their corresponding
(exchange rate adjusted) price in the foreign market. Lack of information about the specifics of
the capital controls and their impact on the relative prices of cross-listed shares in the home and
foreign markets, however, makes it difficult to draw strong conclusions about the relationship
between violations of the law of one price for cross-listed shares and capital controls in general.
Therefore, we turn to two specific cases of countries with capital controls and cross-listed shares,
Argentina and Venezuela, in which we can precisely track changes in government policy and the
consequent impact on share prices.
The financial regulations put in place during the crises in Argentina and Venezuela allow
us to study how cross-listed shares can provide investors with a means of circumventing capital
controls. In section 3 we discuss the particular controls faced by investors in Argentina and
calculate American Depositary Receipt (ADR) 4 discounts5 based on the transactions costs that
U.S. and Argentine investors faced during the December 2001 to May 2002 period. We find
evidence that local investors were willing to pay a substantial price to move their deposits out of
the domestic market through the conversion of local shares to ADR shares in the U.S. At their
peak, some ADRs in Argentina and Venezuela were trading at a discount (relative to their
corresponding local price converted to dollars) of more than 50 cents on the dollar.
In the presence of capital controls ADR discounts include capital control circumvention
value and currency value. We use ADR discounts in Argentina to estimate the market’s
expectation of the peso devaluation in January 2002 and to price capital control circumvention.
We find that ADR discounts just before the actual devaluation indicate an expected 40-45% fall
in the value of the peso relative to the dollar, similar to reports in a number of financial
3 Melvin (2003) and Kadiyala and Kadiyala (2004) also examine the role of cross-listed shares during the recent Argentine capital control regime. 4 Although Depositary Receipts (DRs) can be issued in a number of markets, all of the cross-listed firms from Argentina and Venezuela issued DRs in the United States; consequently, we will refer to Argentine and Venezuelan cross-listed shares as ADRs. 5 ADR discounts are measured as the difference between the local price in U.S. dollars and the ADR price, as a fraction of the local price in dollars (where the local price is adjusted for the ADR conversion ratio). See equation 6.
2

newspapers during this period. Our estimates of capital control circumvention value using the
most liquid ADR, Perez Companc, average 3% over the full period, and rise to just under 6%
before the devaluation.
In Section 4 we test whether the imposition of capital controls leads to changes in the
underlying pricing structure of cross-listed stocks in Buenos Aires and New York. We find
evidence that local market factors became more important for pricing cross-listed shares in
Argentina, and less important for pricing the same cross-listed shares in New York during the
period when capital controls were in place. Section 5 concludes.
2. Cross-listed Returns and Capital Controls In order to understand how capital controls influence the relative price of cross-listed
securities in the local market and in the U.S., it is useful to define the pay-offs of holding these
stocks in the two markets. Consider a security i that is traded on the local market but is also cross-
listed in the United States. We will use the following definitions: Litp = price of share for firm i on the local market, in local currency
ADRitp = price of the associated ADRs for firm i in the United States, in dollars
tS = spot exchange rate, U.S. dollars per local currency
iξ = conversion ratio between local share i and its corresponding ADR6
Each period t, the local share i pays out a dividend in local currency, denoted Litd . The ex
dividend market valuation of the share, in local currency, is equal to the expected stream of
dividends, discounted by the period rate of time discount, β, and adjusted by the local consumer
price index, Lt j+Ρ :
(1) 1
Lit jL j
it t Lj t j
dp Eβ
∞+
= +
=Ρ∑
Assuming the foreign investors have the same rate of time discount β, the market valuation of the
corresponding ADR, in dollars, is:
6 Local shares are often bundled into groups of shares per ADR. Gompers and Metrick (2001) find that low-priced shares have higher transaction costs suggesting that bundling is likely done for cost reasons. Another reason for bundling is that the NYSE has minimum price requirements. Bundling can help companies avoid their stock being delisted (which occurs when share prices fall below the NYSE minimum). The conversion ratio is fixed at the time of the initial listing.
3

(2) 1
Lt j it jADR j
it t USj t j
S dp Eβ
∞+ +
= +
=Ρ∑
Note that ADRs represent claims against the same stream of risky cash flows in pesos as their
corresponding local shares. Dividends on the ADRs, however, are paid in dollars, and the
appropriate deflator is the U.S. consumer price index, USt j+Ρ . If firms fail (or are expected to fail) to
pay dividends to shareholders of ADRs (possibly because of government restrictions in the
issuing country) this will drive a wedge between the local share price and the currency-adjusted
ADR price.
2.1 The Law of One Price for ADRs
In the absence of capital controls and foreign exchange controls (and abstracting for now
from transactions costs and time delays in ADR conversion), the law of one price should prevail
for ADRs. Equation (3) shows the return in local currency from round-trip arbitrage between the
local market and the United States via ADRs:
(3) 1 1L
it i tADRit
p Sp
ξ⎛ ⎞
⋅ ⋅ ⋅ =⎜ ⎟⎝ ⎠
Investors purchase a local share at price pitL. The share is then converted into (1/ iξ ) units of an
ADR and the ADR is sold for dollars. Finally the dollars are converted back into local currency at
the prevailing market exchange rate.
To see the impact of capital controls on the return to holding cross-listed stocks, consider
the return on round-trip arbitrage from the perspective of a local investor currently holding a
domestic share:
(4)
ADRLitit
t iLit L
it
p pS
Rp
ξ⎛ ⎞
−⎜ ⎟⎝ ⎠=
We assume that investors can conduct this arbitrage instantaneously. Note that if the transaction
were to take time, the expected change in the exchange rate over the transaction interval would
also affect the investor’s return.
Now suppose the government of the country in which the investor resides imposes
controls on capital outflows and/or restricts access to foreign exchange. We denote this tax on
capital outflows as KOτ . Also suppose that investors in the local market can freely convert a local
4

share of security i into its ADR and sell the ADR on the US stock market for US dollars.7 All
other cross-border investments must include the tax on capital outflows, KOτ . However, because
investment in ADRs legally circumvents this tax, demand for local shares with corresponding
ADRs will increase, driving up the local price. In equilibrium, local investors will pay a premium
on local shares (or a discount on ADRs) for the right to convert local shares into foreign-currency
denominated ADRs. The wedge between the ADR price and the price on the corresponding local
share reveals the extent to which controls on capital outflows are binding.
Conversely, consider the impact of controls on capital inflows. Equation (5) shows the
return to round-trip arbitrage from the perspective of a US investor currently holding an ADR:
(5) L AD
US t i it itit ADR
it
S p pRp
ξ −=
R
A tax on capital inflows, KIτ , into the local market reduces the return US investors receive on
alternative investments in the local market. If the ADR channel remains open, arbitrage through
ADRs will result in a premium on ADRs relative to local shares. In this case, US investors are
willing to pay a premium for the privilege of bringing capital into the local market (and
avoiding KIτ )
The discussion above implies a neat dichotomy between the impact of controls on capital
inflows and outflows on the sign of ADR discounts. In practice, this dichotomy may not be so
clear. Controls on capital outflows could cause US investors to worry about their ability to
repatriate profits, and thereby effectively reduce capital inflows. In the empirical section below,
we will see that it is difficult to separately identify the effects of controls on capital inflows and
capital outflows.
Note also that in both cases arbitrage implies that the wedge between the local and
exchange-rate adjusted US price should reflect the cost of avoiding the capital control through an
alternative mechanism. Therefore, the price gap reflects not only the de jure control, but also the
ability of investors to circumvent that control. If the alternatives are relatively cheap, capital
controls would not bind and we would expect the wedge to be small. In section 3 below we
provide a measure of the Capital Control Circumvention Value (CCCV) for Argentina during the
period when capital controls were in place.
7 We will discuss in detail the controls on investors in Argentina in section 3. In both Venezuela and Argentina local investors faced prohibitive controls on capital outflows and on foreign exchange but were able to convert local shares to ADRs, thereby legally circumventing the capital control.
5
2.2 Cross-Sectional Evidence on ADR Discounts and Capital Controls
The previous discussion suggests that, in principle, the discount on ADRs should be
positively related to controls on capital outflow, and negatively related to controls on capital
inflow. To test this relationship we collected country-level data on capital control indices8 and
firm-level data on ADRs and their underlying local shares. We select a representative cross-listed
firm for each of 42 countries,9 and calculate the ADR discount, defined as:10
(6) 1ADRit
it Lt i it
pDS pξ
= −
We selected the year 1999 for our cross-sectional analysis because it was a year for which we had
the largest overlap of information on ADR discounts and on capital controls, and because it was a
year of relative calm for most financial markets in the wake of the Asian crisis.11
We study the relationship between ADR discounts and four different indices of capital
controls: (i) the IMF index;12 (ii) the capital account openness index (CAOI) index;13 (iii) the
Chinn-Ito index;14 and (iv) the Edison and Warnock index.15 Each capital control series has some
8 We first compute daily ADR discounts on days when there were transactions in both markets (to avoid non-synchronous trading biases) and take a weekly average. We then compute the average for the calendar year 1999 as the average of the weekly averages. Results based on daily data are qualitatively similar and are available upon request. 9 We selected one representative level II or level III ADR from each country on the basis of liquidity. Unfortunately many countries that have capital controls do not have ADRs or their ADRs are only traded infrequently. The countries (firms) included in our analysis are: Argentina (Banco Frances), Australia (News Corp Ltd), Austria (Evn Ag), Belgium (Solvay SA), Brazil (Embratel Participacoes SA), Chile (Enersis Sa/Chile), China (Sinopec Shanghai Petrochemical Co Ltd), Colombia (Bancocolombia), Czech Republic (Komercni Banka As), Denmark (Novo-Nordisk A/S), Finland (Nokia), France (Total SA), Germany (Pfeiffer Vacuum Technology Ag), Greece (Hellenic Telecommunications Organization SA), Hungary (Matav Rt), India (Infosis), Indonesia (Indonesian Satellite Corp Tbk Pt), Ireland (Eln), Israel (Matav-Cable Systems Media Ltd), Italy (Benetton Group Spa), Japan (Sony), Korea (Sk Telecom Co Ltd), Luxembourg (Espirito Santo Financial Group SA), Mexico (Grupo Televisa SA), Netherlands (Koninklijke Philips Electronics Nv), New Zealand (Fletcher Challenge Forests Ltd), Norway (Norsk Hydro Asa), Peru (Cia De Minas Buenaventura SA), Philippines (San Miguel Corp), Portugal (Portugal Telecom Sgps SA), Russia (Vimpel-Communications), Singapore (Keppel Corp Ltd), South Africa (Durban Roodepoort Deep Ltd), Sweden (Volvo Ab), Switzerland (Logitech International SA), Taiwan (Macronix International), Thailand (Advance), Turkey (Turkcell Iletisim Hizmet As), United Kingdom (Barclays Plc), Venezuela (Cia Anonima Nacional Telefonos De Venezuela – CANTV). 10 Note that this definition of the ADR discount is equivalent to equation (4) except that the terms in the numerator are reversed (making the discount positive when the price of local shares exceeds the price of the corresponding ADR). We use this definition of the ADR discount in all the empirical work to follow. 11 There were no capital controls in place in Argentina in 1999 so this analysis will not capture the significant deviations between the prices of local shares and their corresponding ADRs that occurred in 2001 and 2002. Indeed, it is these deviations that will be the focus of the rest of this study. 12 See Alesina, Grilli and Milesi-Ferreti (1993). 13 See Brune, Garrett, Guisinger and Sorens (2001). 14 See Chinn and Ito (2002). 15 See Edison and Warnock (2003).
6

advantages and some disadvantages. Each series covers a different sample of countries. Although
we have 42 countries with data on ADR discounts and some measure of capital controls, the
largest sample we were able to use in a regression contained 37 observations. The IMF index is
probably the most widely used in studies of the impact of capital controls on financial market
development and growth. The index is essentially a dummy variable indicating whether or not a
country has capital controls in place in a given calendar year based on the information provided in
the IMF’s Annual Report on Exchange Arrangements and Exchange Restrictions. The advantage
of this measure is that it covers a large sample of countries. The drawback is that the index
contains no information about whether the controls restrict capital inflow or outflow, the
particular type of transaction that is restricted, or the intensity of the control. The CAOI measure
is similar to the IMF index in that a dummy variable is created for each category of capital flow.
The dummies are then added up so that the more controls that are in place, the bigger the index
number. This provides a rough gauge of capital control intensity, but does not give a clear
indication of how tightly each type of capital flow is restricted. The Chinn-Ito measure is based
on the same underlying information, but attempts to aggregate the information in a way so as to
better capture the intensity of the restrictions. The Edison-Warnock index takes a completely
different approach by computing the ratios of the market capitalization of “investable” stocks (i.e.
those available to foreign investors) to the full set of stocks in a given market. In effect, the
Edison-Warnock index provides a measure of the extent to which a market is closed to foreign
investors. It does not, however, provide information about the intensity of controls on capital
outflow from a given market. Edison and Warnock provide two measures of their index: the basic
index (labeled “unsmooth” in Table 1) and an index that corrects for shifts due to changes in
sectoral market capitalizations and not due to shifts in capital controls (the “smooth” index in
Table 1).
Table 1 shows the results of the regression of the ADR discount on the various capital
control indices:
0 1i iD cc iβ β µ= + +
where Di is the average ADR discount for a representative firm in country i, cci is the value of the
capital control index for country i in 1999, and iµ is the error term. Each index is adjusted so that
the higher the index, the more intense the capital control. As shown in the top panel of table 1, we
find some evidence of a positive relationship between ADR discounts and the various measures
of capital controls. The coefficients on the IMF, CAOI and Chinn-Ito indices are statistically
7
significantly different from zero at the 5 percent level, while the smooth Edison-Warnock index is
significant at the 10 percent level.16 Because the indices provide only de jure classifications and
little information about whether the controls are on capital inflows or outflows, it is difficult to
know how to interpret the results. It could be that most of the controls are on capital outflows, and
the positive coefficient can be taken as evidence that controls on outflows results in an increase in
the ADR discount. If this were the correct interpretation, however, we would have expected the
coefficient on the Edison-Warnock indices, which reflect only restrictions on capital inflows, to
be negative. Alternatively, it may be that, in practice, controls on inflows ultimately serve to
control outflows.
[Table 1]
Given the ambiguities in the capital controls series, we repeat the regression using the
absolute value of the ADR discount as the dependent variable. The hypothesis tested here is
whether capital controls, regardless of whether they affect inflows or outflows, drive a wedge
between local share prices and their corresponding ADRs. The results in the second panel provide
some support for this hypothesis. The estimated coefficients are again all positive and four of the
five are significant at the five percent level. Figure 1 provides a plot of the ADR discounts
(expressed in percent) and the Chinn-Ito measure of capital control intensity. The figure suggests
that in most countries, the ADR discount is very close to zero and that the positive relationship
between controls and discounts is driven by Colombia and India.17 When those two countries are
dropped from the regression, none of the coefficients are statistically different from zero.
[Figure 1]
The cross-sectional analysis suggests that there is a tenuous relationship between
available measures of capital controls and ADR discounts. As shown in Figure 1, there is a great
deal of cross-country heterogeneity in the capital control indices, but in most countries those
controls have no impact on ADR discounts. There are a number of factors that could account for
16 If we exclude China, as suggested in Edison and Warnock (2003a), and include developed countries with zero restrictions, as was done in Ahearne et al (2004), the smooth Edison-Warnock index is significant at the 1 percent level. 17 Colombia’s capital controls involved a tax on short-term investment repatriation which provided incentives for investors to purchase ADRs (which are not subject to the tax) rather than local shares. In India (before 2002) there was only one-way fungibility for ADR conversions. ADRs could be converted back into local shares, but not vice versa. Over time the reduction in ADR liquidity (due to the fall in supply) resulted in high premiums on ADRs relative to the underlying stocks. Taiwan and South Korea are also special cases. The Taiwanese and South Korean governments restrict foreign ownership of companies making it very difficult to purchase stocks in the local market. Taiwan also restricts the size of the ADR program. The case of one Taiwanese firm, Taiwan Semi Conductor, has been widely cited in the press because its ADR price so greatly exceeded its local price
8

this weak relationship in the cross-section. First, the dependent variable in the regression is the
average ADR discount over the calendar year. Even a cursory glance at ADR discounts reveals
that discounts can swing dramatically over time, particularly during periods of volatility in
financial markets. These are precisely the periods when capital controls tend to be imposed, but
such information is lost in taking annual averages (which we do in order to match these data with
the annual capital control indices). Thus, the particular window chosen for the analysis can have a
large impact on the results. Second, and more importantly, the capital control measures are only
crude indicators of the particular restrictions that could affect transactions in ADRs. Controls on
some types of capital flow may be largely irrelevant for stock market participants, whereas other
types of legal restrictions – seemingly unrelated to capital flow – could have a large effect on
ADR discounts. For example, restrictions on withdrawals from bank accounts in Argentina
(which are neither controls on capital inflow or outflow) contributed to a run up in local stock
prices and on ADR discounts. Third, the cross-sectional analysis ignores transactions costs and
other taxes (e.g. brokerage fees, local sales taxes, etc.) and short sales restrictions,18 which could
distort ADR discounts. Finally, we have calculated ADR returns assuming instantaneous
arbitrage. If investors know that there is a significant time delay in ADR conversions, the wedge
between the prices of local shares and their corresponding ADRs will also reflect the risk
premium associated with holding the asset over the conversion interval.
For these reasons, we think that the cross-sectional analysis yields at best an imprecise
measure of the relationship between restrictions on capital markets and the wedge between the
prices of local shares and their corresponding ADRs. To probe this relationship more deeply, we
next turn to the role played by ADRs in the unfolding of two recent events, the financial crises in
Argentina and Venezuela.
3. Case Study: Argentine Capital Controls and ADRs Although the exact timing and causes of Argentina’s economic fall from grace are
contentious, there is little disagreement that by the last quarter of 2001 Argentina was on the
brink of a full-scale collapse.19 Between July and November 2001, Argentines withdrew over $15
18 Bris, Goetzmann and Ning (2003) examine whether short-sales restrictions in different countries affect market efficiency. 19 Mussa (2002) makes the case that the persistent inability of the Argentine government to run responsible fiscal policy was the primary cause of the economic collapse. Others point to the deleterious effects of an over-valued currency on exports (see, for example, Feldstein (2002)) and the sudden stop in foreign capital inflows (Calvo, Izquierdo, and Talvi (2003)).
9

billion from banks -- on November 30, 2001 alone, banks saw withdrawals of $1.3 billion. On
December 3rd, in a desperate effort to prevent further massive capital outflows, financial market
controls were established (these are known as the “Corralito”), which among other restrictions,
imposed a ceiling of $1,000 a month on bank withdrawals.20 In January the Argentine peso was
officially devalued and all bank deposits and some (small denomination) debts were “pesofied.”21
3.1 The Corralito
Under the Corralito, depositors were limited to withdrawals of 250 pesos per week per
account22 but could access their accounts to transfer funds within the banking system. Wire
transfers required Central Bank approval, foreign currency futures transactions were prohibited,
and in effect, all investors, foreign and domestic, were prohibited from transferring funds abroad.
The restrictions were announced as temporary measures that would remain in place until the
danger of the speculative attack had passed. 23
The Corralito, did not, however, restrict investors from trading Argentine securities
including those that were cross-listed on another market. Indeed, to do so would have seriously
destabilized the local market as it would have prevented investors from trading in some of the
largest and most liquid stocks on the market. The Argentine ADR “loophole” worked as follows:
Argentine residents were allowed to use bank deposits to purchase Argentine stocks. If a stock
happened to be cross-listed in the U.S. those shares could be legally converted from Argentine
shares into ADRs. The ADRs could then be sold in the United States and the dollar proceeds
deposited in a U.S. account. Under normal circumstances the dollar proceeds would appear in the
Argentine Balance of Payments as a capital inflow, as U.S. residents have acquired claims on
Argentine firms. Under the Corralito, however, the capital inflows did not occur, and the dollars
and/or shares remained outside of Argentina. In effect, the ADR “loophole” allowed Argentines
to transfer monies abroad, but the transactions did not result directly in a fall in Argentina’s
international reserves (or a fall in Argentine bank deposits). ADR conversions, however, did
20 A literal translation of “Corralito” is little corral. It is also the word for “playpen.” 21 On February 3rd, 2002 an asymmetric pesofication (based on type of borrower) of debts was announced. See Appendix 1 for more details. 22 Perhaps unsurprisingly there was a sudden increase in the number of new bank accounts in early December. The government promptly changed the regulations so that the deposit limits applied per person rather than per account. According to the press, some 500,000 accounts were opened in the two days following the imposition of bank restrictions. 23 Some of the original withdrawal limits were eventually modified, though the main restrictions on capital outflow remained in place until December 2, 2002 (exactly one year after they were first introduced). See Appendix 1 for a detailed timeline of the changes in financial market regulations in Argentina beginning in October 2001.
10

reduce the number of (underlying) shares available on the local stock exchange in Buenos Aires,
La Bolsa.
3.2 Decomposition of the Argentine ADR Discount under the Corralito
To see the impact of the Corralito on the ADR discounts, we modify equation (3) to take
into account the restrictions on bank deposits:
(3’) 1 1 1L
it i tD ADRt it
p Sp p
ξ⎛ ⎞ ⎛ ⎞
⋅ ⋅ ⋅ ⋅ =⎜ ⎟ ⎜ ⎟⎝ ⎠ ⎝ ⎠
where Dtp is the price of local-currency denominated bank deposits in terms of local stock (or
cash). During the Corralito, Dtp was less than one because investors were willing to pay for the
opportunity to cash out their bank deposits (which had limited convertibility). In the absence of
controls on bank deposits, we would expect Dtp to be equal to one. Arbitrage now involves
cashing out one’s bank deposits at a discount, purchasing local shares, converting those shares
into ADRs and then selling the ADRs for dollars in the U.S. Consider the return from ADR
conversion on the day the capital controls are imposed, denoted t+1, relative to the day before.
Taking the log difference of equation (3’) yields:
(7) 1 1(ln ln ) (ln ln ) (ln ln )L L D Dit it t t i ip p p p ξ ξ+ +− − − + −
1 1(ln ln ) (ln ln )ADR ADRit it t tp p S+ +− − + − S
D
The first effect, 1 1(ln ln ) (ln ln )L L Dit it t tp p p p+ +− − − , we term the liquidity value of shares. This
reflects the impact of the banking restrictions on the relative price of local shares to bank
deposits. This effect will only exist if controls restrict access to bank deposits but at the same time
allow investors to transform frozen bank deposits – which could potentially be expropriated by
the government or lost in a full-scale bank run -- into stocks. In the absence of controls liquidity
value is zero. Note that in countries with restrictions on bank deposit withdrawals, the prices of
all local market stocks will reflect this liquidity value, not just those that are cross listed. The
premium associated with asset transformation should remain until all depositors in the local
market have re-optimized their portfolios or the deposit restrictions are removed.
The second effect is the capital control circumvention value (CCCV) of cross-listed
shares. ADRs provide a legal means of acquiring foreign assets in capital outflow control
regimes. Note that in equation (7) the rate of conversion of local stock i into its ADR
11

equivalent, iξ , is a constant. Therefore, holding changes in ADR prices and the exchange rate
constant, the increase in the local price of cross-listed shares relative to the (fixed) rate of
conversion, iξ , reflects the value of being able to circumvent the capital controls. In the absence
of capital controls this effect is clearly zero. Thus ADRs carry an additional premium over other
non-cross listed shares and the premium should last until all local investors are indifferent
between holding their assets at home or abroad. This could be achieved either when all of the
available funds have left the country, the cost of moving funds becomes prohibitively high, or the
emergence of alternative mechanisms to channel funds abroad reduces the demand for local
shares with a corresponding ADR.
The third effect is the currency value of ADRs. This effect has two parts. The first part,
reflected in 1ADRitp + , is due to the fact that holders of ADRs own claims to dollar-denominated
dividends, paid out at the official exchange rate (recall equation (2)). Depending on the impact of
the capital controls on the expected path of the official exchange rate, this would alter the market
valuation of the ADR relative to its local share equivalent. The second part of the currency effect
is the change in the exchange rate itself. Because investors receive dollars, rather than local
currency, for the sale of the asset, this will affect the expected profit from ADR conversion.
3.3 Argentine ADRs
Table 2 provides a list of the eleven ADRs listed in Argentina as of December 1, 2001
and traded on either the NYSE or Nasdaq.24 In November 2001 trade in these eleven ADRs
accounted for 36% percent of the Merval Index and 27% of total market volume. Table 2 also
provides pre-Corralito information on each ADR’s market capitalization and trading volume as a
percent of the market, as well as the mean and standard deviation of returns (over the period
January 2001 to November 2001).
[Table 2 here]
Figure 2 shows price indices for value-weighted portfolios of ADRs25 and all other Argentine
stocks from January 1, 2001 to May 31, 2002. Both portfolios reverse their downward trend in the
24 Our list of Argentine ADRs is drawn from JP Morgan’s ADR Universe Directory. Our focus is on eleven of the thirteen exchange-listed shares, referred to as Level II and Level III (capital-raising) programs (which require basic to full compliance with U.S. GAAP and SEC disclosure rules). The two shares we do not include, Nortel and APSA, had very few transactions over the period of study. APSA ADRs only traded on one day during the Corralito while Nortel (a preferred stock) had very few transactions over this period. There are also eleven (Rule 144a and OTC) ADR shares that we do not include in our analysis because there was virtually no trading of these stocks over the period we study. . 25 The figure using price indices for equal-weighted portfolios of ADRs and non-ADRs is qualitatively similar.
12

pre-Corralito period, increasing immediately following the freezing of bank accounts and the
imposition of capital controls. As our discussion above predicted, the ADR portfolio price index
experiences a bigger increase than the non-ADR portfolio price index, reflecting the additional
capital circumvention and currency values of cross-listed stocks.26 We formally test for
differences in ADR and non-ADR portfolio returns just after the imposition of the Corralito in
Table 3.
[Figure 2 here]
We also observe a dramatic change in the trading volume in cross-listed shares in
Argentina over this period. Although the aggregate trading volume on La Bolsa steadily declines,
the fraction of ADRs in the total volume traded jumps dramatically at the time of the Corralito
from roughly 40 percent of the total volume to over 80 percent. Perez Companc alone accounted
for nearly 50 percent of the total volume of trading in the month of December 2001. In late
February 2002, volume in the ADR market leveled off.27 Although the Corralito continued to be
in effect, several regulatory changes, starting in February 2002, may have diminished investor’s
incentives to use the stock market as a means to gain access to frozen assets.28
[Figure 3 here]
3.4 Changes in prices of Argentine ADRs
Table 3 presents the results of tests for whether the differences in the ADR and non-ADR
portfolios we see in figure 2, at the time of the Corralito, are statistically significant. The table
presents changes in ADR and non-ADR portfolio prices in Argentina and New York following
the imposition of the Corralito. (All prices are measured in U.S. dollars). On the day following
the imposition of the Corralito (see the first column of the table), the equal-weighted ADR
portfolio price in Argentina jumped 2.93 percent while the equal-weighted portfolio of non-ADRs
increased by 0.7 percent. If we measure the change in ADR and non-ADR portfolio prices one
week after the imposition of the Corralito the ADR portfolio price change is even more dramatic,
increasing by 13.92 percent, while the non-ADR portfolio rise is 9.43 percent. Similar results
26 Levy-Yeyati, Schmukler and van Horen (2003) argue that it was the most liquid stocks (not ADRs) that had the largest increase in price after the Corralito. We find that while liquidity played a role, in regressions explaining Argentine stock returns, a dummy variable for ADR shares is significant and positive even after controlling for liquidity. 27 This is particularly true in New York where ADR volume declines steadily from its peak in December 2001. Volume in February 2002 was 18 percent lower than the previous December, and by May 2002, volume was a mere 23% of what it had been in December 2001. 28 In February investors were allowed to withdraw (once and for all) 7,000 U.S. dollars from any of their bank accounts. In March investors were given the option to convert deposits into bonds (in pesos or dollars) and they were allowed to use their deposits to purchase properties and subsequently cars.
13
hold for the value-weighted portfolios. These changes are statistically significantly different from
the price movements one would have anticipated based on the pre-Corralito distribution and are
consistent with the view that there was an increase in the liquidity value of all Argentine stocks.
We also examine differences in the prices of the equally-weighted ADR and non-ADR
portfolios (after the imposition of the Corralito) and find that the wedge between the two
portfolios is 2.23 percent one day after (and 4.5 percent one week after) the capital controls were
put in place. The T-statistics indicate that one would not have been able to forecast the wedge
between ADR and non-ADR portfolio returns that arose during the Corralito, based on the
distributions of returns for the two portfolios in the pre-Corralito period.29 The impact of the
Corralito on share prices is consistent with the predictions of equation (7). The liquidity of shares
relative to bank deposits drives up the prices of all shares in Argentina. However, ADR prices
increase by more due to the other benefits of ADR convertibility. The results in Table 3 are
suggestive that there was an additional premium associated with ADRs relative to non-ADRs
during the Corralito.
In the lower panel of Table 3 we examine the same ADR and non-ADR portfolio price
changes, now using the ADR portfolio price in New York. The ADR portfolio price in New York
increases too, but by a fraction of the price changes in Argentina. We also find that the difference
between the (equally-weighted) ADR portfolio price in New York and the non-ADR portfolio
price (in Buenos Aires) one day after the Corralito is only 0.5 percent. The difference in the New
York ADR portfolio price and non-ADR portfolio price the week after the imposition of the
Corralito is actually negative (and statistically significant) suggesting that the New York price on
the ADR portfolio fell below the non-ADR portfolio price during this period. Taken together, the
data suggest that New York prices changed little following the Corralito, while ADR prices in
Argentina rose dramatically. This is consistent with the argument made in section 2 that controls
on capital outflows would increase demand for local shares with corresponding ADRs relative to
demand for non-cross listed local shares. [Table 3 here]
3.5 Argentine ADR discounts
It is clear from table 3 that Argentine share prices increased following the imposition of
the Corralito, consistent with our prediction that share prices reflect the liquidity value of stocks
29 It is worth noting, however, that the distribution of ADR and non-ADR portfolio prices may well have changed after the imposition of the Corralito. If the distribution of prices changed, t-stats based on the pre-Corralito period will not be appropriate. It is, however, unclear in this case what assumption one should make about the distribution of prices in the immediate aftermath of the Corralito.
14

relative to bank deposits. One of the difficulties in studying share price movements, however, is
that it is difficult if not impossible to control for changes in fundamentals that could have affected
firms around the time of the Corralito. The advantage of studying ADRs is that one can use the
price of ADRs in New York as a benchmark for gauging the impact of changes in policies that
were specific to investors in Argentina. We therefore turn to the discounts on ADR shares in
New York relative to their corresponding price in Buenos Aires.
Figures 4 and 5 show prices of local and ADR shares (both in dollars) and the ADR
discounts for two (Perez Companc and Siderca) of the eleven companies in our sample of ADRs
over the January 1, 2001 to May 31, 2002 period.30 The figures also show the arbitrage bounds
based on our estimates of transactions costs (described in Appendix Table A1).31 Table 4
summarizes the maximum and average discounts during pre-Corralito, Corralito pre-devaluation
and post-devaluation periods for each company and the averages across the eleven companies.
The top panel of the table calculates the discounts excluding transactions costs and the bottom
panel includes transactions costs.32
[Figures 4 and 5 here]
[Table 4 here]
The information in Table 4 and the plots indicate that the average pre-Corralito discount
for all companies was close to zero, suggesting that arbitrage between Argentina and the U.S.
kept prices in close alignment. During the Corralito, the average ADR discount (the local price
less the ADR price) jumped to 17.93 percent (excluding transaction costs). And, even after the
devaluation in January the average ADR discount remained at 4.71% (or 10.94% including
transactions costs). Unfortunately many of the ADRs traded only sporadically in the December
2001 through January 2002 period, so that it is not possible to do a full-fledged event study
analysis of the impact of the Corralito and the devaluation on the ADR discounts. To get a sense
of whether the changes in discounts over this period are statistically significant we provide t-
30 Similar figures for the rest of the ADRs are available upon request. 31 The transactions costs we use in the calculations include the Argentine brokerage fees in both Buenos Aires and New York (τ1=.3025, τ3=.3025), the Buenos Aires stock exchange fee (τ2=.1025), the ADR conversion fee (τ4=.15) and the fees to open a NY bank account and wire transfer ADR proceeds (τ5=1.0). These costs are explained in detail in Appendix Table A1. We ignore the time delay in our calculations of premia/discounts. The difference between the lower bound and upper bound in our estimations is around 500 basis points. Rabinovitch, Silva and Susmel (2003), using data for 6 Argentinean stocks with ADRs for the period 1993-2000 estimate arbitrage bands of around 270 basis points, suggesting that transactions costs increased during the Corralito. 32 We use the same transactions costs for the pre-Corralito and post-Corralito periods for consistency, even though it is likely that these costs increased substantially after the imposition of the Corralito (so that we are biasing our results against finding differences in the two periods).
15

statistics that suggest that the discounts observed in the Corralito period are far outside the range
that we would have expected based on the distribution of pre-Corralito discounts.33
Figures 4 and 5 suggest that the ADR discounts were relatively small at the beginning of
the Corralito and peaked just prior to the devaluation. One interpretation of this evidence is that
the value of converting to dollar-denominated assets increased as the devaluation became more
likely in early January 2002. At their peak, the discount exceeded 50 cents on the dollar for
Banco Frances and Perez Companc.34
3.6 ADR Discounts Prior to the Devaluation
By late December 2001, it was clear that a devaluation of the Argentine peso was
imminent.35 On December 21st the Argentine foreign exchange market was closed, although the
official exchange rate remained at 1 peso per dollar. Reports in the press suggest that there was
an active parallel market for dollars on the streets of Buenos Aires during this period, and there
were trades in the one-week ahead non-delivery forward (NDF) peso-dollar market in New York.
It is in this context that the Argentine ADR market was also able to serve as a shadow foreign
exchange market, allowing us to back out the market’s implicit forecast of the size of the
devaluation. Recall from equation (7) that the ADR discount can be decomposed into 3
components: the liquidity premia (for which we have data)36, the capital control circumvention
value (CCCV), and the currency value. We use two different identification schemes to
disentangle the CCCV from the currency value. First, we use data from financial press reports as
33 Non-parametric kernel density estimates (available upon request) suggest that along with differences in the first moment of the ADR discount, there were statistically significant changes in the shape, dispersion and skewness of the distribution of ADR discounts during the Corralito relative to the pre-Corralito distribution. 34 According to brokers and the financial press, the most demanded ADRs for capital flow purposes in this period were (in order of importance): Perez Companc (PC), Grupo Financiero Galicia, Siderca and Telecom. In December 2001, the number of shares of PC traded on the NYSE increased 170%. 35 Although President Dualde initially promised that he would not devalue the peso before March, financial press reports in this period suggest that the market expected a devaluation to come much sooner. On January 4th reports in the press (apparently based on official leaks) indicated that the Government was likely to devalue before mid-January. The Argentine Congress voted to establish the Law of Economic Emergency and abolish the Convertibility Law on (Sunday) January 6th. The decision to devalue the peso and establish a dual exchange rate regime was officially announced on (Monday) January 7th. The actual devaluation occurred on (Friday) January 11th when the peso-usd exchange rate was officially changed from 1 to 1.4. The free float of the peso started on February 11th. See appendix 3 for more information regarding exchange rate developments over this period. 36 The sources for this data are Nosis S.A. and Broda Consultores. The liquidity premium is calculated as the daily average market discount on checks relative to cash. These data are available for January through November 2002. In keeping with anecdotal evidence from Argentine brokers we assume that the liquidity premia rises gradually (linearly) from 0% to 9% (the average premia in January) by December 20th the day that President de la Rua resigned and it became more likely that a devaluation would be necessary (and the Corralito would remain in place for the indefinite future).
16
well as non-delivery forward (NDF) prices37 to measure currency expectations. The CCCV in
this approach is then the residual, after subtracting off the liquidity premia and the expected
devaluation from the ADR discount. Alternatively, going back to equation (7), we make the
assumption that the CCCV and the liquidity premia did not change in the interval of one-day-
before to the day of the devaluation, allowing us to directly back out devaluation expectations
from the one-day change in the ADR discount on the eve of the actual devaluation.
In the week before the announcement of the devaluation (and on the days between the
announcement and the actual devaluation) the range of forecasts for the size of the devaluation
varied widely. Uncertainty about the magnitude of the devaluation was further complicated by
the fact that when the Government announced that a devaluation would take place (on January
7th) – they also announced that a new dual-exchange rate system would be established – in effect
indicating that there would be two simultaneous devaluations. Clarin, the leading newspaper in
Argentina, reported on January 3rd that a devaluation was imminent and that it was expected to be
30%. On January 4th, Clarin upgraded its expected devaluation range to 35-40%. In contrast, the
one-week ahead NDF market was predicting a devaluation of just 25% on January 9th and 10th
(down from 30% in the previous week). Reuters, which collected data on the peso-usd black
market rate in this period, did not track the rate in the week prior to the devaluation apparently
because of the wide dispersion of quotes in the broker market. In our decomposition calculations
we use the (high-end) 40% devaluation forecast reported in the financial press starting on January
4th through January 10th. For the rest of the days in our sample we use the NDF market forecasts.
In figure 6 we provide a visual picture of our first method of decomposing the ADR
discount for Perez Companc (PC) into its 3 components. We focus on PC because it was the stock
with the highest trading volume in the United States and Argentina during the days surrounding
the devaluation, and information from brokers suggests that PC was the stock primarily used to
conduct ADR conversions. The liquidity premium (the price of deposits) ranged from zero to 9
percent, declining very gradually from mid-January through May 2002. The expected devaluation
– based on the NDF series and media reports as described above – shows three sharp spikes on
December 6, December 20 and January 4. The capital control circumvention value – which is the
residual – averages 5% in the week before the announcement of the devaluation. It then falls back
down to around 3% in the post-devaluation period.
In the upper panel of Table 5 we calculate the CCCV for each of the eleven ADRs over
the week before the devaluation assuming a liquidity premium of 9% and an expected devaluation
37 The NDF data are a composite index of one-week forward peso-dollar contracts available on Bloomberg.
17

of 40%. The Argentine Merval was closed in the days surrounding the devaluation, so changes in
the ADR discount reflect movements of the stock price in New York. It is interesting to note that
only two of the ADRs, Banco Frances and Perez Companc, have positive CCCVs in this period.
If actual devaluation expectations were lower than 40% (as suggested by the NDF prices) a
number of the CCCV estimates would turn positive.38 It is also the case that in the period just
prior to the devaluation liquidity in some of the ADRs was extremely low (as reflected in the
trading volume numbers in the last two columns of the upper panel of table 5), this is especially
true for those ADRs with relatively low rates of discount (Irsa, Metrogas, and YPF).39
One way to think about the CCCV in this context is as a measure of the degree to which
the Argentine capital controls were binding. If there were other less costly means of
circumventing the Corralito we should see the CCCV embedded in the ADR discount decline.
Indeed, the Argentine government eased some of the more draconian restrictions on capital
outflows in the months following the devaluation, which likely lowered the ADR CCCV. Also, a
number of other cross-listed financial instruments, including CEDEARs (US firms cross-listed on
the Argentine stock market), became more liquid in early 2002 which provided additional
vehicles for capital outflow,40 further lowering the CCCV for ADRs. Finally, it should be noted
that a negative CCCV for a particular stock does not necessarily mean that there are costless
profits available to investors through ADR conversions. The calculation of the CCCV assumes
that the trade can occur instantaneously. If the stock is held for any period of time, and this period
will be longer for more illiquid stocks -- investors will also take into account any additional
covariance risks that they would incur in holding the stock. These additional risk factors are not
included in our calculations.
[Figure 6 here]
[Table 5 here]
Our second method of disentangling the capital control circumvention value (CCCV)
from the currency value contained in the ADR discount is presented in the lower panel of Table 5.
We make the assumption that the CCCV value (and the liquidity premium) did not change on the
38 If we calculate the CCCV on January 4th, when both the Argentine and New York markets were open, and use the NDF estimate of expected devaluation of 30% and a liquidity of premium of 9.2%, the CCCVs for Financiero Galicia, Siderca and TGS all become positive at 5.1%, 1.4% and 0.4%, respectively. 39 Amihud (2002) provides an alternative measure of liquidity (designed to capture the daily price impact of order flow) that takes the average ratio of the daily absolute return on share i to the daily value of trading volume for share i. Using this measure of liquidity, the five most liquid shares in Argentina during the Corralito are PC, Financiero Galicia, Siderca, Telecom and Banco Frances. Further, using this measure of liquidity, PC is at least 4 times as liquid as any of the other cross-listed shares. 40 See Auguste, Dominguez, Kamil and Tesar (2002) for a further discussion of the role of CEDEARs.
18

eve of the devaluation. If we take the difference in ADR discounts just before and just after the
devaluation on January 11th we find an average expected devaluation of between 40 and 45
percent, depending on whether we use the ADR discounts on January 10th (when only the New
York market was open) or on January 4th (the last trading day on the Argentine Stock Market
before the devaluation) in our calculations.41 These changes in discounts are significantly larger
than the typical daily or weekly discount changes in the pre-Corralito period and they suggest
that, on average, the ADR market did a good job predicting the magnitude of the official
devaluation (which was 40%). However, it is interesting to note that the devaluation forecasts
implicit in the ADR discounts were generally far from predicting the 70% devaluation that took
place for the floating component of the dual-exchange rate system that was also established on
January 11th.
3.7 Venezuela’s CANTV ADR discount
Just two months after Argentina’s Corralito was finally abolished, Venezuela found itself
in the midst of an economic crisis that resulted in a 20% devaluation of the Bolivar against the
dollar and the establishment of capital controls on February 6, 2003. The Venezuelan controls
were less severe than those in Argentina in that they did not involve the freezing of bank deposits,
but all conversions of Venezuelan Bolivars into U.S. dollars (including the purchase of dollars to
pay dividends to ADR holders) became subject to government approval. In the period
immediately following the imposition of the capital controls ADR conversions were suspended,
although trading in CANTV shares (the most liquid Venezuelan ADR) continued both in
Venezuela and New York.42 Starting in May 2003 the Bank of New York announced that it
would resume CANTV ADR conversions and the CANTV discounts (the difference between the
ADR price in New York and the corresponding local price in US dollars) increased dramatically
from below 10% to between 30% and 45%, peaking at 50% in January 2004.43
41 Over this period there are days when only the U.S. market is open (although there exist local prices in Argentina based on the previous trading day) as well as days when particular ADRs did not trade in one or both markets. If we calculate changes in the ADR discounts on January 17th (when the Argentine stock market reopened) rather than January 11th the average change in the ADR discount ranged between 32 and 33 percent. 42 The other Venezuelan firm that was cross-listed on the NYSE in 2003 was Corimon. It was de-listed in June 2003 after it failed to pay dividends to ADR holders and its ADR price in NY dropped so steeply that its market capitalization fell below the NYSE minimum value. The other eleven Venezuelan ADRs were OTC and extremely illiquid during 2003. 43 As of February 2004, the Institutional Investor Relations Department of CANTV indicated that 92% of all possible ordinary shares of CANTV which can be transformed into ADRs (class-D shares), have been converted and are outstanding in New York.
19

Figure 7 shows the CANTV ADR discount together with the “dollar-transfer” rate44 and
the “dollar-CANTV” rate45 over the period May 2002 through February 2004 (the capital controls
are still in place at the time of this writing). During the period when CANTV ADR conversions
were suspended (February 6th through May 20th) and arbitrage was not possible, the dollar-
CANTV is much lower than the dollar-transfer rate. Once ADR conversions resumed, and
arbitrage could again take place, the dollar-CANTV rate closely tracks the dollar-transfer rate.
And, by June 2003 the Economist reported that “shares in CANTV, the telephone company,
which is also quoted in New York, rose by 68% in May, as investors realized that they could
swap them for a dollar-denominated ADR, and thus for dollars”.46 Unfortunately, there does not
exist an alternative measure of currency value in Venezuela that will allow us to disentangle the
CCCV from the expected devaluation. 47 If we assume that the CCCV was in the 3-5% range that
we found for Argentina, this would imply an ADR market expectation of a 55-62% devaluation
of the Bolivar relative to the dollar in early December 2003.
[Figure 7 here]
The Venezuelan ADR market, and particularly the CANTV ADR discount, continues to
provide market participants with a timely indicator of the effective exchange rate in an organized,
legal, and transparent asset market. Indeed, it is interesting to note that in November 2003
Morgan Stanley Capital International (MSCI) announced that it would use CANTV’s ADR
discount to proxy for the Bolivar-usd exchange rate in their calculation of the MSCI Venezuela
Index.48
44 The dollar transfer market (also described as “money tables” or “mesas de dinero”) provides the price in bolivars of buying dollars and transferring them to a foreign bank, so that this price will include the CCCV. These data are available from Venanacham (the Venezuelan-US Chamber of Commerce in Caracas) and are for “large transactions” in an informal broker market. The transaction fee for these transfers is typically fixed at $25 per operation. 45 The dollar CANTV is the effective cost of buying dollars using CANTV ADR conversions inclusive of transactions costs. Our estimates of transactions costs for this market were provided by Activalores. 46 The Economist, June 12, 2003. It is interesting to note that CANTV posted negative earnings in the same quarter that its share price rose by 68%. Venezuela’s Caracas General Index also rose 63% as a direct consequence of CANTV’s price boom, even as Venezuelan GDP was contracting 25%. 47 The official Venezuelan exchange rate was fixed over this period at 1598 Bolivars to the dollar. It is not possible to use Bolivar NDF prices to decompose the ADR discount because the market was extremely illiquid over this period. The dollar transfer rate is also not useful because it includes both transaction costs and a CCCV component. 48 On November 26, 2003 MSCI announced its decision to change its standard spot rate for the Venezuelan Bolivar to a notional exchange rate based on the relationship between the price of CANTV in the local market in bolivars and the price of its ADR in US dollars
20

4. Market Factors and the Pricing of ADRs In Section 3 of this paper we analyze the time series of Argentine ADR and local prices
in isolation. We now turn to the pricing of ADR stocks in the context of overall market
movements in Argentina and New York.
In theory, in a fully liberalized and integrated financial environment, we would expect
ADRs to be priced based on global market factors. Investors with access to global assets should
expect returns to be based on covariances of individual stocks and the global market portfolio.
That said, in practice, Karolyi and Stulz (2003) and Gagnon and Karolyi (2004) find that home
bias tends to increase local influences on asset prices. They find that local market portfolios often
better explain the cross-sectional variation in expected returns for local stocks, though they also
find that equity flows and cross-country correlations increase global influences on asset prices.49
The pricing of Argentine ADRs provides an interesting natural experiment in the context of this
literature. Prior to the imposition of the Corralito, Argentina’s financial markets were considered
fully liberalized. The Corralito, although allowing ADR transactions to continue, was intended
to control capital outflows and therefore presumably led to a less globally integrated Argentine
capital market.50 In terms of the market model, we might therefore expect to find that the
influence of local and global market factors in pricing Argentine cross-listed stocks changed
during the period in which capital controls were in force.
We test whether the imposition of the Corralito led to changes in the pricing of Argentine
stocks with associated ADRs using a multi-factor market model; where is the return on asset i
at time t,
itRGmtR is the return on the global market portfolio at time t, L
mtR is the return on the local
market portfolio at time t, and ∆St is the change in the exchange rate:
(8) ittLmt
Gmtit SRRR εββββ +∆+++= 3210
49 Also see Errunza and Losq (1985), Eun and Janakiramanan (1986) and Alexander et al (1987) who examine the pricing of ADR portfolios in the context of the market model and generally find evidence that global market factors dominate local factors in explaining ADR returns. In a large cross-country study, Gagnon and Karolyi (2004) find evidence of significant differences in the prices of local shares and their corresponding ADR shares, though they also find that these differences rarely persist for more than one day. 50 Schmukler and Kaminsky (2000), however, find little evidence that capital controls (in six emerging market economies during the 1990s) effectively segmented domestic markets especially over longer horizons.
21

Table 6 presents daily time series results51 from regressions of returns from the value-weighted
ADR portfolio (in Argentina and the U.S.) on the Morgan Stanley Capital International (MSCI)
world index, an orthogonalized52 local Argentine value-weighted portfolio index (excluding the
stocks with associated ADRs), and the change in the peso-dollar exchange rate. Regression
results are presented both for the period prior to the imposition of the Corralito (specifically
January 2000 through November 2001) and for the Corralito period (December 2001 through
May 2002).
[Table 6 here]
The results in table 6 suggest that both local (Argentine) market factors and global market
factors were important in pricing Argentine stocks with associated ADRs even before the
imposition of the Corralito. Our estimates of the betas on the global market portfolio are close to
one while the betas on the local market factor are 0.8 for the portfolio returns in Argentina and
0.7 for the corresponding ADR portfolio returns in the U.S. Focusing first on the results for the
regression using the portfolio price in Argentina we find that in the Corralito period the local
market portfolio beta rises (both in absolute magnitude and in relation to the beta on the global
market portfolio) following the imposition of the Corralito. If we examine what proportion of the
variance of portfolio returns in Argentina is explained by the local market portfolio (using the
partial R2), we find that prior to the Corralito this was 42%, whereas during the Corralito this
rises to 76%.53 The opposite is true of the global market factor, the proportion of the variance of
portfolio returns in Argentina explained by the global market factor falls from 16% prior to the
Corralito to just 1% during the Corralito. These results suggest local market factors in Argentina
became more important in pricing stocks with associated ADRs (and presumably all Argentine
51 Daily returns correspond to close-to-close prices including dividends and excluding weekends and holidays. 52 We orthogonalize the non-ADR Argentine portfolio by regressing it on the MSCI (separately over the pre- and post-Corralito subperiods) and use the residuals from these first stage regressions for L
mtR in the estimation of equation (8). 53 This result is based on a market model which includes dummies to control for the many market closures that occurred during the Corralito. In order to determine whether non-frequent trading introduces bias in our regression results, we re-estimated equation (8) using the Scholes and Williams (1977) non-synchronous trading correction. Specifically, we estimate equation (8) allowing for up to 10 lags and leads of the local and global market portfolios. We compute
∑
∑
=
−=
+= n
i
i
n
nii
SWn
1
21 ρ
ββ
where ρ is the autocorrelation
coefficient. We find that the local market portfolio beta is robust to the choice of leads and lags, whereas the global market portfolio beta is sensitive to the lag specification in the Corralito period, though the main qualitative results remain robust. These lead and lag estimates of the betas are available upon request.
22

stocks), and global factors became less important, during the period in which capital controls
were in force.
The discussion in sections 2 and 3 of this paper suggests that the pricing of cross-listed
shares in Argentina and New York may have diverged during the Corralito period. And, in
particular, we might expect that while local factors influenced prices in Argentina, they may not
have been as important for prices of the same stocks sold in New York (given that investors in
New York were not subject to the restrictions of the Corralito). Indeed, we find that estimates of
equation 8 using ADR portfolio returns in New York indicate that the beta on the local market
portfolio falls dramatically from .73 in the pre-Corralito subperiod to .16 in the Corralito period.
The beta on the global market portfolio in this regression also falls in the Corralito period (from
.99 to 0.65), as does the regression goodness of fit which falls from .47 in the pre-Corralito
period to .2 during the Corralito.54 Further, the percentage of variation in the return of the ADR
portfolio in New York explained by the local market portfolio (based on the partial R2) falls from
43% before the Corralito to 16% during the Corralito, while the explanatory power of the global
market index falls from 23% to 9%.
In order to more formally test the hypothesis that the influence of local and global market
factors for pricing Argentine cross-listed shares changed after the imposition of the Corralito, we
use a Chow breakpoint test for structural change. Table 7 presents the results of four such Chow
tests for no structural change in the local and global market betas in the two markets (over the full
sample period January 2000 through May 2002). The results indicate strong rejections of the
hypothesis of no structural change in both the local and global market betas after the imposition
of the Corralito for the ADR portfolios in both markets. These results together with the results
presented in table 6 indicate that Argentine ADRs in New York became less like other Argentine
stocks (including those with associated ADRs) with the advent of capital controls.
[Table 7 here]
54 We analyze beta stability in the post-Corralito period by running recursive least squares regressions. These estimates (available upon request) suggest that in the first two months following the imposition of the Corralito (and when the volume in the ADR market was at its peak) neither the global market index nor the Argentine market index explain ADR portfolio returns in New York (whereas in Argentina local market factors become more important in explaining the pricing of stocks with associated ADRs over this period). In the subsequent two-month rolling subsamples the global market index beta regains statistical significance and rises in magnitude for the ADR portfolio returns in New York.
23

5. Conclusions Argentina in late 2001 and early 2002 and Venezuela in 2003 provide an unusual
opportunity to analyze the reactions of investors to capital controls. The Argentine Corralito,
originally put in place to stave off a devaluation of the peso, effectively served to provide
incentives for Argentines to invest in the Argentine stock market, and provided a new role for
cross-listed shares as a (legal) mechanism for capital flight. Venezuelan investors also learned to
use CANTV ADRs to evade similar capital controls. Investors in both countries were able to
purchase cross-listed stocks for local currency, convert them into ADRs, re-sell them in New
York for dollars and deposit the dollar proceeds in U.S. bank accounts.
In the paper we show that Argentine and Venezuelan ADR discounts went as high as
55%, indicating that investors were willing to pay significant amounts in order to move their
funds abroad and to hedge the dollar value of their assets. In effect, ADR discounts serve as a
shadow exchange rate in the presence of capital controls. In Venezuela, the implicit value of the
dollar in CANTV ADR discounts serves as timely indicator of the effective exchange rate in an
organized, legal, and transparent asset market. On the eve of the Argentine devaluation, the ADR
market anticipated a fall in the value of the peso relative to the dollar in the range of 40 to 45
percent. We also estimate that the capital control circumvention value for Argentine ADRs
averaged 3% during the Corralito.
We find that the imposition of the Corralito led to changes in the underlying pricing
structure of ADR stocks in Argentina and New York. The Corralito, although allowing ADR
transactions to continue, was intended to control capital outflows and therefore should have led to
a less globally integrated Argentine capital market. We find evidence of an increase in Argentine
market segmentation after the imposition of the Corralito. Local market factors in Argentina
became more important in pricing peso denominated stocks with associated ADRs, while the
reverse was true (local factors became less important) for the same ADRs in New York.
In the paper we have focused on the recent Argentine experience with capital controls
and the role that cross-listed securities can play in such an environment. But there are general
lessons to be learned. Our analysis suggests that once having established ADRs and other kinds
of contractual arrangements across markets, it is difficult if not impossible to reverse the process
of capital market integration. Indeed Venezuela tried to halt ADR conversions by restricting
firms from paying out dollar dividends, but the government ultimately succumbed to pressures
and allowed ADR conversions to resume. ADRs also give insights into the extent to which capital
controls are binding by providing a market measure of the effectiveness of those controls.
24

References
Ahearne, A., Griever, W., Warnock,F., 2004. Information costs and home bias: an analysis of U.S. holdings of foreign equities. Journal of International Economics, 62, 2, 313-336. Alesina, A., V. Grilli, and G.M. Milesi-Ferretti,1993. The political economy of capital controls, in L. Leiderman and A. Razin, (eds.), Capital Mobility: New Perspectives, Cambridge University Press, Cambridge UK. Alexander, G., Eun, C., Janakiramanan, S., 1987. Asset pricing and dual listing on foreign capital markets: a note. Journal of Finance 42, 151–158. Amihud, Y., 2002, Illiquidity and stock returns: cross-section and time-series effects. Journal of Financial Markets, 5, 31-56. Auguste, S., Dominguez, K., Kamil, H., Tesar, L., 2002. Cross-border trading as a mechanism for capital flight: ADRs and the Argentine crisis. NBER working paper #9343. Bris, A., Goetzmann, W., Ning, Z., 2003. Efficiency and the bear: short sales and markets around the world, Yale School of Management working paper. Brune, N., G. Garrett, A. Guisinger and J Sorens, 2001. The political economy of capital account liberalization, working paper. Calvo, G., A. Izquierdo, and E. Talvi (2003). “Sudden stops, the real exchange rate and fiscal sustainability: Argentina’s lessons”, NBER Working Paper No. 9828. Chinn, M. and H. Ito, 2002. Capital account liberalization, institutions and financial development: cross country evidence, NBER WP 8967. Doidge, C., Karolyi, G.A., Stulz, R., 2001. Why are firms that list in the U.S. worth more? Journal of Financial Economics, 71, 205-238. Domowitz, I., J. Glen, and A. Madhavan., 1997. Market segmentation and stock prices: evidence from an emerging market. Journal of Finance 52 (3), 1059-1085, 1997. Edison, H. and Warnock, 2003. A simple measure of the intensity of capital controls, Journal of Empirical Finance 10, pp. 81-103. Errunza, V., Hogan K, Hung, M., 1999. Can the gains from international diversification be achieved without trading abroad?, Journal of Finance, 54, 2075-2107. Errunza, V., Losq, E., 1985. International asset pricing under mild segmentation: theory and test. Journal of Finance 40, 105–124. Eun, C., Janakiramanan, S., 1986. A model of international asset pricing with a constraint on the foreign equity ownership. Journal of Finance 41, 897–913.
25

Feldstein, M., 2002. Argentina’s fall: lessons from the latest financial crisis. Foreign Affairs, March/April issue. Foerster, S., Karolyi, G.A., 1999. The effects of market segmentation and investor recognition on asset prices: evidence from foreign stocks listing in the US, Journal of Finance 54, 981–1013. Gagnon, L., Karolyi, G. A., 2004. Multi-market trading and arbitrage, Dice Center No. 2004-9. Gompers, P., Metrick, A., 2001. Institutional investors and equity prices, Quarterly Journal of Economics, 116 (1), February. Jiang, C. X., 1998. Diversification with American depositary receipts: the dynamics and the pricing factors. Journal of Business Finance and Accounting 25, 683-699. Kadiyala, P. and P. Kadiyala, 2004. ADRs as leading indicators of exchange rates: the case of Argentine ADRs, Emerging Markets Review, 5, 1, 83-107. Karolyi, G.A., 1998. Why do companies list shares abroad? A survey of the evidence and its managerial implications, Financial Markets, Institutions and Instruments 7, 1–60. Karolyi, G.A., Stulz, R.M., 2003. Are financial asset priced locally or globally? in The Handbook of the Economics of Finance, edited by G. Constantinides, M. Harris and R. Stulz, North-Holland, Amsterdam, The Netherlands. Levy-Yeyati, E, Schmukler, S. and N. van Horen (2003). The price of inconvertible deposits: the stock market boom during the argentine crisis. Economics Letters. Volume 83,1,7-13. Melvin, M., 2003. A stock market boom during a financial crisis? ADRs and capital outflows in Argentina, Economic Letters, vol 81, October, 129-136. Melvin, M., Valerno-Tonone, M., 2003. The effects of international cross-listing on rival firms, AFA 2004 San Diego Meetings. Miller, D.P., 1999. The market reaction to international cross-listings: evidence from depositary receipts. Journal of Financial Economics 51 (1), 103–123. Mussa, M. 2002. Argentina and the Fund: From Triumph to Tragedy. Institute for International Economics, Washington D.C. Officer, D., Hoffmeister, R., 1987. ADRs: A substitute for the real thing? Journal of Portfolio Management 13, 61–65. Rabinovitch, R., Silva, A.C., Susmel, R., 2003. Returns on ADRs and arbitrage in emerging markets. Emerging Markets Review 4, 225-328. Scholes, M and J. Williams., 1977. Estimating beta from nonsynchronous data. Journal of Financial Economics 5, 309-32.
26

Schmukler, S. and G. Kaminsky, 2000. Short and long-run integration: do capital controls matter? Brookings Trade Forum, pp. 125-178. Wahab, M., Khandala, A., 1993. Why not diversify internationally with ADRs? Journal of Portfolio Management 20, 75–82.
27

A. DEPENDENT VARIABLE: ADR DISCOUNT
IMF CAOI Chinn-Itosmooth unsmooth
Beta 0.106 0.019 0.059 0.436 0.250Std error 0.048 0.008 0.018 0.214 0.179P-value 0.036 0.028 0.002 0.058 0.173Number of Obs 37 36 33 19 19R-squared 0.12 0.13 0.27 0.2 0.11
B. DEPENDENT VARIABLE: ABSOLUTE VALUE OF ADR DISCOUNT
IMF CAOI Chinn-Itosmooth unsmooth
Beta 0.100 0.018 0.060 0.436 0.260Std error 0.048 0.008 0.017 0.212 0.177P-value 0.045 0.032 0.003 0.056 0.159Number of Obs 37 36 33 19 19R-squared 0.11 0.13 0.25 0.15 0.06
Sources: Bloomberg; Alesina, Grilli and Milesi-Ferreti (1993) for the IMF index; Brune, Garrett, Guisinger and Sorens (2001) for the CAOI (Capital Account Openness Index); Chinn and Ito (2002); Edison and Warnock (2003)
Note: The dependent variable is the average ADR discount (measured as the difference between the local price in US dollars and the ADR price, as a fraction of the local price in dollars) for a representative cross-listed firm (based on liquidity) in selected countries in 1999. Local prices are adjusted for the ADR conversion ratio. Beta is the coefficient on the capital control index (where the higher the index, the more intense the capital control).
Table 1. Testing for the Relationship between ADR discounts and Capital Controls in a Cross-section of Countries, 1999
Edison-Warnock
Edison-Warnock
Alternative indices of capital controls:
Alternative indices of capital controls:
28

Table 2: Pre-Corralito ADR Information (January 2001-November 2001)
NameRatio
ADR:local Industry
Market Cap as % of Total
Market
Trading volume as %
Market
Mean Return
(%)
Standard Deviation
(%)November November (daily) (daily)
BBVA Banco Frances 1:3 Banking 0.26 1.92 -0.40 4.76Cresud S.A.C.I.F. Y A. 1:10 Food-Agribus-Tobacco 0.04 0.39 -0.06 1.64Financiero Galicia 1:10 Fin Serv-Investment 0.22 7.09 -0.54 4.24Irsa Inversiones 1:10 Real Estate 0.06 0.60 -0.44 2.79Metrogas S.A. 1:10 Oil & Gas-Service 0.15 0.06 -0.13 2.39Perez Companc (PC) 1:10 Util-Gas, Elec&Water 1.03 9.82 -0.18 3.17Siderca S.A.I.C 1:10 Steel 0.61 2.75 -0.16 2.62Telecom Arg Stet-France 1:5 Telecom-DatNtwk 0.61 3.43 -0.35 3.82Telefonica 1:10 Telecom-DatNtwk 1.42 0.03 -0.31 3.41TGS 1:5 Oil & Gas-Service 0.39 0.84 -0.11 2.88YPF S.A. 1:1 Oil & Gas-Service 3.11 0.09 -0.21 1.74
All ADRs 7.91 27.03 -0.26 1.83
Sources : JP MorganNote: The "All ADRs" row corresponds to an equal-weighted ADR portfolio. The "Ratio ADR:local" is the number of local shares bundled into one ADR share.
29

Table 3: Price Impact of Corralito on ADRs in Argentina and New York
I. PERCENT CHANGE IN ARGENTINE PRICES (IN $US)
day before to day after t-stat day before to
week after t-stat
EQUAL WEIGHTED PORTFOLIOSADRs (ARG) 2.93 41.78 13.92 44.50NON-ADRs 0.70 22.32 9.43 42.75
2.23 43.80 4.50 19.95
VALUE WEIGHTED PORTFOLIOSADRs (ARG) 1.68 25.99 21.47 63.22NON-ADRs 0.29 8.13 16.22 54.14
1.39 25.91 5.25 19.31
II. PERCENT CHANGE IN NEW YORK PRICE (IN $US)
EQUAL WEIGHTED PORTFOLIOSADRs (NY) 1.21 19.57 -1.27 -0.82
0.51 10.56 -10.70 -38.41
VALUE WEIGHTED PORTFOLIOSADRs (NY) 0.39 8.33 1.15 5.14
0.10 2.68 -14.59 -44.40
Difference Between ADRs (ARG) and Non-ADRs (ARG)
Difference Between ADRs (ARG) and Non-ADRs (ARG)
Difference Between ADRs (NY) and Non-ADRs (ARG)
Note: T-stats are tests that the return on ADR and non-ADR portfolios on the day after and the week after the imposition of the Corralito differ significantly from the mean daily and weekly ADR and non-ADR porfolio returns in the pre-Corralito period. "Day before to day after" is the return between 12/3/2001 and 11/30/2001; "Day before to week after" is the return between 12/7/2001 and 11/30/2001. Tests assume that the distribution of returns in the ADR and non-ADR portfolios did not change after the imposition of the Corralito .
Difference Between ADRs (NY) and Non-ADRs (ARG)
Source: Economatica
30

Table 4: Average ADR Discounts Before and During the CorralitoPRE-CORRALITO
Jan 1, 2000 - Nov 30, 2001A. Excluding transactions costs mean max mean t-stat max mean t-statBBVA Banco Frances -0.02 52.09 20.43 7.96 21.89 7.00 9.73Cresud S.A.C.I.F. Y A. 0.01 32.35 21.47 2.91 22.61 3.27 2.28Financiero Galicia 0.35 43.89 20.04 6.90 18.42 3.66 3.69Irsa Inversiones 0.08 38.27 15.74 11.56 14.11 2.01 1.47Metrogas S.A. -0.81 27.03 10.94 1.65 19.63 -1.05 -0.12Perez Companc (PC) 0.08 53.14 19.56 7.00 23.36 6.36 9.53Siderca S.A.I.C 0.13 40.12 20.35 5.63 24.85 6.77 9.52Telecom Arg Stet-France 0.13 39.71 19.23 8.00 23.56 5.64 7.05Telefonica -0.59 23.52 13.95 8.09 17.39 -14.25 -3.68TGS 0.22 45.45 20.14 8.68 19.94 4.36 4.13YPF S.A. -0.08 31.79 15.96 4.87 24.72 8.14 7.30
PORTFOLIOS Equal-weighted 0.02 38.85 17.93 8.63 19.88 4.71 6.48 Value-weighted -0.02 37.30 17.27 9.84 20.49 5.91 22.18
B. Including transactions costsBBVA Banco Frances 2.48 54.35 23.50 8.48 27.55 14.13 18.51Cresud S.A.C.I.F. Y A. 3.43 35.26 24.70 3.00 26.38 7.20 2.75Financiero Galicia 3.37 47.83 24.70 7.71 30.09 15.86 17.73Irsa Inversiones 2.67 41.16 19.37 12.90 19.06 6.57 3.10Metrogas S.A. 2.92 30.28 14.57 1.66 24.50 5.69 1.49Perez Companc (PC) 2.79 54.71 21.97 7.14 26.45 9.78 11.38Siderca S.A.I.C 2.78 41.73 22.49 5.66 27.48 9.17 9.44Telecom Arg Stet-France 2.75 42.19 22.58 8.73 27.44 12.88 14.86Telefonica 1.67 26.01 16.72 8.49 20.41 -10.48 -3.41TGS 4.01 48.32 24.13 9.27 26.17 13.62 12.89YPF S.A. 2.13 33.47 18.08 4.97 27.31 10.64 7.66
PORTFOLIOS Equal-weighted 2.78 41.39 21.15 9.20 24.61 10.94 13.11 Value-weighted 2.51 39.28 19.87 10.71 23.62 9.61 24.44
Sources: Bloomberg and Economatica
Note: Mean ADR discounts (measured as the difference between the local price in US dollars and the ADR price, as a fraction of the local price in dollars) are calculated only on days when the security was traded in both markets. Local prices are adjusted for the ADR conversion ratio. T-stats are tests that the mean ADR discount during the Corallito differs significantly from the mean ADR discount in the pre-Corralito period. The test corrects for differences in sample size and unequal variances across the subperiods. Transaction costs are assumed to be the same in the pre- and post-Corralito periods.
CORRALITO POST-DEVALJan 11, 2002 - May 31, 2002
CORRALITO PRE-DEVALDec 3, 2001 - Jan 10, 2002
31
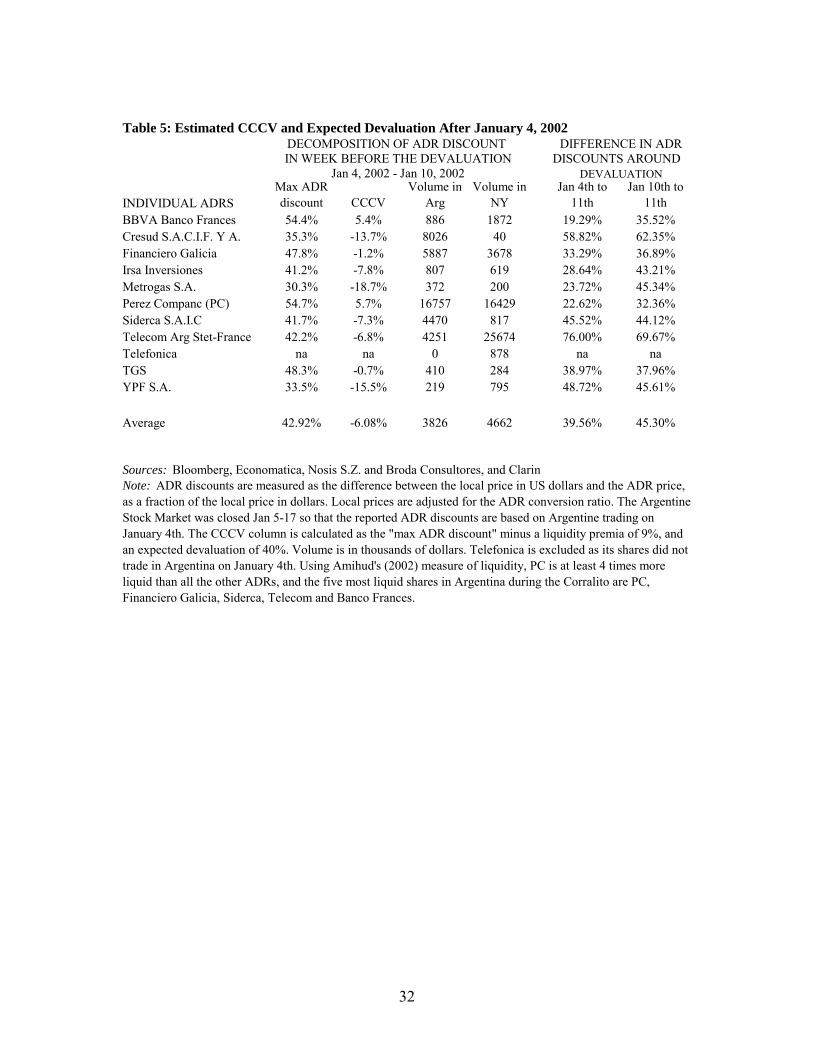
Table 5: Estimated CCCV and Expected Devaluation After January 4, 2002
INDIVIDUAL ADRSMax ADR discount CCCV
Volume in Arg
Volume in NY
Jan 4th to 11th
Jan 10th to 11th
BBVA Banco Frances 54.4% 5.4% 886 1872 19.29% 35.52%Cresud S.A.C.I.F. Y A. 35.3% -13.7% 8026 40 58.82% 62.35%Financiero Galicia 47.8% -1.2% 5887 3678 33.29% 36.89%Irsa Inversiones 41.2% -7.8% 807 619 28.64% 43.21%Metrogas S.A. 30.3% -18.7% 372 200 23.72% 45.34%Perez Companc (PC) 54.7% 5.7% 16757 16429 22.62% 32.36%Siderca S.A.I.C 41.7% -7.3% 4470 817 45.52% 44.12%Telecom Arg Stet-France 42.2% -6.8% 4251 25674 76.00% 69.67%Telefonica na na 0 878 na naTGS 48.3% -0.7% 410 284 38.97% 37.96%YPF S.A. 33.5% -15.5% 219 795 48.72% 45.61%
Average 42.92% -6.08% 3826 4662 39.56% 45.30%
Sources: Bloomberg, Economatica, Nosis S.Z. and Broda Consultores, and ClarinNote: ADR discounts are measured as the difference between the local price in US dollars and the ADR price, as a fraction of the local price in dollars. Local prices are adjusted for the ADR conversion ratio. The Argentine Stock Market was closed Jan 5-17 so that the reported ADR discounts are based on Argentine trading on January 4th. The CCCV column is calculated as the "max ADR discount" minus a liquidity premia of 9%, and an expected devaluation of 40%. Volume is in thousands of dollars. Telefonica is excluded as its shares did not trade in Argentina on January 4th. Using Amihud's (2002) measure of liquidity, PC is at least 4 times more liquid than all the other ADRs, and the five most liquid shares in Argentina during the Corralito are PC, Financiero Galicia, Siderca, Telecom and Banco Frances.
DECOMPOSITION OF ADR DISCOUNT
Jan 4, 2002 - Jan 10, 2002IN WEEK BEFORE THE DEVALUATION
DIFFERENCE IN ADR
DEVALUATIONDISCOUNTS AROUND
32

Independent VariableLocal Shares ADRs Local Shares ADRs
Local Market Portfolio 0.834** 0.736** 1.011** 0.157**(0.053) (0.050) (0.094) (0.046)
Global Market Portfolio 0.961** 0.992** 0.668* 0.651**(0.057) (0.053) (0.256) (0.174)
Exchange Rate Change 0.069 -0.011(0.097) (0.029)
Constant 0.000 0.000 -0.002 -0.004*(0.001) (0.001) (0.002) (0.002)
Number of Obs 477 483 104 124R-squared 0.45 0.47 0.81 0.2F-statistic 190.7 208.9 58.2 5.5DW statistic 2.11 1.89 1.89 1.88Partial R2 (local MP) 0.42 0.43 0.76 0.16Partial R2 (global MP) 0.16 0.23 0.01 0.09
Sources: Economatica and BloombergNote: Standard errors are in parenthesis. The global market portfolio is the MSCI world index and the local market portfolio is an orthgonalized value-weighted portfolio (in dollars) of all the stocks traded in Buenos Aires except those with an associated ADR. The dependent variable is the return in Argentina or the U.S. on a value-weighted portfolio of the 11 stocks with associated ADRs. The pre-Corralito period is 1/1/2000 to 11/30/2001 and the Corralito period is 12/3/2001 to 5/31/2002. ** denotes significance at the 1% level, and * denotes significance at the 5% level. The regressions over the Corralito period include dummy variables for days when the Argentinean market was closed. Partial R2 (market x) corresponds to the R2 when we exclude the other market index in the regression (in the Corralito sample the Exchange Rate Change variable is also excluded).
Pre-Corralito Corralito
Table 6 Explaining ADR portfolio returns in Argentina and the U.S. using a Global Market Portfolio and an Argentine (Non-ADR) Local Market Portfolio over the Pre-Corralito and Corralito Periods
33

Local Shares Local Market Portfolio Beta Global Market Portfolio Beta Both Market BetasF-statistic 12.931 3.440 3.796P-value 0.000 0.017 0.005
ADRsF-statistic 6.719 3.230 30.050P-value 0.001 0.040 0.000
Table 7 Chow Breakpoint Test for local and global market portfolio beta stability after the imposition of the Corralito
Note: The dependent variable is the return (in dollars) in Argentina (Local Shares) or in the U.S. (ADRs) on a value-weighted portfolio of the 11 stocks with associated ADRs. The global market portfolio is the MSCI world index and the local market portfolio is an orthagonalized value-weighted portfolio (in dollars) of all the stocks traded in Buenos Aires except those with an associated ADR. The full sample is 1/1/2000 to 5/30/2002 and the breakpoint is 11/30/2001.
34

Figure 1 Capital Control Intensity and ADR discounts
-0.2
-0.1
0
0.1
0.2
0.3
0.4
0.5
0.6
0.7
0.8
-3 -2.5 -2 -1.5 -1 -0.5 0 0.5 1 1.5
Chinn-Ito measure of capital control intensity
Abs
olut
e va
lue
of th
e A
DR
dis
coun
ts in
per
cent
Colombia
India
BrazilThailand
South Korea
PhilippinesMexico
GreeceSpain
Australia
Sweden
Venezuela
UK
Indonesia
ChileBelgium
Sources: Bloomberg, Chinn-Ito (2002) Note: Scatter plot summarizes the relationship between capital control intensity (as measured by Chinn and Ito) and average ADR discount for a representative firm (based on liquidity) in selected countries in 1999. Figure 2 Price Indices of ADR and non-ADR Portfolios, Value Weighted (Value at the time of the imposition of Corralito, November 30, 2001=100)
50
100
150
200
250
300
Jan-01 Jan-01 Mar-01 Apr-01 May-01 May-01 Jun-01 Jul-01 Aug-01 Sep-01 Oct-01 Nov-01 Dec-01 Jan-02 Feb-02 Mar-02 Apr-02 May-02
ADR Portfolio
Non-ADR PortfolioCorralito=100
Source: Bloomberg Note: The non-ADR portfolio includes all non-cross-listed local shares.
35

Figure 3 Volume Traded in Local Shares with ADRs and Perez Companc (PC) as a Fraction of Total Volume Traded (in all Shares) in Buenos Aires (monthly, in %)
0%
10%
20%
30%
40%
50%
60%
70%
80%
90%
Jan-01
Feb-01
Mar-01
Apr-01
May-01
Jun-01Jul-0
1
Aug-01
Sep-01
Oct-01
Nov-01
Dec-01
Jan-02
Feb-02
Mar-02
Apr-02
May-02
Jun-02Jul-0
2
Aug-02
Sep-02
Oct-02
Nov-02
Dec-02
ADRs
PC
Corralito imposed
Source: Bolsar
36

Figure 4 Daily PC (Perez Companc) prices in NY and Argentina and PC’s ADR Discount Before and During the Corralito
0.3
0.5
0.7
0.9
1.1
1.3
1.5
1.7
1.9
2.1
Jan-01 Feb-01 Mar-01 Apr-01 May-01 Jun-01 Jul-01 Aug-01 Sep-01 Oct-01 Nov-01 Dec-01 Jan-02 Feb-02 Mar-02 Apr-02 May-02
Dollar Price in Argentina
Dollar Price in New York
Corralito begins
Devaluation
-10%
0%
10%
20%
30%
40%
50%
60%
Jan-01 Feb-01 Mar-01 May-01 Jun-01 Aug-01 Sep-01 Oct-01 Dec-01 Jan-02 Mar-02 Apr-02
Upper Arbritrage Bound
Lower Arbritrage Bound
PC ADR Discount
Source: Bloomberg Note: Arbitrage bounds are calculated based on the derivations described in Appendix 2.
37

Figure 5 Daily Siderca prices in NY and Argentina and Siderca’s ADR Discount Before and During the Corralito
1
1.2
1.4
1.6
1.8
2
2.2
2.4
2.6
2.8
3
Jan-01 Feb-01 Mar-01 Apr-01 May-01 Jun-01 Jul-01 Aug-01 Sep-01 Oct-01 Nov-01 Dec-01 Jan-02 Feb-02 Mar-02 Apr-02 May-02
Corralito begins
Devaluation
Dollar Price inArgentina
Dollar price in New York
-10%
0%
10%
20%
30%
40%
50%
Jan-01 Feb-01 Mar-01 May-01 Jun-01 Aug-01 Sep-01 Oct-01 Dec-01 Jan-02 Mar-02 Apr-02
Upper Arbritrage Bound
Lower Arbritrage Bound
Siderca ADR Discount
Source: Bloomberg Note: Arbitrage bounds are calculated based on the derivations described in Appendix 2.
38

Figure 6 Decomposition of Perez Companc’s ADR discount
-10
0
10
20
30
40
50
60
Dec-01 Jan-02 Feb-02 Mar-02 Apr-02 May-02
Perez Companc ADR discount inclusive of transactions costs
Liquidity premium
Expected Devaluation ( NDF premia and media reports)
CCCV (Premium associated with the circumvention of capital controls)
"Leak" in the financial press of a 40% devaluation
Sources: Bloomberg, Nosis S.A., Broda Consultores and Clarin Note: Observations are based on weekly moving averages.
39
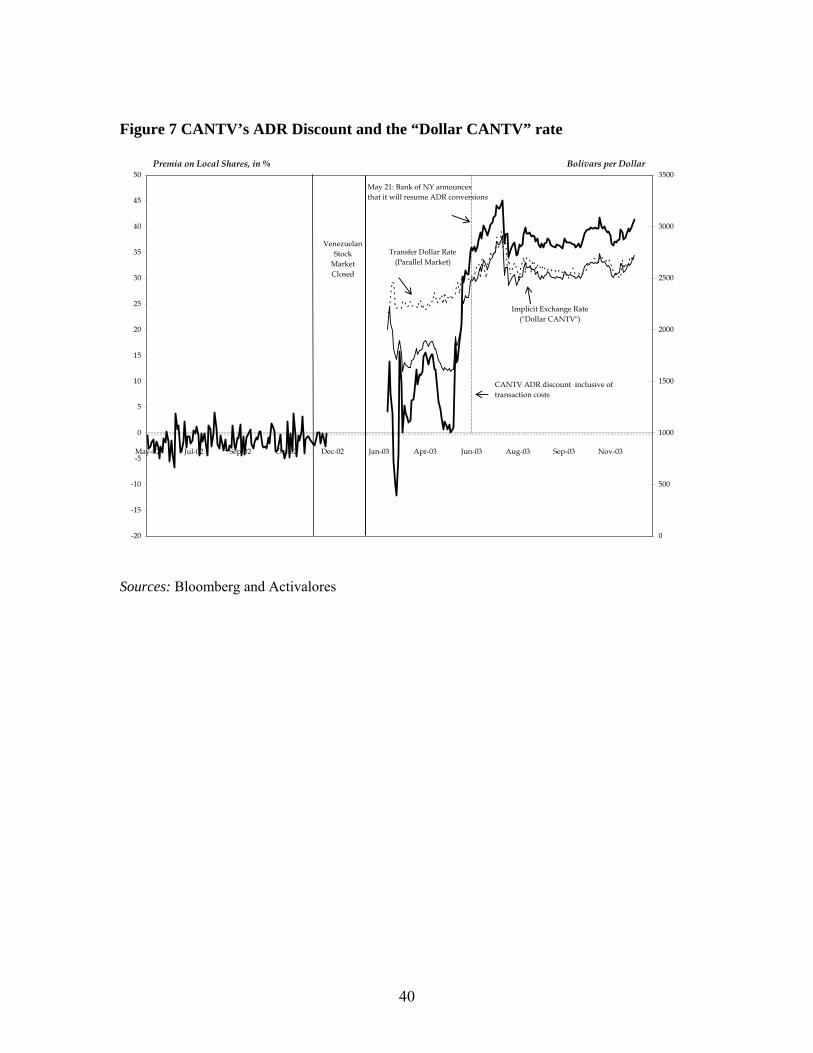
Figure 7 CANTV’s ADR Discount and the “Dollar CANTV” rate
-20
-15
-10
-5
0
5
10
15
20
25
30
35
40
45
50
May-02 Jul-02 Sep-02 Oct-02 Dec-02 Jan-03 Apr-03 Jun-03 Aug-03 Sep-03 Nov-03
0
500
1000
1500
2000
2500
3000
3500
VenezuelanStock
MarketClosed
Premia on Local Shares, in % Bolivars per Dollar
Transfer Dollar Rate(Parallel Market)
Implicit Exchange Rate("Dollar CANTV")
CANTV ADR discount inclusive oftransaction costs
May 21: Bank of NY announces that it will resume ADR conversions
Sources: Bloomberg and Activalores
40

Appendix 1 Argentina’s Financial Market Event Time Line
October 28, 2001 Minister Cavallo starts negotiations with the IMF and the U.S. Treasury to purchase collateral for new Argentine bonds to be issued in an exchange for the nearly $100 billion of local and external debt.
October 29, 2001
Mr. Cavallo defines the debt exchange operation as voluntary. The old debt would exchange for bonds paying seven percent per year and be guaranteed by tax revenues. The IMF and U.S. Treasury require compliance with a zero deficit and an agreement with the provinces on tax revenue sharing before any kind of financial support is given.
November 19, 2001
The IMF announces it will not make any new disbursements without being satisfied that Argentina has secured the goals previously designated.
November 30, 2001
End of a debt swap with local banks and pension funds for more that 55 billion (over a total public debt of 160 billions).
December 2, 2001
The government announces temporary capital control regime (termed Corralito) involving bank withdrawal limits and limits on dollar transfers abroad as a last-ditch effort to fend off a devaluation and prevent a major banking crisis. Withdrawals are limited to 250 pesos (dollars) per week per account. Depositors, however, may still access funds for larger purchases through checks or debit cards and transfer their money among banks. Holders of deposits may also exchange them for federal bonds (BODENs) maturing in 2005, 2007 or 2012 in a Canje exchange. No limits are placed on domestic payments made with checks, credits, debit cards and electronic MEP (Metodo Electronico de Pagos) payments.
December 3, 2001
The capital control measures announced on Dec 2nd come into full effect through Decree 1570-01 on Dec 3rd: a) Wire transfers suspended except with prior Central Bank approval. b) Cash withdrawals from the Banking System limited to US$ 1000 per month. c) Financial Argentine institutions prohibited from foreign currency futures transactions. d) Financial Argentine institutions prohibited from issuing new bank loans denominated in Argentine Pesos. All new loans must be issued in U.S. dollars and existing peso loans must be converted to U.S. dollar loans at a one to one rate. e) Foreign investors trading in the Argentine Securities Market subject to repatriation restrictions. Funds related to securities transactions must remain in the country until government approval is obtained or the measure is officially revoked.
December 19, 2001 Mr. Cavallo and all other ministers resign.
December 20, 2001 President Dela Rua resigns and Mr. Ramon Puerta becomes interim president. Country Risk reaches 4618 points. Global (sovereign) bond yields reach their historical maximum of 49% annual return in dollars.
December 21, 2001 The official Foreign Exchange Rate market is closed.
41
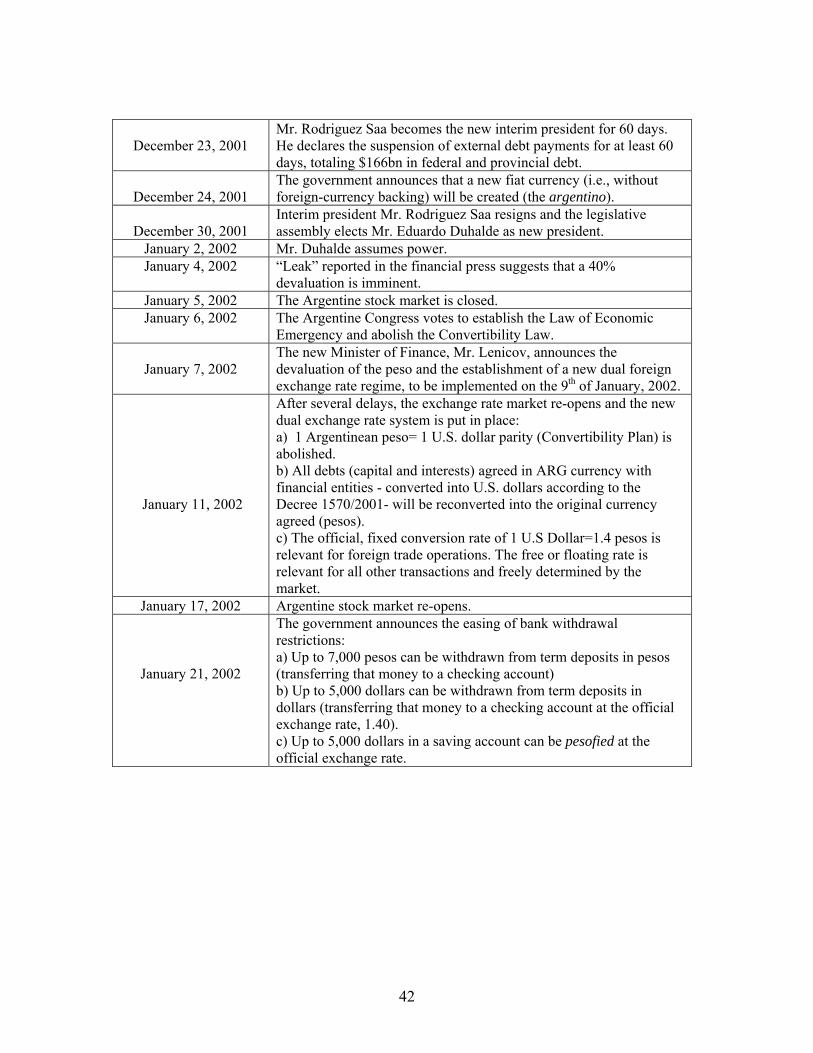
December 23, 2001
Mr. Rodriguez Saa becomes the new interim president for 60 days. He declares the suspension of external debt payments for at least 60 days, totaling $166bn in federal and provincial debt.
December 24, 2001
The government announces that a new fiat currency (i.e., without foreign-currency backing) will be created (the argentino).
December 30, 2001
Interim president Mr. Rodriguez Saa resigns and the legislative assembly elects Mr. Eduardo Duhalde as new president.
January 2, 2002 Mr. Duhalde assumes power. January 4, 2002 “Leak” reported in the financial press suggests that a 40%
devaluation is imminent. January 5, 2002 The Argentine stock market is closed. January 6, 2002 The Argentine Congress votes to establish the Law of Economic
Emergency and abolish the Convertibility Law.
January 7, 2002
The new Minister of Finance, Mr. Lenicov, announces the devaluation of the peso and the establishment of a new dual foreign exchange rate regime, to be implemented on the 9th of January, 2002.
January 11, 2002
After several delays, the exchange rate market re-opens and the new dual exchange rate system is put in place: a) 1 Argentinean peso= 1 U.S. dollar parity (Convertibility Plan) is abolished. b) All debts (capital and interests) agreed in ARG currency with financial entities - converted into U.S. dollars according to the Decree 1570/2001- will be reconverted into the original currency agreed (pesos). c) The official, fixed conversion rate of 1 U.S Dollar=1.4 pesos is relevant for foreign trade operations. The free or floating rate is relevant for all other transactions and freely determined by the market.
January 17, 2002 Argentine stock market re-opens.
January 21, 2002
The government announces the easing of bank withdrawal restrictions: a) Up to 7,000 pesos can be withdrawn from term deposits in pesos (transferring that money to a checking account) b) Up to 5,000 dollars can be withdrawn from term deposits in dollars (transferring that money to a checking account at the official exchange rate, 1.40). c) Up to 5,000 dollars in a saving account can be pesofied at the official exchange rate.
42

February 3, 2002
Mr. Lenicov announces an asymmetric pesofication and the end of the dual exchange rate regime: a) pesofication of all dollar deposits at 1.4 pesos per dollar. b) corporate and consumer debts are also pesofied, but at the exchange rate prevailing during the Convertibility period. Both deposits and credit will be indexed to inflation. c) the end of the dual exchange rate regime and a unified floating exchange rate determined by market forces. d) the right to withdraw wage and pension income from the corralito without any amount restrictions (before workers could only extract up to 1.500 pesos). Corralon starts which freezes bank term deposits (holders of term deposits had the option to convert them into CEDROs or BODENs maturing in 2007 or 2012 in a Canje exchange).
February 4, 2002 The official foreign exchange market is closed.
February 11, 2002
The BCRA establishes a new unified free foreign exchange market, which replaces the two markets - official and free - implemented in January. The exchange rate market re-opens and the floating dollar exchange rate reaches 2.1 pesos, well below the devaluation expectations built-into asset prices.
March 26, 2002
The Central Bank announces new measures related to foreign exchange transactions and ADR/CEDEAR conversions aimed at improving the functioning of the foreign currency market and regulating the buying and selling of foreign currency by order and for the account of the Central Bank. The press communication also mentions that there will be coordination between the Comision Nacional de Valores (CNV) and the Bolsa de Comercio de Buenos Aires (BCBA) in order to adopt new measures to regulate capital outflows via ADR and CEDEAR transactions.
September, 2002
The central bank passed a very restrictive regulation (circular #3723) that mandated that every stock be traded in its underlying currency. After intense opposition from the financial community, the central bank rescinded #3723 and instead passed a resolution (circular #3727) that forbids “contra cable” operations. These operations allowed brokers to sell stocks purchased in Buenos Aires instantaneously in New York (or any foreign market) using the Mercado de Valores as a clearinghouse. Under #3727 it was still possible for investors in Argentina to convert CEDEARs and sell them in New York, but this new restriction significantly increased the transactions costs to do so.
December 2, 2002 Corralito rescinded. Sources: Ambito Financiero, La Nacion and Clarin (various issues) and Pictet.
43

Appendix 2: Transactions costs and computation of arbitrage bounds
Appendix Table A1 shows transaction cost ranges that reflect amounts that were charged
to both small and large Argentine investors during the Corralito. The standard length of time
required for an ADR conversion was nine days.55 Large investors, institutional investors, and
bankers faced substantially lower costs than smaller investors, and could also complete the ADR
conversion in a shorter period of time.56
[Appendix Table A1 here]
Taking into account these various transactions costs and defining n0 as the minimum time
required to sell an ADR in New York, the expected return (at period t) in U.S. dollars of
converting local share i into its corresponding ADR is:57
(A1) 3 5 4 1 2
1 2
[ (1- )(1- )] - - [ (1 ) ] [ (1 ) ]
ADR Lt it n i it t
Li it t
E p p Sp S
τ τ τ ξ τ τξ τ τ
+ + ++ +
where n≥n0, 1 2(1 )Li itpξ τ τ+ + is the local currency the investor needs to buy iξ local shares to
obtain one ADR corresponding to stock i, and 3 5[ (1- )(1- )]ADRt it nE p τ τ+ is the dollar amount that
the local investor expects to obtain after selling the ADR in the U.S. at time t+n after taxes and
expenses. Local investors typically face a broker’s fee, τ1, and a transactions fee, τ2. A second
broker’s fee, τ3, is incurred when the asset is sold in the United States. We also include a fixed fee
in dollars, τ4, that the investor must pay to transform the local shares into an ADR. Finally, the
cost of opening a bank account in the United States is τ5. Note that the investor does not have to
physically obtain dollars to carry out this operation (the return is simply expressed in dollar units)
so the investor does not pay a fee for obtaining foreign exchange.
If the local investor were to instead to use the dollar amount 1 2[ (1 )Li it t ]p Sξ τ τ+ + to
buy local share i and sell it in the local market in period t+n for the expected (net of taxes) price,
her expected return at time t will be:
55 Information from brokers in suggests that the time to conversion varied considerably across type of investor and across time. We use contemporaneous prices and exchange rates as a benchmark in computing arbitrage returns, which can be interpreted as the minimum cost investors would incur for ADR conversion. 56 The costs reported in the table are based on phone interviews with portfolio managers and investors in Buenos Aires and on information published on the websites of various Argentine brokerages advertising the ADR-conversion process. 57 Here we are assuming the conversion fee is paid in dollars in the U.S. once the operation is complete, and the amount is withdrawn from the investor’s banking account.
44

(A2) L
1 2 1 2
1 2
(1- - ) (1 ) (1 )
Lt i it n t n i it t
Li it t
E p S p Sp S
ξ τ τ ξ τ τξ τ τ
+ + − + ++ +
where 1 2 (1 )Li it tp Sξ τ τ+ + is the amount, expressed in dollars, the investor needs in order to buy
enough shares of the local stock i to reach the equivalent of one ADR, and L
1 2 (1- - )t i it n t nE pξ τ τ+ S +
+
is the amount of money she receives for selling the shares after n
periods. The returns are calculated net of the broker’s fee and the local transactions fee.
For the investor to be willing to convert shares to ADRs, it must be the case that :
(A3) L3 5 4 1 2[ (1- )(1- )] - [ (1- - ) ] 0ADR
t it n t i it n t nE p E p Sτ τ τ ξ τ τ+ +− ≥
U.S. investor
The trade-off facing a US investor is different from that of an Argentine investor because
of the asymmetries in fees, taxes and institutional regulations in the two markets. The expected
return to holding ADR i for n periods is:
(A4) -
ADR ADRt it n it
ADRit
E p pp+
U.S. investors do not face a broker’s fee or a stock market transactions fee.58
The return to converting the ADR to local shares, and repatriating the earnings is given
by:
(A5) L
1 2 6 (1- - )(1 )
ADRt i it n t n it
ADRit
E p S pp
ξ τ τ τ+ +− −.
When selling the shares in the local market, we assume that the U.S. investor incurs charges in
using a local broker and must pay the stock market transactions fee. Since we assume that he
would like to return the profits from the sale back to the U.S., he incurs an additional tax ( 6τ ) for
transferring the funds.
A risk-neutral investor will cancel an ADR when:
(A6) L1 2 6 (1- - )(1 ) 0ADR
t i it n t n itE p S pξ τ τ τ+ +− − ≥
58 It is not strictly true that U.S. investors face zero transactions costs. However, our empirical analysis focuses on the arbitrage conducted by Argentine investors during the Corralito, so we abstract from the relatively small U.S. transaction costs for simplicity.
45

This suggests that if local prices (expressed in dollars) exceed the ADR price investors should
buy ADRs, convert them back to local shares and sell them in the local market.
Arbitrage bounds
The trade-offs faced by local and U.S. investors yield arbitrage bounds for capital inflow into and
outflow from the local market. Equation (A6) can be re-written to show the bound facing a local
investor who is contemplating converting his local stocks i into their corresponding ADR:
(A7) 1 2 4
3 5 3 5
(1 ) 1(1 )(1 ) (1 )(1 )
ADR Lt it n t i it n t n
L Lt i it n t n t i it n t n
E p E p SE p S E p S
τ τ τ ξτ τ τ τ ξ ξ
+ + +
+ + + +
− − −+ − ≥
− − − −
Capital outflows to the U.S. will not occur if the transaction costs on the left-hand-side of (A7)
(which are a function of the local price and the exchange rate) exceed the returns to the
conversion. The Argentine data show that local prices moved well outside of the arbitrage bands
because of the value investors attached to being able to convert their frozen bank deposits into
dollars in overseas accounts.
Equation (A8) shows the corresponding arbitrage bound for capital inflows into the local
market. Transactions costs faced by a U.S. investor that exceed the returns of selling ADRs for
local shares will choke off capital inflows into the local market.
(A8) 1 2 6(1 )(1 ) 1L A
t i it n t n t it nL
t i it n t n
E p S E pE p S
ξτ τ τξ+ + +
+ +
−− − − − ≥
DR
If the ADR premia/discount lies between the bounds in (A7) and (A8) neither investor would
engage in arbitrage between the markets. Premia outside of the bounds should, in the absence of
capital controls, be arbitraged away.
46

Appendix Table A1 Transaction Cost Ranges for ADR Settlement Cycle Location
of Trade or Activity
Parameter
Description
Estimated Range of Values (percent of total value of stock
market transaction, except where noted)
τ1
The brokerage fee is not regulated in Argentina, but for market operations
larger than 10,000 pesos, the fee is in the range [0.25% , 1% ] of total settlement,
before Value Added Tax. During December most of the capital control- evading transactions were settled for
amounts larger than 10,000 pesos.
[0.3025, 1.21]
Buenos Aires Stock
Market τ2 Fee that the Buenos Aires stock exchange
market charges for every transaction. 0.1025
American Depositary
Bank
τ4
ADR issuance (conversion) fee charged by the broker. During this period, brokers charged big markups over the typical US$
0.04-0.05 conversion fees charged by depositary banks.
[0.10 dollar, 0.20 dollars]
τ3 Argentinean brokerage fee for selling the ADR in the U.S.
[0.3025, 1.21] NYSE Stock
Market τ5
Approximate cost of opening a banking account in the U.S. and wire transferring
the ADR proceeds to a U.S. bank.
1
Argentinean Bank
τ6
Approximate cost of transferring money from Argentina to the U.S.. During the
capital controls period these transactions were not allowed.
1
Note: The transaction costs ranges account for the wide dispersion of brokerage and conversion fees across size and institutional affiliation of investors, and across time. Large investors faced substantially lower costs than smaller ones, and could also complete the ADR conversion in a shorter period of time. Sources: All transaction cost information, in particular ADR conversion fees, were obtained from personal interviews in Buenos Aires and/or direct communication with brokers at InvertirOnline, ElAccionista, CapitalMarkets Argentina and ArgentineReserach and web-adversitements at portfoliopersonal.com.
47

Appendix 3 Argentine Exchange Rate Market Developments
FOREIGN EXCHANGE MARKET REGIMES IN ARGENTINADaily Exchange Rate in Pesos per Dollar: December 3rd 2001 - 31st of May 2002
(solid black line denotes period when official market was closed)
0
0.5
1
1.5
2
2.5
3
3.5
4
12/3/2001 12/18/2001 1/2/2002 1/17/2002 2/1/2002 2/16/2002 3/3/2002 3/18/2002 4/2/2002 4/17/2002 5/2/2002
Convertibility Plan (fixed, convertible
dollar parity)
Dual Exchange Rate Regime (fixed, nonconvertible official parity)
Unified and Floating Exchange Rate Regime
Market Rate
Official Rate
The Argentine foreign exchange rate market was closed (feriado cambiario) from the 21st of December until the 10th of January (inclusive). During this period the shadow (or parallel) market exchange rate quoted at around 1.5-1.6 pesos per dollar, well above the official parity of 1 peso per dollar prevailing before markets were closed. On January 4th the Minister of Finance announced the discontinuation of the currency board and on January 7th, the Minister of Finance announced the devaluation of the peso and a new exchange rate regime. The new exchange rate regime was a dual one, featuring an official, fixed non-convertible rate of 1.4 pesos per dollar (relevant for exporters and financial institutions) and a free or floating dollar, for all other operations and determined by supply and demand. This new dual regime came into full effect on Friday the 11th of January when the markets were re-opened. On January the 11th there were two different values for the free exchange rate: dollars purchased with cash at 1.7-1.8 “free pesos” per dollar, and a higher exchange rate for dollars purchased with checks from funds in the Corralito (1.9-2 “trapped pesos” per dollar). Exchange rate market operations were again suspended from the 4th of February to the 8thth of February, inclusive. On Sunday, February 3rd, the new Minister of Finance announced the end of the dual exchange rate regime and a unified floating exchange rate was put in place on Monday, February 11th. On the 11th, the floating exchange rate opened at 2.10 pesos per dollar.
48