Embed Size (px)
Citation preview
©2006, IARFC All rights of reproduction in any form reserved.
Journal of Personal Finance54
ABSTRACT
This research compares the risk-taking attitude and behavior between asample of 470 Chinese workers and a sample of 2,671 Americans from theSurvey of Consumer Finances. Findings show that the Chinese in thesample are more risk tolerant than Americans in their financial decisions,both in attitude and behavior. A result consistent with Weber andHsee’s (1998) cushion theory and their empirical findings. Alternativeexplanations such as a lack of knowledge about the relationshipbetween risk and return among the current generation of Chinese arealso explored. Theoretical and practical implications of this research arediscussed.
CROSS-CULTURAL DIFFERENCES IN RISK
TOLERANCE:A COMPARISON BETWEEN CHINESE AND
AMERICANS
Jessie X. Fan, Ph.D.University of Utah
Jing Jian Xiao, Ph.D.Take Charge America Professor and Director
Take Charge America Institute for Consumer FinancialEducation and Research
Introduction
Risk tolerance is important when people make financial decisions. Forexample, a worker may have to decide how to select several investmentoptions within a 401k plan. A more risk tolerant worker may choose an optionwith more stocks or stock mutual funds and a less risk tolerant worker maychoose an option with more cash, bonds, or a bond mutual fund.
Risk tolerance is an extremely complex phenomenon that is studiedby many disciplines such as economics, psychology, finance, and manage-ment science (Roszkowski, 1993). From a psychological perspective, risktolerance refers to people’s attitude and behavior regarding financial risk
Volume 5, Issue 3 55 R
esearch & Theory
(Roszkowski, 1993). It is an important concept when financial counseling andplanning professionals help individuals and families make long-term financialdecisions. It is also a key concept of the expected utility theory in economicliterature. This study uses the definition from the finance literature, in thatfinancial risk is measured by investment volatility.
Rick tolerance has been studied extensively by researchers ineconomics, business, and consumer science. For example, many researchershave used a subjective risk tolerance measure available in the Survey ofConsumer Finances (SCF) (Chang, DeVaney, & Chiremba, 2004; Grable &Lytton, 1998; Sung & Hanna, 1996; Xiao, Alhabeeb, Hong, & Haynes, 2001;Yao, Hanna, & Lindamood, 2004; Yao, Gutter, & Hanna, 2005; Yao & Hanna,2005). In addition, researchers have developed other risk tolerance scales toenrich the SCF measure (Grable, 2004; Grable & Lytton, 1999; Yang, 2004). TheJournal of Personal Finance devoted a special issue in 2004 to this topic. Inthis issue, risk tolerance was studied from various perspectives, such asbehavioral finance (Moreschi, 2004), myopic decisions (Finke & Huston,2004), value at risk scoring (Harris, 2004), and comparability of risk tolerancebetween husbands and wives (Roszkowski, Delaney, & Cordell, 2004).
This study will provide a unique, cultural perspective to examine risktolerance, as it compares risk-taking attitude and behavior between Chineseand Americans. Such an investigation has both theoretical and practicalimportance. Practically, the findings of this study can provide knowledgeabout similarities and differences in risk tolerance between Chinese andAmericans. Such knowledge may be useful to American entrepreneurs doingbusiness in China in an era of increasing economic globalization, and toAmerican businesses and professionals working with clients who have aChinese heritage. Theoretically, this research can help determine whether theexisting research results on risk tolerance, which are predominantly generatedusing U.S. data, are valid when data from another culture are used. If not, thendirections in future research, both theoretical and empirical, can be generatedfrom this study. In addition, the findings of this study can provide insights tothe further development of a theory of cultural comparison of risk tolerancebased on the literature of economics and social psychology.
Literature Review
Cultural Differences in Risk Tolerance
Douglas and Wildavsky (1982) distinguished between societieswhose cultural values, perceptions, and attitudes wereshaped by either amarket environment or a hierarchical bureaucratic environment. They arguedthat societies in which an individualistic market orientation predominates,such as in the United States, are appreciative of uncertainties as providing

©2006, IARFC All rights of reproduction in any form reserved.
Journal of Personal Finance56
opportunities and thus fostering more risk-taking. More hierarchical andbureaucratic societies, such as China, were described as making decisionsbased on standard operating procedures, and consequently, were morecautious and risk-averse.
Based on multiple psychological theories pertaining to temperament,Doyle (1999) theorized that financial risk tolerance is a result of temperament,and that temperament is related to the surviving values that are reflected bybiological and social backgrounds. By analyzing the broad literature inhistory, religion, law, psychology, anthropology, and other social sciences,Doyle divided the world cultures into four groups: drivers (most Europeans),amiables (most South Americans), expressives (most Africans), and analytics(most Asians). According to Doyle’s research, competence characterizes thetemperament of drivers (acquisitiveness, determination, and appreciation ofrisk), while analytics arecharacterized by security (caution, restraint, andaversion of risk).
Both these theories would predict that Chinese are more risk aversethan Americans in making decisions under uncertainty. Additionally, empiricalstudies on risk-taking attitude using U.S. data have consistently found apositive relationship between economic resources (e.g. income, net worth,etc.) and risk tolerance level (Sung & Hanna, 1996; Grable & Lytton, 1998). Ifsuch a relationship holds cross-nationally, then Chinese are expected to beless risk tolerant than Americans, because on average, Chinese have a lowerlevel of economic resources than Americans.
However, several empirical studies using samples of both Chineseand Americans found the opposite. In a study comparing Chinese andAmerican college students’ attitudes toward free markets, two questions wereasked about risk-taking attitudes in job markets and investments (Fan, Xiao, &Xu, 1998). American students were more likely to report being willing to takerisks in job markets but Chinese students were more likely to report beingwilling to take risks in financial investments. In another study on the differ-ences in saving motives between Chinese and Americans, Xiao and Fan (2002)found that Chinese workers in their sample were more likely than Americans toreport a motive of saving for investment, suggesting that Chinese may bemore risk tolerant in financial investment decisions than Americans.
Using buying prices for risky financial options as a measurement forrisk preference, Weber and Hsee (1998) found that Chinese students in theirsample were significantly more risk tolerant in their pricing than Americanstudents. However, these apparent differences in risk preference wereassociated primarily with cultural differences in the perception of risk of thefinancial options rather than with cultural differences in attitude towardsperceived risk. Weber and Hsee (1998) then proposed a “cushion hypoth-esis”, which suggests people in a collectivist society, such as China, are morelikely to receive financial help from their social networks if they are in need.

Volume 5, Issue 3 57 Planning Strategies
Consequently, they are less risk averse in financial decisions than those in anindividualistic society such as the U.S. This hypothesis also suggests thatbecause social and family networking is so important in a collectivist society,Chinese are likely to be more risk averse in social decisions.
Two subsequent studies supported the cushion hypothesis. In thefirst study, Weber, Hsee, and Sokolowska (1998) conducted a content analysisof American, German, and Chinese proverbs related to risk and risk-taking.They found that Chinese and German proverbs provide more risk-seekingadvice than American proverbs. They also found that, regardless of nationalorigin of proverbs, Chinese raters perceived proverbs to advocate greater risk-seeking than American raters, but only for financial risks, not social risks. Inthe second study, Hsee and Weber (1999) reported two experiments. In thefirst experiment, they asked a sample of Chinese and American students tochoose sets of sure versus risky options. An example of a sure option is to“receive $400 for sure”; and an example of a risky option is to “flip a coin;receive $2000 if heads or $0 if tails”. They found that the Chinese weresignificantly more risk tolerant than the Americans. In the second experiment,they extended their questions to include a medical and an academic decision,in addition to an investment decision, and found that the Chinese were morerisk tolerant than the Americans only in the investment domain, but not in theother domains.
In summary, three theories have been utilized in this study: Douglasand Wildavsky’s (1982) theory on hierarchical vs. bureaucratic societies,Doyle’s (1999) theory on cultural groups (drivers, amiables, expressives, andanalytics) and their temperament, and Weber and Hsee’s (1998) “cushionhypothesis”. The first two would suggest that the Chinese are less risktolerant than Americans in all matters, including financial risks, while the thirdwould suggest that the Chinese are more risk tolerant than Americans infinancial matters, but less risk tolerant in social matters.
The empirical evidence to date regarding cultural differences in risktolerance between Chinese and Americans suggests that Chinese are morerisk tolerant in financial decision-making than Americans. However, thisevidence is far from conclusive. First, most empirical studies reviewed aboveused college student samples from large cities. Given the variability ofknowledge, beliefs, customs, and habits within any culture, it is an oversimpli-fication to describe the difference found in these samples as a differencebetween Chinese and Americans in general. This study, expands upon existingresearch by using a non-student sample to compare risk preference betweenChinese and Americans. Second, the empirical studies reviewed above onlyused risk attitude as a measure of risk preference. This study, includes anadditional measure of self-reported risk-taking behavior. Although therelationship between attitude and behavior has been examined in previousstudies, this relationship has not been tested in a cross-cultural context. This

©2006, IARFC All rights of reproduction in any form reserved.
Journal of Personal Finance58
study, expands upon existing research by investigating whether Chinese aremore risk tolerant in their self-reported financial behavior than Americans.
Factors Associated with Risk Tolerance
Another aspect of this research is to investigate factors associatedwith financial risk-taking attitude and behavior, and how such factors maywork differently for the Chinese and the Americans. While there is a substan-tial body of literature on how socio-economic characteristics affect risktolerance using U.S. data, such analysis, to date, is not available usingChinese data.
Previous studies indicate that the following factors affect consumerrisk-taking attitudes or behavior: gender, marital status, age, education,income, having children, professional occupation, self-employment, and homeownership (Grable & Lytton, 1998; Jianakoplos & Bernasek, 1998; Roszkowski,1993; Schooley & Worden, 1996; Sung & Hanna, 1996; Xiao, 1996; Xiao,Alhabeeb, Haynes, & Hong, 2001; Xiao & Anderson, 1997; Yao & Hanna,2005; Zhong & Xiao, 1995) a detailed summary table is available from theauthors. All the empirical results reported in previous studies are based ondata from various years of the Survey of Consumer Finances (SCF). For themeasurement of risk-taking attitudes, the question available in the SCF asksrespondents about their choice regarding the expected financial returns andrisks they are willing to take for such returns. For the measurement of risk-taking behavior, household holdings of stock and other risky assets arecommonly used. While it is important to note that risk tolerance is a complexconstruct and has been conceptualized and measured in many different waysin the literature (see Hanna, Gutter, & Fan, 2002 for a thorough discussion onthis subject), for this study, the SCF measure was the best among availablealternatives.
Hypotheses
The purpose of this study is to (1) use a non-student sample tocompare risk-taking attitudes and behavior between Chinese and Americans;and (2) to investigate country differences in factors associated with risk-taking attitude and behavior. The research seeks to further the understandinof the concept of risk tolerance in general, and the cultural differencesbetween Chinese and Americans in particular.
In light of the available evidence in the literature, the followinghypotheses are proposed regarding country differences in risk tolerancebetween Chinese and Americans:

Volume 5, Issue 3 59 Planning Strategies
H1: Chinese are more risk tolerant than Americans in financial risk-taking attitude.
H2: Chinese are more risk tolerant in their behavior than Americanswhen stock ownership is used as a measure of financial risk-taking behavior.
H3: There is no difference between Chinese and Americans in howsocio-demographic characteristics affect their financial risk-taking attitude.
H4: There is no difference between Chinese and Americans in howsocio-demographic characteristics affect their financial risk-taking behavior.
Hypothesis 1 is proposed based on the available evidence in theliterature reviewed in the previous section. If this hypothesis is supported,then the empirical evidence would be consistent with Weber and Hsee’scushion hypothesis (1998) while rejecting Douglas and Wildavsky’s (1982)theory on hierarchical vs. bureaucratic societies and Doyle’s (1999) theory oncultural groups and their temperaments. Hypothesis 2 is based on theassumption that attitude and behavior should be consistent. Hypotheses 3and 4 are null hypotheses because there is no existing literature suggestingotherwise.
Method
Data
The Chinese data were collected in 1998 from workers in Guangzhou,a major city and capital of Guangdong province in Southern China. A quotamatrix of gender, age, and enterprise ownership was developed for this survey.Enterprises were classified into five categories: (1) state-owned, (2) collec-tively-owned enterprises that include various forms of publicly-tradedenterprises and traditional collectively-owned enterprises; (3) foreign-ownedenterprises that are invested by foreign capital, especially capital fromdeveloped countries and regions such as the U. S., Japan, Hong Kong, andTaiwan; (4) joint-ventures that are invested by both Chinese and foreigncapital; and (5) privately-owned enterprises owned by one or more privateChinese citizens. Based on this quota matrix, trained research assistantscollected information from workers with specific characteristics. Among the500 workers who participated in the survey, 50% were from each of the twogender groups, 20% from each of the five age groups (29 years or younger, 30-39, 40-49, 50-59, 60 years or older), and 20% from each of the five types ofenterprises. For this study, observations were excluded that had missingvalues in the variables needed in the multivariate analyses. Thus, the final

©2006, IARFC All rights of reproduction in any form reserved.
Journal of Personal Finance60
sample size used in this study is 470. Compared to nationally representativestatistics, the Guangzhou sample over-represents workers from foreign-, joint-,and private-owned companies and those with higher educational levels (ChinaStatistical Information Network, 2001). As these characteristics may relate torisk tolerance, caution is exercised in interpreting the findings presented inlater sections.
The American data were collected in 1998 by the National OpinionResearch Center at the University of Chicago and sponsored by the U. S.Federal Reserve Board. This data set is one of the triennial surveys(Kennickell, Starr-McCluer, & Surette, 2000). The original data set had 4,309observations. To make the sample comparable with the Chinese data, only fulltime workers who were not in the farming, forestry or fishing industries at thesurvey time were selected. The final sample size used in this study is 2,671.
For the purpose of comparing risk tolerance between Chinese andAmericans, the data sets used in this study have both advantages andlimitations. The two data sets include variables that are directly comparablesince the Chinese questionnaire has questions regarding saving attitude andbehavior similar to those in the U.S. Survey of Consumer Finances. The twosurveys also were conducted at about the same time. However, the Chinesedata were obtained using a quota sampling approach in one Chinese city,while the U.S. data were collected using a random sampling approach nation-wide. Nevertheless, because of the uniqueness of this topic, these are thebest data available at this time. As an acknowledged exploratory study, it willlay a foundation for future research that uses more comparable data.
Dependent and Independent Variables
The two dependent variables examined are risk-taking attitude andrisk-taking behavior. Risk-taking attitude is measured by a categorical variablewith four levels: (1) take substantial financial risks expecting to earn substan-tial returns; (2) take above average financial risks expecting to earn aboveaverage returns; (3) take average financial risks expecting to earn averagereturns; and (4) not willing to take any financial risks. Risk-taking behavior ismeasured by stock ownership. This variable has two attributes: owning stockor not. This variable is a very crude measure of financial risk-taking behavior.Because it is dichotomous, it cannot capture the quantitative differences instock ownership. Also, it is a self-report measure that may or may not beconsistent with actual behavior. Such limitations need to be kept in mind whenthe results are interpreted.
Independent variables include gender, age, marital status, education,relative income, household size, presence of children, occupation, andhomeownership status. Because risk-taking attitude is relevant to an indi-vidual instead of a household, the individual level measures were used for the

Volume 5, Issue 3 61 R
esearch & Theory
demographic variables of gender and marital status. On the other hand, stockownership is likely to be a household instead of individual decision. Whilemost of the variables used are those of the reference person, a householdlevel measure of family type with three categories: single female headed,single male headed, and married was used. In addition, the risk-taking attitudeis included in the stock ownership model.
The descriptive statistics of these variables are presented in Table 1.Compared to Americans, the Chinese in the sample were more likely to bemarried, have a lower educational level, and have a larger household size. Theincome variable was coded as a categorical variable indicating incomepercentiles because only bracket monthly income information was collectedfor the Chinese data. This income measure can be considered as a measure ofrelative income within each country.

Journal of Personal Finance62
©2006, IARFC All rights of reproduction in any form reserved.
Table 1Descriptive Statistics of the Samples by Country
Chinese (%) American (%) X2
Gender and marital status 56.41*** Married family 83.0 66.2 Single male headed 10.0 14.7 Single female headed 7.0 19.1Age 55.48*** 35 years or younger 20.9 19.4 36-45 32.8 46.0 46-55 24.9 24.0 56-65 21.5 10.6Education Grade 1-9 21.7 4.5 189.63*** Grade 10-12 21.5 34.8 Occup. sch./some coll. 20.4 22.5 College 36.4 38.2Household size 238.72*** 1 person 2.6 18.6 2 persons 6.8 28.4 3 persons 32.3 19.9 4 to 5 persons 48,3 28.8 6 persons or more 10.0 4.3Presence of children 76.4 55.7 70.65***Professional occupations 54.0 65.1 21.01***Self employed 3.2 13.0 37.61***Homeowner 46.6 66.1 65.62***Income rank a Bottom 30% <2.5k yuan <$32k Lower middle 25% 2.5k-3.5k yuan $32k-$63k Upper middle 20% 3.5k-4.5k yuan $63k-$130k Top 25% >4.5k yuan >$130kSubstantial risk/return 8.9 6.4 14.21***Above average risk/return 19.8 23.6Below average risk/return 36.8 41.8No risk 34.5 28.2Own Stock 24.5 21.2 2.46
* p<.10, ** p<.05, *** p<.01.a. For the Chinese sample, income is measured as monthly income in Chineseyuan. For the American sample, income is measured as annual income in U.S.dollars. The exchange rate of Chinese yuan for US dollar was about 8 to 1 in1998, the year both surveys were conducted.

Volume 5, Issue 3 63 R
esearch & Theory
Analyses
Chi-square tests were first conducted to test if there were associa-tions between risk-taking attitude and the country variable, and betweenstock ownership and the country variable. Logistic regressions were thenperformed to test if the differences still existed when demographic variableswere controlled. For the risk-taking attitude models, unordered multinomiallogistic regression was used because there are four levels of risk-takingattitude, and because the assumption of proportional odds was rejected.Binomial logistic regression was used for the stock ownership models as thereare only two attributes for this dependent variable.
Two sets of logistic regression models were estimated for eachdependent variable: (1) using the Chinese sample only; and (2) using theAmerican sample only. These two models were estimated to investigatewhether demographic variables affected the risk-taking attitude and stockownership differently for Chinese and for Americans. Log-likelihood ratiotests (Maddala, 1992) were conducted to test the overall statistical signifi-cance between Chinese and Americans by estimating the same model usingthe pooled sample without any country dummy or interaction terms (restrictedmodel) and using the pooled sample with a country dummy and interactionterms between the country dummy and all other independent variables (fullmodel)1. Simulations were then conducted to predict the probabilities ofhaving each of the four levels of risk attitude and the probability of stockownership for the sample, holding other things equal. In the simulations, theChinese households in the sample were treated as if they were Americanhouseholds, and their probabilities of having each of these four levels of risk-taking attitude and owning stock were predicted using the logistic regressionresults. These predicted probabilities were then compared with the actualprobabilities for the Chinese sample. The comparison was done on the samegroup of people (in this case, the Chinese sample) with whom differentnationalities were attached for the purpose of simulation (Fan, 1997; Xiao &Fan, 2002). Note that the simulation could also be conducted using theAmerican sample instead.
Results
Table 1 shows that for the risk-taking attitude variable, more Chinesein the sample were at the two extreme ends than Americans. While 8.9% of theChinese are willing to take substantial financial risks expecting to earn

Journal of Personal Finance64
©2006, IARFC All rights of reproduction in any form reserved.
substantial returns, only 6.4% Americans are willing to do so. And while34.5% Chinese are not willing to take any financial risks, only 28.2% ofAmericans are in this category. Americans are more likely to be willing to takeeither above average or average financial risks (23.6% and 41.8%, respec-tively) compared to their Chinese counterpart (19.8% and 36.8%, respectively).For both countries, the mode category is “average risk”. The Chi-square teststatistic shows that this country difference is statistically significant. On theother hand, country difference in stock ownership is not statistically signifi-cant at conventional levels. While 24.5% of the Chinese in the sample ownstocks, only 21.2% of Americans do.
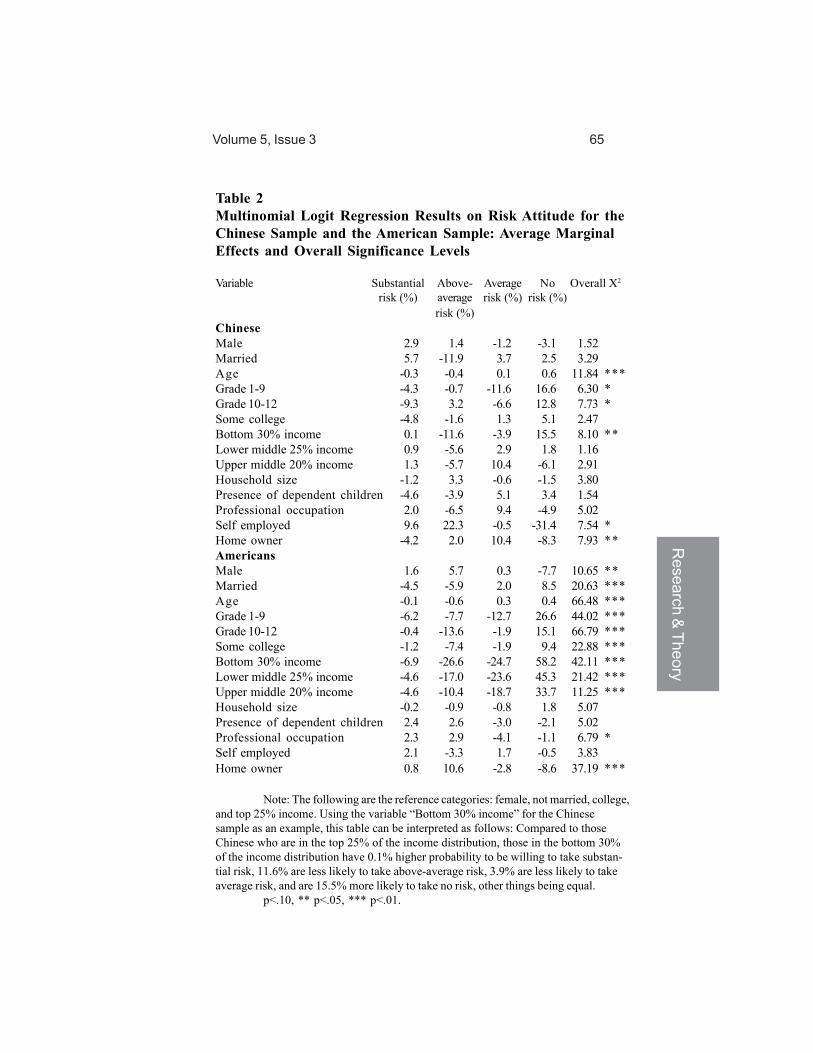
Table 2 presents results from the Logistic regression analysis withrisk-taking attitude as the dependent variable, for the Chinese sample and theAmerican sample, respectively. For ease of interpretation, average marginaleffects are presented in the table, together with their statistical significancelevels.
Volume 5, Issue 3 65 R
esearch & Theory
Table 2Multinomial Logit Regression Results on Risk Attitude for theChinese Sample and the American Sample: Average MarginalEffects and Overall Significance Levels
Variable Substantial Above- Average No Overall X2
risk (%) average risk (%) risk (%)risk (%)
ChineseMale 2.9 1.4 -1.2 -3.1 1.52Married 5.7 -11.9 3.7 2.5 3.29Age -0.3 -0.4 0.1 0.6 11.84 ***Grade 1-9 -4.3 -0.7 -11.6 16.6 6.30 *Grade 10-12 -9.3 3.2 -6.6 12.8 7.73 *Some college -4.8 -1.6 1.3 5.1 2.47Bottom 30% income 0.1 -11.6 -3.9 15.5 8.10 **Lower middle 25% income 0.9 -5.6 2.9 1.8 1.16Upper middle 20% income 1.3 -5.7 10.4 -6.1 2.91Household size -1.2 3.3 -0.6 -1.5 3.80Presence of dependent children -4.6 -3.9 5.1 3.4 1.54Professional occupation 2.0 -6.5 9.4 -4.9 5.02Self employed 9.6 22.3 -0.5 -31.4 7.54 *Home owner -4.2 2.0 10.4 -8.3 7.93 **AmericansMale 1.6 5.7 0.3 -7.7 10.65 **Married -4.5 -5.9 2.0 8.5 20.63 ***Age -0.1 -0.6 0.3 0.4 66.48 ***Grade 1-9 -6.2 -7.7 -12.7 26.6 44.02 ***Grade 10-12 -0.4 -13.6 -1.9 15.1 66.79 ***Some college -1.2 -7.4 -1.9 9.4 22.88 ***Bottom 30% income -6.9 -26.6 -24.7 58.2 42.11 ***Lower middle 25% income -4.6 -17.0 -23.6 45.3 21.42 ***Upper middle 20% income -4.6 -10.4 -18.7 33.7 11.25 ***Household size -0.2 -0.9 -0.8 1.8 5.07Presence of dependent children 2.4 2.6 -3.0 -2.1 5.02Professional occupation 2.3 2.9 -4.1 -1.1 6.79 *Self employed 2.1 -3.3 1.7 -0.5 3.83Home owner 0.8 10.6 -2.8 -8.6 37.19 ***
Note: The following are the reference categories: female, not married, college,and top 25% income. Using the variable “Bottom 30% income” for the Chinesesample as an example, this table can be interpreted as follows: Compared to thoseChinese who are in the top 25% of the income distribution, those in the bottom 30%of the income distribution have 0.1% higher probability to be willing to take substan-tial risk, 11.6% are less likely to take above-average risk, 3.9% are less likely to takeaverage risk, and are 15.5% more likely to take no risk, other things being equal.
p<.10, ** p<.05, *** p<.01.

Journal of Personal Finance66
©2006, IARFC All rights of reproduction in any form reserved.
Table 3 presents results from the Logistic regression analysis withstock ownership as the dependent variable. Again, average marginal effectsare presented, together with their statistical significance levels. As with therisk-taking attitude regression, two sets of results are reported, one with theChinese sample only and the other with the American sample only. Finally, theLog-likelihood ratio test results and simulation results, which are based onmodels using both samples (not shown, but available upon request), arereported in Table 4.
Table 3Logistic Results on Stock Ownership: Coefficients and AverageMarginal Effects
Chinese Sample American SampleVariable Marginal X2 Marginal X2
effects (%) effects (%)Substantial risk tolerance 8.9 1.59 25.0 49.11 ***Above-average risk tolerance 12.7 5.12 ** 21.7 60.02 ***Average risk tolerance 1.6 0.11 10.3 16.12 ***Single male headed household -1.3 0.02 -1.5 0.26Single female headed household -22.6 3.66 * 0.3 0.01Age -0.3 2.29 0.2 5.08 **Grade 1-9 -22.7 8.12 *** -27.2 8.51 ***Grade 10-12 -5.9 1.18 -8.5 13.27 ***Some college -2.5 0.26 -0.3 0.02Bottom 30% income -4.4 0.60 -28.4 56.25 ***Lower middle 25% income -5.8 1.02 -22.4 48.02 ***Upper middle 20% income -2.8 0.23 -17.1 31.06 ***Household size 1.8 0.86 -0.3 0.11Presence of dependent children -1.4 0.03 -1.6 0.41Professional occupation 0.9 6.04 3.4 2.51Self employed -5.7 0.27 -2.9 1.45Home owner -0.8 0.04 8.5 13.93 ***
Note: The following are the reference categories: not willing totake any risk, married, college, and top 25% income. Using the variable“substantial risk tolerance” for the American sample as an example, this tablecan be interpreted as follows: Compared to those Americans who are notwilling to take any risk, those who are willing to take substantial risks are 25%more likely to own stocks, other things being equal.
* p<.10, ** p<.05, *** p<.01.

Volume 5, Issue 3 67 R
esearch & Theory
Table 4Simulation Results on Risk Attitude and Stock Ownership
Chinese actual (%) Simulated (%)Log likelihood RatioTestSubstantial risk 8.9 5.1 93.34 ***Above-average risk 19.8 20.8Below-average risk 36.8 39.6No risk 34.5 34.5
Stock Ownership 24.5 21.6 57.10***
Note: The numbers in this table can be interpreted as follows: 24.5%of the Chinese in the sample report owning stocks. If these Chinese wereAmericans with the same set of characteristics, 21.6% of them would havereported owning stocks.
p<.10, ** p<.05, *** p<.01.
Risk-Taking Attitude
The findings support Hypothesis 1, in that Americans are less likelythan Chinese to report a risk-seeking attitude. About 8.9% of Chinese in thesample reportedly are willing to take substantial risk. The simulation resultssuggest that if these Chinese were Americans, only 5.1% of them would bewilling to take substantial risk (Table 4). On the other hand, holding demo-graphics and relative income equal, Chinese are less likely than Americans tobe willing to take average risk expecting average returns. The probabilities ofbeing willing to take above-average risk and to take no risk are about the samefor these two samples. This country difference is statistically significant at99% confidence level.
Rejecting Hypothesis 3, the results in Table 2 show that moredemographic variables are significant in explaining the differences in risk-taking attitude among Americans than among Chinese. Out of 14 independentvariables, 11 are significant at the 10% or better level for the American model,but only 6 are significant at the 10% or better level for the Chinese model. Chi-square tests indicate that the impacts of education, relative income, occupa-tion, and homeownership on risk-taking attitudes are statistically differentbetween the Chinese and Americans (test statistics not shown but availablefrom the authors upon request).

Journal of Personal Finance68
©2006, IARFC All rights of reproduction in any form reserved.
Stock Ownership
Results support Hypothesis 2 as the Chinese are more likely thanAmericans to own stocks. Approximately 24.5% of Chinese in the samplereported as owning stocks. The simulation results show that if these Chinesewere Americans, a smaller percentage, 21.6% would own stocks (Table 4). Thelog likelihood test shows that this difference is statistically significant at the99% confidence level.
Rejecting Hypothesis 4, the results in Table 3 show that moredemographic variables are significant in explaining the differences in stockownership among Americans than among Chinese. Out of 17 independentvariables, 10 are significant at the 10% or better level for the American model,but only 3 are significant at the 10% or better level for the Chinese model. Theeffects of risk-taking attitude, family type, age, education, income, andhomeownership on stock ownership are statistically different between theChinese and Americans (test statistics not shown but available from theauthors upon request).
Discussion
The discussion of these results must be prefaced with one importantcaveat. Readers are reminded that the Guangzhou sample is not representa-tive of the Chinese population, because Guangdong province, of whichGuangzhou is the capital city, is the first Special Economic Development Areain China. As such, the economic system is more westernized and the standardof living of households is higher than most other areas of China (ChineseStatistical Information Network, 2001, Table 10-11). In addition, the Guangzhousample over-sampled workers from foreign-, jointly-, and privately-ownedenterprises and under-sampled workers from state-owned enterprises. Thissample also has higher educational levels, and relatively more young people(age 0-14) live in Guangdong compared to the national average. In 1998, thechildren dependence ratio (number of people aged 0-14 to number of peopleaged 15-64) in Guangdong was 45, compared to the national average of 35(Chinese Statistical Information Network, 2001, Table 4-7).
Keeping this sampling limitation in mind, on average, Chinese in thissample were more risk tolerant than Americans, both in their risk-takingattitude and behavior, holding demographics and relative income constant.Especially interesting is that the percentage of people who were willing to takesubstantial risk expecting substantial return is higher among the Chinese thanamong Americans. This result holds in spite of the fact that Americans havemore economic resources than Chinese. This result is contradictory topredictions from Douglas and Wildavsky (1982) that Chinese may be morecautious and risk averse than Americans because hierarchical and bureau-

Volume 5, Issue 3 69 R
esearch & Theory
cratic societies lead people to make decisions by standard operating proce-dures. This result is also contradictory to predictions from Doyle’s theory thatmost Asians are analytics who emphasize security, which leads to caution,restraint, and risk-avoidance in their financial behavior (Doyle, 1999). Thisimplies that the application of the concept “temperaments” may be overlysimplified in Doyle’s division of culture. The concept in this context needs tobe studied further.
The findings, however, are consistent with the empirical evidencepresented by Weber and his colleagues (Hsee & Weber, 1999; Weber & Hsee,1998; Weber, Hsee, & Sokolowska, 1998). The fact that more demographicvariables are significant predictors of risk taking in the American sample thanin the Chinese sample offers further evidence for the cushion hypothesis. ForChinese investors, perhaps it is the size of their social network that predictsrisk taking and individual characteristics, such as income, are less important,because the risk is not carried entirely by the individual but partly by thenetwork. This suggests including other group level or network level “demo-graphics” in future analyses.
Because this study used a non-student sample, a different measureof risk-taking attitude, and a measure of risk behavior, it adds validity andgeneralizability to the findings by Weber and her colleagues. Although thisstudy is not a direct test of Weber and Hsee’s (1998) cushion hypothesis,these results certainly are consistent with predictions generated from thecushion hypothesis.
The finding that Chinese are more risk tolerant than Americans infinancial decisions has some anecdotal support from the gambling literature.Gambling, a behavior exhibiting high risk tolerance, is quite popular in China,even though the government is very much anti-gambling (Nepstad, 2000). Inthe U.S., casinos in Las Vegas advertise heavily in the largest U.S.-basedChinese language newspaper “World Journal” to lure Asian Americancustomers. A number of Internet sites related to gambling addictions haveAsian and/or Chinese specific information, with titles such as “ProblemGambling and the Asian Canadian Communities” (Addictions Foundation ofManitoba, 2001), “Prevalence of Gambling in Toronto’s Chinese Community”(The Wager, 1998), and “Chinese Community Problem Gambling Project”(NICOS, 2001). It is well documented that the first generation of Chineseimmigrants to the U.S. often started their own small businesses such asrestaurants and laundromats (Barringer, Gardner, & Levin, 1993). While onereason for such a choice could be limited opportunities and limited humancapital, it is also possible that these Chinese immigrants were quite financiallyrisk tolerant and thus were willing to be self-employed.
Although the findings that Chinese in this sample are more risktolerant than Americans are consistent with previous empirical studies andthe cushion hypothesis, alternative explanations cannot be ruled out given

Journal of Personal Finance70
©2006, IARFC All rights of reproduction in any form reserved.
the limitations of this and previous studies on this topic. First, as Weber andHsee (1998) found, Chinese students in their sample perceived lower financialrisk compared to American students. The cushion hypothesis leads to theargument that such perception of lower financial risk is justified because ofthe family financial support network. An alternative explanation is limitedknowledge about the relationship between risk and financial returns amongthe current generation of Chinese due to a lack of financial education andlimited exposure to financial markets. Compared to the U.S. stock market, theChinese stock market is relatively new. When a market is not mature, potentiallarge stock market returns are possible due to insider trading or governmentpolicy changes. For example, stock purchases and trading were first availableonly in a limited number of Chinese cities so that the demand was initiallysuppressed. Buyers in these markets may expect stock prices to increase oncethe rationing period is over. Also, because the history of the stock market isrelatively short, people may not have enough historical performance informa-tion to get a whole picture of the relationship between risk and return. Inaddition, limited choices in other investment opportunities may be anotherreason why Chinese are more likely to own stocks because although govern-ment bonds have been issued since the early 1980s, corporate bonds are stillnot common.
Additionally, it should be noted that the samples used in the studiesby Weber and Hsee (from Shanghai, which is the largest city in China) and inthis study are not representative of the Chinese general population. As notedearlier, Guangzhou is not a representative city of China, and this sample wasnot a representative sample of Guangzhou. The self selection of living inGuangzhou (migration was possible even in the earlier years of the Chineseeconomic reform because of Guangzhou’s Special Economic DevelopmentZone status) and the self selection of working in non-state-owned enterprises,which was over-sampled, may contribute to the differences between Chineseand Americans in this study. To further investigate this issue, weights werecreated for the Chinese sample so that the sample distribution of educationlevels mirrored that of the population of Chinese workers. While the descrip-tive numbers changed, in that the overall risk tolerance level decreased andthe percentage of stock holders decreased, the multivariate results and thesimulation results still showed that the Chinese are more risk tolerant andmore likely to hold stocks than Americans, holding demographics and relativeincome constant (results not shown but available from the authors uponrequest). While this additional analysis does not eliminate biases caused byself-selection in migration, it makes the sample somewhat more representative.Yet, in order for the findings to be conclusive, research based on representa-tive samples is needed.
Finally, it is important to note the country differences in the relation-ship between income and risk tolerance. For the American sample, risk

Volume 5, Issue 3 71 R
esearch & Theory
tolerance level rises with income, and stock ownership rises with both incomeand risk tolerance level. However, for the Chinese sample, excluding people inthe bottom 30% of the income distribution, income does not seem to beassociated with risk tolerance, both in attitude and behavior. This might befurther evidence of the lack of knowledge about stock market performance andthe relationship between risk and return due to the novelty of the stock marketin China.
Conclusion and Implications
This research used a sample of Chinese workers from the city ofGuangzhou to compare their risk-taking attitude and behavior with a sample ofAmerican respondents from the Survey of Consumer Finances. Findingsrevealed that the Chinese in this sample were more risk tolerant than Ameri-cans in their financial decisions, both in attitude and behavior, a resultconsistent with Weber and Hsee’s (1998) cushion theory and their empiricalfindings. A lack of knowledge about the relationship between financial riskand return among the current generation of Chinese due to limited exposure tofinancial markets may also be an alternative explanation.
Findings have both theoretical and empirical implications. Theoreti-cally, the results show that while the concept of risk tolerance and its determi-nants are broadly applicable to the Chinese sample, the relationships betweensocio-economic characteristics and risk tolerance are different for the Chinesesample and the American sample. This finding suggests that the understand-ing of risk tolerance needs to be expanded if the concept is to have universalvalidity. Specifically, the concept of “cultural temperaments” needs to bestudied in more detail. Because these results are consistent with Weber andHsee’s cushion hypothesis suggests that there may be multiple dimensions ofrisk tolerance, such as social, financial, political, and physical. As a result, thestudy of cultural temperaments may need to incorporate these dimensions atthe theoretical level. Empirically, data on different types of risk tolerancesneeds to be collected to test hypotheses generated from this more compre-hensive approach.
In addition, it should be noted that the purpose of Doyle’s model isto explain the social meaning of money in general. Thus the model is ratherbroad. A more specific theory explaining the formation of risk toleranceutilizing recent advanced knowledge in psychology and other relevantdisciplines needs to be developed in future research. For example, prospecttheory (Kahneman & Tversky, 1979; Tversky & Kahneman, 1992) may be usedfor theory building. According to this theory, people use perceived decisionweights to evaluate risky situations. They are more likely to make mistakeswhen the probability of the event is extremely high or low. This theory andother theories in economics, psychology, sociology, anthropology, and other

Journal of Personal Finance72
©2006, IARFC All rights of reproduction in any form reserved.
relevant fields may be used to develop a more specific theory on the formationand cultural differences of risk tolerance.
Practically, these findings are useful for American entrepreneurs(including financial management businesses) conducting business in China,as well as for U.S. financial planners and counselors to understand thecultural differences when helping their clients with a Chinese cultural back-ground. Compared to Americans, the relationship between risk taking attitudeand behavior among the Chinese is less linear. This implies that financialplanners need to exert more cautions when risky products are recommendedeven when their Chinese clients’ attitudes seem to accept high risks.
The findings can also be useful to social workers who help addictedgamblers of Chinese background to understand the cultural context of theirbehavior and to develop special programs that take this cultural context intoconsideration. According to these findings, fewer variables are identified thataffect risk taking attitude and behavior in the Chinese sample as compared tothe American sample. That implies that when educational programs aredeveloped for Chinese clients, less differentiated treatments are needed.
Finally, the findings have implications for future empirical research.For these findings or findings from previous studies on this topic to begeneralized to the Chinese population, it is very important that future studiesuse more representative Chinese samples, especially samples that includeChinese living in smaller urban areas and rural areas.

Volume 5, Issue 3 73 R
esearch & Theory
References
Addictions Foundation of Manitoba (2005). Gambling in Asian communities:Final reports on the survey of key informants. Retrieved May 2, 2005from Addictions Foundation of Manitoba Web site: http://www.afm.mb.ca/mainhome_22.asp?contentID=161
Barringer, H. R., Gardner, R. W., & Levin, M. J. (1993), Asians and Pacific Islandersin the United States. New York: Russell Sage Foundation.
Chang, C., DeVaney, & Chiremba, S. (2004). Determinants of subjective andobjective risk tolerance. Journal of Personal Finance, 3(3), 53-57.
China Statistical Information Network. (2001). China statistics yearbook1999. Beijing: National Bureau of Statistics. Retrieved June 14, 2002from http://www.stats.gov.cn/yearbook/1999
Douglas, M., & Wildavsky, A. (1982). Risk and culture: An essay on theselection of technical and environmental dangers. Berkeley, CA:University of California Press.
Doyle, K. O. (1999). The social meanings of money and property: In search ofa talisman. Thousand Oaks, CA: Sage.
Fan, J. X. (1997). Expenditure patterns of Asian Americans: Evidence from theU.S. Consumer Expenditure Survey, 1980-1992. Family andConsumer Sciences Research Journal, 25(4), 339-368.
Fan, J. X., Xiao, J. J. & Xu, Y. (1998). Student attitudes toward free markets:China and the United States compared. In J. Zhang and X. Li (eds.).Social transition in China (pp189-212). Lanham, MD: UniversityPress of America.
Finke, M. S., & Huston, S. J. (2004). Risk and myopic financial decisions.Journal of Personal Finance, 3(3), 99-112.
Grable, J. E. & Lytton, R. H. (1998). Investor risk tolerance: Testing the efficacyof demographics as differentiating and classifying factors. FinancialCounseling and Planning, 9(1), 61-73.
Grable, J. E. (2004). Assessing financial risk-tolerance attitudes using semanticdifferential scales. Journal of Personal Finance, 3(3), 68-88.
Grable, J., & Lytton, R. H. (1999). Financial risk tolerance revisited: Thedevelopment of a risk assessment instrument. Financial ServicesReview, 8, 163-181.
Hanna, S., Gutter, M. G., & Fan, J. X. (2002). A measure of risk tolerance basedon economic theory. Financial Counseling and Planning,12(2), 55-60
Harris, J. (2004). Using value at risk to assess investment risk tolerance.Journal of Personal Finance, 3(3), 113-128.
Hsee, C. K., & Weber, E. U. (1999). Cross-national differences in riskpreference and lay predictions. Journal of Behavioral DecisionMaking, 12, 165-179.

Journal of Personal Finance74
©2006, IARFC All rights of reproduction in any form reserved.
Jianakoplos, N. A. & Bernasek, A. (1998). Are women more risk averse?Economic Inquiry, 36(4), 620-631.
Kahneman, D. & Tversky, A. (1979). Prospect theory: An analysis of decisionunder risk. Econometrica, 47(2), 263-291.
Kennickell, A. B., Starr-McCluer, M., & Surrette, B. J. (2000). Recent changesin U.S. family finances: Results from the 1998 Survey of ConsumerFinances. Federal Reserve Bulletin, 86, 1-17.
Maddala, G. S. (1992). Introduction to econometrics (2nd Ed.). New York:MacMillan.
Moreschi, R. W. (2004). Incorporating investor risk tolerance into the financialplanning process. Journal of Personal Finance, 3(3), 89-98.
Nepstad, P. (2000). Gambling history and tradition in China. The IlluminatedLantern, 1(2, April-May). Retrieved May 2, 2005 from http://www.illuminatedlantern.com/cinema/features/gambling.html
NICOS (2002). Chinese community problem gambling project. Retrieved May2, 2005 from NICOS website: http://www.nicoschc.com/ccpgp.html.
Roszkowski, M. J. (1993). Risk-tolerance in financial decisions. InFundamentals of financial planning (2nd ed.), edited by R. M.Crowe and C. E. Hughes (eds.). Bryn Mawr, PA: The AmericanCollege.
Roszkowski, M. J., Delaney, M. M., & Cordell, D. M. (2004). The comparabilityof husbands and wives on financial risk tolerance. Journal ofPersonal Finance, 3(3), 129-144.
Schooley, D. K. & Worden, D. D. (1996). Risk aversion measures: Comparingattitudes and asset allocation. Financial Services Review, 5(2), 87-99.
Sung, J., & Hanna, S. (1996). Factors related to risk tolerance. FinancialCounseling and Planning, 7, 11-20.
The Wager (June 23, 1998). Prevalence of gambling in Toronto’s Chinesecommunity. The Wager, 3(23). Retrieved May 2, 2005 from The BriefAddiction Science Information Source (BASIS) Website: http://www.basisonline.org/backissues/1998/vol3pdf/w325.pdf
Tversky, A. & Kahneman, D. (1992). Advances in prospect theory: Cumulativerepresentation of uncertainty. Journal of Risk and uncertainty, 5,297-323.
Weber, E. U, Hsee, C. K., & Sokolowska, J. (1998). What folklore tells us aboutrisk and risk taking: Cross-cultural comparisons of American, German,and Chinese proverbs. Organizational Behavior and HumanDecision Processes, 75(2), 170-186.
Weber, E. U., & Hsee, C. K. (1998), Cultural differences in risk perception, butcross-cultural similarities in attitudes towards perceived risk.Management Science, 44(9), 1205-1217.

Volume 5, Issue 3 75 R
esearch & Theory
Xiao, J. J. & Fan, J. X. (2002). A comparison of saving motives of urbanChinese and American workers. Family and Consumer ScienceResearch Journal, 30(4), 463-496.
Xiao, J. J. (1996). Effects of family income and life cycle stages on financialasset ownership. Financial Counseling and Planning, 7, 21-30.
Xiao, J. J., & Anderson, J. G. (1997). Hierarchical financial needs reflected byhousehold financial asset shares. Journal of Family and EconomicIssues, 18(4), 333-356.
Xiao, J. J., Alhabeeb, M. J., Hong, Gong-Soog., & Haynes, G. W. (2001).Attitudes toward risks and risk-taking behavior of business owningfamilies. Journal of Consumer Affairs, 35, 307-325.
Yang, Y. (2004). Characteristics of risk preferences: Revelations from Grable &Lytton’s 13-item questionnaire. Journal of Personal Finance, 3(3),20-40.
Yao, R., & Hanna, S. (2005). The effect of gender and marital status onfinancial risk tolerance. Journal of Personal Finance, 4(1), 66-85.
Yao, R., Gutter, M. S., & Hanna, D. S. (2005). The financial risk tolerance ofblacks, Hispanics and whites. Financial Counseling and Planning,16(1), 51-62.
Yao, R., Hanna, S. D., & Lindamood, S. (2004). Changes in financial risktolerance, 1983-2001. Financial Services Review, 13, 249-266.
Zhong, L. X., & Xiao, J. J. (1995). Determinants of family bond and stockholdings. Financial Counseling and Planning, 6, 107-114.
Endnotes
1. The estimates from the full model and the restricted model are not reportedin tables in this paper because these two models were estimated for the solepurpose of conducting the log-likelihood tests. The test results are reported inthis paper.
Contact Information: Jessie X. Fan, Ph.D., Associate Professor, University ofUtah 225 S 1400 E AEB 228, Salt Lake City, Utah 84112-0080; Phone: (801) 581-4170; Fax: (801) 581-5156; E-Mail: [email protected] Jian Xiao, Ph.D., Take Charge America Professor and Director, TakeCharge America Institute for Consumer Financial Education and Research,University of Arizona, P.O. Box 210033, Tucson, AZ 85721; Phone: (520) 621-5948; Fax: (520) 621-3209; E-Mail: [email protected]