Embed Size (px)
Citation preview

Cross-Modal Illusory Conjunctions Between Vision and Touch
Caterina CinelThe University of Birmingham and University of Essex
Glyn W. HumphreysThe University of Birmingham
Riccardo PoliUniversity of Essex
Cross-modal illusory conjunctions (ICs) happen when, under conditions of divided attention, felt texturesare reported as being seen or vice versa. Experiments provided evidence for these errors, demonstratedthat ICs are more frequent if tactile and visual stimuli are in the same hemispace, and showed that ICsstill occur under forced-choice conditions but do not occur when attention to the felt texture is increased.Cross-modal ICs were also found in a patient with parietal damage even with relatively long presenta-tions of visual stimuli. The data are consistent with there being cross-modal integration of sensoryinformation, with the modality of origin sometimes being misattributed when attention is constrained.The empirical conclusions from the experiments are supported by formal models.
There is increasing experimental evidence that perceptual pro-cessing within one modality can be influenced by stimuli presentedwithin another modality. For instance, studies of attentional cuingshow that cues presented in one modality (e.g., touch) can influ-ence the speed of responding to stimuli presented in a differentmodality (e.g., vision; Buchtel & Butter, 1988; Butter, Buchtel, &Santucci, 1989; Spence & Driver, 1997; Spence, Nicholls,Gillespie, & Driver, 1998; Spence, Pavani, & Driver, 2000). Theseeffects are found not only in normal observers but also (andperhaps more dramatically) with neuropsychological patients. Af-ter unilateral brain insult, patients can manifest extinction, inwhich they fail to detect a stimulus presented on the contralesionalside when another stimulus is presented simultaneously on theipsilesional side. Mattingley, Driver, Beschin, and Robertson(1997) reported that extinction could occur even when the con-tralesional stimulus was visual and the ipsilesional stimulus wastactile (and vice versa). In this case, detection in one modality isaffected by concurrent stimulation in another. There is also evi-dence that information can be linked across modalities to createnew perceptual experiences. In the phenomenon of synesthesia,
stimulation in one sensory modality can cause sensation in other,different modalities in such a way that, for example, a synesthetemight perceive color, shape, or flavor of someone’s voice (Cy-towic, 1989). In less extreme circumstances, visual informationconveyed by the lips can alter heard sounds, as in the McGurkeffect (McGurk & MacDonald, 1976). Phenomena such as thissuggest that not only can responses in one modality be affected byresponses in another modality but also that one’s conscious expe-rience can sometimes be based on transformations of one inputinto another modality. Further evidence of multimodal interactionis also provided by neurophysiological studies in which, at differ-ent levels of the central nervous system, the presence of multimo-dal neurons has been detected (e.g., Stein & Wallace, 1996, 1999).
In the present study, we demonstrate that transformations be-tween vision and touch can be observed in normal observers underlaboratory conditions. In the past, studies involving vision andtouch have tried to show, when information about one object isdiscrepant between two senses, whether people rely more on visionor touch (i.e., whether one sense dominates over the other). Overmany years of research, it has been found that perceptual domi-nance between vision and touch can depend on the nature of thetask that observers have to perform. For instance, when required tojudge object size, people seem to rely much more on vision thantouch (e.g., Rock & Victor, 1964). However, in tasks requiringtexture judgments (e.g., smoothness, roughness), people can relyequally on one or the other sense (Heller, 1982; Jones & O’Neil,1985; Lederman & Abbott, 1981), or touch can dominate overvision (Lederman, Thorne, & Jones, 1986). In a similar manner,Klatzky, Lederman, and Matula (1993) found that people, whenallowed to use vision and touch for judging object properties, usedtouch more frequently if required to make difficult judgmentsabout stimulus material and less frequently to judge geometricproperties.
In the present study, in which simultaneous perception of visualand tactile textures was involved, we studied whether illusory
Caterina Cinel, Behavioural and Brain Sciences Centre, School ofPsychology, The University of Birmingham, Edgbaston, United Kingdom,and Department of Psychology, University of Essex, Wivenhoe Park,Colchester, United Kingdom; Glyn W. Humphreys, Behavioural and BrainSciences Centre, School of Psychology, The University of Birmingham,Edgbaston, United Kingdom; Riccardo Poli, Department of ComputerScience, University of Essex, Wivenhoe Park, Colchester, UnitedKingdom.
This work was supported by a grant from the Medical Research Councilto Glyn W. Humphreys. We thank participant M.H. for very kindly takingpart. We also thank Bill Prinzmetal for his suggestions about our formalmodel and two anonymous reviewers for their helpful comments.
Correspondence concerning this article should be addressed to CaterinaCinel, Department of Psychology, University of Essex, Wivenhoe Park,Colchester CO4 3SQ, United Kingdom. E-mail: [email protected]
Journal of Experimental Psychology: Copyright 2002 by the American Psychological Association, Inc.Human Perception and Performance2002, Vol. 28, No. 5, 1243–1266
0096-1523/02/$5.00 DOI: 10.1037//0096-1523.28.5.1243
1243

conjunctions (ICs) could occur across modalities. Treisman andSchmidt (1982) conducted the first experimental study of ICswithin vision. They presented colored shapes flanked by numbers.Participants had to report the numbers and then the shapes andtheir colors. The authors found that reports sometimes reflectedmiscombinations (or ICs) of shape and color. Furthermore, theseICs occurred more frequently than would be expected from thelevel of feature errors, found when participants reported a shape ora color not actually present in the display (however, see Donk,1999, for an alternative view). Treisman and Schmidt suggestedthat different visual features may be coded independently by earlypreattentive vision, with the features being represented in separatespatial maps. Subsequently, the features are bound by attention totheir common location (Treisman, 1998; Treisman & Gelade,1980). Treisman has suggested that, to locate and bind the features,an “attention window moves within the location map and selectsfrom the feature maps whatever features are currently linked to theattended location” (Treisman, 1998, p. 1296). This provides thecentral assumption behind feature integration theory (FIT). How-ever, several studies have shown that at the preattentive stage ofvisual processing, spatial information can be available to constrainintegration. Cohen and Ivry (1989), in a study on ICs, have shownthat the more distant two stimuli are, the less frequent ICs are.Other studies have also shown effects of grouping on ICs. Prinz-metal (1981) found that ICs are more frequent between stimuli thatare grouped together than between stimuli that are not grouped,suggesting that object segmentation can take place even at preat-tentive stages of processing (see also Humphreys, Cinel, Wolfe,Olson, & Klempen, 2000).
One more open question concerns the nature of ICs and the levelat which ICs originate. According to FIT, ICs are perceptual innature, reflecting incorrect binding of features. However, it ispossible that ICs are due to memory failures. Participants mayencode features and bind them correctly, but this binding may berapidly lost in memory. Treisman and Schmidt (1982) have tried totest this possible alternative. In their Experiment I, they askedparticipants to report their level of confidence after each response,and at least on some occasions, ICs were reported with highconfidence as being perceptually experienced. On these occasions,ICs do not seem to stem from guesses made following the encod-ing of shapes and colors. In their Experiments II and III, Treismanand Schmidt gave the participants a matching task in which aprobe was presented either in advance (Experiment II) or in thestimulus display (Experiment III). The authors reasoned that ICsdue to memory failures should decrease under these circumstances.However, in both experiments, ICs were still observed to an equaldegree as before. Such results suggest that ICs can be perceptual inorigin, even if memory failures can also contribute. It is interestingthat there are also indications that ICs can occur at various levelsof stimulus representation. Virzi and Egeth (1984), for instance,presented participants with color names and adjectives in coloredink (e.g., the word BROWN in red ink and the word HEAVY ingreen ink). They found that participants sometimes made semanticillusions by reporting the word RED in green ink or the wordHEAVY in brown ink. Whether such errors are of the same kind asthose described by Treisman and Schmidt at lower perceptuallevels is still questionable.
To date, ICs have been demonstrated only between featurespresented within the same modality (typically in the visual modal-
ity, but also in audition; e.g., Hall, Pastore, Acker, & Huang,2000). Here, we assessed whether ICs could also be formed fromstimuli presented in different modalities. Such a result could beconsistent with the idea that, at a preattentive level, there is poolingof information from different modalities.
In Experiment 1, we report that there can be cross-modal ICs inwhich textures that are felt are reported as having been seen. InExperiment 2, we show that these cross-modal ICs can be morefrequent when tactile and visual stimuli are presented in the samehemispace than when they are presented in different hemispaces,consistent with a perceptual locus to the effect. In Experiment 3,we provide more evidence for a perceptual rather than a memorialaccount of ICs, using a forced-choice response procedure. InExperiment 4, we show that tactile ICs can be eliminated byrequiring participants to attend to and report the tactile texture(even though the memory load then increased). Cross-modal ICsare reduced by attention to the sensory stimulus. In Experiment 5,we present further confirmatory evidence for a perceptual locus forthe effect. We report data from a patient with parietal damage whoshowed significant numbers of cross-modal ICs, even with longstimulus exposure, but only in a condition stressing simultaneousperception of visual and tactile stimuli. Finally, in Experiment 6,we report the occurrence of the opposite class of cross-modal ICs(visual stimuli reported as tactile). This demonstrates that there isnothing intrinsic to one sensory modality that leads to cross-modalICs (e.g., tactile sensory information being less tied to its modal-ity). Cross-modal visual3tactile ICs were as frequent as cross-modal tactile3visual ICs, under similar presentation conditions.Taken together, the evidence is consistent with the idea thatinformation converges preattentively for binding from differentsensory modalities and that this binding process is modulated bythe parietal lobe.
Experiment 1
The purpose of Experiment 1 was to test for the presence of ICsbetween visual and tactile stimuli. The tactile stimuli were rigidbars whose surfaces had different kinds of texture. The visualstimuli were drawn from a set of three shapes and four textures(the same as the tactile stimuli, digitized through a video camera).Visual and tactile stimuli were briefly presented simultaneously.Participants had two tasks. First, they had to identify the orienta-tion of the tactile stimulus, and then they had to identify thetextures and the shapes of the two visual stimuli. Tactile3visualconjunction errors were made when the texture of the tactilestimulus was assigned to one of the two visual stimuli. These werecompared with texture feature errors, those made on trials inwhich participants reported the presence of a texture not present ineither vision or touch.
Method
Participants. A total of 16 students of The University of Birminghamwere tested. Their ages fell between 18 and 28 years. All participants hadnormal or corrected-to-normal vision and normal color vision.
Stimuli. The tactile stimuli consisted of four rectangular bars (about12 � 3 cm), each one having a different surface. The textures were chosenso that very different feelings were perceived by touching the bars, andeach texture could be easily recognized both by touch and vision. Fourkinds of textures were used, obtained by gluing carpet, a Lego brick,
1244 CINEL, HUMPHREYS, AND POLI
synthetic fur, and dried beans onto cardboard bars (the textures haddifferent colors). The visual stimuli had three possible shapes—either asquare (5.5 � 5.5 cm), a triangle (8 � 4 cm), or a circle (5.5-cmdiameter)—and four possible surfaces, the same as the tactile stimuli.
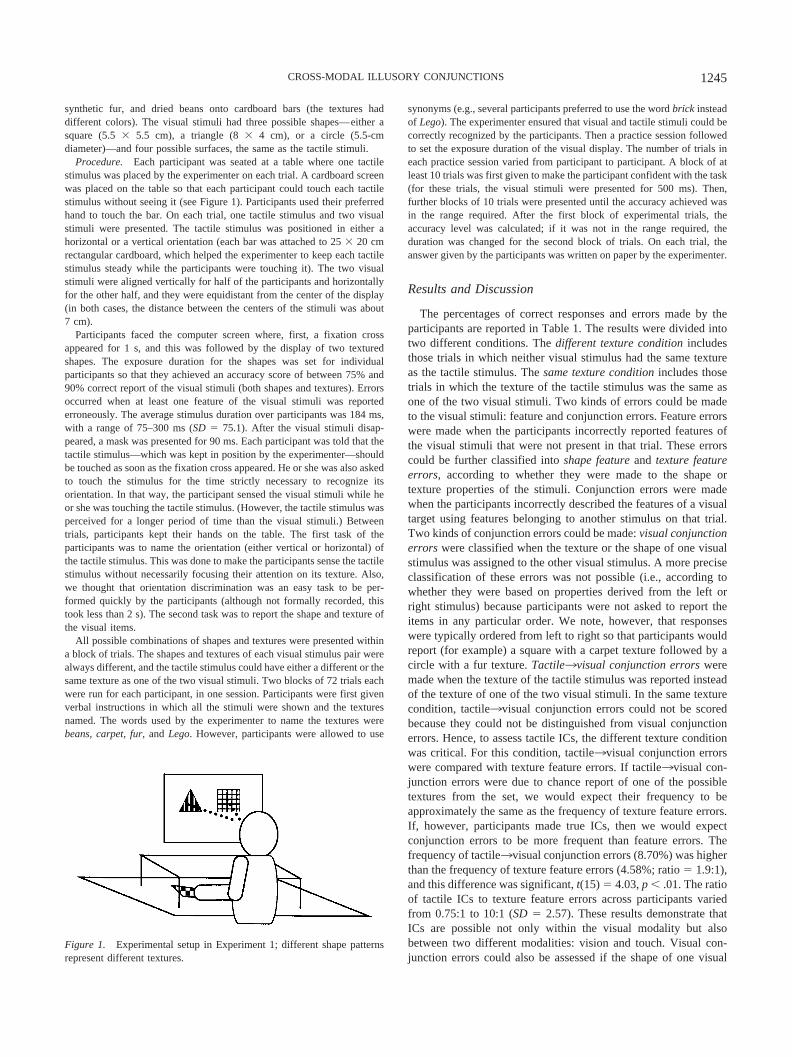
Procedure. Each participant was seated at a table where one tactilestimulus was placed by the experimenter on each trial. A cardboard screenwas placed on the table so that each participant could touch each tactilestimulus without seeing it (see Figure 1). Participants used their preferredhand to touch the bar. On each trial, one tactile stimulus and two visualstimuli were presented. The tactile stimulus was positioned in either ahorizontal or a vertical orientation (each bar was attached to 25 � 20 cmrectangular cardboard, which helped the experimenter to keep each tactilestimulus steady while the participants were touching it). The two visualstimuli were aligned vertically for half of the participants and horizontallyfor the other half, and they were equidistant from the center of the display(in both cases, the distance between the centers of the stimuli was about7 cm).
Participants faced the computer screen where, first, a fixation crossappeared for 1 s, and this was followed by the display of two texturedshapes. The exposure duration for the shapes was set for individualparticipants so that they achieved an accuracy score of between 75% and90% correct report of the visual stimuli (both shapes and textures). Errorsoccurred when at least one feature of the visual stimuli was reportederroneously. The average stimulus duration over participants was 184 ms,with a range of 75–300 ms (SD � 75.1). After the visual stimuli disap-peared, a mask was presented for 90 ms. Each participant was told that thetactile stimulus—which was kept in position by the experimenter—shouldbe touched as soon as the fixation cross appeared. He or she was also askedto touch the stimulus for the time strictly necessary to recognize itsorientation. In that way, the participant sensed the visual stimuli while heor she was touching the tactile stimulus. (However, the tactile stimulus wasperceived for a longer period of time than the visual stimuli.) Betweentrials, participants kept their hands on the table. The first task of theparticipants was to name the orientation (either vertical or horizontal) ofthe tactile stimulus. This was done to make the participants sense the tactilestimulus without necessarily focusing their attention on its texture. Also,we thought that orientation discrimination was an easy task to be per-formed quickly by the participants (although not formally recorded, thistook less than 2 s). The second task was to report the shape and texture ofthe visual items.
All possible combinations of shapes and textures were presented withina block of trials. The shapes and textures of each visual stimulus pair werealways different, and the tactile stimulus could have either a different or thesame texture as one of the two visual stimuli. Two blocks of 72 trials eachwere run for each participant, in one session. Participants were first givenverbal instructions in which all the stimuli were shown and the texturesnamed. The words used by the experimenter to name the textures werebeans, carpet, fur, and Lego. However, participants were allowed to use
synonyms (e.g., several participants preferred to use the word brick insteadof Lego). The experimenter ensured that visual and tactile stimuli could becorrectly recognized by the participants. Then a practice session followedto set the exposure duration of the visual display. The number of trials ineach practice session varied from participant to participant. A block of atleast 10 trials was first given to make the participant confident with the task(for these trials, the visual stimuli were presented for 500 ms). Then,further blocks of 10 trials were presented until the accuracy achieved wasin the range required. After the first block of experimental trials, theaccuracy level was calculated; if it was not in the range required, theduration was changed for the second block of trials. On each trial, theanswer given by the participants was written on paper by the experimenter.
Results and Discussion
The percentages of correct responses and errors made by theparticipants are reported in Table 1. The results were divided intotwo different conditions. The different texture condition includesthose trials in which neither visual stimulus had the same textureas the tactile stimulus. The same texture condition includes thosetrials in which the texture of the tactile stimulus was the same asone of the two visual stimuli. Two kinds of errors could be madeto the visual stimuli: feature and conjunction errors. Feature errorswere made when the participants incorrectly reported features ofthe visual stimuli that were not present in that trial. These errorscould be further classified into shape feature and texture featureerrors, according to whether they were made to the shape ortexture properties of the stimuli. Conjunction errors were madewhen the participants incorrectly described the features of a visualtarget using features belonging to another stimulus on that trial.Two kinds of conjunction errors could be made: visual conjunctionerrors were classified when the texture or the shape of one visualstimulus was assigned to the other visual stimulus. A more preciseclassification of these errors was not possible (i.e., according towhether they were based on properties derived from the left orright stimulus) because participants were not asked to report theitems in any particular order. We note, however, that responseswere typically ordered from left to right so that participants wouldreport (for example) a square with a carpet texture followed by acircle with a fur texture. Tactile3visual conjunction errors weremade when the texture of the tactile stimulus was reported insteadof the texture of one of the two visual stimuli. In the same texturecondition, tactile3visual conjunction errors could not be scoredbecause they could not be distinguished from visual conjunctionerrors. Hence, to assess tactile ICs, the different texture conditionwas critical. For this condition, tactile3visual conjunction errorswere compared with texture feature errors. If tactile3visual con-junction errors were due to chance report of one of the possibletextures from the set, we would expect their frequency to beapproximately the same as the frequency of texture feature errors.If, however, participants made true ICs, then we would expectconjunction errors to be more frequent than feature errors. Thefrequency of tactile3visual conjunction errors (8.70%) was higherthan the frequency of texture feature errors (4.58%; ratio � 1.9:1),and this difference was significant, t(15) � 4.03, p � .01. The ratioof tactile ICs to texture feature errors across participants variedfrom 0.75:1 to 10:1 (SD � 2.57). These results demonstrate thatICs are possible not only within the visual modality but alsobetween two different modalities: vision and touch. Visual con-junction errors could also be assessed if the shape of one visual
Figure 1. Experimental setup in Experiment 1; different shape patternsrepresent different textures.
1245CROSS-MODAL ILLUSORY CONJUNCTIONS

stimulus was reported with the texture of the other: for example, asquare with a synthetic fur texture and a triangle with a carpettexture being reported as a square with a carpet texture and atriangle with a fur texture. There were no visual conjunction errorson trials in which one stimulus was fully reported correctly, and ontrials in which both stimuli were reported incorrectly, visual con-junction errors were no greater than trials on which either a textureor a shape feature error occurred (visual conjunction errors: dif-ferent texture condition � 0.44, same texture condition � 0.45;feature errors [either texture or shape errors] in both visual stimuli:different texture condition � 0.34, same texture condition � 0.68).The lack of visual ICs may be because participants were requiredto report the visual stimuli under conditions of maximal attentionwithin that modality. This may reduce the likelihood that theirfeatures might enter into incorrect combinations. The effects ofattention on ICs were examined further in Experiment 4 here.
One other result to note is that texture feature errors were morelikely on trials in which the tactile texture was the same as one ofthe visual textures (same texture trials) than on trials when thetactile and visual textures differed (different texture trials; 9.11%vs. 4.58%). However, it is difficult to make definite conclusionsfrom this result because, on the same texture trials, there was thepossibility of making two types of texture feature errors (becausethere were two textures that were not shown on those trials),whereas only one type of texture feature error could be made on adifferent texture trial (then only one texture that was not pre-sented). There also tended to be improved report for the visualstimulus sharing the texture with the tactile stimulus, relative to thevisual stimulus that did not (5.87% of texture feature errors on thevisual stimulus with different texture, and 3.07% on the stimuluswith same texture), t(15) � 3.24, p � .01. On trials in which onetexture was shared across modalities, that texture tended to bereported at the expense of the other visual texture present. Afterreporting all the present experiments, we present a formal accountof the errors in this experiment, to assess whether performancecould be best explained using a model in which cross-modalbinding is assumed to operate.
Experiment 2: An Effect of Common Hemispace
Experiment 1 showed effects of the tactile texture on responsesto the visual stimuli, particularly in terms of increased numbers ofconjunction errors relative to visual texture errors. There was noevidence for visual ICs. This suggests that unattended attributes(such as tactile textures) may enter into incorrect stimulus combi-nations, including feature combinations formed across differentmodalities. The tactile textures may be susceptible to entering intosuch errors because they were unattended (given that the task wasto respond to the orientation but not the texture of the tactilestimulus). The visual textures, however, were initially attended. Itmay be that, without attention, features are coded but not bound totheir perceptual modalities. This allows features to bind, incor-rectly, across modalities. This account is similar to the explanationof within-modality ICs offered by FIT (e.g., Treisman, 1998; seethe introduction). An alternative account, however, is that theerrors arise in memory. For example, the visual and tactile texturesmay initially be labeled appropriately for their modality of input,but this information may be rapidly forgotten. As a consequence,participants may be left with knowledge about the textures present(the tactile as well as the visual) but with no information abouttheir input modality. There may similarly be rapid loss of infor-mation about texture–shape pairings. Responses may then reflectarbitrary pairings of the shapes and textures present.
In Experiment 2, we provided one test of whether the cross-modal ICs were perceptual in nature, by examining whether theseICs were influenced by the relative locations of the visual andtactile stimuli. In particular, Experiment 2 assessed whether cross-modal ICs were more likely between visual and tactile stimulipresented to the same side of space relative to the body (i.e., in thesame hemispace) compared with stimuli presented to differenthemispaces. If co-occurrence in the same hemispace is important,this would provide direct evidence for a perceptual attribute (lo-cation on one side of the body) influencing performance. Thiswould fit with a perceptual account of cross-modal ICs.
The stimuli were the same as those used in Experiment 1.However, on each trial, two visual stimuli and two tactile stimuliwere now presented simultaneously. The visual stimuli were al-ways aligned horizontally, one on the left and the other on the rightside of the display. The tactile stimuli had a similar alignment tothe visual stimuli. The participants had to touch the tactile stimuliwith both hands—the left stimulus with the left hand and the rightstimulus with the right hand—and they had to judge whether thefelt orientations were the same or different. Following this, theyhad to report the visual shapes and textures presented. Are cross-modal ICs greater when the felt and seen stimuli fall on the sameside of the body (in the same rather than in opposite hemispaces)?
Method
Participants. A total of 20 participants from The University of Bir-mingham took part in the experiment. Their ages fell between 18 and 23years. All participants had normal or corrected-to-normal vision and nor-mal color vision.
Stimuli and procedure. The stimuli were the same used in Experiment1. The visual stimuli were always aligned horizontally, equidistant from thecenter of the screen. On each trial, the sequence of displays was the sameas in Experiment 1, but now two tactile strips were presented. The tactilestrips were placed on the table either in the same or in different orientations
Table 1Percentages of Responses Given by the Participants inExperiment 1, According to Whether the Tactile Texture Wasthe Same as or Different From One Visual Texture
Responses
Texture
Different Same
Correct 76.29 80.10One item incorrect
Tactile3visual conj. 8.70Texture feature 4.58 9.11Shape feature 7.27 7.48Texture and shape feature 0.35 0.72Tactile3visual conj. and shape feature 0.45 0.19
Two items incorrectVisual conj. 0.44 0.45One texture feature, one shape feature 0.34 0.52One tactile conj., one texture feature 0.25 0.00One tactile conj., one shape feature 0.45 0.00Other errors 0.88 1.43
Note. conj. � conjunction.
1246 CINEL, HUMPHREYS, AND POLI

(e.g., both vertical, or one vertical and the other horizontal, etc.). Theparticipants were asked to touch the tactile stimuli with both hands: the leftstimulus with the left hand and the right stimulus with the right hand. Theyhad two tasks: first, to report whether the tactile items had the same ordifferent orientations and second, to report the shape and texture of bothvisual items.
On every trial, the tactile items had different textures. To simplify theconditions, we kept constant the texture and side of presentation of one ofthe tactile stimuli for each participant, whereas its orientation could vary.The constant texture was presented on the left side for half the participantsand on the right side for the other half. The texture that was constant wasbalanced across participants. The visual items always differed both inshape and texture. All possible combinations of texture and shape werepresented to each participant, in a random order (with the constraint thatone tactile texture was always constant). One visual item had the sametexture as one of the two tactile stimuli. Visual and tactile stimuli with acommon texture were in the same hemispace on half the trials and, on theremaining trials, the stimuli with the common texture were in oppositehemispaces. The procedure was similar to that used in Experiment 1. Afixation cross appeared for 1 s, followed by the visual display. Thepresentation time for the visual display was again set for individualparticipants to ensure that performance fell between 75% and 90% correct.The average duration, across participants, was 129 ms, with a range of60–400 ms. A mask followed the visual stimuli (for 90 ms).
Experimental design. The combinations of conditions are shown inFigure 2. When visual and tactile stimuli with a common texture were inthe same hemispace (Figures 2A and 2C), tactile3visual conjunctionerrors on the visual item with common texture were possible only with thetactile item in the opposite hemispace (see Figures 2A and 2C, Error Types1, 6, 9, and 14). In contrast, tactile3visual conjunction errors on the itemwith a different texture were possible only with the tactile item in the samehemispace (Error Types 2, 5, 10, and 13). When visual and tactile itemswith the common texture were in opposite hemispaces (Figures 2B and2D), tactile3visual conjunction errors on the visual item with the commontexture were possible only when the tactile item fell in the same hemispace(Error Types 3, 8, 11, and 16). Tactile3visual conjunction errors on thevisual item with the different texture could occur only when the visual andtactile textures fell in opposite hemispaces (Figure 2B, Error Types 4, 7,12, and 15).
Results and Discussion
The most critical aspect of this experiment is whether cross-modal ICs were more likely between stimuli that fell on the sameside of space, relative to stimuli that fell in opposite hemispaces.We term this the effect of coregistration. Note that, as in Experi-ment 1, cross-modal ICs could only be scored unambiguouslywhen the tactile texture was different from the visual textures (anerror to a common texture could be visual or tactile in origin).
To investigate the effects of coregistration, we broke downperformance as follows. First, the data were categorized accordingto whether an IC (when present) arose from a tactile texturecoregistered with the visual item to which the error was made(coregistered � Errors 2, 3, 5, 8, 10, 11, 13, and 16, Figure 2; notcoregistered � Errors 1, 4, 6, 7, 9, 12, 14, and 15). Second,performance was separated according to whether the constanttactile texture was on the left or right (Figures 2A and 2B vs.Figures 2C and 2D). These data were subjected to a mixed-designanalysis of variance (ANOVA; see Figure 3). There was onebetween-subjects factor: location of the constant tactile texture(called constant stimulus hemispace, either left or right). Therewere two within-subjects factors: (a) relevant visual texture in thesame or opposite location as the relevant tactile texture (called
hemispace), and (b) the error type (tactile3visual conjunction vs.texture feature errors). Feature errors were defined if errors to thevisual textures involved textures not present in either the visualdisplay or the tactile stimulus. Tactile3visual conjunction errorsand feature errors were assigned to the categories defining the cellsin the ANOVA according to the visual texture to which the errorwas made. The raw data are shown in Table 2. (The way thattexture feature errors were assigned either to the same- or theopposite-hemispace condition is described in the Method sectionof this experiment and shown in Figure 2). The difference betweenconjunction and feature errors was significant, F(1, 18) � 11.82, p� .01, showing that true ICs were made by the participants. Theinteraction between hemispace and error type was not significant,F(1, 18) � 1.85, p � .19. However, the interaction betweenhemispace, error type, and constant stimulus hemispace was sig-nificant, F(1, 18) � 4.75, p � .04. ICs were more frequent whenvisual and tactile stimuli were in the same hemispace than whenthey were in opposite hemispaces, but only when the constanttactile stimulus was on the right side. Two separate two-wayANOVAs, one for participants with the constant stimulus on theleft and one for the participants with the constant stimulus on theright, showed that the interaction between hemispace and errortype was not significant for the left group, F(1, 19) � 0.38, p �.55, whereas it was significant for the group with the constant itemon the right, F(1, 19) � 5.76, p � .04.
The increase of tactile3visual conjunction errors over texturefeature errors was most pronounced when the constant tactile itemwas on the right, and it was also then greater for textures in thesame hemispace (in Figure 2, Error Types 10, 11, 13, and 16) thanfor textures in different locations (Error Types 9, 12, 14, and 15).With the constant item on the left, the frequency of ICs was lowerand the increase in ICs over texture feature errors for stimuli in thesame hemispace was not reliable (in Figure 2, Error Types 2, 3, 5,and 8 vs. Error Types 1, 4, 6, and 7).
Tactile3visual conjunction errors again occurred at a rate sig-nificantly higher than the rate of texture feature errors. Moreover,this effect was particularly strong when the visual and tactilestimuli fell in the same hemispace than when they were presentedin opposite hemispaces. This provides converging evidence fortactile ICs having a perceptual locus, because coregistration ofhemispace influenced the frequency of ICs errors. The results alsogo against a memory account of the effects. In a memory account,IC errors would be expected particularly for the stimuli reportedsecond (because there would then be a greater likelihood thatinformation about the co-occurrence of the visual shapes and theirtexture, and about the modality of the texture, would be forgotten).This would hold even if stimulus location served as a cue formemory retrieval. In general, participants reported the visualshapes and textures from left to right. On a memory view, cross-modal ICs should be frequent for Error Types 10, 12, 14, and 16in Figure 2 (taking any cases in which the constant tactile item wason the right). Instead of this, ICs were increased for Error Types10, 11, 13, and 16 compared with Error Types 9, 12, 14, and 15,even though the raised rates occurred for the visual stimulusreported first on half the occasions (Error Types 11 and 13). Wealso found that ICs were raised when the constant tactile texturewas on the right relative to when it was on the left. It is unclearwhy this factor modulated performance. However, one possibilityis that tactile ICs are particularly likely to arise when participants
1247CROSS-MODAL ILLUSORY CONJUNCTIONS

do not allocate full attention to the felt textures (we tested this inExperiment 4). Participants may tend to attend to the constanttexture across trials, and this may be most likely when it is on theright and so felt by the preferred hand of most participants. Onthese trials, little attention may be paid to the left texture, allowingit to enter into an illusory relationship with the visual stimuli alsopresented under conditions of reduced attention. Consistent with
this, there tended to be particularly large numbers of tactile ICswhen the varied texture was on the left (Errors 11 and 13). Notethat these errors were on the stimulus typically reported first and sowere most unlikely to reflect memory errors. Whether this atten-tional account is correct awaits further research. For now, theimportant contribution of Experiment 2 is demonstrating converg-ing evidence for a perceptual contribution to cross-modal ICs.
Figure 2. All possible cross-modal illusory conjunctions (represented by the arrows) in Experiment 2. Visualand tactile stimuli with an identical pattern represent stimuli in the experiment with identical texture. Thenumbers represent the error types (see the Method section of Experiment 2 for a full description). A and C:Identical visual and tactile textures are in the same hemispace. B and D: Identical visual and tactile textures arein opposite hemispaces.
1248 CINEL, HUMPHREYS, AND POLI

Experiment 3: Forced-Choice Performance
Experiment 3 set out to provide a further test of the memorialaccount of cross-modal ICs. In this study, instead of having par-ticipants report all the information they could about the visualdisplays, we gave them a forced-choice decision: Did we presenta particular visual shape–texture combination? If memorial pro-cesses are responsible for the cross-modal ICs (i.e., participantsremember the features they saw but cannot remember which wereconjoined together), then these errors should be minimized underforced-choice conditions. In the previous two experiments, inwhich the participants had to fully report the visual features, theymight lose feature and conjunction information while they wereresponding, and this might have been the cause of ICs. If cross-modal ICs are perceptual in origin, then they should occur evenwhen forced-choice decisions are used (see McClelland &Johnston, 1977; Reicher, 1969; and Wheeler, 1970, for examplesof the adoption of forced-choice procedures to minimize memoryand guessing effects in the study of the word superiority effect; seeTreisman & Schmidt, 1982, Experiments II and III, for an appli-cation to the study of ICs).
Method
Participants. A total of 16 participants from The University of Bir-mingham took part in the experiment. Their ages fell between 18 and 29years. All participants had normal or corrected-to-normal vision and nor-mal color vision.
Stimuli. The stimuli were the same used in Experiment 1. However, togenerate errors under forced-choice conditions, we presented four visualstimuli on each trial. The sizes of the stimuli were smaller than in theprevious experiments (4- � 4-cm square, 4-cm-diameter circle, and 5.2- �4-cm triangle). Shapes were positioned at each corner of an imaginarysquare (7.2 � 7.2 cm) located at the center of the display. One additionaltexture (bubble wrap) was added to the set of visual textures used in theprevious experiment (artificial fur, a Lego brick, carpet, and beans).
Procedure. On each trial, the tactile texture was never the same as oneof the visual textures (and it was never bubble wrap). All the visual shapeswere presented on each trial (square, circle, and triangle), and, therefore, oneach trial, two visual stimuli had the same shape. Two visual stimuli hadbubble wrap texture, and the other two visual stimuli had two othertextures.
A visual target was present on half of the trials, in any of the fourpositions. The target was characterized by a specific shape and texture. Itsshape was always a square, and its texture could be any of the visualtextures, except bubble wrap. The target texture was balanced acrossparticipants. For each participant, the target remained the same for thewhole experiment. The target never had both the shape and the texture incommon with any other stimulus.
The participants were instructed to touch the tactile stimulus as soon asthe fixation cross appeared. This ensured that participants were touchingthe texture when the visual stimuli were presented. There were two tasks:First, participants had to name the orientation of the tactile stimulus (eithervertical or horizontal), and then they had to say whether a prespecifiedtarget was present on the display. When the participants made falsenegative errors (i.e., the answer was “target not present” when the targetwas present), they were asked what shapes and textures they saw. The 108trials in which the target was not present were composed as follows. On 42trials, the tactile stimulus had the target texture, but none of the visual itemshad it. On 42 other trials, none of the stimuli (neither the visual nor thetactile) had the target texture. On the remaining 24 trials, one visualstimulus had the target texture (but not the shape), whereas the tactilestimulus did not have the target texture.
Each participant completed four blocks of 54 trials each. The exposureduration for the visual stimuli was set for individual participants, after apractice session, so that they achieved an accuracy score of between 65%and 90% correct. If, at the end of each block, the score was not in the rangerequired, the duration of the following block was changed. The averageduration, across participants, was 75 ms (range � 45–120 ms). A maskfollowed the visual stimuli (for 75 ms).
Figure 3. Schematic representation of the mixed-design analysis of variance in Experiment 2. L � left; R �right; SH � same hemispace; OH � opposite hemispace; TC � tactile conjunction; TF � texture feature. Thenumbers in the bottom row represent the tactile conjunction error types shown in Figure 2.
Table 2Percentages of Tactile3Visual Conjunction and TextureFeature Errors in Experiment 2, According to Whether Visualand Tactile Items Fell in the Same Hemispace and According tothe Position of the Constant Tactile Stimulus
Error
Hemispace (and error types)
Same(2, 3, 5, and 8)
Opposite(1, 4, 6, and 7)
Constant tactile item on the left
Tactile3visual conj. 6.3 4.9Texture feature 5.0 2.4
Error
Hemispace (and error types)
Same(10, 11, 13, and 16)
Opposite(9, 12, 14, and 15)
Constant tactile item on the right
Tactile3visual conj. 9.9 4.2Texture feature 2.8 2.5
Note. Error types are illustrated in Figure 2. conj. � conjunction.
1249CROSS-MODAL ILLUSORY CONJUNCTIONS

Results and Discussion
The results of Experiment 3 are shown in Table 3. They aredivided into two different conditions, for target-present and target-absent trials. When participants missed a target (on a target-presenttrial), they were asked what they saw on the display. The partic-ipants were never able to report all four visual stimuli on a trial.Every incorrect report of a visual stimulus was considered as anerror, and, therefore, more than one error could occur on a target-present trial. Four kinds of error were possible to be made to thevisual stimuli. A miss occurred when the participants failed toreport both the shape and the texture of the target stimulus. Atactile3visual conjunction error was made when the reportedvisual texture of either the target or any other visual stimuluspresented was actually the texture of the tactile stimulus. A texturefeature error was made when the reported texture of any visualstimulus was not presented at all on that trial. A shape error wasmade when any of the visual textures presented was reported withthe wrong shape. In the target-absent condition, incorrect detec-tions of the target were classified according to the visual and tactiletextures presented on the particular trial (note that all the shapeswere always present). Three kinds of error could be made. Atactile3visual conjunction error was made when only the tactilestimulus had the target texture. A texture feature error was madewhen neither the tactile nor any visual stimulus had the targettexture. A shape error was made when a visual stimulus had thesame texture but a different shape to the target.
For both target-present and target-absent trials, tactile3visualconjunction errors were more frequent than texture feature errors(2.60% vs. 1.74% in the target-present condition and 8.28% vs.6.60% in the target-absent condition). The data were analyzed witha paired-samples t test for each condition. In the target-presentcondition, the difference between tactile3visual conjunction andtexture feature errors approached significance, t(15) � 1.89, p �.08; however, the difference between those errors was significantin the target-absent condition, t(15) � 2.30, p � .04.1 The dataprovide evidence again for cross-modal ICs, even though a forced-choice response mode was used here to attempt to minimize effectsof memory on report. Indeed, if anything, cross-modal ICs weremore pronounced on target-absent than on target-present trials (ontarget-present trials, ICs were produced by participants reporting aparticular shape–tactile texture pairing, after reporting that thetarget was absent; on target-absent trials, ICs were generated byparticipants reporting incorrectly that a probed shape–tactile tex-ture pairing was present). This again supports the argument thatcross-modal ICs were perceptual rather than being purely gener-
ated from memory errors because the memory load should begreater on target-present trials (when a full report response wasmade).
Experiment 4: Effect of Attention on Cross-Modal ICs
In Experiment 1, in which cross-modal ICs were found, theparticipants were presented with two visual stimuli and one tactilestimulus. The task was to report, first, the orientation of the tactilestimulus and then the shape and texture of each visual stimulus.We argued that cross-modal binding arose because attention wasnot paid to the tactile texture, allowing it to be available forbinding with information in other modalities. It follows that payingmore attention to the tactile texture (e.g., if participants are askedto name it) might cause a decrease in cross-modal ICs becauseattention to the tactile texture (for report) may help to bind it to itsmodality. On a memory account, however, the opposite might beexpected. This is because the report load was increased whenresponses were required to more attributes, so more responseconfusions (assignment of the tactile texture to vision) may bepredicted. To test this, in Experiment 4 we presented participantswith two visual stimuli and one tactile stimulus, as in Experiment1. However, unlike in Experiment 1, the participants also had toreport the tactile texture, along with the tactile orientation, visualshapes, and textures. This experiment not only gave us theopportunity to test whether cross-modal ICs decreased when theparticipants were asked to report the tactile texture but also createdthe circumstances to see whether cross-modal ICs of the visualtexture to the tactile stimulus were possible (in the previousexperiments, we tested for ICs of the tactile texture to the visualstimulus).2
Method
Participants. A total of 16 students of The University of Birminghamwere tested. Their ages fell between 18 and 24 years. All participants hadnormal or corrected-to-normal vision and normal color vision.
Stimuli. The stimuli were identical to those used in Experiment 1.Procedure. The procedure of this experiment was identical to the
procedure of Experiment 1. Participants were simultaneously presentedwith two visual stimuli and one tactile stimulus (which could not be seen).The first task was now to report not only the tactile orientation but also thetactile texture. The second task remained the same (i.e., to report shape andtexture of the two visual stimuli).
A fixation cross was first presented at the center of the screen for 750ms; the visual stimuli followed, for an average duration of 239 ms; and,finally, a mask was presented for 75 ms. Each participant underwent apractice session (of a variable number of trials), followed by two blocks of72 trials each.
1 Putting the target-present and target-absent data together in anANOVA, with target presence and error type (tactile conjunction andtexture feature errors) as factors, we found that there was a main effect oferror type, F(15) � 7.35, p � .02, and no interaction, F(15) � 1.10, p �.31.
2 Unfortunately, in practice, there was good report of the tactile stimulus,precluding any possible identification of visual texture errors to tactilestimuli.
Table 3Mean Percentages for Each Response Category in Experiment 3
Responses Target present Target absent
Correct 73.50 78.82Target miss 13.77Tactile3visual conjunction 2.60 8.28Texture feature 1.74 6.60Shape error 12.67 6.31
Note. Data were divided according to whether the target stimulus waspresented.
1250 CINEL, HUMPHREYS, AND POLI

Results and Discussion
The trials were divided into two conditions: the different texturecondition, in which the tactile texture was different from the twovisual textures, and the same texture condition, in which the tactiletexture was the same as one of the visual textures. The two visualtextures were always different from each other, in both conditions.In the same texture condition, tactile3visual conjunction errorscould not be scored because they could not be distinguished fromcorrect responses. Therefore, the different texture condition wascritical for evaluating cross-modal ICs. The results are shown inTable 4. Like in all the previous experiments, to assess whethercross-modal ICs occurred, tactile3visual conjunction errors werecompared with texture feature errors. Tactile3visual conjunctionerrors (5.64%) were slightly more frequent than texture featureerrors (4.60%), but this difference did not approach significance,t(15) � 1.11, p � .28. It follows that any tactile3visual conjunc-tion errors here can be considered, like texture feature errors, to bea result of guessing or misperception of features and not as a resultof imperfect binding. In Experiment 1, which was identical toExperiment 4, except that the participants did not have to report thetactile texture, participants did make cross-modal ICs. In fact,although the percentage of feature errors was about the same as inExperiment 4 (4.58% in Experiment 1), the percentage of conjunc-tion errors was much higher in Experiment 1 (8.7%) than inExperiment 4. We performed a between-subjects ANOVA, inwhich the difference between conjunction and feature errors inExperiment 1 was compared with the difference between the sameerrors in Experiment 4. It showed that there was a significantdifference between the two experiments, F(1, 30) � 4.95, p � .03.The difference between the two types of error was increased inExperiment 1. In Experiment 4, reporting the tactile texture forcedthe participants to pay more attention to it, and this appears to be
critical in promoting a better binding of the tactile texture to itslocation. These results agree with FIT (Treisman, 1998; Treisman& Gelade, 1980), according to which attention facilitates correctbinding, because it allows the recovery of spatial informationrelating to each feature.
These results also give further support to our claim, previouslydiscussed, that cross-modal ICs develop at perceptual preattentivestages and are not a mere result of memory failures (see Experi-ments 2 and 3). In fact, if compared with Experiment 1, Experi-ment 4 is more demanding in terms of memory because there is anadditional feature to report—the tactile texture. If, in Experiment1, cross-modal ICs were caused by the difficulty of rememberingwhich features belonged to which stimulus (given that all thefeatures were correctly perceived), in Experiment 4, the frequencyof cross-modal ICs should have increased. However, the oppositehappened: No cross-modal ICs occurred. In a memorial account,there is no reason why reporting the tactile texture would decreasethe probability of making ICs errors. Therefore, these results, withthe findings of Experiments 2 and 3, strongly support a perceptualaccount of cross-modal ICs.
This experiment also showed that the perception and report ofthe tactile texture were very accurate. The average accuracy was99.6%, and only 4 out of 16 participants made incorrect reports ofthe tactile texture. Consequently, it was not possible to testwhether cross-modal ICs of the visual texture to the tactile stim-ulus occurred. Note too that, in the study, participants were askedto report on the visual as well as the tactile textures. This mayhave, in any case, reduced the frequency of ICs. ICs of visualtextures to tactile stimuli were assessed more stringently in Ex-periment 6.
Experiment 5: Cross-Modal ICs in a PatientWith Parietal Damage
There is neuropsychological evidence that the parietal lobe isinvolved in binding visual features. For example, patients withunilateral parietal damage may identify the features of multiplestimuli presented on the contralesional side, but they can fail tobind the features correctly (Cohen & Rafal, 1991), showing anabnormally high frequency of visual ICs. In a similar manner, highrates of visual ICs can be formed under free-viewing conditions inpatients with bilateral parietal damage (Friedman-Hill, Robertson,& Treisman, 1995; Humphreys et al., 2000). In Experiment 5, wetested a patient with a left parietal lobe lesion, M.H., to assesswhether parietal damage is also associated with binding stimuli totheir input modality. Patients with parietal damage can also showevidence of cross-modal interference, with their attention to acontralesional stimulus in one modality being affected by anipsilesional cue presented in another modality (e.g., Farah, Wong,Monheit, & Morrow, 1989; Mattingley et al., 1997). These lastresults suggest that parietal damage may be associated with a lackof sensitivity to the modality of origin of a given stimulus.
M.H. was tested under two different conditions: In the firstcondition (the perception condition), the stimuli and procedurewere the same used in Experiment 1 for normal participants,except that the exposure durations were considerably longer. Thisallowed us to examine whether M.H. showed a frequency of
Table 4Percentages of Responses in Experiment 4, According toWhether the Tactile Texture Was the Same as or Different FromOne of the Visual Textures
Responses
Texture
Different Same
Correct 72.92 77.08One item incorrect
Tactile3visual conj. 5.64Texture feature 4.60 9.46Shape feature 8.33 7.38Texture and shape feature 1.48 2.34Tactile3visual conj. and shape feature 1.82
Two items incorrectVisual conj. 0.95 0.95Visual conj. and texture feature 0.52 0.78Visual conj. and shape feature 0.35 0.87One tactile3visual conj., one texture feature 0.26One tactile3visual conj., one shape feature 0.35One tactile3visual conj., one texture and shape
feature 0.43One texture feature, one shape feature 0.35 0.43One shape feature, one texture and shape feature 0.69 0.26Other errors 1.31 0.45
Note. conj. � conjunction.
1251CROSS-MODAL ILLUSORY CONJUNCTIONS
cross-modal ICs higher than normal at these durations.3 From this,we can judge whether the parietal lobe is involved not only invisual feature binding but also in binding features to their modal-ity. In the second condition (the memory condition), the visual andtactile stimuli were presented in sequence rather than simulta-neously: The visual stimuli were presented first; then, after about750 ms, the tactile stimulus was presented. The duration of theinterval between the presentation of the visual stimuli and thetactile stimulus was selected in an attempt to avoid interferencebetween tactile perception and visual perception processes. If ICsarose through memory failure, then ICs should increase in thememory condition, relative to the perception condition, becauseM.H. must maintain the visual stimuli for a longer amount of timein the memory condition. On the other hand, there is more likelyto be simultaneous encoding of the visual and tactile textures in theperception condition. In addition, the perception condition willincrease the attentional load of the task, relative to the memorycondition, because two textures need to be encoded simultaneouslyin the former but not the latter case (cf. Duncan, 1980). If cross-modal ICs arise under conditions of simultaneous encoding, atten-tion load, or both, then they should be more frequent in theperception condition than the memory condition.
Case Report
M.H. suffered an anoxic incident when he was aged 42. Acomputerized tomography scan revealed increased signal in theleft posterior parietal region and, to a lesser extent, in the leftfrontal region. Increased signal was also reported in the lentiformnucleus bilaterally, slightly more pronounced on the left than onthe right, and in the heads of the caudate nuclei bilaterally. Fol-lowing the incident, M.H. had difficulties in all activities of ev-eryday life. For example, he was unable to dress or to coordinateproperly his fork and knife when eating. Writing was also im-paired. In a visual neuropsychological assessment of his visualprocessing, M.H.’s performance was normal on object-recognitiontests; however, his performance was very poor on space-perceptiontests. For instance, on the Visual Object and Space PerceptionBattery (Warrington & James, 1991) taken in 1999, M.H. per-formed within the control range on all the object perception tests:On the first test (shape detection), for which M.H. was required toindicate whether a white X was present against a background ofwhite and black noise, he scored 19 out of 20; he scored 20 out of20 on a test requiring one to identify black uppercase letters thathave been degraded by white noise; he also performed well in allthe tests assessing object recognition (silhouettes, 19 out of 20;object decision, 19 out of 20; progressive silhouettes, 9 out of 10).M.H.’s performance, however, was impaired for most of the space-perception tests. On a dot-counting task, for which he had to countthe number of black dots in random arrays of 5–9 dots, he scored4 out of 10; on another test, for which M.H. had to discriminatewhich of two squares contained a dot in the center (as opposed toslightly off center), he scored 19 out of 20. When asked to identifythe location of a dot in a square by choosing a numbered locationin another square that corresponded to the same location, M.H.scored 4 out of 10; finally, M.H.’s performance was also poorwhen asked to count the number of cubes in drawings of three-dimensional cubes, for which he scored 4 out of 10.
In a star and letter cancellation test, from the BehaviouralInattention Test (Wilson & Cockburn, 1987), M.H. did not showevidence of neglect. However, there was evidence of extinction.For example, with letters presented for 200 ms to the left and rightof fixation, M.H. scored 20 out of 20 for single items in his leftfield, 19 out of 20 for single items in his right field, but only 8 outof 20 on bilateral, two-letters trials. On all bilateral trials, heidentified the left- but not the right-side letter. There were alsoindications of tactile extinction (a single brush stroke to the left orright hand, or both). However, under the exposure durations usedin Experiment 5 (e.g., 500 ms and 850 ms, in the perception andmemory conditions), it is unlikely that extinction took place.Overall, M.H.’s deficits suggest that the dorsal visual pathway,which is implicated in the processing of spatial characteristics ofthe visual stimuli, has been compromised, whereas the ventralvisual pathway, which is implicated in the processing of thefeatures relevant to the identification of the objects, is relativelyintact (Riddoch, 2002).
Method
Stimuli. The stimuli were the same as in Experiment 1.Procedure. The experiment was run in two different conditions: the
perception condition and the memory condition. The procedure of theperception condition was the same as that used in Experiment 1, except thatthe duration of the visual stimuli was 500 ms, and no mask was presented.These presentation conditions are outside the range used with any of thecontrol participants (see Experiment 1). Control participants do not makeIC errors in our conditions at these exposures. Also, only horizontallyaligned visual stimuli were presented. The procedure of the memorycondition was slightly different. After the first two displays appeared (thefixation cross and the visual stimuli), a blank screen followed for 750 ms,and then a display with a green cross was displayed for 1 s. M.H. was toldto touch the tactile stimulus as soon as he saw the green cross. M.H. hadfirst to name the orientation of the tactile stimulus and then the shape andtexture of the two visual stimuli. The average duration of the visual stimuliwas 850 ms. M.H. completed 16 blocks of 72 trials each in the perceptioncondition and 8 blocks in the memory condition.
Results and Discussion
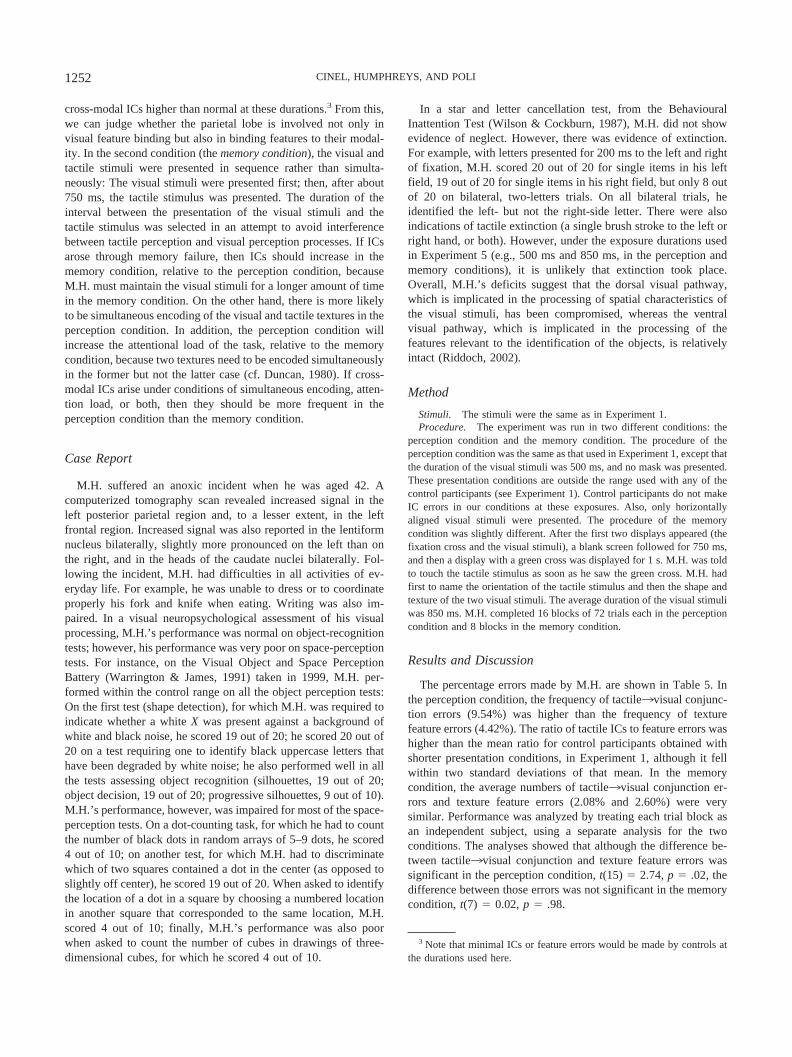
The percentage errors made by M.H. are shown in Table 5. Inthe perception condition, the frequency of tactile3visual conjunc-tion errors (9.54%) was higher than the frequency of texturefeature errors (4.42%). The ratio of tactile ICs to feature errors washigher than the mean ratio for control participants obtained withshorter presentation conditions, in Experiment 1, although it fellwithin two standard deviations of that mean. In the memorycondition, the average numbers of tactile3visual conjunction er-rors and texture feature errors (2.08% and 2.60%) were verysimilar. Performance was analyzed by treating each trial block asan independent subject, using a separate analysis for the twoconditions. The analyses showed that although the difference be-tween tactile3visual conjunction and texture feature errors wassignificant in the perception condition, t(15) � 2.74, p � .02, thedifference between those errors was not significant in the memorycondition, t(7) � 0.02, p � .98.
3 Note that minimal ICs or feature errors would be made by controls atthe durations used here.
1252 CINEL, HUMPHREYS, AND POLI
As M.H. has a left hemisphere lesion, we examined whether, inthe perception condition, the frequency of cross-modal ICs washigher on the right visual stimulus than on the left one. On the leftvisual stimulus, M.H. made 2.83% of tactile3visual conjunctionerrors and 1.59% of texture feature errors. On the right visualstimulus, the percentages were 6.71% and 2.83%, respectively.The data were analyzed with an ANOVA with the factors visualstimulus (left and right) and error. The interaction between the twofactors was not significant, F(1, 15) � 1.40, p � .25.
M.H. made reliably more cross-modal ICs than visual texturefeature errors, even though the stimuli were presented for substantiallylonger durations than those used for the control participants in Ex-periment 1 (M.H.’s durations were more than doubled relative tocontrols and more than four standard deviations from the mean of thecontrols). This suggests that, following parietal damage, a prolongedperiod is required to bind a stimulus to its modality. In addition, theICs occurred in the perception condition (when the visual and tactilestimuli were presented at the same time) but not in the memorycondition (in which the tactile stimuli were presented after the visualstimuli). This last result is of some importance because the load onmemory for reporting the visual features should have been increasedin the memory relative to the perception condition. We found theopposite. This is consistent with the cross-modal ICs being mostlikely to occur when there is simultaneous perception of the stimuli inthe different modalities and/or under conditions of increased atten-tional (rather than memory) load. Damage to the parietal lobe, inM.H.’s case, seems to delay the ability to assign the textures to theirinput modality. Hence, M.H. shows cross-modal ICs at durations notfound to be effective with control participants. This is an effect onperception, not memory.
Experiment 6: Cross-Modal ICs of the Visual Texture tothe Tactile Stimulus
Experiments on cross-modal influences on attentional orienting(e.g., Driver & Spence, 1998a, 1998b) have shown that tactile and
visual cues can influence attention in similar ways. Thus, a visualcue can affect the orientation of tactile attention in the same wayas a tactile cue can affect the orientation of visual attention(Spence & Driver, 1998). In Experiments 1–4, we found thatcross-modal ICs of the tactile texture to the tactile stimulus werepossible. The aim of the present experiment was to investigatewhether a symmetry also exists for cross-modal ICs. This wouldrequire proving that ICs of the visual texture to the tactile stimulusare possible.
In Experiment 4, the participants were presented with two visualstimuli and one tactile stimulus, and the tasks were to report theorientation and texture of the tactile stimulus, as well as the shapesand textures of the visual stimuli. We found that the accuracy inreporting the tactile texture was very high. Indeed, most of theparticipants did not make any errors when reporting the tactiletexture, and, for that reason, it was not possible to assess whethercross-modal ICs occurred from the visual texture to the tactilestimulus. In Experiment 6, we made the task more difficult so asto obtain more incorrect reports of the tactile texture and, in sodoing, we sought to maximize the opportunity for cross-modal ICson the tactile stimulus. Also, to minimize attention to visualtextures, we no longer required report of this information. Here,then, the participants were presented with two visual stimuli andtwo tactile stimuli, and their task was to report (a) the two visualshapes, (b) an answer regarding whether the orientation of thetactile stimuli was the same or different, and (c) the two tactiletextures.
Method
Participants. A total of 16 students of The University of Birminghamwere tested. Their ages fell between 18 and 22 years. All participants hadnormal or corrected-to-normal vision and normal color vision.
Stimuli. The visual stimuli were identical to those used in Experiment1. The tactile stimuli were bars made of four different materials (carpet, fur,
Table 5Percentages of Responses Given by M.H. in Experiment 5, According to Whether the TactileTexture Was the Same as or Different From One of the Visual Textures
Responses
Perception condition Memory condition
Differenttexture
Sametexture
Differenttexture
Sametexture
Correct 50.88 50.74 38.02 37.50One item incorrect
Tactile3visual conjunction 9.54 2.08Texture feature 4.42 13.32 2.60 5.96Shape feature 11.66 17.76 15.10 20.24Tactile3visual conjunction and shape feature 2.47 1.56Texture and shape feature 1.94 4.86 3.65 2.98Shape miss 1.24 0.63 2.08 1.19Texture miss 0.71 1.27 1.56 1.19
Two items incorrectVisual conjunction 1.24 2.96 14.58 10.71Visual conjunction and texture feature 1.06 1.48 2.60 2.98Visual conjunction and shape feature 0.53 0.42 8.85 8.93Only one item reported 4.77 4.44 4.08 4.17Other errors 9.54 2.12 5.24 4.16
Note. In the perception condition, tactile and visual stimuli were presented simultaneously. In the memorycondition, the tactile stimulus was presented about 750 ms after the presentation of the visual stimuli.
1253CROSS-MODAL ILLUSORY CONJUNCTIONS
beans, and a Lego brick), but their size was slightly smaller (about 3 � 7cm) than in the previous experiments.
Procedure. On each trial, participants were presented with two visualand two tactile stimuli. One of the tactile textures was identical to one ofthe visual textures, so that on each trial, three of the four textures werepresented. The visual stimuli were preceded by a fixation cross, presentedat the center of the screen, and were followed by a mask. The two tactilestimuli were placed on the table, in front of the participants, next to eachother. They had either the same or different orientation. Also, a tactile maskwas used. This was a board (43 cm � 35 cm) whose surface was tiled withfragments of the same materials used to make the tactile stimuli, randomlyplaced. The tactile mask was placed on the table in front of the participantsduring the whole experiment, and on each trial, the tactile stimuli wereplaced on it. Each participant was instructed to look at the screen and touchthe two tactile stimuli as soon as the fixation cross appeared. They wereasked to touch the stimuli for the time strictly necessary to recognize theirrelative orientation and textures. The left stimulus was touched with the lefthand and the right stimulus was touched with the right hand. Immediatelyafter that, the participants quickly touched the mask. They were asked notto rest their hands on the board between trials.
The tasks of the participants were to report the two visual shapes, thenthey had to say whether the orientation of the two tactile stimuli were thesame or different. Finally, they reported the two tactile textures.
Participants were presented with two blocks of 72 trials each. Thesewere preceded by a preliminary session during which the participants weregiven detailed instructions on how to perform each task and a practicesession of a variable number of trials. Once the participants felt confidentand performed the tasks correctly and in the right order, the experimentalsession started.
The fixation cross was presented for 750 ms, the visual stimuli werepresented for 75 ms (however, to one of the participants, who found it verydifficult to recognize the visual shapes, they were presented for 150 ms),and the visual mask was presented for 60 ms.
Results and Discussion
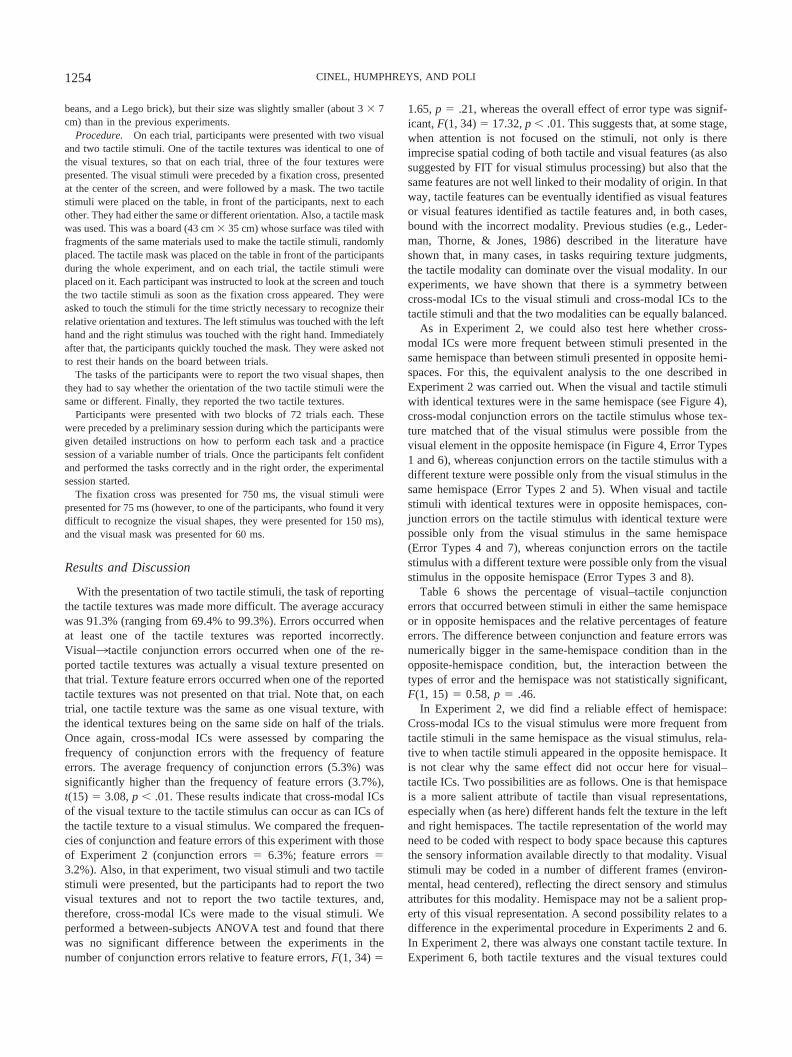
With the presentation of two tactile stimuli, the task of reportingthe tactile textures was made more difficult. The average accuracywas 91.3% (ranging from 69.4% to 99.3%). Errors occurred whenat least one of the tactile textures was reported incorrectly.Visual3tactile conjunction errors occurred when one of the re-ported tactile textures was actually a visual texture presented onthat trial. Texture feature errors occurred when one of the reportedtactile textures was not presented on that trial. Note that, on eachtrial, one tactile texture was the same as one visual texture, withthe identical textures being on the same side on half of the trials.Once again, cross-modal ICs were assessed by comparing thefrequency of conjunction errors with the frequency of featureerrors. The average frequency of conjunction errors (5.3%) wassignificantly higher than the frequency of feature errors (3.7%),t(15) � 3.08, p � .01. These results indicate that cross-modal ICsof the visual texture to the tactile stimulus can occur as can ICs ofthe tactile texture to a visual stimulus. We compared the frequen-cies of conjunction and feature errors of this experiment with thoseof Experiment 2 (conjunction errors � 6.3%; feature errors �3.2%). Also, in that experiment, two visual stimuli and two tactilestimuli were presented, but the participants had to report the twovisual textures and not to report the two tactile textures, and,therefore, cross-modal ICs were made to the visual stimuli. Weperformed a between-subjects ANOVA test and found that therewas no significant difference between the experiments in thenumber of conjunction errors relative to feature errors, F(1, 34) �
1.65, p � .21, whereas the overall effect of error type was signif-icant, F(1, 34) � 17.32, p � .01. This suggests that, at some stage,when attention is not focused on the stimuli, not only is thereimprecise spatial coding of both tactile and visual features (as alsosuggested by FIT for visual stimulus processing) but also that thesame features are not well linked to their modality of origin. In thatway, tactile features can be eventually identified as visual featuresor visual features identified as tactile features and, in both cases,bound with the incorrect modality. Previous studies (e.g., Leder-man, Thorne, & Jones, 1986) described in the literature haveshown that, in many cases, in tasks requiring texture judgments,the tactile modality can dominate over the visual modality. In ourexperiments, we have shown that there is a symmetry betweencross-modal ICs to the visual stimuli and cross-modal ICs to thetactile stimuli and that the two modalities can be equally balanced.
As in Experiment 2, we could also test here whether cross-modal ICs were more frequent between stimuli presented in thesame hemispace than between stimuli presented in opposite hemi-spaces. For this, the equivalent analysis to the one described inExperiment 2 was carried out. When the visual and tactile stimuliwith identical textures were in the same hemispace (see Figure 4),cross-modal conjunction errors on the tactile stimulus whose tex-ture matched that of the visual stimulus were possible from thevisual element in the opposite hemispace (in Figure 4, Error Types1 and 6), whereas conjunction errors on the tactile stimulus with adifferent texture were possible only from the visual stimulus in thesame hemispace (Error Types 2 and 5). When visual and tactilestimuli with identical textures were in opposite hemispaces, con-junction errors on the tactile stimulus with identical texture werepossible only from the visual stimulus in the same hemispace(Error Types 4 and 7), whereas conjunction errors on the tactilestimulus with a different texture were possible only from the visualstimulus in the opposite hemispace (Error Types 3 and 8).
Table 6 shows the percentage of visual–tactile conjunctionerrors that occurred between stimuli in either the same hemispaceor in opposite hemispaces and the relative percentages of featureerrors. The difference between conjunction and feature errors wasnumerically bigger in the same-hemispace condition than in theopposite-hemispace condition, but, the interaction between thetypes of error and the hemispace was not statistically significant,F(1, 15) � 0.58, p � .46.
In Experiment 2, we did find a reliable effect of hemispace:Cross-modal ICs to the visual stimulus were more frequent fromtactile stimuli in the same hemispace as the visual stimulus, rela-tive to when tactile stimuli appeared in the opposite hemispace. Itis not clear why the same effect did not occur here for visual–tactile ICs. Two possibilities are as follows. One is that hemispaceis a more salient attribute of tactile than visual representations,especially when (as here) different hands felt the texture in the leftand right hemispaces. The tactile representation of the world mayneed to be coded with respect to body space because this capturesthe sensory information available directly to that modality. Visualstimuli may be coded in a number of different frames (environ-mental, head centered), reflecting the direct sensory and stimulusattributes for this modality. Hemispace may not be a salient prop-erty of this visual representation. A second possibility relates to adifference in the experimental procedure in Experiments 2 and 6.In Experiment 2, there was always one constant tactile texture. InExperiment 6, both tactile textures and the visual textures could
1254 CINEL, HUMPHREYS, AND POLI

vary from trial to trial, and this might have led to a more evendistribution of attention across both left and right hemispaces,reducing any effects of hemispace on performance. These possi-bilities should be tested in future experiments.
A Measurement Model of Cross-Modal ICs
In all the experiments described above, we tested whether thefrequency of conjunction errors was higher than the frequency oftexture feature errors, to evaluate whether cross-modal ICs oc-curred. This criterion has been widely used in research on visualICs: The feature error rate is taken as a measure of guessing, andwhen the conjunction error rate is higher than that, then ICs areassumed to occur (e.g., Khurana, 1998; Treisman, 1988; Treisman& Schmidt, 1982; see also Cohen & Ivry, 1989; Cohen & Rafal,1991, for a similar approach using ratios of conjunction-to-featureerrors). In this section, we describe a multinomial model we havedeveloped to test the presence of cross-modal ICs in a moreanalytical fashion. This model has been inspired by other models
previously developed by Prinzmetal and colleagues (Ashby, Prinz-metal, Ivry, & Maddox, 1996; Prinzmetal, Henderson, & Ivry,1995; Prinzmetal, Ivry, Beck, & Shimizu, 2002; see also Donk,1999). According to these authors, a formal approach “forces oneto make assumptions explicit” but also “permits the estimation ofunderlying psychological parameters from overt behavior” (Ashbyet al., 1996, p. 166).
We used our multinomial model to fit the data of Experiments1 (tactile3visual ICs) and 6 (visual3tactile ICs).
The Model
We used a probabilistic model that tried to capture the mostimportant features of the binding process in multimodal(visual3tactile) perception. The model was based on a smallnumber of assumptions. These are described below together, alongwith a justification for them.
Independent perception and binding of shape and texture. Weassumed that the process of perceiving and binding the shape-related features of stimuli was statistically independent from theperception and binding of texture-related features. We also as-sumed that the perception of features (be they shapes or textures)and their binding are statistically independent processes (note thatwe made this assumptions for our specific case, and we do notclaim that it is generally true, for example, within a modality).
Independent perception of the shapes of different (visual) stim-uli. Performance in our experiments was averaged across theleft–right and up–down locations of stimuli (and participants wereasked to report the stimuli in whatever order they liked). Conse-quently, rather than having separate parameters for each location,the model included only one parameter to describe the reliability ofshape perception: �VS. �VS represents the probability that eachvisual shape is correctly identified (but not necessarily correctlybound) by the observer. So, for example, if two visual shapes were
Figure 4. All possible allocations of the visual and tactile stimuli in Experiment 6. Visual and tactile stimuliwith identical patterns represent stimuli in the experiment with identical textures. Arrows represent all possibleconjunction errors of the visual texture to the tactile stimulus.
Table 6Percentages of Visual3Tactile Conjunction and TextureFeature Errors in Experiment 6, According to WhetherVisual and Tactile Items Fell in the Same orin the Opposite Hemispace
Error
Hemispace (and error types)
Same(2, 4, 5, and 7)
Opposite(1, 3, 6, and 8)
Visual3tactile conjunction 6.0 4.7Texture feature 3.9 3.5
Note. Error types are illustrated in Figure 4.
1255CROSS-MODAL ILLUSORY CONJUNCTIONS
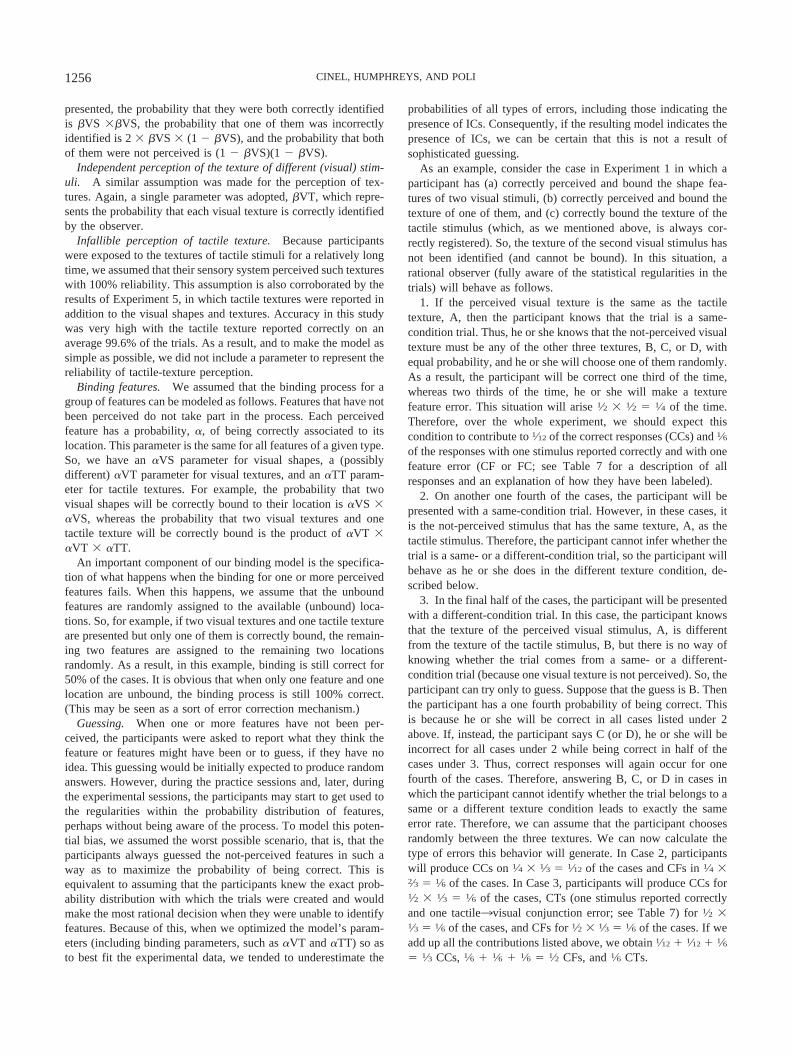
presented, the probability that they were both correctly identifiedis �VS ��VS, the probability that one of them was incorrectlyidentified is 2 � �VS � (1 � �VS), and the probability that bothof them were not perceived is (1 � �VS)(1 � �VS).
Independent perception of the texture of different (visual) stim-uli. A similar assumption was made for the perception of tex-tures. Again, a single parameter was adopted, �VT, which repre-sents the probability that each visual texture is correctly identifiedby the observer.
Infallible perception of tactile texture. Because participantswere exposed to the textures of tactile stimuli for a relatively longtime, we assumed that their sensory system perceived such textureswith 100% reliability. This assumption is also corroborated by theresults of Experiment 5, in which tactile textures were reported inaddition to the visual shapes and textures. Accuracy in this studywas very high with the tactile texture reported correctly on anaverage 99.6% of the trials. As a result, and to make the model assimple as possible, we did not include a parameter to represent thereliability of tactile-texture perception.
Binding features. We assumed that the binding process for agroup of features can be modeled as follows. Features that have notbeen perceived do not take part in the process. Each perceivedfeature has a probability, �, of being correctly associated to itslocation. This parameter is the same for all features of a given type.So, we have an �VS parameter for visual shapes, a (possiblydifferent) �VT parameter for visual textures, and an �TT param-eter for tactile textures. For example, the probability that twovisual shapes will be correctly bound to their location is �VS ��VS, whereas the probability that two visual textures and onetactile texture will be correctly bound is the product of �VT ��VT � �TT.
An important component of our binding model is the specifica-tion of what happens when the binding for one or more perceivedfeatures fails. When this happens, we assume that the unboundfeatures are randomly assigned to the available (unbound) loca-tions. So, for example, if two visual textures and one tactile textureare presented but only one of them is correctly bound, the remain-ing two features are assigned to the remaining two locationsrandomly. As a result, in this example, binding is still correct for50% of the cases. It is obvious that when only one feature and onelocation are unbound, the binding process is still 100% correct.(This may be seen as a sort of error correction mechanism.)
Guessing. When one or more features have not been per-ceived, the participants were asked to report what they think thefeature or features might have been or to guess, if they have noidea. This guessing would be initially expected to produce randomanswers. However, during the practice sessions and, later, duringthe experimental sessions, the participants may start to get used tothe regularities within the probability distribution of features,perhaps without being aware of the process. To model this poten-tial bias, we assumed the worst possible scenario, that is, that theparticipants always guessed the not-perceived features in such away as to maximize the probability of being correct. This isequivalent to assuming that the participants knew the exact prob-ability distribution with which the trials were created and wouldmake the most rational decision when they were unable to identifyfeatures. Because of this, when we optimized the model’s param-eters (including binding parameters, such as �VT and �TT) so asto best fit the experimental data, we tended to underestimate the
probabilities of all types of errors, including those indicating thepresence of ICs. Consequently, if the resulting model indicates thepresence of ICs, we can be certain that this is not a result ofsophisticated guessing.
As an example, consider the case in Experiment 1 in which aparticipant has (a) correctly perceived and bound the shape fea-tures of two visual stimuli, (b) correctly perceived and bound thetexture of one of them, and (c) correctly bound the texture of thetactile stimulus (which, as we mentioned above, is always cor-rectly registered). So, the texture of the second visual stimulus hasnot been identified (and cannot be bound). In this situation, arational observer (fully aware of the statistical regularities in thetrials) will behave as follows.
1. If the perceived visual texture is the same as the tactiletexture, A, then the participant knows that the trial is a same-condition trial. Thus, he or she knows that the not-perceived visualtexture must be any of the other three textures, B, C, or D, withequal probability, and he or she will choose one of them randomly.As a result, the participant will be correct one third of the time,whereas two thirds of the time, he or she will make a texturefeature error. This situation will arise 1⁄2 � 1⁄2 � 1⁄4 of the time.Therefore, over the whole experiment, we should expect thiscondition to contribute to 1⁄12 of the correct responses (CCs) and 1⁄6of the responses with one stimulus reported correctly and with onefeature error (CF or FC; see Table 7 for a description of allresponses and an explanation of how they have been labeled).
2. On another one fourth of the cases, the participant will bepresented with a same-condition trial. However, in these cases, itis the not-perceived stimulus that has the same texture, A, as thetactile stimulus. Therefore, the participant cannot infer whether thetrial is a same- or a different-condition trial, so the participant willbehave as he or she does in the different texture condition, de-scribed below.
3. In the final half of the cases, the participant will be presentedwith a different-condition trial. In this case, the participant knowsthat the texture of the perceived visual stimulus, A, is differentfrom the texture of the tactile stimulus, B, but there is no way ofknowing whether the trial comes from a same- or a different-condition trial (because one visual texture is not perceived). So, theparticipant can try only to guess. Suppose that the guess is B. Thenthe participant has a one fourth probability of being correct. Thisis because he or she will be correct in all cases listed under 2above. If, instead, the participant says C (or D), he or she will beincorrect for all cases under 2 while being correct in half of thecases under 3. Thus, correct responses will again occur for onefourth of the cases. Therefore, answering B, C, or D in cases inwhich the participant cannot identify whether the trial belongs to asame or a different texture condition leads to exactly the sameerror rate. Therefore, we can assume that the participant choosesrandomly between the three textures. We can now calculate thetype of errors this behavior will generate. In Case 2, participantswill produce CCs on 1⁄4 � 1⁄3 � 1⁄12 of the cases and CFs in 1⁄4 �2⁄3 � 1⁄6 of the cases. In Case 3, participants will produce CCs for1⁄2 � 1⁄3 � 1⁄6 of the cases, CTs (one stimulus reported correctlyand one tactile3visual conjunction error; see Table 7) for 1⁄2 �1⁄3 � 1⁄6 of the cases, and CFs for 1⁄2 � 1⁄3 � 1⁄6 of the cases. If weadd up all the contributions listed above, we obtain 1⁄12 � 1⁄12 � 1⁄6� 1⁄3 CCs, 1⁄6 � 1⁄6 � 1⁄6 � 1⁄2 CFs, and 1⁄6 CTs.
1256 CINEL, HUMPHREYS, AND POLI
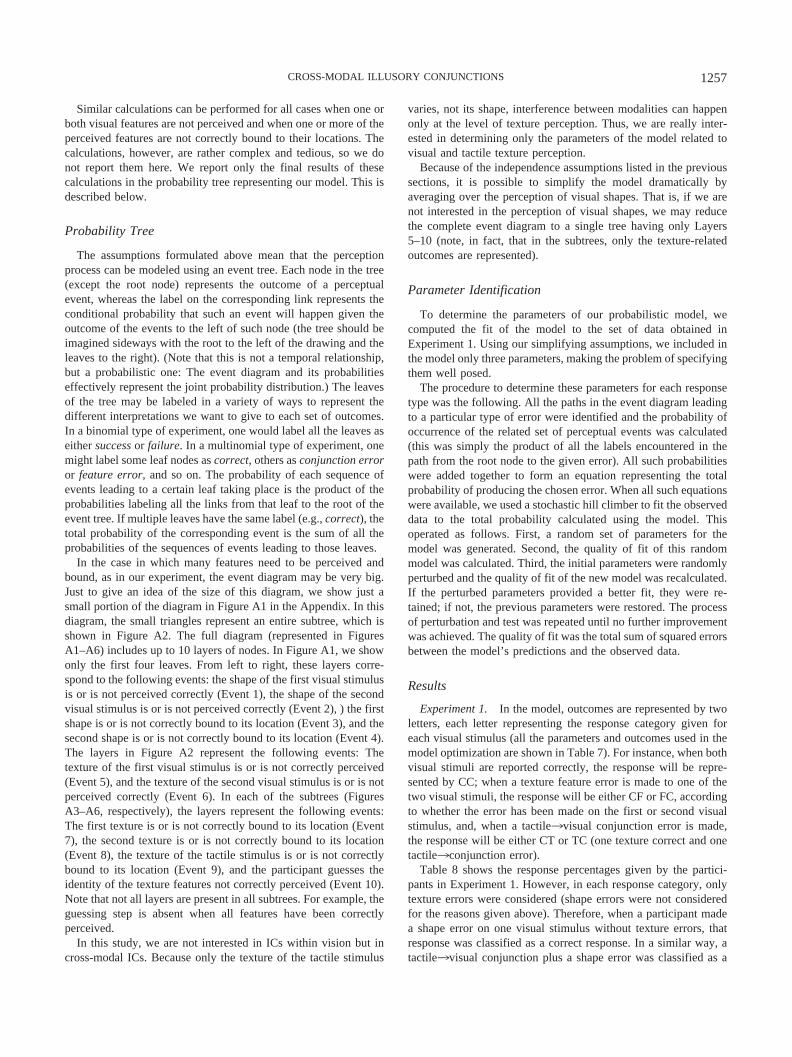
Similar calculations can be performed for all cases when one orboth visual features are not perceived and when one or more of theperceived features are not correctly bound to their locations. Thecalculations, however, are rather complex and tedious, so we donot report them here. We report only the final results of thesecalculations in the probability tree representing our model. This isdescribed below.
Probability Tree
The assumptions formulated above mean that the perceptionprocess can be modeled using an event tree. Each node in the tree(except the root node) represents the outcome of a perceptualevent, whereas the label on the corresponding link represents theconditional probability that such an event will happen given theoutcome of the events to the left of such node (the tree should beimagined sideways with the root to the left of the drawing and theleaves to the right). (Note that this is not a temporal relationship,but a probabilistic one: The event diagram and its probabilitieseffectively represent the joint probability distribution.) The leavesof the tree may be labeled in a variety of ways to represent thedifferent interpretations we want to give to each set of outcomes.In a binomial type of experiment, one would label all the leaves aseither success or failure. In a multinomial type of experiment, onemight label some leaf nodes as correct, others as conjunction erroror feature error, and so on. The probability of each sequence ofevents leading to a certain leaf taking place is the product of theprobabilities labeling all the links from that leaf to the root of theevent tree. If multiple leaves have the same label (e.g., correct), thetotal probability of the corresponding event is the sum of all theprobabilities of the sequences of events leading to those leaves.
In the case in which many features need to be perceived andbound, as in our experiment, the event diagram may be very big.Just to give an idea of the size of this diagram, we show just asmall portion of the diagram in Figure A1 in the Appendix. In thisdiagram, the small triangles represent an entire subtree, which isshown in Figure A2. The full diagram (represented in FiguresA1–A6) includes up to 10 layers of nodes. In Figure A1, we showonly the first four leaves. From left to right, these layers corre-spond to the following events: the shape of the first visual stimulusis or is not perceived correctly (Event 1), the shape of the secondvisual stimulus is or is not perceived correctly (Event 2), ) the firstshape is or is not correctly bound to its location (Event 3), and thesecond shape is or is not correctly bound to its location (Event 4).The layers in Figure A2 represent the following events: Thetexture of the first visual stimulus is or is not correctly perceived(Event 5), and the texture of the second visual stimulus is or is notperceived correctly (Event 6). In each of the subtrees (FiguresA3–A6, respectively), the layers represent the following events:The first texture is or is not correctly bound to its location (Event7), the second texture is or is not correctly bound to its location(Event 8), the texture of the tactile stimulus is or is not correctlybound to its location (Event 9), and the participant guesses theidentity of the texture features not correctly perceived (Event 10).Note that not all layers are present in all subtrees. For example, theguessing step is absent when all features have been correctlyperceived.
In this study, we are not interested in ICs within vision but incross-modal ICs. Because only the texture of the tactile stimulus
varies, not its shape, interference between modalities can happenonly at the level of texture perception. Thus, we are really inter-ested in determining only the parameters of the model related tovisual and tactile texture perception.
Because of the independence assumptions listed in the previoussections, it is possible to simplify the model dramatically byaveraging over the perception of visual shapes. That is, if we arenot interested in the perception of visual shapes, we may reducethe complete event diagram to a single tree having only Layers5–10 (note, in fact, that in the subtrees, only the texture-relatedoutcomes are represented).
Parameter Identification
To determine the parameters of our probabilistic model, wecomputed the fit of the model to the set of data obtained inExperiment 1. Using our simplifying assumptions, we included inthe model only three parameters, making the problem of specifyingthem well posed.
The procedure to determine these parameters for each responsetype was the following. All the paths in the event diagram leadingto a particular type of error were identified and the probability ofoccurrence of the related set of perceptual events was calculated(this was simply the product of all the labels encountered in thepath from the root node to the given error). All such probabilitieswere added together to form an equation representing the totalprobability of producing the chosen error. When all such equationswere available, we used a stochastic hill climber to fit the observeddata to the total probability calculated using the model. Thisoperated as follows. First, a random set of parameters for themodel was generated. Second, the quality of fit of this randommodel was calculated. Third, the initial parameters were randomlyperturbed and the quality of fit of the new model was recalculated.If the perturbed parameters provided a better fit, they were re-tained; if not, the previous parameters were restored. The processof perturbation and test was repeated until no further improvementwas achieved. The quality of fit was the total sum of squared errorsbetween the model’s predictions and the observed data.
Results
Experiment 1. In the model, outcomes are represented by twoletters, each letter representing the response category given foreach visual stimulus (all the parameters and outcomes used in themodel optimization are shown in Table 7). For instance, when bothvisual stimuli are reported correctly, the response will be repre-sented by CC; when a texture feature error is made to one of thetwo visual stimuli, the response will be either CF or FC, accordingto whether the error has been made on the first or second visualstimulus, and, when a tactile3visual conjunction error is made,the response will be either CT or TC (one texture correct and onetactile3conjunction error).
Table 8 shows the response percentages given by the partici-pants in Experiment 1. However, in each response category, onlytexture errors were considered (shape errors were not consideredfor the reasons given above). Therefore, when a participant madea shape error on one visual stimulus without texture errors, thatresponse was classified as a correct response. In a similar way, atactile3visual conjunction plus a shape error was classified as a
1257CROSS-MODAL ILLUSORY CONJUNCTIONS

tactile3visual conjunction error, and the same held for texturefeature errors and visual conjunction errors. With this new classi-fication, again the frequency of conjunction errors (9.69%) wassignificantly higher than the frequency of texture feature errors(5.34%), t(15) � 4.185, p � .01.
One main assumption we make is that some conjunction errorsare real ICs. In the model, the parameter representing tactiletexture binding is �TT. If, in our experiments, cross-modal ICs arecaused by incorrect binding of the tactile texture to a visualstimulus location, �TT should vary according to the frequency ofcross-modal ICs: The more frequent any ICs, the smaller the �TTparameter should be (�TT � 1 indicates perfect tactile binding).
The data produced by the model are shown in Table 9, withsimulations carried out for individual participants. The data arelisted according to the frequency of ICs for each participant,calculated simply by subtracting feature errors from conjunctionerrors made by the participants in Experiment 1 (ICs, last columnin Table 9): Smaller differences denote low IC frequencies. Thelinear relationship between ICs and �TT (illustrated in Figure 5),measured with the Pearson correlation test, was significant (r ��.61, p � .01).
Experiment 6. A similar procedure was also applied to the datafrom Experiment 6, in which we examined ICs comprising visualtextures misreported as being felt. In Experiment 6, two visualstimuli and two tactile stimuli were presented, and the task was toreport the two visual shapes—whether the orientation of the twotactile stimuli was the same or different—and the two tactiletextures. The presence of two tactile stimuli required some minoradjustment of the model. As in the model for Experiment 1, themodel for Experiment 6 was based on the assumptions of inde-pendent perception and binding of shape and texture, independentperception of the shapes of different (visual) stimuli, and indepen-dent perception of the texture of different (visual) stimuli. As inExperiment 1, in Experiment 6, the participants were exposed tothe tactile stimuli for a relatively long duration. Therefore, it isreasonable to assume that tactile perception was very accurate. Forthis reason, in the model, we assumed perfect tactile perception. As
in the model for Experiment 1, when the binding of a featurefailed, that feature was randomly assigned to one of the availablelocations. Also, features that were not perceived did not take partin the binding process. Calculations for guessing were also basedon the assumption that participants guessed (when one or morefeatures were not perceived) in such a way to maximize theprobability of being correct, that is, considering that (a) the twovisual textures were never the same, (b) the two tactile textureswere never the same, (c) one visual texture was the same as onetactile texture, and (d) the visual and tactile stimuli with the sametexture were in the same hemispace in half of trials.
The model included layers corresponding to the followingevents: perception of the first visual shape (Event 1), perception ofthe second visual shape (Event 2), binding of the first visual shape(Event 3), binding of the second visual shape (Event 4), perceptionof the first tactile texture (Event 5), perception of the second tactiletexture (Event 6), binding of the first tactile texture (Event 7), andbinding of the second tactile texture (Event 8).
The model included three parameters, illustrated in Table 10,representing the probability of correct–incorrect perception andbinding of the two visual textures and the two tactile textures. Theprocedure for parameter determination was the same as the onefollowed in the model for Experiment 1.
We assumed that ICs from visual to tactile stimuli are caused byincorrect binding of the visual texture, and, for that reason, weexpected the parameter �VT to vary in relation to the number ofICs: The higher the value of �VT (�VT � 1 indicates perfectvisual binding), the lower the probability of IC errors. The dataproduced by the model are given in Table 11 (simulations havebeen carried out for individual participants). The data are orderedaccording to the frequency of ICs, which is represented by thedifference between conjunction and feature errors made by theparticipants in Experiment 6 (ICs, last column in Table 11). Thelinear relationship between �VT and ICs was significant (r ��.81, p � .01; Figure 6).
In all the simulations, the probability of cross-modal ICs wasstrictly correlated to the variation in the binding parameters, even
Table 8Percentages of Correct Responses and Errors Given inExperiment 1, in Which Only Errors of Texture WereConsidered
Responses Different texture Same texture
CC 82.60 87.26CT/TC 9.69CF/FC 5.34 10.49VV 0.71 0.46TF/FT 0.33VT/TV 0.27VF/FV 0.18 0.17Other errors 0.88 1.62
Note. Errors of shape were not considered. These data were used for theparameter optimization of the model for Experiment 1. CC � both stimulicorrect; CT/TC � one texture correct and one tactile3visual conjunctionerror; CF/FC � one texture correct and one texture feature error; VV �visual conjunction error; TF/FT � one tactile3visual conjunction errorand one texture feature error; VT/TV � one visual conjunction error andone tactile3visual conjunction error; VF/FV � one visual conjunctionerror and one texture feature error.
Table 7List of Parameters and Outcome Labels Used in the Modelfor Experiment 1
Label Definition
Parameters
�VT Probability of correctly perceiving or identifying the visualtextures
�VT Probability of binding the visual textures to the right location�TT Probability of binding the tactile texture to the right location
Outcomes
C CorrectT Tactile3visual conjunction errorF Texture feature errorV Visual conjunction error
Note. In the model, each outcome has been represented with two letters.Each letter represents the response category given for each visual texture.For example, CT means one correct response and one tactile3visualconjunction error.
1258 CINEL, HUMPHREYS, AND POLI
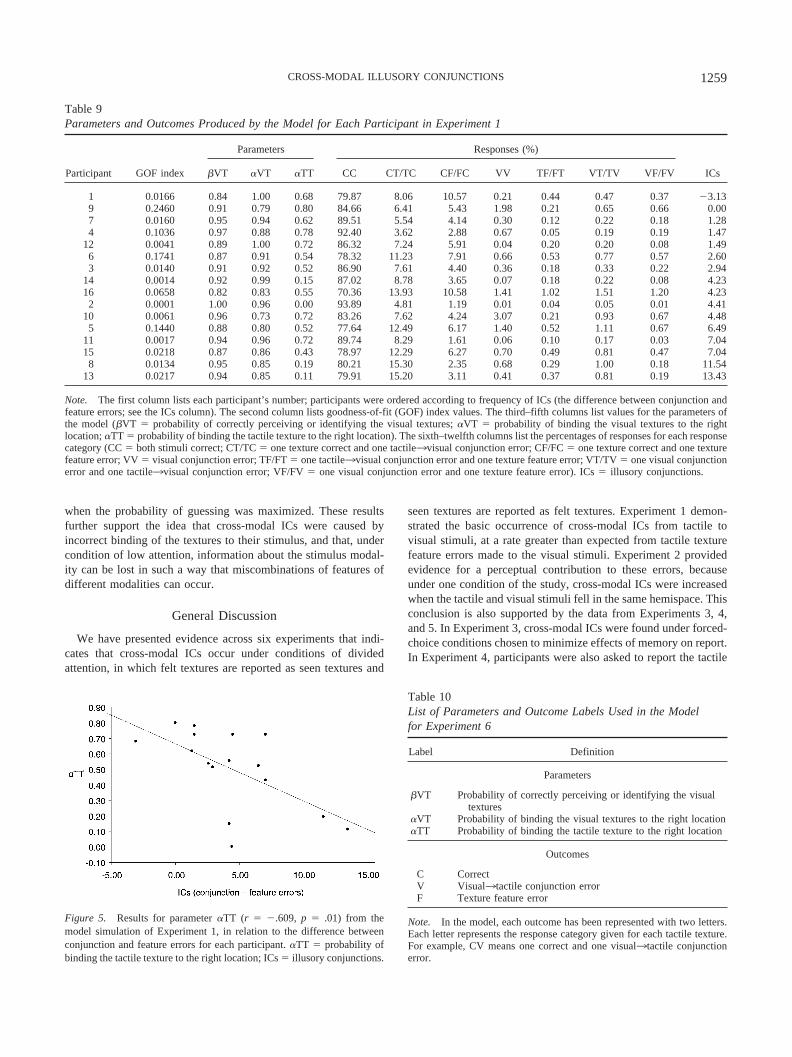
when the probability of guessing was maximized. These resultsfurther support the idea that cross-modal ICs were caused byincorrect binding of the textures to their stimulus, and that, undercondition of low attention, information about the stimulus modal-ity can be lost in such a way that miscombinations of features ofdifferent modalities can occur.
General Discussion
We have presented evidence across six experiments that indi-cates that cross-modal ICs occur under conditions of dividedattention, in which felt textures are reported as seen textures and
seen textures are reported as felt textures. Experiment 1 demon-strated the basic occurrence of cross-modal ICs from tactile tovisual stimuli, at a rate greater than expected from tactile texturefeature errors made to the visual stimuli. Experiment 2 providedevidence for a perceptual contribution to these errors, becauseunder one condition of the study, cross-modal ICs were increasedwhen the tactile and visual stimuli fell in the same hemispace. Thisconclusion is also supported by the data from Experiments 3, 4,and 5. In Experiment 3, cross-modal ICs were found under forced-choice conditions chosen to minimize effects of memory on report.In Experiment 4, participants were also asked to report the tactile
Table 9Parameters and Outcomes Produced by the Model for Each Participant in Experiment 1
Participant GOF index
Parameters Responses (%)
ICs�VT �VT �TT CC CT/TC CF/FC VV TF/FT VT/TV VF/FV
1 0.0166 0.84 1.00 0.68 79.87 8.06 10.57 0.21 0.44 0.47 0.37 �3.139 0.2460 0.91 0.79 0.80 84.66 6.41 5.43 1.98 0.21 0.65 0.66 0.007 0.0160 0.95 0.94 0.62 89.51 5.54 4.14 0.30 0.12 0.22 0.18 1.284 0.1036 0.97 0.88 0.78 92.40 3.62 2.88 0.67 0.05 0.19 0.19 1.47
12 0.0041 0.89 1.00 0.72 86.32 7.24 5.91 0.04 0.20 0.20 0.08 1.496 0.1741 0.87 0.91 0.54 78.32 11.23 7.91 0.66 0.53 0.77 0.57 2.603 0.0140 0.91 0.92 0.52 86.90 7.61 4.40 0.36 0.18 0.33 0.22 2.94
14 0.0014 0.92 0.99 0.15 87.02 8.78 3.65 0.07 0.18 0.22 0.08 4.2316 0.0658 0.82 0.83 0.55 70.36 13.93 10.58 1.41 1.02 1.51 1.20 4.232 0.0001 1.00 0.96 0.00 93.89 4.81 1.19 0.01 0.04 0.05 0.01 4.41
10 0.0061 0.96 0.73 0.72 83.26 7.62 4.24 3.07 0.21 0.93 0.67 4.485 0.1440 0.88 0.80 0.52 77.64 12.49 6.17 1.40 0.52 1.11 0.67 6.49
11 0.0017 0.94 0.96 0.72 89.74 8.29 1.61 0.06 0.10 0.17 0.03 7.0415 0.0218 0.87 0.86 0.43 78.97 12.29 6.27 0.70 0.49 0.81 0.47 7.048 0.0134 0.95 0.85 0.19 80.21 15.30 2.35 0.68 0.29 1.00 0.18 11.54
13 0.0217 0.94 0.85 0.11 79.91 15.20 3.11 0.41 0.37 0.81 0.19 13.43
Note. The first column lists each participant’s number; participants were ordered according to frequency of ICs (the difference between conjunction andfeature errors; see the ICs column). The second column lists goodness-of-fit (GOF) index values. The third–fifth columns list values for the parameters ofthe model (�VT � probability of correctly perceiving or identifying the visual textures; �VT � probability of binding the visual textures to the rightlocation; �TT � probability of binding the tactile texture to the right location). The sixth–twelfth columns list the percentages of responses for each responsecategory (CC � both stimuli correct; CT/TC � one texture correct and one tactile3visual conjunction error; CF/FC � one texture correct and one texturefeature error; VV � visual conjunction error; TF/FT � one tactile3visual conjunction error and one texture feature error; VT/TV � one visual conjunctionerror and one tactile3visual conjunction error; VF/FV � one visual conjunction error and one texture feature error). ICs � illusory conjunctions.
Figure 5. Results for parameter �TT (r � �.609, p � .01) from themodel simulation of Experiment 1, in relation to the difference betweenconjunction and feature errors for each participant. �TT � probability ofbinding the tactile texture to the right location; ICs � illusory conjunctions.
Table 10List of Parameters and Outcome Labels Used in the Modelfor Experiment 6
Label Definition
Parameters
�VT Probability of correctly perceiving or identifying the visualtextures
�VT Probability of binding the visual textures to the right location�TT Probability of binding the tactile texture to the right location
Outcomes
C CorrectV Visual3tactile conjunction errorF Texture feature error
Note. In the model, each outcome has been represented with two letters.Each letter represents the response category given for each tactile texture.For example, CV means one correct and one visual3tactile conjunctionerror.
1259CROSS-MODAL ILLUSORY CONJUNCTIONS

texture, to force them to pay more attention to that stimulus. Inthose circumstances, we did not find cross-modal ICs, despite thehigher memory load. Consequently, there is converging evidencethat these cross-modal ICs were perceptual in nature. Under con-ditions in which there is suboptimal attention to the stimuli, ICscan occur, in which stimulus features within one modality arecombined incorrectly (e.g., Treisman & Schmidt, 1982). In Exper-iment 5, we found evidence for cross-modal ICs using relativelylong exposures of stimuli in a patient with damage to the parietallobe (M.H.). ICs occurred when there was concurrent presentation
of the felt and seen textures (in the perception condition), but notwhen their presentations were staggered (in the memory condi-tion). In Experiment 6, we found that cross-modal ICs of a visualtexture to a tactile stimulus are also possible and that these oc-curred with a similar frequency to cross-modal ICs to the visualstimuli (found in Experiment 2). The ICs in Experiments 1 and 6cannot be considered experimental artifacts due to clever guessing,as indicated by our multinomial probabilistic model.
To the best of our knowledge, this is the first time that reliableICs have been demonstrated across, as well as within, modalities.As is the case with within-modality ICs, we suggest that cross-modal ICs arise under conditions of inattention to the stimuli. InExperiments 1–3 and 5, participants were asked to make a judg-ment about the orientation of the tactile stimulus, but the texture ofthe stimulus was not relevant to the tasks. Nevertheless, althoughthe tactile texture was not attended to as part of the response set,it influenced performance. There was also some suggestion that theeffect of the tactile texture was strongest under conditions ofinattention. This was confirmed in Experiment 4, in which thetactile texture also had to be reported, with the effect that cross-modal ICs to the visual stimuli did not occur any more. Also,cross-modal ICs were maximized for normal participants whenthey felt (and attended to) a constant texture with their preferred(right) hand, when migrations increased from the texture felt withthe left hand to the visual stimulus presented in the left visual field(Experiment 2). We suggest that textures felt by the left hand wereunattended in this condition. The errors found in patient M.H. arealso consistent with this. Damage to the parietal lobe is associatedwith impairments of attention, particularly to the contralesional
Table 11Parameters and Outcomes Produced by the Model for Each Participant in Experiment 6
Participant GOF index
Parameters Responses (%)
ICs�VT �VT �TT CC CV/VC CF/FC Other
1 0.000386 0.84 1.00 1.00 88.80 5.52 5.33 0.30 �2.789 0.000097 0.79 1.00 1.00 88.50 5.62 5.62 0.27 �1.3914 0.000025 0.91 1.00 1.00 94.59 2.70 2.70 0.00 �0.6910 0.000003 0.89 0.91 1.00 93.80 3.23 2.82 0.07 0.6916 0.000003 0.94 0.89 1.00 96.83 1.79 1.22 0.10 0.692 0.000012 0.87 0.85 1.00 91.83 4.54 3.03 0.36 1.394 0.000009 1.00 0.80 1.00 97.21 1.78 0.51 0.44 1.3912 0.000047 0.94 1.00 0.85 96.75 1.81 0.97 0.39 1.396 0.000013 0.50 0.89 1.00 68.98 15.77 14.21 0.64 1.397 0.000022 0.94 0.78 1.00 92.43 4.42 2.31 0.60 2.085 0.000146 0.95 1.00 0.74 92.69 4.22 1.63 1.21 2.7813 0.000039 0.95 0.74 1.00 93.61 3.98 1.52 0.69 2.7815 0.000039 0.95 0.74 1.00 93.23 4.21 1.74 0.61 2.783 0.000061 0.95 0.70 1.00 91.08 5.87 1.72 1.03 3.4711 0.000125 0.86 0.66 1.00 88.50 7.02 2.96 1.07 4.868 0.000188 0.62 0.66 1.00 71.28 15.72 10.99 1.00 5.56Average 0.000016 0.86 0.83 1.00 92.45 4.17 2.99 0.20 1.65
Note. The first column lists each participant’s number; participants were ordered according to frequency of ICs(the difference between conjunction and feature errors; see the ICs column). The second column lists goodness-of-fit (GOF) index values. The third–fifth columns list the values for the parameters of the model (�VT �probability of correctly perceiving or identifying the visual textures; �VT � probability of binding the visualtextures to the right location; �TT � probability of binding the tactile texture to the right location). Thesixth–ninth columns list the percentages of responses for each response category (CC � both stimuli correct;CV/VC � one correct and one visual3tactile conjunction error; CF/FC � one correct and one texture featureerror; Other � other errors). ICs � illusory conjunctions.
Figure 6. Results for parameter �VT (r � �.81, p � .01) from the modelsimulation of Experiment 6, in relation to the difference between conjunc-tion and feature errors for each participant. �VT � probability of bindingthe visual textures to the right location; ICs � illusory conjunctions.
1260 CINEL, HUMPHREYS, AND POLI

side (and note M.H.’s pattern of right-side extinction, which isconsistent with an attention deficit). M.H. showed high numbers ofcross-modal ICs even with prolonged presentation of the visualstimuli, and these tended to be greater when visual stimuli fell onhis contralesional side (in the right visual field). We propose thatthese errors arose when insufficient attention was allocated to thefelt texture, enabling it to compete for selection with the seentextures.
Cross-Modal ICs in Perception or Memory?
In Experiments 3, 4, and 5, we also provided explicit tests ofwhether the cross-modal ICs were due to memory failures ratherthan to impaired perceptual binding of stimulus to modality. On nooccasion did we find evidence for the errors arising in memory.Thus, in Experiment 3, cross-modal ICs were found under forced-choice conditions, and they were particularly represented in falsepositive errors on absent trials (they were less likely to be reflectedin full report errors on present trials). In Experiment 5, the parietalpatient M.H. did not make cross-modal ICs errors when the visualstimuli were presented before the tactile stimuli, even though thestimuli then had to be retained for longer. In Experiment 4, we hadparticipants report the tactile texture in addition to the visualshapes and texture. Again, this increased the report load of thetask; however, in this case, attention was more likely to be paid tothe tactile texture (relative to when it was irrelevant to report).Despite the greater stress on memory, no cross-modal ICs wereapparent. Our data suggest that the cross-modal errors were fail-ures of perceptual binding rather than memory.
The empirical conclusions from Experiments 3–5 are supportedby the formal models developed to account for performance. Thebest fitting models had a parameter specifying the likelihood thatmodality-specific binding occurred, and variations in this param-eter across participants predicted the magnitude of cross-modalICs (relative to feature errors). This formal account again holdsthat cross-modal ICs are perceptual in nature.
Cross-Modal Integration
The present evidence for cross-modal ICs suggests that there ismultimodal integration of sensory information in perception sothat misattributions of modalities arise under conditions of inat-tention. The argument for cross-modal integration of sensory in-formation is supported by the recent work, noted in the introduc-tion, on cross-modal influences on attentional orienting (see Driver& Spence, 1998a, 1998b). For instance, evidence of visual–tactilelinks in spatial endogenous attention has been found, suggestingthat spatial distribution of endogenous attention in one modalitytends to spread in other modalities (Spence et al., 2000). There isalso older literature on perceptual dominance (e.g., see Klein &Posner, 1974; Posner, Nissen, & Klein, 1976), which shows that,when competing information is presented across two sensory mo-dalities, there can be competition with information in one modalitytending to dominate. For example, when either vision and touch orvision and audition are set in opposition, vision typically domi-nates (e.g., see Bertelson, 1998; Gibson, 1933; MacDonald &McGurk, 1978). In the present case, we did not pit touch and visionagainst one another, but rather assessed whether there are influ-ences carried over implicitly from one modality to another. We
found effects from touch on vision as well as effects from visionto touch. This is consistent with previous findings showing thatvision does not necessarily dominate over touch. For instance, in astudy investigating visual dominance over touch, Klein (1977)found that the effects of an unattended visual distractor on thedetection of a tactile target are the same as the effects of a tactiledistractor on the detection of a visual target. More recent studieshave shown that there are cross-modal links in spatial attention, sothat, for example, a tactile cue can influence the orientation ofvisual attention and vice versa (Driver & Spence, 1998b). Itappears that either visual or tactile information, coded implicitly,influences each other in perceptual judgments.
One potential locus for cross-modal integration in the brain isthe parietal lobe, which is also known to play an important role inspatial attention (e.g., Andersen, Snyder, Bradley, & Xing, 1997;Banati, Goerres, Tjoa, Aggleton, & Grasby, 2000; Macaluso, Frith,& Driver, 2000a, 2000b). For example, in a tactile–visual match-ing task in which participants had to make a cross-modal matchbetween a tactile stimulus and some visual stimuli, Banati et al.(2000) found that the inferior parietal lobes were among the areaswhere an increased activity was detected. The data from Experi-ment 5 here also indicate that cross-modal integration can bedisrupted after parietal damage, so that even with relatively longvisual presentation conditions, an observer may tend to report a felttexture as being seen. It is possible that the normal cross-modalintegration process involves tagging information to coregister itwith information from other modalities. Parietal damage maydisrupt the ability to read such tags, so that inputs are misattributedto the wrong modality of origin.
References
Andersen, R. A., Snyder, L. H., Bradley, D. C., & Xing, J. (1997).Multimodal representation of space in the posterior parietal cortex andits use in planning movement. Annual Review in Neuroscience, 20,303–330.
Ashby, F. G., Prinzmetal, W., Ivry, R., & Maddox, W. T. (1996). A formaltheory of feature binding in object perception. Psychological Review,103, 165–192.
Banati, R. B., Goerres, G. W., Tjoa, C., Aggleton, J. P., & Grasby, P.(2000). The functional anatomy of visual–tactile integration in man: Astudy using positron emission tomography. Neuropsychologia, 38, 115–124.
Bertelson, P. (1998). Starting from the ventriloquist: The perception ofmultimodal events. In M. Sabourin, F. I. M. Craik, & M. Rober (Eds.),Advances in psychological sciences: Vol. 1. Biological and cognitiveaspects. Hove, England: Psychology Press.
Buchtel, H. A., & Butter, C. M. (1988). Spatial attention shifts: Implicationfor the role of polysensory mechanisms. Neuropsychologia, 26, 499–509.
Butter, C. M., Buchtel, H. A., & Santucci, R. (1989). Spatial attentionalshifts: Further evidence for the role of polysensory mechanisms usingvisual and tactile stimuli. Neuropsychologia, 27, 1231–1240.
Cohen, A., & Ivry, R. (1989). Illusory conjunctions inside and outside thefocus of attention. Journal of Experimental Psychology: Human Per-ception and Performance, 15, 650–663.
Cohen, A., & Rafal, R. D. (1991). Attention and feature integration:Illusory conjunctions in a patient with a parietal lobe lesion. Psycholog-ical Science, 2, 106–110.
Cytowic, R. E. (1989). Synesthesia: A union of the senses. New York:Springer-Verlag.
Donk, M. (1999). Illusory conjunctions are illusions: The effect of target–
1261CROSS-MODAL ILLUSORY CONJUNCTIONS

nontarget similarity on conjunction and feature errors. Journal of Ex-perimental Psychology: Human Perception and Performance, 25, 1207–1233.
Driver, J., & Spence, C. (1998a). Attention and the cross-modal construc-tion of space. Trends in Cognitive Science, 2, 254–262.
Driver, J., & Spence, C. (1998b). Cross-modal links in spatial attention.Philosophical Transactions of the Royal Society of London, Series B,353, 1319–1331.
Duncan, J. (1980). The locus of interference in the perception of simulta-neous stimuli. Psychological Review, 87, 272–300.
Farah, M. J., Wong, A. B., Monheit, M. A., & Morrow, L. A. (1989).Parietal lobe mechanisms of spatial attention: Modality specific orsupramodal? Neuropsychologia, 27, 461–470.
Friedman-Hill, S. R., Robertson, L. C., & Treisman, A. (1995, August 11).Parietal contribution to visual feature binding: Evidence from a patientwith bilateral lesion. Science, 269, 853–855.
Gibson, J. J. (1933). Adaptation, after-effect and contrast in the perceptionof curved lines. Journal of Experimental Psychology, 16, 1–31.
Hall, M. D., Pastore, R. E., Acker, B. E., & Huang, W. (2000). Evidencefor auditory feature integration with spatially distributed items. Percep-tion & Psychophysics, 62, 1243–1257.
Heller, M. A. (1982). Visual and tactual texture perception: Intersensorycooperation. Perception & Psychophysics, 31, 339–344.
Humphreys, G. W., Cinel, C., Wolfe, J., Olson, A., & Klempen, N. (2000).Fractionating the binding process: Neuropsychological evidence distin-guishing binding of form from binding of surface features. VisionResearch, 40, 1569–1596.
Jones, B., & O’Neil, S. (1985). Combining vision and touch in textureperception. Perception & Psychophysics, 37, 66–72.
Khurana, B. (1998). Visual structure and the integration of form and colorinformation. Journal of Experimental Psychology: Human Perceptionand Performance, 24, 1766–1785.
Klatzky, R. L., Lederman, S. J., & Matula, D. E. (1993). Haptic explorationin the presence of vision. Journal of Experimental Psychology: HumanPerception and Performance, 19, 726–743.
Klein, R. M. (1977). Attention and visual dominance: A chronometricanalysis. Journal of Experimental Psychology: Human Perception andPerformance, 3, 365–378.
Klein, R. M., & Posner, M. I. (1974). Attention to visual and kinestheticcomponent of skills. Brain Research, 71, 401–411.
Lederman, S. J., & Abbott, S. G. (1981). Texture perception: Studies ofintersensory organization using a discrepancy paradigm, and visualversus tactile psychophysics. Journal of Experimental Psychology: Hu-man Perception and Performance, 4, 902–915.
Lederman, S. J., Thorne, G., & Jones, B. (1986). Perception of texture byvision and touch: Multidimensionality and intersensory integration.Journal of Experimental Psychology: Human Perception and Perfor-mance, 12, 169–180.
Macaluso, E., Frith, C., & Driver, J. (2000a, August 18). Modulation ofhuman visual cortex by crossmodal spatial attention. Science, 289,1206–1208.
Macaluso E., Frith C., & Driver J. (2000b). Selective spatial attention invision and touch: Unimodal and multimodal mechanisms revealed byPET. Journal of Neurophysiology, 83, 3062–3075.
MacDonald, J., & McGurk, H. (1978). Visual influences on speech per-ception. Perception & Psychophysics, 24, 253–257.
Mattingley, J. B., Driver, J., Beschin, N., & Robertson, I. J. (1997).Attentional competition between modalities: Extinction between touchand vision after right hemisphere damage. Neuropsychologia, 35, 867–880.
McClelland, J. L., & Johnston, J. C. (1977). The role of familiar units in
perception of words and nonwords. Perception & Psychophysics, 22,249–261.
McGurk, H., & MacDonald, J. (1976, December 23–30). Hearing lips andseeing voices: A new illusion. Nature, 264, 746–748.
Posner, M. I., Nissen, M. J., & Klein, R. M. (1976). Visual dominance: Aninformation-processing account of its origins and significance. Psycho-logical Review, 83, 157–171.
Prinzmetal, W. (1981). Principles of feature integration in visual attention.Perception & Psychophysics, 30, 330–340.
Prinzmetal, W., Henderson, D., & Ivry, R. (1995). Loosening the con-straints on illusory conjunctions: Assessing the roles of exposure dura-tion and attention. Journal of Experimental Psychology: Human Per-ception and Performance, 21, 1362–1375.
Prinzmetal, W., Ivry, R., Beck, D., & Shimizu, N. (2002). A measurementtheory of illusory conjunctions. Journal of Experimental Psychology:Human Perception and Performance, 28, 251–269.
Reicher, G. M. (1969). Perceptual recognition as a function of meaning-fulness of stimulus material. Journal of Experimental Psychology, 81,275–289.
Riddoch, M. J. (2002). [Report of investigations with the patient M.H.].Unpublished report (updated regularly). Edgbaston, United Kingdom:The University of Birmingham.
Rock, I., & Victor, J. (1964, February 7). Vision and touch: An experi-mentally created conflict between the two senses. Science, 143, 594–596.
Spence, C., & Driver, J. (1997). Audiovisual links in exogenous covertspatial orienting. Perception & Psychophysics, 59, 1–22.
Spence, C., & Driver, J. (1998). Cross-modal links in exogenous covertspatial orienting between touch, audition and vision. Perception &Psychophysics, 60, 544–557.
Spence, C., Nicholls, M. E. R, Gillespie, N., & Driver, J. (1998). Cross-modal links in exogenous covert spatial orienting between touch, audi-tion, and vision. Perception & Psychophysics, 60, 544–557.
Spence, C., Pavani, F., & Driver, J. (2000). Crossmodal links betweenvision and touch in covert endogenous spatial attention. Journal ofExperimental Psychology: Human Perception and Performance, 26,1298–1319.
Stein, B. E., & Wallace, M. T. (1996). Comparison of cross-modalityintegration in midbrain and cortex. Progress in Brain Research, 112,289–299.
Stein, B. E., & Wallace, M. T. (1999). The integration of multiple sensorysignals in cortical neurons. Brain and Cognition, 40, 22–23.
Treisman, A. (1988). Features and objects—The 14th Bartlett memoriallecture. Quarterly Journal of Experimental Psychology: Human Exper-imental Psychology, 40(A), 201–237.
Treisman, A. (1998). Feature binding, attention and object perception.Philosophical Transactions of the Royal Society of London, Series B,353, 1295–1306.
Treisman, A., & Gelade, G. (1980). A feature integration theory of atten-tion. Cognitive Psychology, 12, 97–136.
Treisman, A., & Schmidt, H. (1982). Illusory conjunctions in the percep-tion of objects. Cognitive Psychology, 14, 107–141.
Virzi, R. A., & Egeth, H. E. (1984). Is meaning implicated in illusoryconjunctions? Journal of Experimental Psychology: Human Perceptionand Performance, 10, 573–580.
Warrington, E. K., & James, M. (1991). VOSP: The visual object and spaceperception battery. Bury St. Edmunds, Suffolk, England: Thames ValleyTest Company.
Wheeler, D. D. (1970). Processes in word recognition. Cognitive Psychol-ogy, 1, 59–85.
Wilson, B. A., & Cockburn, J. (1987). Behavioural inattention test. BurySt. Edmunds, Suffolk, England: Thames Valley Test Company.
1262 CINEL, HUMPHREYS, AND POLI
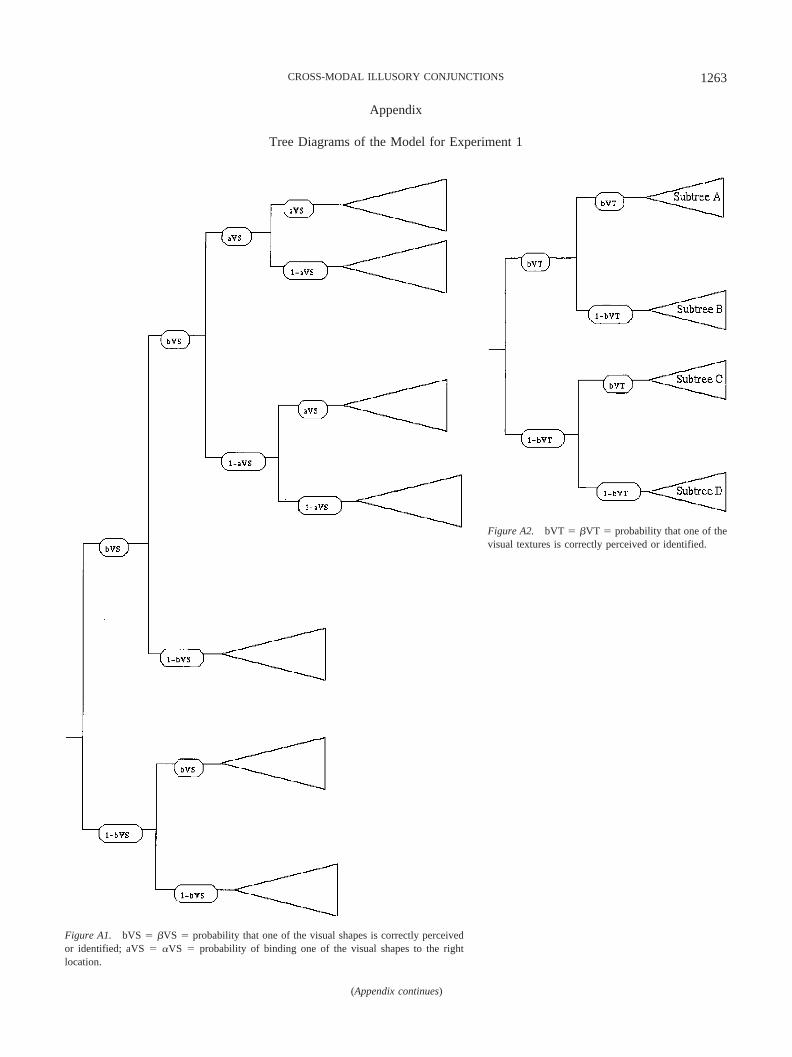
Appendix
Tree Diagrams of the Model for Experiment 1
Figure A1. bVS � �VS � probability that one of the visual shapes is correctly perceivedor identified; aVS � �VS � probability of binding one of the visual shapes to the rightlocation.
(Appendix continues)
Figure A2. bVT � �VT � probability that one of thevisual textures is correctly perceived or identified.
1263CROSS-MODAL ILLUSORY CONJUNCTIONS

Figure A3. aVT � �VT � probability of binding one of the visual textures to the right location; CC � bothstimuli reported correctly; aTT � �TT � probability of binding the tactile texture to the right location; CT andTC � one stimulus correct and one with a tactile3visual conjunction error; VV � visual conjunction error; VTand TV � one stimulus with a visual conjunction error and one with a tactile3visual conjunction error.
1264 CINEL, HUMPHREYS, AND POLI
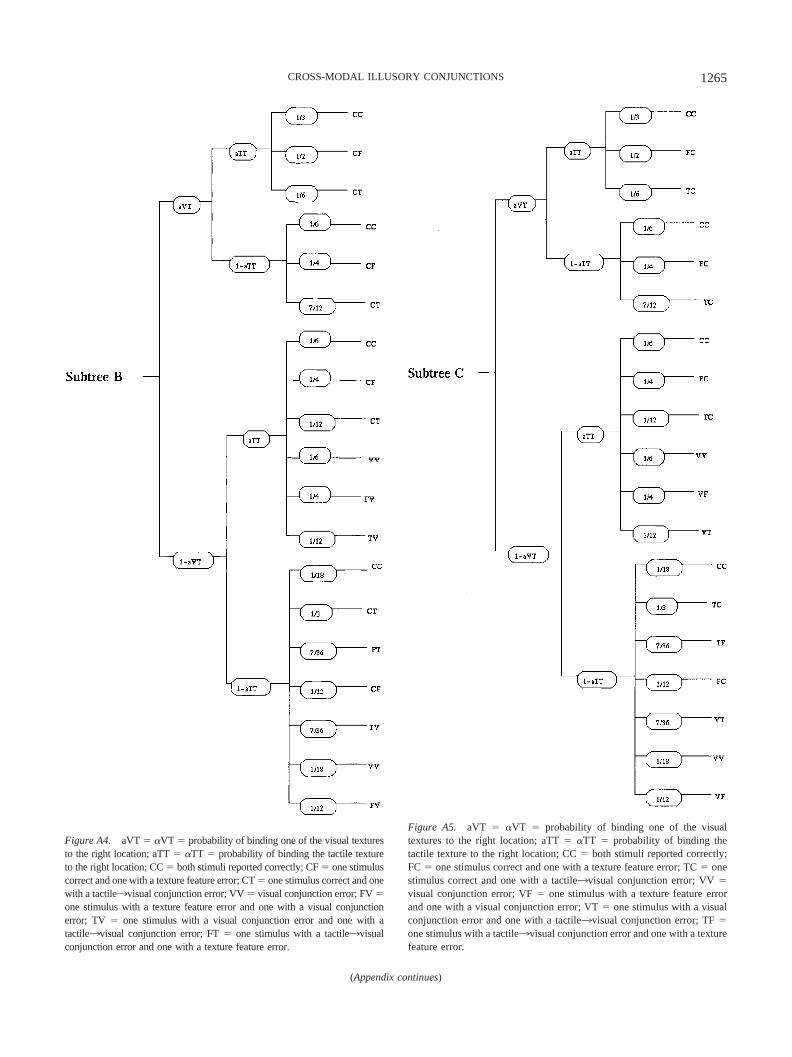
Figure A4. aVT � �VT � probability of binding one of the visual texturesto the right location; aTT � �TT � probability of binding the tactile textureto the right location; CC � both stimuli reported correctly; CF � one stimuluscorrect and one with a texture feature error; CT � one stimulus correct and onewith a tactile3visual conjunction error; VV � visual conjunction error; FV �one stimulus with a texture feature error and one with a visual conjunctionerror; TV � one stimulus with a visual conjunction error and one with atactile3visual conjunction error; FT � one stimulus with a tactile3visualconjunction error and one with a texture feature error.
Figure A5. aVT � �VT � probability of binding one of the visualtextures to the right location; aTT � �TT � probability of binding thetactile texture to the right location; CC � both stimuli reported correctly;FC � one stimulus correct and one with a texture feature error; TC � onestimulus correct and one with a tactile3visual conjunction error; VV �visual conjunction error; VF � one stimulus with a texture feature errorand one with a visual conjunction error; VT � one stimulus with a visualconjunction error and one with a tactile3visual conjunction error; TF �one stimulus with a tactile3visual conjunction error and one with a texturefeature error.
1265CROSS-MODAL ILLUSORY CONJUNCTIONS
(Appendix continues)
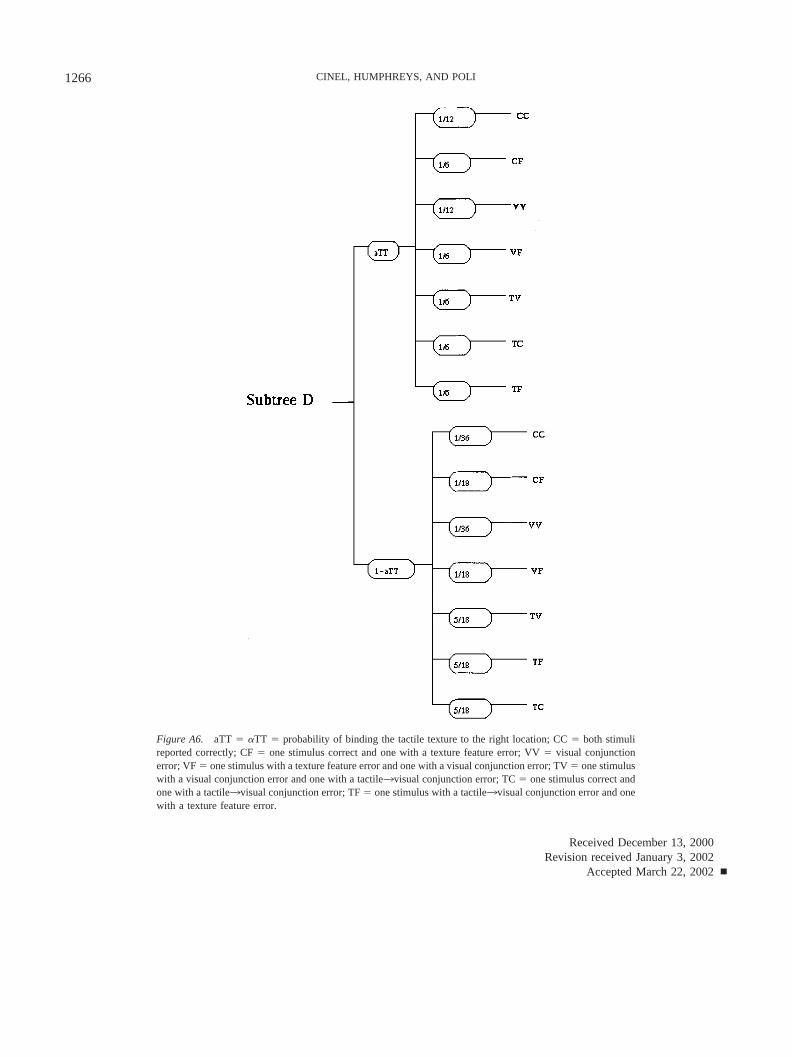
Received December 13, 2000Revision received January 3, 2002
Accepted March 22, 2002 �
Figure A6. aTT � �TT � probability of binding the tactile texture to the right location; CC � both stimulireported correctly; CF � one stimulus correct and one with a texture feature error; VV � visual conjunctionerror; VF � one stimulus with a texture feature error and one with a visual conjunction error; TV � one stimuluswith a visual conjunction error and one with a tactile3visual conjunction error; TC � one stimulus correct andone with a tactile3visual conjunction error; TF � one stimulus with a tactile3visual conjunction error and onewith a texture feature error.
1266 CINEL, HUMPHREYS, AND POLI