Embed Size (px)
Citation preview
Atherosclerosis 321 (2021) 21–29
Available online 8 February 20210021-9150/© 2021 The Author(s). Published by Elsevier B.V. This is an open access article under the CC BY license (http://creativecommons.org/licenses/by/4.0/).
Cross-sectional and prospective associations between aerobic fitness and lipoprotein particle profile in a cohort of Norwegian schoolchildren
Paul Remy Jones a,*, Tarja Rajalahti b,c, Geir Kåre Resaland c,d, Eivind Aadland e, Jostein Steene-Johannessen a, Sigmund Alfred Anderssen a,e, Tone Frost Bathen f, Trygve Andreassen g, Olav Martin Kvalheim b, Ulf Ekelund a
a Department of Sports Medicine, Norwegian School of Sport Sciences, Oslo, Norway b Department of Chemistry, University of Bergen, Bergen, Norway c Førde Health Trust, Førde, Norway d Center for Physically Active Learning, Faculty of Education, Arts and Sports, Campus Sogndal, Western Norway University of Applied Sciences, Sogndal, Norway e Department of Sport, Food and Natural Sciences, Western Norway University of Applied Sciences, Sogndal, Norway f Department of Circulation and Medical Imaging, NTNU — Norwegian University of Science and Technology, Trondheim, Norway g MR Core Facility, Department of Circulation and Medical Imaging, NTNU — Norwegian University of Science and Technology, Trondheim, Norway
A R T I C L E I N F O
Keywords: Lipoproteins Metabolomics Fitness Children Adiposity
A B S T R A C T
Background and aims: The associations between aerobic fitness and traditional measures of lipid metabolism in children are uncertain. We investigated whether higher levels of aerobic fitness benefit lipoprotein metabolism by exploring associations with a comprehensive lipoprotein particle profile. Methods: In our prospective cohort study, we used targeted proton nuclear magnetic resonance (1H NMR) spectroscopy to profile 57 measures of lipoprotein metabolism from fasting serum samples of 858 fifth-grade Norwegian schoolchildren (49.0% girls; mean age 10.0 years). Aerobic fitness was measured using an inter-mittent shuttle run aerobic fitness test. We used multiple linear regression adjusted for potential confounders to examine cross-sectional and prospective associations between aerobic fitness and lipoprotein particle profile. Results: Higher levels of aerobic fitness were associated with a favourable lipoprotein particle profile in the cross- sectional analysis, which included inverse associations with all measures of very low-density lipoprotein (VLDL) particles (e.g., − 0.06 mmol⋅L− 1 or –0.23 SD units; 95% CI = − 0.31, − 0.16 for VLDL cholesterol concentration). In the prospective analysis, the favourable pattern of associations persisted, though the individual associations tended to be more consistent with those of the cross-sectional analysis for the VLDL subclass measures compared to the low-density lipoproteins and high-density lipoproteins. Adjustment for adiposity attenuated the associa-tions in both cross-sectional and prospective models. Nevertheless, an independent effect of aerobic fitness remained for some measures. Conclusions: Improving children’s aerobic fitness levels should benefit lipoprotein metabolism, though a concomitant reduction in adiposity would likely potentiate this effect.
1. Introduction
Higher levels of aerobic fitness in young adulthood are beneficially associated with a number of health outcomes in later life, including all- cause mortality and cardiovascular disease (CVD) [1]. In children, low aerobic fitness is strongly associated with clustered cardiometabolic risk [2]. Clustered cardiometabolic risk factors typically include clinical measures of lipid metabolism, such as blood triglycerides concentration,
dependent on the particular risk construct applied in studies. However, associations of aerobic fitness with individual measures of lipid meta-bolism are uncertain [3]. It is also unclear whether these associations are independent of adiposity or physical activity. Furthermore, the tradi-tional clinical markers are limited in that they quantify a certain few lipoprotein lipid concentrations and provide no information on particle size or particle number, the latter of which is increasingly recognised as potentially the primary causative factor in atherogenesis, not the lipid
* Corresponding author. Department of Sports Medicine, Norwegian School of Sport Sciences, Post Box 4014, Ullevål Stadion, 0806, Oslo, Norway. E-mail address: [email protected] (P.R. Jones).
Contents lists available at ScienceDirect
Atherosclerosis
journal homepage: www.elsevier.com/locate/atherosclerosis
https://doi.org/10.1016/j.atherosclerosis.2021.02.002 Received 25 February 2020; Received in revised form 25 January 2021; Accepted 4 February 2021
Atherosclerosis 321 (2021) 21–29
22
load [4]. Nor can these measures demonstrate divergent directions of associations among lipoprotein subclasses, such as those observed for high-density lipoprotein (HDL) subclass concentrations with long-term leisure-time physical activity, adiposity, and risk of ischaemic stroke [5–7]. By providing a more nuanced description, metabolic profiling of the lipidome—lipidomics—can reveal more of the complexity of bio-logical processes and interactions with environmental and lifestyle ex-posures, hence generate novel insights and hypotheses.
Our aim was to examine the cross-sectional and prospective associ-ations between aerobic fitness and a comprehensive lipoprotein particle profile across the school year using targeted proton nuclear magnetic resonance (1H NMR) spectroscopy in a large cohort of Norwegian schoolchildren. As secondary aims, we examined potential confounding by adiposity and whether the associations were independent of moder-ate- to vigorous-intensity physical activity (MVPA).
2. Materials and methods
Additional methods are reported in the Supplementary Material.
2.1. Study population
We analysed data from the Active Smarter Kids (ASK) study. The ASK study was a cluster randomised controlled trial that investigated the effect of a seven-month school-based physical activity intervention on academic performance of fifth-grade schoolchildren in Sogn and Fjor-dane county, western Norway (https://clinicaltrials.gov, #NCT02132494) [8]. Sixty schools (1202 children) were approached, 57 of which agreed to participate (1129 children). Baseline testing of eligible children took place in 2014; follow-up testing eight months later. No differences were observed for levels of objectively measured physical activity or sedentary time between the intervention or control schools at either baseline or follow-up, hence we pooled the entire ASK study sample as one cohort for the present study [8]. The Regional Committee for Medical Research Ethics approved the study protocol. Written consent was obtained from each child’s parent(s) or legal guardian(s) and from school authorities prior to testing. Procedures and methods abide by the World Medical Association’s Declaration of Hel-sinki [9].
2.2. Assessment of aerobic fitness
Aerobic fitness was measured using the Andersen aerobic fitness test—an intermittent shuttle run test—performed according to standard procedures [10]. Study research assistants recorded the total distance (m) covered for each child. The Andersen test has been shown to be valid for estimating aerobic fitness at the group level in a cohort of similarly aged children and is used as a proxy for peak VO2 [10]. Distance run was used as the main exposure rather than applying a prediction equation to estimate peak VO2.
2.3. Assessment of lipoprotein measures
Overnight fasting blood samples for each child were drawn between 0800 and 1000 by a trained nurse or phlebotomist. Typically, these samples were taken within one week, and no more than one month, of the date of fitness testing.
Nuclear magnetic resonance spectra were recorded on a Bruker Avance III 600 MHz spectrometer, equipped with a QCI CryoProbe and automated sample changer (Bruker BioSpin GmbH, Karlsruhe, Ger-many). Spectral regions quantitatively associated to lipoprotein con-centrations were selected as explanatory variables to partial least squares (PLS) modelling, performed for 106 randomly selected serum samples analysed by both 1H NMR and high-performance liquid chro-matography (HPLC) [11]. A Monte Carlo resampling approach was used to calculate individual PLS models with optimal prediction ability for
the HPLC data [12]. Lipoprotein particle numbers for all samples were subsequently predicted from these models, and the 20 lipoprotein sub-classes were reduced to 15 [13]. Given the elution of lipid-poor pre-β1 HDLs, only the HDL6 subclass measure was used when calculating the particle number for the HDL VS subclass [14]. Lipoprotein measures available for subsequent analysis comprised: total serum cholesterol concentration; total triglycerides concentration; non-HDL cholesterol concentration (calculated by subtracting HDL cholesterol concentration from the total cholesterol concentration); particle number, cholesterol concentration and triglycerides concentration of 15 lipoprotein sub-classes; and average particle diameter of very low-density lipoprotein (VLDL), low-density lipoprotein (LDL), and HDL particles. Though intact chylomicron particles cannot be distinguished from the largest VLDL particles using NMR spectroscopy, the nomenclature from the HPLC method, which does distinguish the two, was retained. For consistency, the chylomicron subclass was not incorporated when calculating mea-sures of the VLDL class: VLDL cholesterol concentration, VLDL tri-glycerides concentration, or average VLDL particle size. However, given that the blood samples were drawn subsequent to an overnight fast, it is unlikely that these particles are of intestinal origin and should be considered very large VLDLs as opposed to chylomicrons [15].
2.4. Moderate- to vigorous-intensity physical activity
The children wore triaxial accelerometers (ActiGraph GT3X+, Acti-Graph LLC, Pensacola, FL) positioned on their right hip for seven consecutive days, but not during sleep or water-based activities. A valid day was considered as ≥480 min of monitor wear time between 0600 and 0000. Non-wear time was defined as ≥20 min of zero counts [16]. The accelerometer data were processed using commercially available Kinesoft software (version 3.3.80, KineSoft, Loughborough, United Kingdom) and 10-s epochs. Moderate- to vigorous-intensity physical activity was classified using the Evenson cut points of count data, which included all activity above the moderate-intensity physical activity (MPA) cut point (≥2296 counts⋅min− 1) [17,18].
2.5. Anthropometrics
Height was measured to the nearest 0.1 cm using a portable stadi-ometer, shoes removed, facing forwards (Seca 217, SECA GmbH, Hamburg, Germany); weight to the nearest 0.1 kg using an electronic scale (Seca 899, SECA GmbH, Hamburg, Germany). Body mass index (BMI) was calculated as weight divided by the square of height (kg⋅m− 2). Waist circumference was measured twice to the nearest 0.1 cm between the lower rib and iliac crest using a measuring tape (Seca 201, SECA GmbH, Hamburg, Germany), the child having gently exhaled. A third measurement was taken if the two differed by more than 1.0 cm. The mean of the two measurements with the least difference was used for analysis. Proportions of girls and boys classified as either overweight or obese were calculated using the International Obesity Task Force’s (IOTF) sex-specific BMI cut-offs [19]. The children’s ages at the time of testing were rounded down to the nearest half-year to provide conser-vative prevalence estimates.
2.6. Sexual maturity
The children self-reported their sexual maturity with reference to a standard set of colour images with accompanying descriptions corre-sponding to the Tanner staging method [20]. Low frequencies were recorded in Tanner categories 3, 4, and 5 (n = 66, 5, and 2, respectively of 1081 children with valid data at baseline), hence they were collapsed to one category for analysis (≥3).
2.7. Socioeconomic status
Socioeconomic status (SES) was quantified as the highest level of
P.R. Jones et al.
Atherosclerosis 321 (2021) 21–29
23
educational attainment of either the child’s mother, father, or guardian, whichever was the higher. Parent(s) or guardian(s) completed a custom self-report questionnaire, selecting their level of educational attainment as one of six categories. Of the six, low frequencies were recorded in the lower four categories (n = 4, 15, 193, and 137 for categories 1–4, respectively of 1069 children with valid data), so were combined into one category “Upper secondary school” for analysis.
2.8. Statistical approach
We examined cross-sectional associations between aerobic fitness and 57 lipoprotein variables measured at baseline using separate linear regression models. Each model was adjusted for sex and parent’s/ guardian’s education, and the baseline values of age and sexual matu-rity. To examine prospective associations, we regressed the 57 lipopro-tein variables measured at follow-up on aerobic fitness measured at baseline. In addition to the covariates in the cross-sectional models, the baseline value of each respective lipoprotein variable was included.
To investigate potential confounding by adiposity on the associations between aerobic fitness and the lipoprotein measures, we first included baseline waist circumference in the cross-sectional and prospective aerobic fitness models. To compare the magnitudes of main effects of aerobic fitness and waist circumference, cross-sectional and prospective associations between waist circumference and the lipoprotein particle profile were examined, adjusting for the same covariates as in the aer-obic fitness models. We also examined the cross-sectional and prospec-tive associations between waist circumference and aerobic fitness, adjusting for the same covariates as in the aerobic fitness models, and additionally for aerobic fitness at baseline in the prospective model. Lastly, to assess whether the associations between aerobic fitness and the lipoprotein measures were independent of MVPA, we repeated each analysis additionally including baseline average daily MVPA as a covariate.
Aerobic fitness and all lipoprotein variables were converted to z- scores (mean = 0.0; SD = 1.0). Hence, regression coefficients represent the SD unit change in lipoprotein measure for a 1 SD increase in aerobic fitness. When examined as the primary exposure, the z-score of waist circumference was used. To account for potential within-cluster corre-lation and to obviate the need to transform skewed outcome variables, cluster and heteroscedasticity robust standard errors were calculated, clustered on school. To estimate the effective number of independent tests for multiple testing correction, principal component analysis (PCA) was used. The rationale for this method has been described previously and applied in a number of metabolic profile studies [21–23]. Five principal components explained >95% of the variance. Hence, the Bonferroni-corrected alpha threshold for assessing associations was 0.05/5 = 0.01 (p < 0.01). For each outcome, the coefficients were re-ported in both absolute units and standardised units. The 95% confi-dence intervals (CIs) were given in standardised units. For each analysis, the sample comprised those children with valid data for each variable included in the respective regression model and hence the size varies.
We performed all statistical analyses in R version 3.6.3 [24]. In addition to base R functions, we used a variety of packages within the tidyverse (1.3.0) suite for data manipulation. We performed the linear regression analysis using the estimatr (0.22.0) package, specifically the lm_robust function. We plotted the results with ggplot2 (3.3.0) and the custom visualisation functions geom_stripes and facet_col available in the ggforestplot (0.0.2) and ggforce (0.3.1) packages, respectively.
3. Results
3.1. Sample characteristics
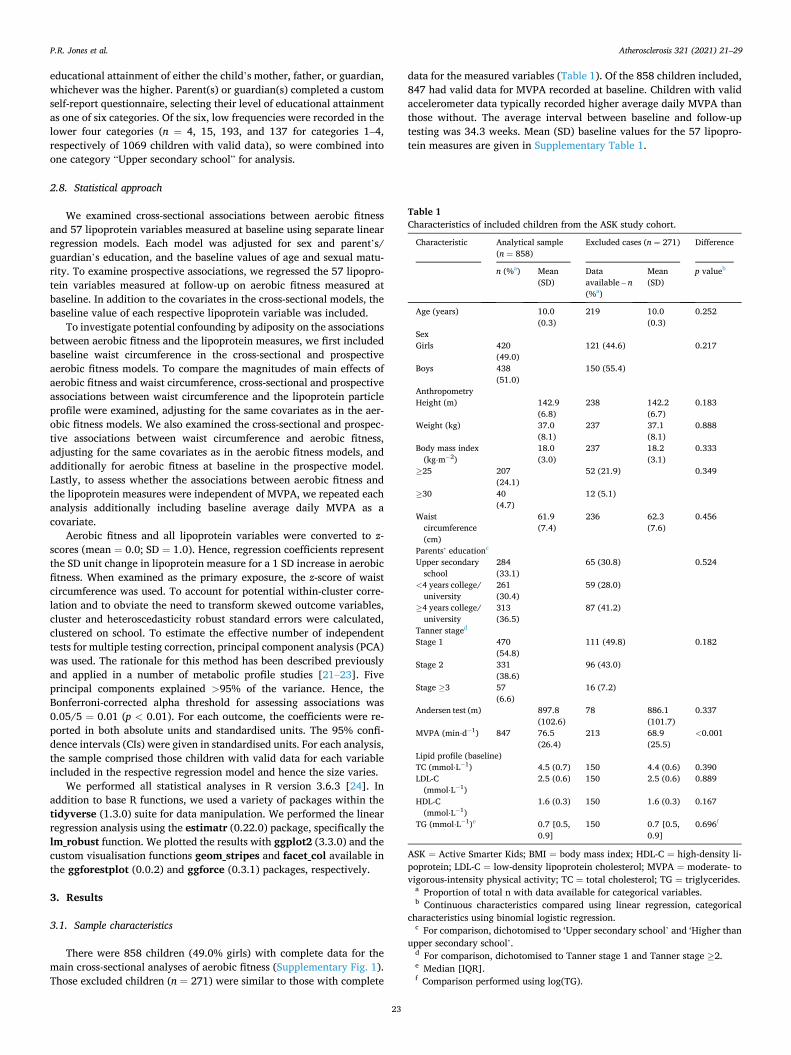
There were 858 children (49.0% girls) with complete data for the main cross-sectional analyses of aerobic fitness (Supplementary Fig. 1). Those excluded children (n = 271) were similar to those with complete
data for the measured variables (Table 1). Of the 858 children included, 847 had valid data for MVPA recorded at baseline. Children with valid accelerometer data typically recorded higher average daily MVPA than those without. The average interval between baseline and follow-up testing was 34.3 weeks. Mean (SD) baseline values for the 57 lipopro-tein measures are given in Supplementary Table 1.
Table 1 Characteristics of included children from the ASK study cohort.
Characteristic Analytical sample (n = 858)
Excluded cases (n = 271) Difference
n (%a) Mean (SD)
Data available – n (%a)
Mean (SD)
p valueb
Age (years) 10.0 (0.3)
219 10.0 (0.3)
0.252
Sex Girls 420
(49.0) 121 (44.6) 0.217
Boys 438 (51.0)
150 (55.4)
Anthropometry Height (m) 142.9
(6.8) 238 142.2
(6.7) 0.183
Weight (kg) 37.0 (8.1)
237 37.1 (8.1)
0.888
Body mass index (kg⋅m− 2)
18.0 (3.0)
237 18.2 (3.1)
0.333
≥25 207 (24.1)
52 (21.9) 0.349
≥30 40 (4.7)
12 (5.1)
Waist circumference (cm)
61.9 (7.4)
236 62.3 (7.6)
0.456
Parents’ educationc
Upper secondary school
284 (33.1)
65 (30.8) 0.524
<4 years college/ university
261 (30.4)
59 (28.0)
≥4 years college/ university
313 (36.5)
87 (41.2)
Tanner staged
Stage 1 470 (54.8)
111 (49.8) 0.182
Stage 2 331 (38.6)
96 (43.0)
Stage ≥3 57 (6.6)
16 (7.2)
Andersen test (m) 897.8 (102.6)
78 886.1 (101.7)
0.337
MVPA (min⋅d− 1) 847 76.5 (26.4)
213 68.9 (25.5)
<0.001
Lipid profile (baseline) TC (mmol⋅L− 1) 4.5 (0.7) 150 4.4 (0.6) 0.390 LDL-C
(mmol⋅L− 1) 2.5 (0.6) 150 2.5 (0.6) 0.889
HDL-C (mmol⋅L− 1)
1.6 (0.3) 150 1.6 (0.3) 0.167
TG (mmol⋅L− 1)e 0.7 [0.5, 0.9]
150 0.7 [0.5, 0.9]
0.696f
ASK = Active Smarter Kids; BMI = body mass index; HDL-C = high-density li-poprotein; LDL-C = low-density lipoprotein cholesterol; MVPA = moderate- to vigorous-intensity physical activity; TC = total cholesterol; TG = triglycerides.
a Proportion of total n with data available for categorical variables. b Continuous characteristics compared using linear regression, categorical
characteristics using binomial logistic regression. c For comparison, dichotomised to ‘Upper secondary school’ and ‘Higher than
upper secondary school’. d For comparison, dichotomised to Tanner stage 1 and Tanner stage ≥2. e Median [IQR]. f Comparison performed using log(TG).
P.R. Jones et al.
Atherosclerosis 321 (2021) 21–29
24
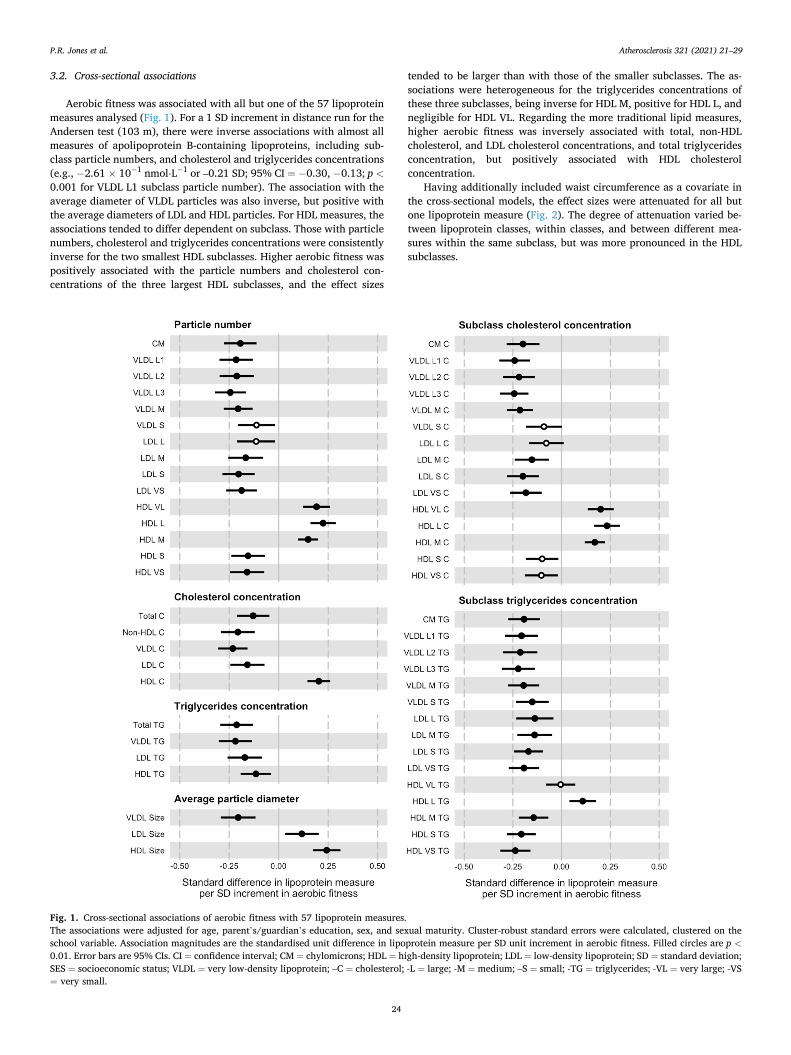
3.2. Cross-sectional associations
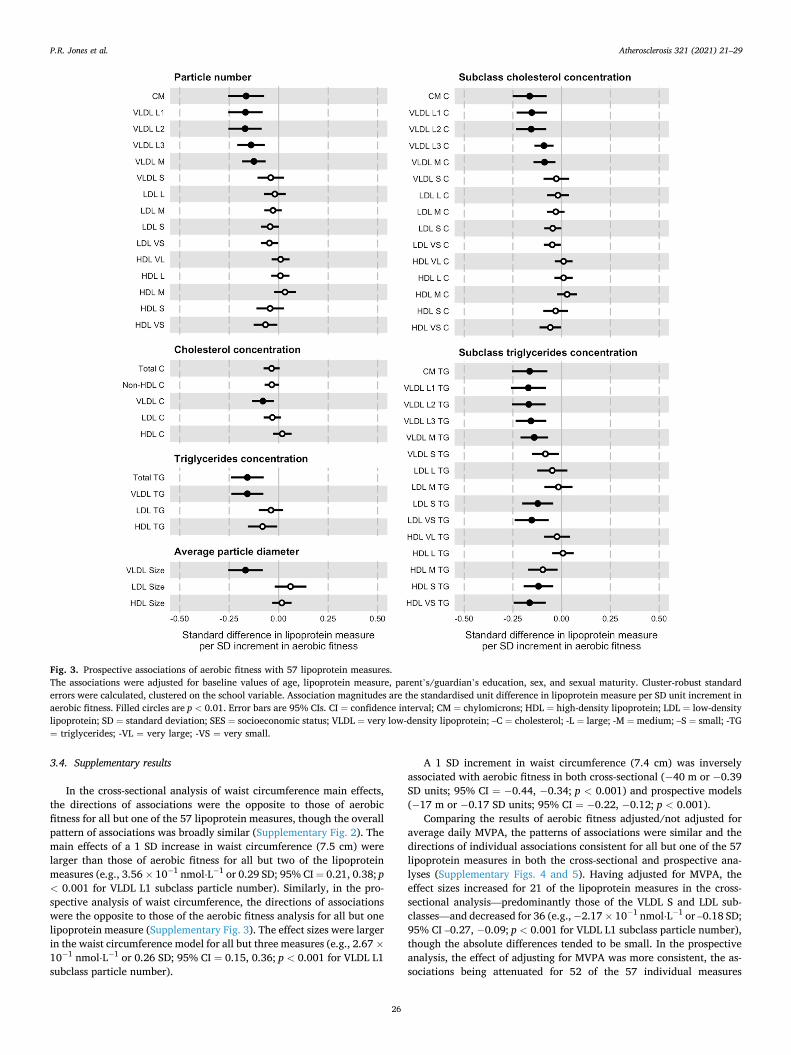
Aerobic fitness was associated with all but one of the 57 lipoprotein measures analysed (Fig. 1). For a 1 SD increment in distance run for the Andersen test (103 m), there were inverse associations with almost all measures of apolipoprotein B-containing lipoproteins, including sub-class particle numbers, and cholesterol and triglycerides concentrations (e.g., − 2.61 × 10− 1 nmol⋅L− 1 or –0.21 SD; 95% CI = − 0.30, − 0.13; p <0.001 for VLDL L1 subclass particle number). The association with the average diameter of VLDL particles was also inverse, but positive with the average diameters of LDL and HDL particles. For HDL measures, the associations tended to differ dependent on subclass. Those with particle numbers, cholesterol and triglycerides concentrations were consistently inverse for the two smallest HDL subclasses. Higher aerobic fitness was positively associated with the particle numbers and cholesterol con-centrations of the three largest HDL subclasses, and the effect sizes
tended to be larger than with those of the smaller subclasses. The as-sociations were heterogeneous for the triglycerides concentrations of these three subclasses, being inverse for HDL M, positive for HDL L, and negligible for HDL VL. Regarding the more traditional lipid measures, higher aerobic fitness was inversely associated with total, non-HDL cholesterol, and LDL cholesterol concentrations, and total triglycerides concentration, but positively associated with HDL cholesterol concentration.
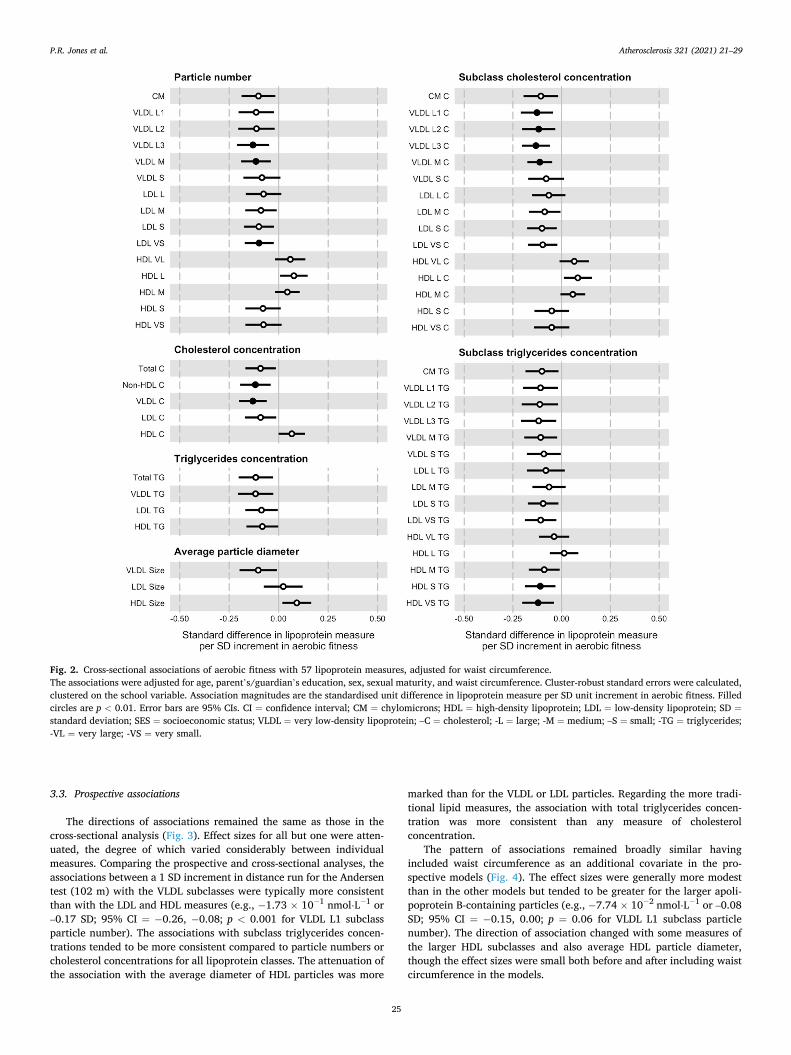
Having additionally included waist circumference as a covariate in the cross-sectional models, the effect sizes were attenuated for all but one lipoprotein measure (Fig. 2). The degree of attenuation varied be-tween lipoprotein classes, within classes, and between different mea-sures within the same subclass, but was more pronounced in the HDL subclasses.
Fig. 1. Cross-sectional associations of aerobic fitness with 57 lipoprotein measures. The associations were adjusted for age, parent’s/guardian’s education, sex, and sexual maturity. Cluster-robust standard errors were calculated, clustered on the school variable. Association magnitudes are the standardised unit difference in lipoprotein measure per SD unit increment in aerobic fitness. Filled circles are p <0.01. Error bars are 95% CIs. CI = confidence interval; CM = chylomicrons; HDL = high-density lipoprotein; LDL = low-density lipoprotein; SD = standard deviation; SES = socioeconomic status; VLDL = very low-density lipoprotein; –C = cholesterol; -L = large; -M = medium; –S = small; -TG = triglycerides; -VL = very large; -VS = very small.
P.R. Jones et al.
Atherosclerosis 321 (2021) 21–29
25
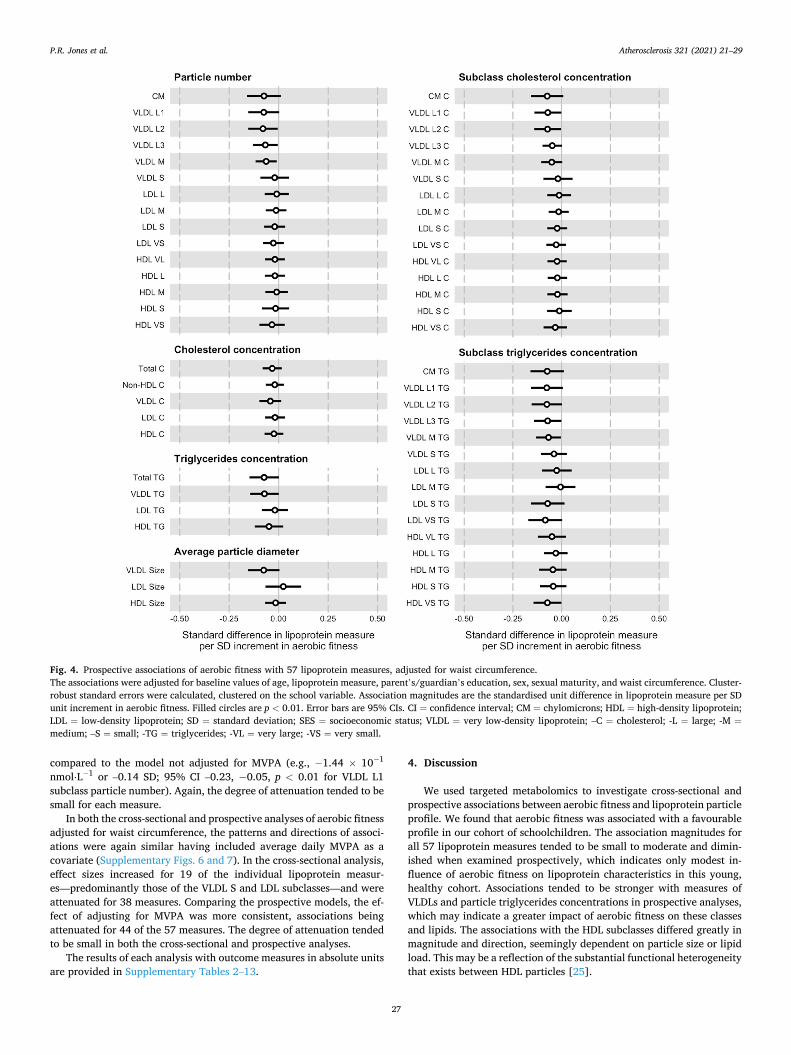
3.3. Prospective associations
The directions of associations remained the same as those in the cross-sectional analysis (Fig. 3). Effect sizes for all but one were atten-uated, the degree of which varied considerably between individual measures. Comparing the prospective and cross-sectional analyses, the associations between a 1 SD increment in distance run for the Andersen test (102 m) with the VLDL subclasses were typically more consistent than with the LDL and HDL measures (e.g., − 1.73 × 10− 1 nmol⋅L− 1 or –0.17 SD; 95% CI = − 0.26, − 0.08; p < 0.001 for VLDL L1 subclass particle number). The associations with subclass triglycerides concen-trations tended to be more consistent compared to particle numbers or cholesterol concentrations for all lipoprotein classes. The attenuation of the association with the average diameter of HDL particles was more
marked than for the VLDL or LDL particles. Regarding the more tradi-tional lipid measures, the association with total triglycerides concen-tration was more consistent than any measure of cholesterol concentration.
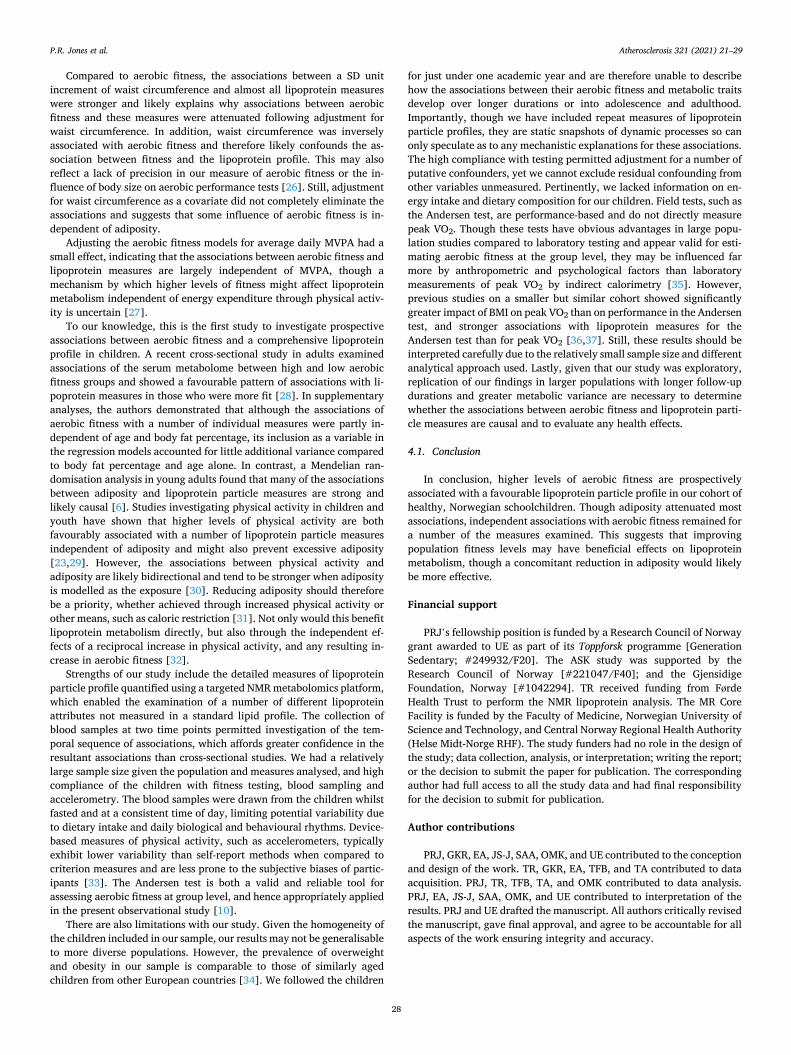
The pattern of associations remained broadly similar having included waist circumference as an additional covariate in the pro-spective models (Fig. 4). The effect sizes were generally more modest than in the other models but tended to be greater for the larger apoli-poprotein B-containing particles (e.g., − 7.74 × 10− 2 nmol⋅L− 1 or –0.08 SD; 95% CI = − 0.15, 0.00; p = 0.06 for VLDL L1 subclass particle number). The direction of association changed with some measures of the larger HDL subclasses and also average HDL particle diameter, though the effect sizes were small both before and after including waist circumference in the models.
Fig. 2. Cross-sectional associations of aerobic fitness with 57 lipoprotein measures, adjusted for waist circumference. The associations were adjusted for age, parent’s/guardian’s education, sex, sexual maturity, and waist circumference. Cluster-robust standard errors were calculated, clustered on the school variable. Association magnitudes are the standardised unit difference in lipoprotein measure per SD unit increment in aerobic fitness. Filled circles are p < 0.01. Error bars are 95% CIs. CI = confidence interval; CM = chylomicrons; HDL = high-density lipoprotein; LDL = low-density lipoprotein; SD =standard deviation; SES = socioeconomic status; VLDL = very low-density lipoprotein; –C = cholesterol; -L = large; -M = medium; –S = small; -TG = triglycerides; -VL = very large; -VS = very small.
P.R. Jones et al.
Atherosclerosis 321 (2021) 21–29
26
3.4. Supplementary results
In the cross-sectional analysis of waist circumference main effects, the directions of associations were the opposite to those of aerobic fitness for all but one of the 57 lipoprotein measures, though the overall pattern of associations was broadly similar (Supplementary Fig. 2). The main effects of a 1 SD increase in waist circumference (7.5 cm) were larger than those of aerobic fitness for all but two of the lipoprotein measures (e.g., 3.56 × 10− 1 nmol⋅L− 1 or 0.29 SD; 95% CI = 0.21, 0.38; p < 0.001 for VLDL L1 subclass particle number). Similarly, in the pro-spective analysis of waist circumference, the directions of associations were the opposite to those of the aerobic fitness analysis for all but one lipoprotein measure (Supplementary Fig. 3). The effect sizes were larger in the waist circumference model for all but three measures (e.g., 2.67 ×10− 1 nmol⋅L− 1 or 0.26 SD; 95% CI = 0.15, 0.36; p < 0.001 for VLDL L1 subclass particle number).
A 1 SD increment in waist circumference (7.4 cm) was inversely associated with aerobic fitness in both cross-sectional (− 40 m or − 0.39 SD units; 95% CI = − 0.44, − 0.34; p < 0.001) and prospective models (− 17 m or − 0.17 SD units; 95% CI = − 0.22, − 0.12; p < 0.001).
Comparing the results of aerobic fitness adjusted/not adjusted for average daily MVPA, the patterns of associations were similar and the directions of individual associations consistent for all but one of the 57 lipoprotein measures in both the cross-sectional and prospective ana-lyses (Supplementary Figs. 4 and 5). Having adjusted for MVPA, the effect sizes increased for 21 of the lipoprotein measures in the cross- sectional analysis—predominantly those of the VLDL S and LDL sub-classes—and decreased for 36 (e.g., − 2.17 × 10− 1 nmol⋅L− 1 or –0.18 SD; 95% CI –0.27, − 0.09; p < 0.001 for VLDL L1 subclass particle number), though the absolute differences tended to be small. In the prospective analysis, the effect of adjusting for MVPA was more consistent, the as-sociations being attenuated for 52 of the 57 individual measures
Fig. 3. Prospective associations of aerobic fitness with 57 lipoprotein measures. The associations were adjusted for baseline values of age, lipoprotein measure, parent’s/guardian’s education, sex, and sexual maturity. Cluster-robust standard errors were calculated, clustered on the school variable. Association magnitudes are the standardised unit difference in lipoprotein measure per SD unit increment in aerobic fitness. Filled circles are p < 0.01. Error bars are 95% CIs. CI = confidence interval; CM = chylomicrons; HDL = high-density lipoprotein; LDL = low-density lipoprotein; SD = standard deviation; SES = socioeconomic status; VLDL = very low-density lipoprotein; –C = cholesterol; -L = large; -M = medium; –S = small; -TG = triglycerides; -VL = very large; -VS = very small.
P.R. Jones et al.
Atherosclerosis 321 (2021) 21–29
27
compared to the model not adjusted for MVPA (e.g., − 1.44 × 10− 1
nmol⋅L− 1 or –0.14 SD; 95% CI –0.23, − 0.05, p < 0.01 for VLDL L1 subclass particle number). Again, the degree of attenuation tended to be small for each measure.
In both the cross-sectional and prospective analyses of aerobic fitness adjusted for waist circumference, the patterns and directions of associ-ations were again similar having included average daily MVPA as a covariate (Supplementary Figs. 6 and 7). In the cross-sectional analysis, effect sizes increased for 19 of the individual lipoprotein measur-es—predominantly those of the VLDL S and LDL subclasses—and were attenuated for 38 measures. Comparing the prospective models, the ef-fect of adjusting for MVPA was more consistent, associations being attenuated for 44 of the 57 measures. The degree of attenuation tended to be small in both the cross-sectional and prospective analyses.
The results of each analysis with outcome measures in absolute units are provided in Supplementary Tables 2–13.
4. Discussion
We used targeted metabolomics to investigate cross-sectional and prospective associations between aerobic fitness and lipoprotein particle profile. We found that aerobic fitness was associated with a favourable profile in our cohort of schoolchildren. The association magnitudes for all 57 lipoprotein measures tended to be small to moderate and dimin-ished when examined prospectively, which indicates only modest in-fluence of aerobic fitness on lipoprotein characteristics in this young, healthy cohort. Associations tended to be stronger with measures of VLDLs and particle triglycerides concentrations in prospective analyses, which may indicate a greater impact of aerobic fitness on these classes and lipids. The associations with the HDL subclasses differed greatly in magnitude and direction, seemingly dependent on particle size or lipid load. This may be a reflection of the substantial functional heterogeneity that exists between HDL particles [25].
Fig. 4. Prospective associations of aerobic fitness with 57 lipoprotein measures, adjusted for waist circumference. The associations were adjusted for baseline values of age, lipoprotein measure, parent’s/guardian’s education, sex, sexual maturity, and waist circumference. Cluster- robust standard errors were calculated, clustered on the school variable. Association magnitudes are the standardised unit difference in lipoprotein measure per SD unit increment in aerobic fitness. Filled circles are p < 0.01. Error bars are 95% CIs. CI = confidence interval; CM = chylomicrons; HDL = high-density lipoprotein; LDL = low-density lipoprotein; SD = standard deviation; SES = socioeconomic status; VLDL = very low-density lipoprotein; –C = cholesterol; -L = large; -M =medium; –S = small; -TG = triglycerides; -VL = very large; -VS = very small.
P.R. Jones et al.
Atherosclerosis 321 (2021) 21–29
28
Compared to aerobic fitness, the associations between a SD unit increment of waist circumference and almost all lipoprotein measures were stronger and likely explains why associations between aerobic fitness and these measures were attenuated following adjustment for waist circumference. In addition, waist circumference was inversely associated with aerobic fitness and therefore likely confounds the as-sociation between fitness and the lipoprotein profile. This may also reflect a lack of precision in our measure of aerobic fitness or the in-fluence of body size on aerobic performance tests [26]. Still, adjustment for waist circumference as a covariate did not completely eliminate the associations and suggests that some influence of aerobic fitness is in-dependent of adiposity.
Adjusting the aerobic fitness models for average daily MVPA had a small effect, indicating that the associations between aerobic fitness and lipoprotein measures are largely independent of MVPA, though a mechanism by which higher levels of fitness might affect lipoprotein metabolism independent of energy expenditure through physical activ-ity is uncertain [27].
To our knowledge, this is the first study to investigate prospective associations between aerobic fitness and a comprehensive lipoprotein profile in children. A recent cross-sectional study in adults examined associations of the serum metabolome between high and low aerobic fitness groups and showed a favourable pattern of associations with li-poprotein measures in those who were more fit [28]. In supplementary analyses, the authors demonstrated that although the associations of aerobic fitness with a number of individual measures were partly in-dependent of age and body fat percentage, its inclusion as a variable in the regression models accounted for little additional variance compared to body fat percentage and age alone. In contrast, a Mendelian ran-domisation analysis in young adults found that many of the associations between adiposity and lipoprotein particle measures are strong and likely causal [6]. Studies investigating physical activity in children and youth have shown that higher levels of physical activity are both favourably associated with a number of lipoprotein particle measures independent of adiposity and might also prevent excessive adiposity [23,29]. However, the associations between physical activity and adiposity are likely bidirectional and tend to be stronger when adiposity is modelled as the exposure [30]. Reducing adiposity should therefore be a priority, whether achieved through increased physical activity or other means, such as caloric restriction [31]. Not only would this benefit lipoprotein metabolism directly, but also through the independent ef-fects of a reciprocal increase in physical activity, and any resulting in-crease in aerobic fitness [32].
Strengths of our study include the detailed measures of lipoprotein particle profile quantified using a targeted NMR metabolomics platform, which enabled the examination of a number of different lipoprotein attributes not measured in a standard lipid profile. The collection of blood samples at two time points permitted investigation of the tem-poral sequence of associations, which affords greater confidence in the resultant associations than cross-sectional studies. We had a relatively large sample size given the population and measures analysed, and high compliance of the children with fitness testing, blood sampling and accelerometry. The blood samples were drawn from the children whilst fasted and at a consistent time of day, limiting potential variability due to dietary intake and daily biological and behavioural rhythms. Device- based measures of physical activity, such as accelerometers, typically exhibit lower variability than self-report methods when compared to criterion measures and are less prone to the subjective biases of partic-ipants [33]. The Andersen test is both a valid and reliable tool for assessing aerobic fitness at group level, and hence appropriately applied in the present observational study [10].
There are also limitations with our study. Given the homogeneity of the children included in our sample, our results may not be generalisable to more diverse populations. However, the prevalence of overweight and obesity in our sample is comparable to those of similarly aged children from other European countries [34]. We followed the children
for just under one academic year and are therefore unable to describe how the associations between their aerobic fitness and metabolic traits develop over longer durations or into adolescence and adulthood. Importantly, though we have included repeat measures of lipoprotein particle profiles, they are static snapshots of dynamic processes so can only speculate as to any mechanistic explanations for these associations. The high compliance with testing permitted adjustment for a number of putative confounders, yet we cannot exclude residual confounding from other variables unmeasured. Pertinently, we lacked information on en-ergy intake and dietary composition for our children. Field tests, such as the Andersen test, are performance-based and do not directly measure peak VO2. Though these tests have obvious advantages in large popu-lation studies compared to laboratory testing and appear valid for esti-mating aerobic fitness at the group level, they may be influenced far more by anthropometric and psychological factors than laboratory measurements of peak VO2 by indirect calorimetry [35]. However, previous studies on a smaller but similar cohort showed significantly greater impact of BMI on peak VO2 than on performance in the Andersen test, and stronger associations with lipoprotein measures for the Andersen test than for peak VO2 [36,37]. Still, these results should be interpreted carefully due to the relatively small sample size and different analytical approach used. Lastly, given that our study was exploratory, replication of our findings in larger populations with longer follow-up durations and greater metabolic variance are necessary to determine whether the associations between aerobic fitness and lipoprotein parti-cle measures are causal and to evaluate any health effects.
4.1. Conclusion
In conclusion, higher levels of aerobic fitness are prospectively associated with a favourable lipoprotein particle profile in our cohort of healthy, Norwegian schoolchildren. Though adiposity attenuated most associations, independent associations with aerobic fitness remained for a number of the measures examined. This suggests that improving population fitness levels may have beneficial effects on lipoprotein metabolism, though a concomitant reduction in adiposity would likely be more effective.
Financial support
PRJ’s fellowship position is funded by a Research Council of Norway grant awarded to UE as part of its Toppforsk programme [Generation Sedentary; #249932/F20]. The ASK study was supported by the Research Council of Norway [#221047/F40]; and the Gjensidige Foundation, Norway [#1042294]. TR received funding from Førde Health Trust to perform the NMR lipoprotein analysis. The MR Core Facility is funded by the Faculty of Medicine, Norwegian University of Science and Technology, and Central Norway Regional Health Authority (Helse Midt-Norge RHF). The study funders had no role in the design of the study; data collection, analysis, or interpretation; writing the report; or the decision to submit the paper for publication. The corresponding author had full access to all the study data and had final responsibility for the decision to submit for publication.
Author contributions
PRJ, GKR, EA, JS-J, SAA, OMK, and UE contributed to the conception and design of the work. TR, GKR, EA, TFB, and TA contributed to data acquisition. PRJ, TR, TFB, TA, and OMK contributed to data analysis. PRJ, EA, JS-J, SAA, OMK, and UE contributed to interpretation of the results. PRJ and UE drafted the manuscript. All authors critically revised the manuscript, gave final approval, and agree to be accountable for all aspects of the work ensuring integrity and accuracy.
P.R. Jones et al.
Atherosclerosis 321 (2021) 21–29
29
Declaration of competing interest
The authors declare that they have no known competing financial interests or personal relationships that could have appeared to influence the work reported in this paper.
Acknowledgements
We are grateful to the children, parents and guardians, teachers, and principals from the participating elementary schools for their time, effort and cooperation. We thank our colleagues and students at the Western Norway University of Applied Sciences (formerly Sogn and Fjordane University College) for their assistance during the data collection. We also thank the Førde Central Hospital staff who coordi-nated the collection of blood samples. The NMR experiments were performed at the MR Core Facility, Norwegian University of Science and Technology.
Appendix A. Supplementary data
Supplementary data to this article can be found online at https://doi. org/10.1016/j.atherosclerosis.2021.02.002.
References
[1] R.V. Shah, V.L. Murthy, L.A. Colangelo, et al., Association of fitness in young adulthood with survival and cardiovascular risk: the coronary artery risk development in young adults (CARDIA) study, JAMA Intern Med 176 (2016) 87–95.
[2] S.A. Anderssen, A.R. Cooper, C. Riddoch, et al., Low cardiorespiratory fitness is a strong predictor for clustering of cardiovascular disease risk factors in children independent of country, age and sex, Eur. J. Cardiovasc. Prev. Rehabil. 14 (2007) 526–531.
[3] G.A. Kelley, K.S. Kelley, Aerobic exercise and lipids and lipoproteins in children and adolescents: a meta-analysis of randomized controlled trials, Atherosclerosis 191 (2007) 447–453.
[4] M. Ala-Korpela, The culprit is the carrier, not the loads: cholesterol, triglycerides and apolipoprotein B in atherosclerosis and coronary heart disease, Int. J. Epidemiol. 48 (2019) 1389–1392.
[5] M.V. Holmes, I.Y. Millwood, C. Kartsonaki, et al., Lipids, lipoproteins, and metabolites and risk of myocardial infarction and stroke, J. Am. Coll. Cardiol. 71 (2018) 620–632.
[6] P. Würtz, Q. Wang, A.J. Kangas, et al., Metabolic signatures of adiposity in young adults: mendelian randomization analysis and effects of weight change, PLoS Med. 11 (2014), e1001765.
[7] U.M. Kujala, V.-P. Makinen, I. Heinonen, et al., Long-term leisure-time physical activity and serum metabolome, Circulation 127 (2013) 340–348.
[8] G.K. Resaland, E. Aadland, V.F. Moe, et al., Effects of physical activity on schoolchildren’s academic performance: the Active Smarter Kids (ASK) cluster- randomized controlled trial, Prev. Med. 91 (2016) 322–328.
[9] World Medical Association, World medical association declaration of Helsinki: ethical principles for medical research involving human subjects, J. Am. Med. Assoc. 310 (2013) 2191–2194.
[10] E. Aadland, T. Terum, A. Mamen, L.B. Andersen, G.K. Resaland, The andersen aerobic fitness test: reliability and validity in 10-year-old children, PloS One 9 (2014), e110492.
[11] M. Okazaki, S. Usui, M. Ishigami, et al., Identification of unique lipoprotein subclasses for visceral obesity by component analysis of cholesterol profile in high- performance liquid chromatography, Arterioscler. Thromb. Vasc. Biol. 25 (2005) 578–584.
[12] O.M. Kvalheim, R. Arneberg, B. Grung, T. Rajalathi, Determination of optimum number of components in partial least squares regression from distributions of the root-mean-squared error obtained by Monte Carlo resampling, J. Chemom. 32 (2018) e2293.
[13] C. Lin, T. Rajalahti, S.A. Mjøs, O.M. Kvalheim, Predictive associations between serum fatty acids and lipoproteins in healthy non-obese Norwegians: implications for cardiovascular health, Metabolomics 12 (2015) 6.
[14] M. Okazaki, S. Yamashita, Recent advances in analytical methods on lipoprotein subclasses: calculation of particle numbers from lipid levels by gel permeation HPLC using “spherical particle model”, J. Oleo Sci. 65 (2016) 265–282.
[15] B.G. Nordestgaard, A test in context: lipid profile, fasting versus nonfasting, J. Am. Coll. Cardiol. 70 (2017) 1637–1646.
[16] D.W. Esliger, J.L. Copeland, J.D. Barnes, M.S. Tremblay, Standardizing and optimizing the use of accelerometer data for free-living physical activity monitoring, J. Phys. Activ. Health 2 (2005) 366–383.
[17] K.R. Evenson, D.J. Catellier, K. Gill, K.S. Ondrak, R.G. McMurray, Calibration of two objective measures of physical activity for children, J. Sports Sci. 26 (2008) 1557–1565.
[18] S.G. Trost, P.D. Loprinzi, R. Moore, K.A. Pfeiffer, Comparison of accelerometer cut points for predicting activity intensity in youth, Med. Sci. Sports Exerc. 43 (2011) 1360–1368.
[19] T.J. Cole, T. Lobstein, Extended international (IOTF) body mass index cut-offs for thinness, overweight and obesity, Pediatr Obes 7 (2012) 284–294.
[20] J.-C. Carel, J. Leger, Precocious puberty, N. Engl. J. Med. 358 (2008) 12. [21] X. Gao, J. Starmer, E.R. Martin, A multiple testing correction method for genetic
association studies using correlated single nucleotide polymorphisms, Genet. Epidemiol. 32 (2008) 361–369.
[22] D.L.S. Ferreira, D.M. Williams, A.J. Kangas, et al., Association of pre-pregnancy body mass index with offspring metabolic profile: analyses of 3 European prospective birth cohorts, PLoS Med. 14 (2017), e1002376.
[23] J.A. Bell, M. Hamer, R.C. Richmond, N.J. Timpson, D. Carslake, G.D. Smith, Associations of device-measured physical activity across adolescence with metabolic traits: prospective cohort study, PLoS Med. 15 (2018), e1002649.
[24] R Core Team, R: A Language and Environment for Statistical Computing, R Foundation for Statistical Computing, Vienna, Austria, 2020. https://www.R-pro ject.org/.
[25] L. Camont, M.J. Chapman, A. Kontush, Biological activities of HDL subpopulations and their relevance to cardiovascular disease, Trends Mol. Med. 17 (2011) 594–603.
[26] N. Armstrong, J. Welsman, Youth cardiorespiratory fitness: evidence, myths and misconceptions, Bull. World Health Organ. 97 (2019) 777–782.
[27] S.L. Herd, A.E. Hardman, L.H. Boobis, C.J. Cairns, The effect of 13 weeks of running training followed by 9 d of detraining on postprandial lipaemia, Br. J. Nutr. 80 (1998) 57–66.
[28] U.M. Kujala, J.P. Vaara, H. Kainulainen, T. Vasankari, E. Vaara, H. Kyrolainen, Associations of aerobic fitness and maximal muscular strength with metabolites in young men, JAMA Netw Open 2 (2019) e198265–e198265.
[29] M. Hamer, E. Stamatakis, Relative proportion of vigorous physical activity, total volume of moderate to vigorous activity, and body mass index in youth: the Millennium Cohort Study, Int. J. Obes. 42 (2018) 1239–1242.
[30] R.C. Richmond, G. Davey Smith, A.R. Ness, M. den Hoed, G. McMahon, N. J. Timpson, Assessing causality in the association between child adiposity and physical activity levels: a mendelian randomization analysis, PLoS Med. 11 (2014), e1001618.
[31] D.L. Swift, N.M. Johannsen, C.J. Lavie, C.P. Earnest, T.S. Church, The role of exercise and physical activity in weight loss and maintenance, Prog. Cardiovasc. Dis. 56 (2014) 441–447.
[32] V. Carson, R.L. Rinaldi, B. Torrance, et al., Vigorous physical activity and longitudinal associations with cardiometabolic risk factors in youth, Int. J. Obes. 38 (2014) 16–21.
[33] S. Kwon, L.B. Andersen, A. Grøntved, et al., A closer look at the relationship among accelerometer-based physical activity metrics: ICAD pooled data, Int. J. Behav. Nutr. Phys. Activ. 16 (2019) 40.
[34] Who Regional Office for Europe, WHO European Childhood Obesity Surveillance Initiative: Overweight and Obesity Among 6–9-Year-Old Children. Report of the Third Round of Data Collection 2012–2013, World Health Organization, Copenhagen, 2018.
[35] N. Armstrong, J. Welsman, Clarity and confusion in the development of youth aerobic fitness, Front. Physiol. 10 (2019) 979.
[36] G.K. Resaland, T. Rajalahti, E. Aadland, O.M. Kvalheim, Strong association between cardiorespiratory fitness and serum lipoprotein subclass pattern in prepubertal healthy children, Scand. J. Med. Sci. Sports 28 (2018) 220–227.
[37] E. Aadland, O.M. Kvalheim, T. Rajalahti, T. Skrede, G.K. Resaland, Aerobic fitness and metabolic health in children: a clinical validation of directly measured maximal oxygen consumption versus performance measures as markers of health, Prev Med Rep 7 (2017) 74–76.
P.R. Jones et al.