Embed Size (px)
Citation preview
Cross Trading by Investment Advisers: Implications for
Mutual Fund Performance
Lorenzo Casavecchiaa and Ashish Tiwarib
September 1, 2014
ABSTRACT
Using a unique dataset we provide new evidence on the significant penalty on client fund performance
due to conflicts of interest related to the cross trading (TCT) activities of mutual fund advisers: funds
managed by advisers in the top TCT quintile significantly underperform funds managed by advisers in the
bottom TCT quintile by 1% per year. Adviser incentives to engage in cross trading are directly related to
their opportunities for generating revenues from affiliated trading operations. Additional tests suggest that
the significantly higher trading commissions paid by client funds of high-TCT advisers are a major source
of their under-performance.
JEL Classification Code: G23
Keywords: Mutual fund performance, Cross trading, Investment advisers, Brokerage commissions, Adviser governance
a School of Finance and Economics, University of Technology Sydney, NSW, Australia. Phone: (61) 2 95147764; Fax: (61) 2 92147711. Email: [email protected] b Corresponding Author. Department of Finance, Tippie College of Business, University of Iowa, 108 PBB, Iowa City, IA 52242-1000. Ph: (319) 353-2185; Fax: (319) 335-3590. Email: [email protected] We thank Stephen Brown, Joop Huij, Pedro Matos, and Jay Wang for their extremely helpful suggestions. We also thank seminar participants at the 2011 Professional Asset Management Conference, Erasmus University, the 2011 FIRS conference, the 2011 Finance and Corporate Governance Conference, Hong Kong University of Science and Technology, and the Indian School of Business for their helpful feedback.

1
“When an adviser engages in an agency transaction on behalf of a client, it is primarily the incentive to
earn additional compensation that creates the adviser's conflict of interest.”
-- SEC Interpretive Release No. IA-1732 of Section 206(3), Investment Advisers Act of 1940
1. Introduction
The mutual fund literature has extensively investigated the characteristics and performance of mutual
funds. However, little is still known about the behavior of mutual fund advisers. The analysis of the
relationship between mutual fund clients (principals) and their advisers (agents) is clearly important to
further our understanding of the structure of the mutual fund industry. A better understanding of fund
advisers’ incentives is also important in light of the potential risks to investors from advisers’ conflicts of
interest in certain client transactions referred to as cross trades. Cross trading refers to transactions
between the fund adviser or its affiliated broker, and one or more client funds, or transactions among
multiple client funds in which the adviser acts as an intermediary. In the past twenty years cross
transactions have increasingly attracted the attention of the U.S. Securities and Exchange Commission
(SEC), resulting in a number of enforcement actions. 1 Despite the relevance of the issue, we are not
aware of any study that has directly investigated the advisers’ incentives to engage in these transactions
and, more importantly, their implications for mutual fund investors. In this paper, using a unique dataset,
we document for the first time the nature of fund advisers’ cross trading operations, the underlying
motivation, and the implications of such transactions for investors.
The SEC requires fund advisers to report on two types of cross trading practices where the advisers
serve in dual roles. In the first, referred to as principal cross trading, the adviser (or its affiliated broker),
acting as a principal, engages in off-market transactions in which it buys (or sells) securities for (from) the
adviser’s own inventory from (to) the client fund’s portfolio. In the second type of trading practice,
referred to as agency cross trading, an adviser (or its affiliated broker), acting as agent, arranges off-
1 Examples of major enforcement actions include: No. 1583 (1995) against Feldman Investment Group; No. 1585 (1996) against Concord Investment; No. 1767 (1998) against ABN AMRO; No. 1714 (1998) against Rothschild Investment; No.1732 (2002) against Gintel Asset Management; No.18950 (2004) against Beacon Hill Asset Management; and No. 2888 (2009) against Evergreen Investment Management Co., LLC.
2
market transactions between different advisory clients or between a brokerage customer and an advisory
client. In this case, the adviser serves as a broker for compensation on behalf of his mutual fund client as
well as another party (another client or affiliated entity) to the transaction. In contrast to principal cross
trading, agency cross trading involves the advisers operating on behalf of multiple interests.
It is clear that the practice of cross trading presents some inherent risks in terms of the potential for
another party to be favored over the client. For example, the SEC has expressed the concern that principal
cross trading can lead to price manipulation or the placement of unwanted securities in client portfolios.
Similarly, the incentive to earn additional compensation may create the adviser’s conflict of interest when
facilitating agency transactions among clients. We would like to stress at this point that engagement by an
adviser in principal or agency transactions does not necessarily translate into unfair dealing and breach of
adviser’s fiduciary duty to their fund clients. Indeed, these transactions could also be conducted in the
best interests of fund clients, for instance by reducing or completely eliminating commission costs.
However, if these transactions are systematically and negatively related to client performance, it is more
likely that they proxy for material agency conflicts between advisers and their fund clients. Whether the
benefits of cross trading outweigh the potential risks is of course an empirical question. The goal of this
study is to provide evidence on this issue.
In this paper we use data on investment advisers contained in the uniform application for investment
adviser registration (form ADV). The data include information on the advisers’ organizational form,
compensation, assets under management, clientele, disciplinary history, governance, and responses to
questions relating to advisers’ cross trading practices. We link the data on fund advisers to performance
data for their client mutual funds obtained from the CRSP Survivorship-Bias Free Mutual Fund Database.
Our final sample includes 1,636 actively managed equity mutual fund portfolios that are uniquely linked
to 560 investment advisers. We construct different proxies for the intensity of cross trading by each
investment advisory firm as identified by the SEC based on their responses to questions under Item 8 of
form ADV in which they are required to disclose any (principal and agency) financial interest in client
transactions.
3
We group the mutual funds that share a common adviser into portfolios and examine the performance
of fund advisers by analyzing the returns on the portfolios of their client mutual funds. We refer to these
portfolios as ‘adviser fund portfolios.’ The primary focus of the analysis is the question of how cross
trading practices at advisory firms may impact the performance of their client funds. We first sort the
adviser fund portfolios into quintiles based on the intensity of cross trading practices (TCT). Using a
variety of performance measures including the CAPM alpha, 3-factor (Fama-French) model alpha, and
the unconditional and conditional 4-factor (Carhart) model alpha, we find that different measures of cross
trading (total, principal, and agency cross trading) are significantly negatively related to the performance
of adviser fund portfolios. The effect is significant in both statistical as well as economic terms, and it is
robust to different model specifications and a number of control variables.2 For example, a one-standard
deviation increase in the overall cross trading measure (TCT) corresponds to an average reduction of 48
basis points in the annualized 4-factor alpha of an adviser fund portfolio, at the margin.
We also adopt an alternative two-stage regression framework to examine the relation between
different cross trading measures and the performance of adviser fund portfolios, while controlling for the
influence of fund characteristics that may be correlated to both cross trading and fund performance. Once
again we find that adviser fund portfolio performance, whether measured as 3-factor alpha or as 4-factor
alpha, is significantly negatively related to the cross trading intensity, and particularly to our proxy for
agency – rather than principal – transactions.
Given the negative relation between adviser TCT measures and the performance of their client funds,
a natural question is whether investors in these funds are sensitive to the potential risk of cross trading
related conflicts of interest. The evidence suggests that in general, fund flows are insensitive to the cross
trading proxies. The insensitivity of flows to different TCT measures may in part reflect a lack of investor
attention to, or appreciation for, the adverse impact of such conflicts on client fund performance. At the
2 The control variables include the total client (including mutual fund) assets under the management of the adviser, degree of differentiation of product offerings of the adviser, client fund managers’ tenure and the size of the management team, and the size, turnover, age, operating expenses, and volatility of an adviser fund portfolio.
4
same time it provides a possible explanation for why advisory firms may not voluntarily limit cross
trading practices.
We then explore the incentives for advisers to engage in cross trading and find that our TCT measures
are significantly positively related to a number of characteristics that capture fund adviser incentives to
engage in such transactions. These attributes include the existence of soft dollar payment arrangements,
performance fees, degree of sensitivity of mutual fund flows to performance, total amount of assets and
total number of client accounts under the adviser’s management, and the proportion of fund adviser
employees who are registered broker-dealers.
Our next contribution is to show that advisers’ affiliated brokerage houses are among those who stand
to profit from the execution of agency cross transactions at the expenses of mutual fund clients. In
particular, our results indicate that advisers who engage in extensive agency cross transactions are more
likely to pay above average percentage trading commissions to their brokerage houses. These
commissions create strong cross trading incentives for advisers if they are themselves a brokerage house
or have special contractual arrangements with brokerage houses to receive research and other related
services in exchange (soft dollars). We also find direct evidence that the high brokerage commissions paid
by high-TCT fund advisers to affiliated brokerage houses are a major source of their underperformance.
Our final contribution is to examine whether governance practices at advisory firms are effective
deterrents to cross trading related conflicts of interest. We find that a number of adviser-specific
governance characteristics including the percentage ownership concentration in adviser voting securities,
the independence and tenure of the Chief Compliance Officer (CCO), and the number of past enforcement
actions by the SEC, serve to minimize potential conflicts.
Our paper is related to an emerging literature that examines the incentives of family-affiliated mutual
funds and the associated costs and benefits for their shareholders. Massa (2003) shows that fund families
with poor performance have greater incentives to compete on non-performance-related characteristics, by
reducing fees or increasing the number of funds within the family, in order to make inter-fund
comparisons harder for their investors. Nanda, Wang, and Zheng (2004) document that star funds in the
5
family attract fund flows that have a favorable spillover effect on other funds in the family. Gaspar,
Massa, and Matos (2006) provide evidence of within-family cross subsidization of “high value” funds to
the detriment of other “low value” funds through favoritism in IPO allocations and opposite trades (i.e.,
coordinated opposite buy and sell trades by different funds in the family). 3 Cici, Gibson, and Moussawi
(2010) and Nohel, Wang, and Zheng (2010) explore the potential conflicts of interest in side-by-side
management of mutual funds and hedge funds, at the fund family or the manager level. Using ADV
filings, Chen, Hong, and Kubick (2013) show that mutual fund families outsource on average a large
proportion of their client mutual funds to unaffiliated advisory firms, and that funds managed externally
significantly underperform those run internally. More recently, Bhattacharya, Lee, and Pool (2012)
document that affiliated funds of mutual funds strategically provide liquidity to offset transient liquidity
shortfalls in other funds in the family. In contrast to the substantial evidence on within-family incentive
issues, evidence on incentives generated by principal or agency interest in client transactions by fund
advisers, and their impact on client fund performance, is relatively scarce. Our paper extends this
literature by providing novel evidence on (a) the implications of mutual fund advisers’ cross trading
decisions for the performance of client funds, (b) the brokerage-related motivations behind these activities,
and (c) the effect of advisers’ governance on the likelihood of such cross transactions.
2. Cross Trading Practices and ADV Filings
Under Section 206(3) of the Investment Advisers Act of 1940, the SEC does not prohibit an
investment adviser, or an investment adviser representative, acting as principal for their own account,
from knowingly selling any security to or purchasing any security from a client (principal transaction), as
long as the transactions are notified to – and receive consent from – the client prior to settlement (i.e.,
after execution) of the transaction. The form of the disclosure is not unique but it varies depending on the
3 The study considers cross trades to be a subset of the general category of opposite trades. However, as the authors recognize, such cross trades are subject to special restrictions. Specifically, under Section 17(a)-7 of the Investment Company Act of 1940, cross trades that are specifically designed to subsidize one fund at the expense of another would be deemed illegal.
6
nature of the transaction.4 Thus, the SEC requires fund advisers to first identify and disclose to clients
potential conflicts of interest related to client transactions, and subsequently implement adequate
compliance programs in order to properly manage such conflicts. 5
In the case of principal cross trading, when the adviser’s client is a mutual fund, Section 17(a) of the
Investment Company Act of 1940 imposes general restrictions on the execution of such transactions.
Nevertheless, principal cross trading is still permitted when the transactions fall within some predefined
boundaries.6 By contrast, no special restrictions apply to agency cross trading (regulated under Section
17(e)) where blanket consent from mutual fund clients suffices to fully authorize the adviser (or its
affiliated entities) to act as an agent in client fund transactions.7 In practice, advisers satisfy this disclosure
and consent requirement by simply inserting a clause in the mutual fund advisory contract. Indeed, the
SEC acknowledges that agency transactions, in contrast to principal transactions, require greater
immediacy in a competitive market, and hence the adviser may not have the opportunity to obtain prior
approval from fund clients.
In agency cross trading, the adviser (or any affiliated broker-dealer) acts as a broker for both the
advisory client and for another entity on the other side of the transaction. In contrast to a principal cross
trade, in an agency cross trade the adviser charges a transaction fee for executing the trade. In these
transactions, the risk of fund adviser’s conflicts of interest could also extend to more subtle practices
where the adviser could allocate for instance, security trades to brokerage customers in exchange for
4 For instance, the adviser must inform the client (e.g., a mutual fund) of: 1) whether the cross-trading is a principal or agency transaction; 2) total profit accruing to the adviser if acting as principal or the total commission earned by the adviser (or its affiliated entities) if acting as agent; and 3) availability of best price elsewhere if that price is better from the client’s viewpoint (Investment Advisory Act Rel. No. 1732-1998). 5 In addition, under Section 17(b) the investment adviser must respect the following general conditions: 1) the transaction is executed at the current market price of the securities; 2) the transaction is consistent with the adviser investment objective(s); 3) the transaction is approved by a majority of independent directors. 6 Examples include: (i) transactions between funds in the family managed by the same adviser as long as such transactions are in the best interest of the funds (Section 17(a)-7); (ii) mergers of affiliated investment companies (Section 17(a)-8); (iii) purchase of securities from a money market fund by the adviser (Section 17(a)-9); and (iv) if a sub-adviser of a fund enters into transactions with funds it does not advise but that are affiliated with the fund the sub-adviser does advise, as in the case of sub-advisers in a family of funds (Section 17(a)-10). 7 This blanket consent is not available when the adviser recommends a trade to both sides of the transaction (i.e., to both buyer and seller). Due to the high risk of conflicts of interest, fund directors’ trade-specific written consent is mandatory in this case.
7
research and other products (soft dollars) within the Section 28(e) safe harbor (see Blume (1993), and
Edelen, Evans, and Kadlec (2008)). In this case, the risk is that the adviser might compromise its
fiduciary duty of “best execution” if trades are generated between the adviser and its (affiliated or
unaffiliated) brokers with the concealed intent to pay for research out of future client commissions. In an
agency cross trade the adviser could also aggregate trades and favor the interest of one of its clients (e.g.,
a pension fund or a hedge fund) over that of another party (e.g., a mutual fund), in order to benefit from
differences in account sizes and fee structures across clients.8 Since the majority of mutual fund accounts
are managed for a fee that is a fixed percentage of the assets under management (see, for example, Deli
(2002)), the adviser could have a significant incentive to redirect favorable investment opportunities or
trades to other accounts structured with performance fees as in the case of either hedge funds (in which
the fund advisers often co-invest) or high net worth individuals.
Under the Investment Advisers Act (1940), fund advisers must register with the SEC by filing form
ADV. This form is principally for use by regulators and it aims at identifying potential risks of advisers’
conflicts of interest. In particular, in part I of form ADV the SEC requires investment advisers to disclose
information about principal or agency participation and their interest in clients’ transactions. Advisers are
also required to provide information on their legal entity (legal name, SEC file number, address); form of
organization (e.g., corporation, limited liability company, partnership); advisory business (e.g., number of
employees, number and type of advisory clients, compensation arrangements, assets and number of
accounts under management); disciplinary history (e.g., enforcements actions and convictions in the
previous ten years); and their governance structure (e.g., tenure and independence of Chief Compliance
Officer and adviser ownership structure).
8 This practice is deemed to be an agency cross trade if the adviser, or its affiliate broker-dealer, receives compensation (other than the customary advisory fee) for effecting the cross transaction (Adv. Act No. IA-1732). See In the Matter of Renberg Capital Management, Inc. Adv. Act Rel. No. 2064 (Oct. 1, 2002).
8
3. Data
The data underlying this study come from several sources. We use the CRSP Survivor-Bias Free US
Mutual Fund Database to construct our sample of mutual funds. In particular, we focus on diversified US
equity mutual funds and exclude fixed income funds, money market funds, and international funds.9 We
restrict the sample to actively managed equity mutual funds and eliminate all index and institutional
funds.10 We filter the data using the investment objectives provided by CRSP.11 This resulted in a final
sample of 4,167 fund share-classes as of December 2007. Since we are interested in fund portfolios, we
use the Wharton Financial Institution Center Number (WFICN) available through MFLinks to aggregate
CRSP fund-classes into portfolios over the sample period. The result is a sample of 2,071 fund portfolios
as of December 2007.
We require funds in our sample to have non-missing data on total net assets (TNA) and returns. We
also restrict the sample to include only those funds with at least one year of reported returns. Consistent
with previous research, we calculate a fund’s monthly net cash flow as:
, , 1 , ,
, 1
(1 ),i t i t i t i t
i t
TNA TNA R M
TNA
where TNAi,t is the total net assets of fund i in month t, Ri,t is the after-fee return reported by fund i in
month t, and Mi,t is the aggregate total net assets of all dead funds merged into fund i in month t. In order
to reduce the effect of outliers on coefficient estimates we winsorize net cash flows at the ninety-ninth
percentile.
9 We further remove from our sample funds whose names contain strings that are inconsistent with our selected policy codes. The adopted CRSP policy code filters are the following: B&P, Bal, Bonds, C&I, GS, Leases, MM, TFE, or TFM. These filters result in the elimination of 353 funds. 10 Since the CRSP database does not provide a flag to distinguish between passive and active funds, we identify and eliminate all funds whose names contain any of the following terms: Index, Idx, Ix, Indx, Nasdaq, Dow, Mkt, DJ, S&P, Barra, 100, 400, 500, 1000, ETF, Exchange, Vanguard, Balanced. In terms of institutional versus retail funds, the CRSP dataset includes a flag to identify institutional funds. In addition to removing those funds classified by the database as “institutional, ” we further filter out additional funds whose names contain any of the following terms: Inst, /Y, /I, Class Y, Class I. The combined filtering of index and institutional funds eliminates 2,369 funds. 11We select funds with the following Strategic Insight objective codes: AGG, GRI, GRO, ING, SCG, or GMC. Similarly, we select funds with the following Lipper codes: G, GI, LSE, MC, MR, or SG.
9
We obtain data on investment advisers from the uniform application for investment adviser
registration (form ADV) available through the Investment Adviser Public Disclosure (IAPD) website
administered by the SEC. Form ADV data have been employed recently by a number of other studies (see
e.g., Chen, Hong, and Kubick (2013)). The form contains unique information related to advisers’ form of
organization, compensation, assets under management, clientele, disciplinary history, governance, and
most importantly adviser-client internal conflicts of interest.
We use the information contained in form N-SAR available through the SEC EDGAR database. Form
N-SAR contains not only mutual fund (NASD) tickers for each fund series – which can be easily linked
to the CRSP dataset, but also SEC file numbers (and names) for each fund adviser (item 008 of the N-
SAR). The advisers’ file numbers (commencing with code 801-) extracted in 2007 from the N-SAR, are
then used to recursively download each advisers’ form ADV from the SEC website. The download is
performed in March 2008 to allow for late reporting of the 2007 semi-annual form N-SAR(B).12 As a
result, we capture a total of 1,406 mutual fund advisers registered with the SEC in 2008.
The matching procedure described above permits us to reliably link the information on mutual funds
in the CRSP database to that available in the form ADV dataset for their advisers. When NASD tickers
are missing, we expand our sample by matching the advisers names contained in form ADV with those
provided by CRSP.13 This results in a final sample of 1,636 fund portfolios (or 3,417 fund-classes)
uniquely associated to their advisers. The 1,636 fund portfolios correspond to a final sample of 560
investment advisers in the form ADV dataset which is manually checked for consistency. These funds
represent about 80% of all CRSP open-end active equity mutual fund portfolios with the selected
investment objectives (or 82% of fund share classes), as of December 2007. We also use twelve previous
years of CRSP data in addition to the 2007 data in order to address possible concerns regarding
12 The detailed adviser information is easily accessible through the following website http://www.adviserinfo.sec.gov/IAPD/Content/Search/iapd_Search.aspx administered by the SEC. 13 We perform this matching manually so as to account for issues such as minor differences in adviser names referring to different adviser organizations (e.g. Legg Mason Fund Adviser Inc versus Legg Mason Partners Fund Advisor LLC), and to account for international divisions of the same company having different names (e.g. American Century Global Investment Management versus American Century Investment Management).
10
survivorship bias in our fund adviser dataset. Thus, our initial sample covers the 13-year period from
1995 to 2007 and permits us to capture possible changes in the time series of fund client characteristics.
As we discuss in more detail below, as an additional robustness check to guard against potential reverse
causality, we also examine the performance of our sample of funds during the period 2008-2011.
The remaining unmatched CRSP sample (435 portfolios) includes funds whose investment advisers
we were unable to retrieve from the SEC website using the file numbers obtained from form N-SAR
(21%). We evaluate whether significant differences exist between the matched ADV-CRSP sample and
the unmatched CRSP sample by comparing the descriptive statistics of the two samples across CRSP fund
share classes in Table 1. The evidence presented in Table 1 indicates that the samples of matched and
unmatched funds are very similar with the exception of few characteristics. Matched fund share classes
are similar to the unmatched fund share classes in terms of size and age. On average, they have total net
assets (TNA) of almost $703 million and 11 years of operations since inception. In addition, their 4-factor
(Carhart (1997)) alpha is slightly lower than that of the unmatched sample. Overall, the sample size and
characteristics for the funds we analyze are very comparable to those of typical studies in this area.
Since our analysis is conducted across fund advisers, we next group mutual funds at the level of their
adviser. Table 2 reports the TNA-weighted characteristics of the adviser fund portfolios averaged over the
sample period, 1995-2007. On average, fund advisers manage $5.4 billion of mutual fund assets (Total
TNA), with this value ranging between $3 million (5th percentile) and $12.3 billion (95th percentile). The
average age (since inception) of the client mutual funds (Age) is approximately 12 years, while the
average (median) number of mutual fund portfolios (Num ports) under adviser’s management is 7 (3). On
average, fund advisers charge operating expenses (OpeX) equal to 1.36% of the assets. This includes a
1.14% management fee (Mgmt fee) and a 12b-1 fee of 22 basis points. The total distribution fees (12b-1
fee plus 1/7th of fund front-end load) are of the order of approximately 51 basis points (Distribution fees).
11
4. Assessing Advisers’ Cross Trading Activities
4.1 Construction of the cross trading proxies
The SEC requires investment advisers to disclose under Item 8 of form ADV any principal (in
Section A) and agency (in Section B) financial interest in client transactions. In general, interested
transactions include buying or selling securities from client portfolios or acting as a broker for
compensation. Specifically, the advisers are required by the SEC to respond to a set of questions (in
Sections A and B of Item 8) which are outlined in Table 3.14 In panel A of Table 3, we document for all
advisers with form ADV filings as of December 2007, the responses to questions relating to critical
transactions where potential conflicts of interest could exist. On average, more than 50% and 32% of
advisers answered affirmatively to questions related to principal and agency trading, respectively. In
particular, more than 80% of the advisers buy and sell for their own account the same securities that they
also buy and sell for their client accounts. Further, these trading practices seem to be strictly related to the
advisers’ investment policies. In fact as seen in panel B of Table 3, the (Pearson) correlation coefficients
between the responses to questions regarding principal and agency trading are consistently positive,
suggesting that fund advisers engaging in principal trading are more likely to also enter into agency
transactions. We confirm that the above figures are qualitatively unchanged for the subset of advisers in
the matched ADV-CRSP sample.
Although we cannot directly observe the extent of cross transactions, we follow the categorization of
the nature of these transactions imposed by the SEC in Item 8 of form ADV (see Table 3) to create three
simple measures to identify cross trading practices:
i. Total cross trading (TCT): the percentage of affirmative answers to questions regarding both
principal and agency cross trades (all six questions outlined in Section A and Section B of Item 8);
14 Additional disclosure entails adviser brokerage or investment discretion. However, since this is almost always the case for fund advisers, Section C of Item 8 does not add any useful information to the identification of areas in which conflicts of interest might occur.
12
ii. Principal cross trading (PCT): the percentage of affirmative answers to questions 1 to 3 of Section
A of Item 8 relating to principal cross trades;
iii. Agency cross trading (ACT): the percentage of affirmative answers to questions 1 to 3 of Section B
of Item 8 relating to agency cross trades.
The above measures do seem to do a good job of capturing the potential conflicts of interest of
investment advisers. For example, the group of advisers with the highest TCT scores includes a number of
advisers (e.g., Beacon Hill Asset Management and Evergreen Investment Management) against whom the
SEC initiated legal actions. For part of the analysis, each of the three nominal measures of cross trading is
sorted into quintiles and transformed into a simple ordinal (rank) variable with values ranging between 1
and 5.
4.2 Characteristics of fund advisers
We first group our sample of 536 advisers into quintiles based on their total cross trading measure
(TCT): fund advisers in Portfolio 1 (5) are those categorized by the value of their TCT measure as advisers
with low (high) levels of engagement in principal and agency cross transactions. We then compute the
descriptive statistics for the key fund adviser related variables constructed using information from
different sections in form ADV. These statistics are documented in Table 4, while the Appendix provides
a detailed description of these variables. We also compute the average statistics of fund advisers grouped
by portfolios of sorted TCT.
On average, fund advisers have $22 billion of total assets under management, ranging between $4
billion for advisers with low level of total cross trading (Low TCT) to $52 billion for advisers with high
level of total cross trading (High TCT). The total number of client accounts (including mutual funds)
computed at the mid-point of the intervals defined by the SEC in Item 5 of form ADV is 187. Almost 50%
of the advisers are remunerated by their clients on the basis of a performance fee (D.[Performance fee]).
This form of compensation is rarely used by mutual fund clients. Table 4 also indicates that a very large
number of advisers (80%) receives research and other products (other than order execution) from
13
affiliated broker-dealers (D.[Soft Dollars]). Interestingly, although Chief Compliance Officers (CCO)
should ideally preserve their independence from the advisory firm, it appears that about 50% of CCOs
hold other leading positions within the advisory firm (D.[CCO Dependence]). The CCOs also have an
average tenure of about 6 years since their first appointment to the advisory firm (CCO Tenure), with this
tenure monotonically decreasing from 8 years for funds in the Low TCT portfolio to about 5 years for
funds in the High TCT portfolio. Finally, the adviser’s form of organization (D.[Corporation]) does not
seem to play any significant role on the extent of cross trading activities.15
In Table 5 we first group fund portfolios by quintiles of sorted values of TCT and then average the
fund portfolio characteristics previously aggregated (TNA-weighted) at the adviser level. As indicated in
Table 5, advisers in quintile 1 (Low TCT) engage only marginally (6.7%) in transactions falling under the
radar of Item 8 of form ADV, in contrast to advisers in quintile 5 (High TCT) where the proportion of
these transactions reaches 84%. Advisers characterized by higher values of the TCT measure manage
younger funds characterized by higher total volatility and significantly lower 3-factor and 4-factor model
intercepts or alphas. Overall, fund advisers in the top TCT quintile (High TCT) underperform those in the
bottom TCT quintile (Low TCT) by about 1% per year.
In unreported results we obtained similar results when gross (rather than net) performance measures
are considered. This finding confirms that the poor performance of funds managed by advisers subject to
potentially high cross trading activities is not simply due to higher operational expenses of such funds.
We also examined whether the underperformance of fund advisers in the top TCT quintile is confined
only to advisers with below-median level of total assets under management. Our performance-related
results hold irrespective of whether we consider advisers with below- or above-median level of assets
under management.16
15 On average, in our sample about 53% of fund advisers are organized as a corporation, while 37% are organized as a limited liability company (LLC). The remaining 10% of advisers are structured as partnerships (7%), limited liability partnerships (2%), and sole proprietorships (1%). 16 The results of these additional tests are available from the authors upon request.
14
5. Empirical Results
In this section, we evaluate advisers’ incentives to cross clients’ transactions, the effect of this
practice on the performance of client funds of an adviser in a multivariate setting, and the role of advisers’
internal governance in monitoring principal and agency cross transactions. We use several models to
compute the performance for the client fund portfolios. In addition to the CAPM alpha, we compute the
fund alphas based on the 3-factor Fama and French (1993) model, and the 4-factor Carhart (1997) model.
We test the robustness of our findings by employing the conditional factor model of Ferson and Schadt
(1996).17
Since our analysis focuses on the performance of the client fund portfolios of advisers, we aggregate
the individual fund portfolio alphas at the level of the adviser by using the fund TNAs as weights. The 4-
factor Carhart (1997) model is the representative model used in this paper. Results for all the other models
are reported as additional tests in our tables. The Carhart (1997) model is expressed as follows:
, ∙ ∙ ∙ ∙ 1 , , 1
where ri,t is the month t return on fund i (net of T-bill rate), RMRFt is the month t excess return on the
value-weighted market index portfolio, and SMBt, HMLt and PR1YRt are the month t returns on value-
weighted, zero-investment, factor mimicking portfolios for size, book-to-market equity, and 1-year
momentum factors in stock returns, respectively.18 As in Carhart (1997), we employ an overlapping three-
year estimation period for the above model. If less than three years of prior data are available for a
specific fund in a given estimation month, then we require this fund to have at least 30 months of
available observations for it to be included in the estimation.
17 The lagged instruments for the Ferson and Schadt model include: (i) the level of the 1-month Treasury bill yield; (ii) the term spread, computed as the difference between the yield of a constant maturity 10-year Treasury bond and the yield on a 3-month Treasury bill; (iii) the dividend yield of the S&P500; and (iv) the default spread, computed as the yield difference between Moody’s Baa-rated and Aaa-rated bonds. 18The data on the various factors are obtained from Kenneth French’s website.
15
5.1 Adviser Incentives to Engage in Cross Trading
What are the economic incentives of advisers that motivate them to engage in cross trading? In order
to formally address this issue we consider probit regressions of the different measures of adviser cross
trading activities (TCT, PCT, ACT) on several adviser characteristics that may be related to the incidence
of cross trading. Our dependent variable equals 1 if the relevant cross trading variable has a value greater
than the cross-sectional median value, and zero otherwise. Since cross trades may be attractive as a source
of revenue from affiliated trading operations we use the following adviser characteristics as explanatory
variables (refer to the Appendix for a detailed description of the adviser variables): (a) total number of
clients, including mutual fund clients (Num Clients), (b) total amount of assets under adviser’s
management across all client accounts (including mutual fund accounts) and expressed in billions of
dollars (Log Adviser AUM), and (c) the proportion of adviser’s employees (out of the total number of
employees) who are registered broker-dealers to be used to buy or sell securities for a client’s account
(Empl_Broker/Dealers). The presence of broker/dealers among adviser’s employees indicates that the
advisory firm is also actively engaged in the business as a brokerage house.
To capture the incentive effects arising out of agency relationships that the adviser may have with
other clients, we use the variables PF clients and HF clients representing the percentage (out of the total
number of adviser clients) of pension funds and hedge funds to whom the adviser provided investment
advisory services, respectively.19 We also use the binary variable, D.[Soft Dollars], which equals 1 if the
adviser engages in soft-dollar practices with brokerage firms, and the binary variable, D.[Performance
fee], which equals 1 if the adviser provides any advisory service compensated by performance fees. We
employ a number of fund related (lagged) control variables. Since the analysis is conducted at the level of
the fund adviser, the fund related variables are appropriately weighted by the respective fund TNA and
then aggregated across the client funds of an adviser. The lagged control variables include: logarithm of
TNA (Log TNA) to proxy for the size of the fund; logarithm of the number of years since fund inception
19 Note that the information required by the SEC in relation to hedge fund clients (Item 5 of form ADV) as captured by our variable HF clients, could be affected by significant noise since it also include pooled investment vehicles other than hedge funds. On the other hand, this issue does not affect the variable, PF clients.
16
(Log Age); operating expenses (OpeX); portfolio turnover consisting of the aggregate sales or aggregate
purchases of securities; and Flows, the yearly net cash flows to the client funds of the adviser.
We also include in our regressions the variable Φflow-performance which measures the flow-performance
sensitivity of fund flows to the fund adviser. The variable is calculated as the first derivative of adviser
client fund net cash flows with respect to performance , , , ,
given the lagged information set, Ii,t-1 (comprising fund TNA, age, turnover, total volatility, operating
expenses, and an interaction term between age and performance).20 In all models we include (untabulated)
year dummies to account for time series variations in the control variables over the period from January
1995 to December 2007.
The results are presented in Table 6. We note that the incentive to engage in cross trading is positively
and significantly correlated with a measure of the importance of trading operations to the adviser, namely,
Empl_Broker/Dealers. Another reflection of this fact is seen in the strong positive association between
the measures of total and agency cross transactions (TCT and ACT) and the logarithm of total amount of
assets under adviser’s management across all client accounts (Log Adviser AUM) as well as the existence
of soft-dollar arrangements (D.[Soft Dollars]). Soft dollar practices have been widely criticized as a way
in which advisers could enrich themselves at the expenses of fund shareholders. Advisers counter that soft
dollars help them manage fund accounts more effectively. The positive association between D.[Soft
Dollars] and TCT suggests instead that these brokerage arrangements constitute an implicit incentive for
advisers to execute cross trades via those affiliated brokers that provide research and other services in
exchange. Based on our estimates in specification (vii), fund advisers with soft dollar arrangements have
a 10% higher probability of engaging in agency-related cross trading activities (holding all other variables
at their mean values). Similarly, in general, cross trades are significantly more likely with an increase in
the number of clients of the adviser (Num Clients). This is to be expected given that the opportunities to
20 The flow sensitivity of client fund portfolios is estimated with respect to the unconditional Carhart (1997) four-factor model alpha as our proxy of performance (Performancei,t-1). Our results do not change when the following proxies are used in the estimation: (a) objective-adjusted returns; (b) unconditional Fama-French 3-factor alphas; and (c) Ferson and Schadt (1996) conditional alphas.
17
execute cross trades are likely to increase with an increase in the number of client funds being managed
by the adviser.
A question of interest is how the existence of performance fee arrangements may influence the
adviser incentives to engage in cross trading practices. The prospects of earning higher compensation
from accounts that have a performance fee could cause the adviser to favor such accounts to the detriment
of mutual fund accounts when executing trades. Accordingly, in specification (iv) we include the dummy
variable D.[Performance fee]. Consistent with our expectation, the results of specification (iv) indicate
that engagement in cross trading is significantly more likely when advisers’ compensation in other
accounts is based on performance fees.
Lakonishok, Shleifer, and Vishny (1992) and Del Guercio and Tkac (2002) highlight the critical
importance for a pension fund adviser to preserve a good track record in order to be shortlisted for
interviews by pension fund consultants, and ultimately access (or retain) pension assets. As a result, the
significant pressure created by pension clients’ sensitivity to performance could lead advisers to favor
these clients at the expense of other client accounts. Hence, we control for the incentive effect that the
presence of either pension funds (PF clients) or hedge funds (HF clients) among advisers’ client accounts
has on the likelihood that the adviser crosses a trade between accounts through affiliated brokers. We
confirm that the presence of hedge funds, and especially pension funds, among advisers’ client accounts,
translates into a significantly greater probability of conflicts arising from agency cross transactions.
In specifications (iii) and (vii) we include the variable Φflow-performance. Chevalier and Ellison (1997) and
Christoffersen and Musto (2002) emphasize the importance of investor insensitivity in explaining the
level of mutual fund fees and risk taking behavior of their fund managers. Our results from specifications
(iii) and (vii) indicates the presence of a significant negative association between TCT and Φflow-performance
which suggests that fund advisers are more likely to engage in cross trading activities when facing a less
elastic investor demand. This negative relationship could of course simply reflect a lack of investor
awareness of the potential (net) costs associated with cross trading practices. Given the lack of previous
research on this issue, that would perhaps not be surprising.
18
Overall, the findings reported in Table 6 confirm that the opportunity to generate revenues from
trading operations provides powerful incentives for advisers to execute cross trades. Thus, the evidence
presented in this section suggests that such trades are potentially quite valuable from the perspective of
the fund advisers.
5.2 Adviser Cross Trading Intensity and Client Fund Performance
We now analyze the relationship between the net (after-fee) performance of adviser fund portfolios
and the intensity of adviser’s cross trading (TCT).21 For this purpose, we employ the ordinal (rank) TCT
measure since we are interested in examining how the performance-TCT relation varies across cross
trading quintiles rather than within each quintile. The results are reported in Panel A of Table 7. With the
exception of column (v) we employ different measures of advisers’ value-weighted yearly performance as
the dependent variable. The dependent variable in column (v) is the equally-weighted unconditional
Carhart (1997) 4-factor alpha. The reported estimates are based on cross-sectional regressions with
Newey-West (1987) standard errors corrected for heteroskedasticity and autocorrelation, with the
exception of the estimates in column (iii). The coefficients in column (iii) of Panel A of Table 7 are
estimated by pooled OLS. We control for a number of variables that are known to influence fund
performance. These (lagged) variables include: logarithm of fund TNA (Log TNA) to reduce the
likelihood that our estimated coefficients may be driven by small funds (Chen et al. (2004)), logarithm of
fund age (Log Age) to remove any distortion due to fund advisers cross-subsidizing young funds with new
investment flows (Barber, Odean, and Zheng (2005)), minimum of fund aggregate sales or purchases of
securities (Turnover), volatility of realized returns over the previous 12 months (Volatility), and fund
operating expenses (OpeX).
Next, we control for the distribution of managerial talents across different cross trading intensity
groups as this could indirectly affect the relationship between TCT and fund performance. For instance, if
mutual funds account for a smaller percentage of the overall advisory business for advisers characterized
21 When gross (before-fee) returns are used as the dependent variable the results are consistent with those presented here and are available upon request from the authors.
19
by a high level of cross trading (high TCT), it is conceivable that such mutual funds may not enjoy much
priority in terms of resource allocation compared to other business lines. This could potentially cause such
funds to be less competitive in the labor market for talented mutual fund managers. The lack of
managerial talent could then explain the relative underperformance of high TCT funds even in the absence
of a direct link between the TCT measure and the performance of client funds. To address this concern we
control for the average client mutual fund managers’ tenure (in years) as a proxy for the degree of
managerial experience and skill (Manager Tenure). We also control for the average size of the
management team of an adviser (Team Size).22
The results of Table 4 indicated that fund advisers with high TCT tend to be bigger firms with more
assets under management and are more likely to manage funds in many different investment styles. Hence,
in all regression specifications we control for the total amount of assets (expressed in billions of dollars)
under adviser’s management across all client accounts (Log Adviser AUM). Also, Massa (2003) shows
that there is a significantly negative relation between the performance of mutual funds and the degree of
product differentiation in the particular category the funds are active in. To account for the effect of
product differentiation on performance we include the non-performance-related proxy, Differentiation
(Γc), as a control variable. This proxy measure is computed as the yearly standard deviation of fund
charges (fund operating expenses and loads) across all funds active in each investment objective. To
guarantee a uniform range of variation we follow Massa (2003) and standardize the proxy by its
maximum value over the entire sample period.23 All control variables are aggregated at the level of the
adviser fund portfolios using the individual fund TNAs as weights.24
22 We test this alternative hypothesis using the Morningstar database on managerial attributes over the period 1995-2007. The Morningstar database contains information on about 15,377 distinct manager codes. We link managers’ data in Morningstar to our mutual fund sample using NASD tickers. The average manager in our sample has a tenure of five years with the same fund, while the average management team comprises about four managers. 23We also compute a performance-related differentiation proxy based on realized returns instead of fund charges (refer to Massa (2003) for further details). Since this test yields qualitatively similar conclusions, we do not report the results for brevity. The value of our non performance-related differentiation index averages at about 61%, while that of the performance-related differentiation index averages at 16.1%. 24 Alternatively, we could have assigned each advisory variable across all mutual funds managed by the same adviser. However, pooling variables in this way could seriously understate standard errors, particularly in case of adviser-level variables.
20
The results in Panel A of Table 7 indicate that cross trading practices represent a considerable drag on
fund performance. As an example, on average, a one-standard deviation increase in the ordinal (rank)
TCT measure is associated with a significant reduction in yearly fund performance by approximately 0.48%
per year at the margin. This evidence is consistent with that documented in Table 5 where a zero-
investment rolling portfolio that takes a long position in the bottom quintile of funds ranked by the TCT
measure and a short position in the top quintile of funds, generated a statistically significant annual alpha
of 1.17% (based on the 3-factor model) and 1.03% (based on the 4-factor model). Similar conclusions
obtain when the conditional Ferson-Schadt model (Conditional 4-factor) is employed (in specification
(viii)), indicating that superior fund performance of advisers with low levels of the TCT measure is not
due to performance sensitivity to changing macroeconomic conditions. 25
It is of interest to quantify the economic magnitude of the negative impact of TCT on fund
performance. Based on the estimates in columns (iii) and (iv) of Panel A of Table 7, the coefficient of the
TCT variable is approximately -0.37. The average value of the ordinal (rank) TCT measure for the
advisers in the sample is 3.0. This implies that the cross trading related costs impose an average penalty
of 1.1% (=0.37*3) in terms of the reduced Carhart (1997) 4-factor alpha of the adviser fund portfolio.26
According to the statistics provided by the 2014 Investment Company Fact Book
(http://www.icifactbook.org/), actively managed U.S. domestic equity funds had aggregate assets of $4
trillion as of the end of 2013. This figure represented nearly 27% of the total U.S. mutual fund assets of
$15 trillion as of the end of 2013. Given the aggregate active equity fund assets of $4 trillion, the implied
annual cost to investors in these funds amounts to $44 billion (=1.1% of total assets). This, admittedly
25 As a robustness check, we investigate whether the negative relation between TCT and client fund performance in Tables 7 is driven by funds in the extreme TCT quintiles. In unreported tests, we employ a dummy variable (D.[LowScore]) which equals 1 for advisers with below-median TCT values, and zero otherwise. The relation between performance and TCT remains negative and significant for client funds of both the low and high TCT advisers, indicating that our results in Tables 7 are not driven exclusively by advisory firms experiencing severe conflicts of interest. We also evaluated the sign and significance of the cross sectional relation between performance and TCT in each of the previous five years from 2003 to 2007 and reached qualitatively similar conclusions. 26 Interestingly, the 1.1% figure is of the same order of magnitude as the average management fee for the sample of 1.14%, reported in Table 2.
21
rough calculation, suggests that the economic impact of the cross trading related underperformance is
quite substantial.
Our results do not seem to be driven by family or fund characteristics. Specifically, even after
controlling for the logarithm of total amount of assets under adviser’s management (Log Adviser AUM)
across all client accounts (including mutual fund accounts) and the total net assets of the adviser fund
portfolio (Log TNA), we continue to obtain a significant negative loading of the dependent variable on
TCT proxies. Further, consistent with Massa (2003) and Siggelkow (2003), product differentiation (Γc) is
consistently negatively related to adviser fund (portfolio) performance. However, it is clear that the
negative relation between client fund performance and different cross trading measures is robust to the
inclusion of the product differentiation proxy as an additional control variable.
Further, although managerial experience is positively related to performance, this does not seem to
drive the relationship between cross trading proxies and fund performance. Specifically, there is a
significantly negative relationship between fund performance and TCT across all model specifications
even after controlling for Manager Tenure. The evidence of a negative, albeit insignificant, relation
between fund performance and Team Size is consistent with the results documented by Baer, Kempf, and
Ruenzi (2005).
In Panel B of Table 7 we test the robustness of our results on the negative relationship between cross
trading and performance by focusing on fund adviser answers to sections A.1 and B.1 of Item 8 of form
ADV which should capture the most problematic cross-trading transactions. In particular, we construct
the following two dummy variables: Section A.1 which equals 1 if the adviser indicates to the SEC that it
buys securities from (or it sell securities to) advisory client accounts, and Section B.1 which equals 1 if
the fund adviser indicates it engages in cross transactions between client account(s) and brokerage
customers. Overall, the findings of Panel B are consistent with those documented in Panel A of Table 7.
Since the SEC imposes greater restrictions on principal – as opposed to agency – cross transactions, it is
not surprising that the negative and significant relationship between TCT and performance is mostly
22
driven by brokered (agency) cross trades given the relatively lax compliance procedures required of an
adviser in this case.
It could be argued that cross trading related conflicts of interest are more likely to arise at advisory
firms with poorly performing funds. Under this scenario, conflicts of interest related to cross trading
would be a consequence, rather than the cause, of poor client fund performance. To guard against this
potential reverse causality, we also analyze the relationship between our cross trading proxies that are
constructed using form ADV data from 2007, and the subsequent performance of client funds over the
period 2008 to 2011. The results of this test are documented in Panel C of Table 7. The findings confirm
that on balance, cross trading related conflicts of interest negatively impact the performance of client
funds. In particular, note that the negative loading of fund performance, as measured by the unconditional
4-factor alpha over the subsequent period 2008 through 2011, on ACT is -0.419 (column vi) which is
highly significant in both statistical and economic terms. Interestingly, this estimate is about 60% larger
in absolute value than the corresponding estimate (-0.255) documented in Panel A of Table 7 based on
fund performance over the earlier period 1995 through 2007.
The test in Panel C of Table 7 may not properly address the issue of reverse causality if the advisers’
cross trading behavior does not vary from year to year. To address this concern we analyze the time series
variation of the TCT, PCT and ACT measures over the period 2009 to 2014.27 We obtain data from the
SEC containing yearly ADV forms submitted by approximately 17,120 investment advisers. We find that
the average annual standard deviations of the nominal TCT, PCT and ACT measures are 0.47, 0.41, and
0.52, respectively.28 In unreported results we also analyze the first order serial correlation of the TCT,
PCT and ACT measures over the period 2009 to 2014. Our findings indicate that there is considerable
year-to-year variation in the three measures as evidenced by the modest and insignificant first order serial
correlations in each case.
27 The historical form ADV data containing information on advisers’ responses to questions in Item 8 (participation or interest in client transactions) are only available since 2009. We thank the SEC for making the historical data files available. 28 The average values for the TCT, PCT and ACT measures are 0.37, 0.46, and 0.27, respectively.
23
Our previous evidence in Table 6 indicated that cross trading incentives are significantly stronger
among those advisers that have affiliated broker/dealers or soft dollar arrangements, and those managing
pension fund and hedge fund assets. It follows that a more detailed analysis of the economic determinants
of the underperformance reported in Table 7 is important to understand how this underperformance
depends on adviser incentives that capture the severity of cross trading activities. Accordingly, we next
consider interaction effects between our cross trading related variables and proxies for fund advisers’
incentives to engage in such transactions. In all regression models we also control for (untabulated) fund
and adviser characteristics (aggregated at the adviser level).
The results are presented in Table 8. We report Fama and Macbeth (1973) estimates with Newey-
West autocorrelation and heteroskedasticity robust standard errors (in parentheses). Overall, the findings
show that the underperformance becomes particularly severe if fund advisers engaging in agency cross
trading (ACT) also have soft dollar arrangements with their brokers, charge performance-based fees on
client accounts, or employ a large proportion of registered representatives of broker/dealers. Interestingly,
the greater the brokerage fees paid by fund advisers to their brokers, the greater the incentives of fund
advisers to cross clients’ trades with brokerage customers, thereby leading to a significantly worse impact
of the variable ACT on fund adviser performance.
5.3 Additional Robustness Test
A potential concern with our results is that despite the use of an extensive set of control variables in
the regression specifications, the TCT measure might be correlated with certain omitted variables, namely,
other (potentially unobserved) fund adviser characteristics, that are related to fund performance. In this
sense the TCT variable may proxy for the unobserved fund characteristics that may be the real source of
the fund (adviser) underperformance. This would be an alternative explanation for the negative relation
between fund adviser performance and TCT documented in Table 7, for example.
In order to address the above (endogeneity) concern we adopt a 2-stage instrumental variable
estimation procedure. The ideal instrument should be correlated with the TCT measure, but should not be
24
directly related to fund adviser performance (other than through its impact on TCT). Accordingly, we use
as instrument a fund advisor characteristic that is important in predicting advisers’ cross trading, but does
not directly affect fund advisers’ performance. Specifically, we adopt the average account size for funds
invested with the fund adviser as an instrument for TCT. It is reasonable to assume that the larger the
clients’ average account size, the greater their incentive to monitor fund advisers’ behavior, and the more
successful they will be in discouraging any unfavorable cross trading activities. This suggests a negative
correlation between the size of investors’ accounts and the probability that fund advisers would engage in
cross trading.
Panel A of Table 9 presents the results of the first stage estimation. The results suggest a strong and
statistically significant negative relation between cross trading proxies and average account size. As
expected, fund advisers managing larger discretionary accounts are less likely to cross clients’ trades.
Based on the first stage regression results reported in Panel A of the table, we derived the implied
(estimated) cross trading measures as the expected value of TCT, PCT and ACT based on a projection on
the selected instrument and other explanatory variables that provide advisers’ incentives to cross clients’
trades. We use the implied (estimated) cross trading measures as the independent variables in a second
stage regression where the dependent variable is a measure of the adviser client funds’ risk-adjusted
performance (CAPM, 3-factor, and 4-factor). Other lagged control variables include: logarithm of fund
TNA (Log TNA), logarithm of fund age (Log Age), portfolio turnover (Turnover), fund managers’ tenure
(Manager Tenure), average size of the management team of an adviser (Team Size), total amount of assets
(expressed in billions of dollars) under adviser’s management across all client accounts (Log Adviser
AUM), mutual fund product differentiation (Differentiation), and fund operating expenses (OpeX).
The results of second stage regressions are presented in Panel B of Table 9. These findings are
directly comparable to those documented in Panel A of Table 7. Overall, the estimated coefficients on the
cross trading proxies are always negative and statistically significant, with the exception of PCT.29 More
29 We note that the standard errors of the second stage estimates are appropriately adjusted to account for the ‘generated’ nature of the regressors obtained from the first stage.
25
importantly, these coefficients are between 3 and five times larger, in absolute value, than those presented
in Panel A of Table 7. Thus, controlling for endogeneity significantly improves the point estimates and
provides strong evidence of the negative relationship between fund performance and cross trading proxies.
It is also worth noting that the correlation between the error term from the second stage estimation and the
chosen instrument, is less than 5% in all cases.
In summary, the above analysis confirms that our finding of a negative relation between fund adviser
performance and the cross trading measure TCT is robust to controlling for the potential endogeneity
concerns. While we cannot entirely rule out the possibility that the TCT measure may also proxy for other
potential conflicts of interest that are unrelated to cross trading, the above analysis provides strong
evidence that cross trading related conflicts are a major source of the fund underperformance we
document.
5.4 Investors’ Capital Allocation in Response to Fund Advisers’ Cross Trading
Given the negative relation between the advisers’ cross trading measures for fund advisers and the
performance of their client funds, a natural question is whether investors in these funds are sensitive to
cross trading practices. To address this issue we examine how net cash flows of the client funds of an
adviser are affected by measures of cross trading intensity of advisers after controlling for other variables
known to influence fund cash flows. Specifically, we adopt a cross-sectional regression framework in
which the dependent variable is the TNA-weighted net cash flow experienced by the portfolio of client
mutual funds of an adviser. The explanatory variables include the various cross trading proxies described
earlier (TCT, PCT, and ACT), along with several control variables aggregated at the level of the fund
adviser (measures of past fund performance, TNA, age, operating expenses, turnover, and standard
deviation of monthly realized returns) known to influence flows from previous research (Sirri and Tufano
(1998), Berk and Green (2004), and Huang, Wei, and Yan (2007)). 30 To account for the potential
convexity of the flow-performance relationship we also include the squared value of the relevant
30 The fund related variables are appropriately weighted by the respective fund TNA and then aggregated across the client funds of an adviser.
26
performance measure. Furthermore, in two specifications we employ the number of SEC enforcement
actions against the advisory firm in the previous 10 years as an additional control variable.
The results of this analysis are presented in Table 10. We note that regardless of the specification
employed, there is no significant relationship between fund flows and any of the cross trading measures,
after controlling for other factors. On the other hand the significantly positive coefficients on measures of
(lagged) fund performance confirm the fact that investors chase past fund performance. For example,
from specification (iv) we observe that the coefficient on the 4-factor alpha for the client fund portfolio is
0.192 which is statistically significant at the 1% level. A similar strong relation between past performance
and subsequent flows is evident in other regression specifications as well. In addition, consistent with
Ippolito (1992), Gruber (1996), Chevalier and Ellison (1997), Goetzmann and Peles (1997), Sirri and
Tufano (1998), and Lynch and Musto (2003), mutual fund investors evidence a convex flow-performance
sensitivity. The significantly positive coefficients for the squared value (Performance2) of objective-
adjusted returns (in specification (ii)) and of 4-factor alpha (in specification (iv)), indicate a convex shape
of the flow-performance relation.
We also include the proxy for investor performance sensitivity (Q/MAX) proposed by Christoffersen
and Musto (2002) aggregated (TNA-weighted) at the level of fund adviser. This measure captures the
extent of asset retention by a fund adviser and is computed as the ratio of the fund TNA in the last month
of period t to the maximum fund TNA reported over all months up to the end of period t. The results of
Table 10 support the argument of Christoffersen and Musto (2002) that Q/MAX is a proxy for sensitivity
given the positive relationship between Q/MAX and flow-performance sensitivity: higher asset retention
(Q/MAX) captures a higher sensitivity of flows to performance (alpha*Q/MAX) in specification (v).
Finally, consistent with previous research, the (proportional) fund flows are negatively related to the TNA,
age, and operating expenses of client fund portfolios. Interestingly, the results from specification (ii) and
(iv) suggest that there is no significant relation between the flows to client funds and the number of
enforcement actions (N.Enforced) initiated by the SEC against the adviser over the previous 10-year
period.
27
Overall, the results in Table 10 suggest that investor fund flows are not sensitive to conflicts of
interest possibly arising from fund advisers’ decision to execute principal or agency cross transactions.
This could of course simply reflect a lack of awareness of the potential (net) costs associated with cross
trading practices. Given the lack of previous research on this issue, that would perhaps not be surprising.
5.5 The Effect of Brokerage Commissions on Advisers’ Incentives to Engage in Cross Trading
In the previous sections we focused exclusively on the significant performance penalty on mutual
fund client portfolios due to conflicts of interest of advisers related to total, principal, and agency cross
transactions. However, we have not yet identified the entities that are likely to benefit at the expense of
mutual fund clients. Indeed, fund advisers’ engagement in agency cross trades could favor a multitude of
interests varying from affiliated brokerage clients to other client accounts including pension fund or hedge
fund portfolios. In the case of other clients such as pension funds, the lack of detailed information about
who manages their portfolios makes it quite challenging to accurately quantify the benefits of agency
transactions accruing to these accounts. By contrast, information on the dollar and percentage
commissions paid by fund advisers to their affiliated broker-dealers is publicly available. This allows us
to assess whether broker-dealers are among those who profit from the execution of agency cross
transactions.
Since brokerage commissions paid by mutual fund clients negatively impact their performance, any
evidence of inflated commission revenues paid to affiliated brokerage houses by fund advisers engaging
in agency cross transactions would provide valuable insights into the payoff transfers to entities involved
in such transactions. Additionally, in the previous section we highlighted that a more direct incentive for
fund advisers to engage in agency cross trading is the presence of soft dollar arrangements with broker-
dealers in exchange for research and other related services. Hence the availability of soft dollars should
give fund advisers substantial incentives to trade fund client portfolios in order to earn soft dollar credits
without paying them out of their own profits (i.e., “hard dollars”).
28
To test whether fund advisers engaging in agency cross transactions (ACT) at a high rate are also
those more likely to be associated with above-average brokerage commissions we follow the approach
proposed by Edelen, Evans, and Kadlec (2007). Specifically, we use the semi-annual N-SAR filings from
1995 to 2007 to collect information on the total dollar commissions (N-SAR Item 021) paid by mutual
fund advisers to their broker-dealers (Brokerage fees ($)).We also compute the percentage brokerage
commission rates (Brokerage fees (%)) by scaling the total dollar commissions by the sum of the
aggregate purchases (N-SAR Item 071-A) and aggregate sales (N-SAR Item 071-B) executed by broker-
dealers of the fund. The descriptive statistics of these two brokerage commission variables are
documented in Table 4. Consistent with Edelen, Evans, and Kadlec (2007), advisers pay a brokerage fee
rate of about 0.13%, with this rate varying from 0.07% for the low-TCT adviser portfolio to 0.28% for the
high-TCT adviser portfolio. In an average reporting period of the N-SAR form, dollar commissions
channeled to brokers by high-TCT advisers are about 178 million dollars, a business volume which is
considerably larger than the 71 million dollars paid by client funds of low-TCT advisers. Figure 1 depicts
the average brokerage expenses for fund portfolios grouped into quintiles based on the total cross trading
(TCT) and agency cross trading (ACT) measures.
In Table 11 we report the results of several probit regressions of the dichotomous dependent variable,
TCT or ACT, on several fund advisers’ characteristics (see the Appendix for more details on variable
definitions). Our main independent variables of interest are the percentage (Brokerage fees (%)) and
dollar (Brokerage fees ($bn)) commissions paid to brokerage houses. We also interact brokerage
commission rates with the following two dummy variables: (i) D.[Soft Dollars] which equals 1 if fund
adviser engages in soft-dollar practices with brokerage houses, and 0 otherwise; and (ii)
D.[Aff.BrkgHouse] which equals 1 if fund adviser is itself a brokerage house or executes agency
transactions through its affiliated brokerage house(s), and 0 otherwise. We expect that a fund adviser may
have greater incentives to (re-)direct off-market agency cross transactions to broker-dealers if the latter
constitute affiliated entities, or if specific arrangements to receive research or other services exist between
the two parties. The positive loadings (0.647 and 0.842) of the dependent variables TCT and ACT on the
29
variable Brokerage fees (%) indicate that the larger the commission rates paid to broker-dealers, the more
likely that fund advisers would engage in cross trades involving their mutual funds client portfolios. More
importantly, this pattern applies exclusively to the cases where fund advisers are themselves brokerage
houses or execute agency transactions through legally-affiliated brokerage houses (Brokerage
fees*D.[Aff.BrkgHouse]), or where they have special contractual arrangements with broker-dealers to
receive soft dollar credits in exchange (Brokerage fees*D.[Soft Dollars]). This result is consistent with
Edelen, Evans, and Kadlec (2008) who find that only the non-informative component (expense shifting)
of brokerage commissions conceals the potential risk of agency conflict. We show not only that this is
indeed the case but also, and more importantly, that this conflict manifests itself through agency cross
transactions. Our conclusions do not change when dollar-value brokerage fees (Brokerage fees ($bn)) are
used as an explanatory variable.
Overall, our findings suggest that: (a) the lure of research and other services subsidized through
mutual fund clients’ assets provides fund advisers with a strong motivation to resort to off-market agency
cross transactions, b) situations where the adviser directs brokerage commissions to affiliated brokerage
house(s) significantly increase the likelihood that the adviser executes agency cross transactions, and (c)
the substantially higher commissions paid by client funds of high-TCT advisers are a major source of their
underperformance.31
5.6 Adviser Governance and the Incentives to Engage in Cross Trading
In this section we provide evidence on the relationship between the internal governance of fund
advisers and their propensity to enter into principal or agency transactions. For this purpose, we examine
the ownership structure of fund advisers using the information contained in Schedule A of form ADV.
31 We also examined the direct impact of brokerage fees on client fund performance by re-estimating the model in Table 6 while substituting TCT and ACT with the variable Brokerage fees and its interactions with the dummy variables D.[Soft Dollars] and D.[Aff.BrkgHouse]. In general, our results – available upon request – clearly indicate that the (unconditional and conditional) performance of client fund portfolios is significantly worse when brokerage fees (expressed either in percentage or dollar terms) are directed to affiliated brokerage houses or to broker/dealers with whom the adviser has pre-existing soft dollar arrangements.
30
Adviser’s Ownership Structure A number of recent studies in the literature have examined the
effect of ownership on several mutual fund characteristics.32 An equally important issue is the question of
whether a large ownership stake in the advisory firm has any significant effect on the investment policies
adopted by the adviser. On the one hand, a large ownership stake in the adviser may not necessarily be in
the best interest of mutual fund clients (and other small shareholders) if monitoring activities of large
shareholders are compromised by the allure of large profits from principal or agency transactions (e.g.
soft dollars, performance fee of hedge fund clients, large pension fund clientele, etc.) of fund advisers. On
the other hand, since large shareholders are in most cases key players in the operations of the firm, they
have better access to information on the adviser’s policies and procedures. Consequently, a larger or more
concentrated stake in the advisory firm could create incentives for them to ferret out any wrongdoings
which could potentially result into the termination of the investment mandate by the mutual fund clients,
or even the cancellation of the registration by the SEC. As a proxy for the level of control over the adviser,
we compute the proportion of control owners (out of the total number of owners) with 25% or more of the
adviser’s voting securities or capital (Control Owners). 33 As an additional proxy, we calculate the
percentage ownership level in fund advisers. This ownership variable is computed at the mid-point of
each of the ownership intervals defined by the SEC in Schedule A of form ADV (Ownership Structure).34
Adviser’s CCO Before the mutual fund scandals of 2003 investment advisers were not required to
establish and maintain comprehensive compliance policies. In the same year the SEC introduced Rule 206
(4)-7 with the aim of strengthening the internal governance of fund advisers. This rule requires advisers to
designate a Chief Compliance Officer (CCO) to administer the advisory compliance policies and
procedures. Under Rule 206(4)-7, CCOs must review the nature of advisory business and identify
32 See, for example, Khorana, Servaes, and Wedge (2007), Chen, Goldstein, and Jiang (2008), and Cremers et al. (2009). 33 Our results are unchanged when we use the broader definition of control persons in advisory firm as provided by the SEC. According to this definition, control persons in this case would also include most executive officers, general partners, and trustees. 34 The use of the midpoint indirectly assumes that the defined intervals are exogenous to potential shareholders strategies to invest close to the (lower or upper) bounds in order to give an appearance of a large rather than small ownership levels. We rule out this possibility by repeating our analysis with the lower or the upper bounds of the intervals and obtain qualitatively similar findings.
31
potential material conflicts of interest. In the area of trading, the three areas that should garner the most
attention of adviser’s CCOs are: (i) cross trading opportunities and related trade aggregation issues, (ii)
selection of broker dealers and trade allocation (i.e., best execution), and (iii) soft dollars arrangements.
The CCO should also operate somewhat independently from the fund adviser, and the client fund board is
required to approve the designation, compensation and, if necessary, the removal of the adviser’s CCO.
We examine the effect of CCO dependence on the propensity of the adviser to engage in cross trades. We
construct a dummy variable D.[CCO dependence] which equals 1, if the CCO of fund adviser also holds
other positions within the advisory organization (e.g., Vice-President, Managing Director,
Treasurer/Controller, etc.), and 0 otherwise. Our expectation is that the greater the CCO dependence the
higher the cross-sectional probability of adviser’s engagement in cross trading (TCT). In addition, we
expect a negative relationship between the level of experience (in months, and divided by 100) of a CCO
(CCO tenure/100) and TCT since more experienced CCOs should be more effective in identifying
possible areas where agency conflicts might be concealed.
Enforcement Actions All fund advisers registered with the SEC must disclose information regarding
their disciplinary history and the disciplinary history of their advisory affiliates. This disclosure is then
evaluated by the Commission to establish whether to impose restrictions on the nature of the activities as
an investment adviser, or to suspend, or even revoke, the advisory registration.35 Accordingly, we use the
total number of penal and civil actions incurred by a fund adviser (or advisory affiliates) over the previous
10 years as reported in Sections A-H in Item 11 of form ADV, as an additional explanatory variable.
Table 12 reports the estimates of several specifications of a probit model where adviser’s engagement
in total, principal, or agency transactions represents a dichotomous dependent variable. The loading of
TCT on the variable Control Owners across several model specifications is generally consistent with the
strong monitoring hypothesis: the greater the level of control, the lower the probability of agency conflicts
captured by our TCT measures. As a robustness test, in specifications (ii) and (v) we repeat the analysis
35Although this variable may reflect governance outcomes rather than ex-ante governance characteristics, we believe that an analysis of the convictions (if any) against the advisory firm would still be useful in understanding the cross-sectional variation in cross trading behavior.
32
using the variable Ownership Structure and reach a similar conclusion. The significant coefficient on
Ownership Structure (-0.456) in specification (v) implies that the mean predicted probability of engaging
in cross trading activities is nearly halved, dropping to only 26% for those fund advisers with high
percentage ownership (holding all other variables at their mean values). Also, the positive and significant
coefficients on the dummy variable, D.[CCO dependence], in specifications (iii) to (vii), highlight the
importance of the oversight role of the Chief Compliance Officer. When the CCO occupies other top
positions within the investment adviser organization, the requirement of CCO independence is greatly
compromised, potentially impairing his or her judgment with respect to the policies and procedures
adopted within the advisory firm. This is even more important when advisory ownership structure is
fragmented, since in this case there is less control by large shareholders over adviser policies. By contrast,
the presence of an experienced CCO (CCO tenure) appears to be associated with a significant reduction in
the probability of agency cross trades, although we should be cautious about attributing causality to this
relationship. Indeed, if less experienced CCOs are more likely to be terminated by mutual fund boards in
the case of poor oversight, then a negative relationship between CCO tenure and the probability of
crossing trades could also be the outcome of CCO attrition whose magnitude cannot be easily assessed.
Finally, we consider the impact of the total number of enforcement actions and convictions incurred
by the management company over the previous 10-year period (N.Enforced). Our findings in
specifications (i)-(ii), and (iv)-(vii) suggest that the threat of potential suspension or cancellation of the
advisory registration or mandate is associated with a significantly lower probability of both principal and
agency transactions by fund advisers.
6. Concluding Remarks
In recent years the mutual fund industry has come under increasing scrutiny by regulators and
investors alike. Consistent with this interest, a number of recent academic studies have explored agency
issues in the context of mutual funds. However, there is as yet relatively little known about the incentives
and potential conflicts of interest at mutual fund advisers. This paper addresses a gap in the literature by
33
employing a unique dataset to examine the impact of cross trading by fund advisers on the client funds’
performance. We provide evidence of a significantly negative relation between our measures of cross
trading activities (TCT) and several performance measures for client mutual funds. This relationship is
significant in both economic as well as statistical terms and is robust to alternative research designs.
Specifically, a portfolio of funds managed by advisers in the top TCT quintile significantly underperforms
the portfolio of funds managed by advisers in the bottom TCT quintile by about 1% per year over the
period 1995 to 2007.
We further document that our cross trading measures are significantly positively related to a number
of characteristics that capture fund adviser incentives to engage in such transactions. These include the
existence of performance fees and soft dollar payment arrangements, the total assets (and number of client
accounts) under the management of fund adviser, the performance-sensitivity of investor demand, the
presence of either pension funds or hedge funds among advisers’ client accounts, and the proportion of
fund adviser employees who are registered broker-dealers.
Our next contribution is to show that advisers’ affiliated brokerage houses earn significantly higher
brokerage commissions for executing off-market agency cross transactions at the expenses of mutual fund
clients, and that the lure of research and other services subsidized through client fund assets provides
advisers with a strong motivation to engage in such transactions. Finally, we examine the monitoring role
of adviser internal governance in curtailing cross trading practices. We find that a number of governance
variables including the percentage ownership concentration in advisory firm, the degree of independence
and the tenure of adviser’s Chief Compliance Officer (CCO) as well as the total number of past
enforcement actions by the SEC against the adviser serve to minimize the risk of potential agency
conflicts.
Overall, our results indicate that cross trading practices of fund advisers are associated with a
significant performance penalty for their client mutual funds. According to the Investment Company
Institute, actively managed US equity mutual funds have about $4 trillion in assets under management as
of the end of 2013. In view of the popularity of these products, our evidence highlights the importance of

34
increased awareness on the part of both investors and regulators regarding the potential risks concealed
behind cross trading activities.
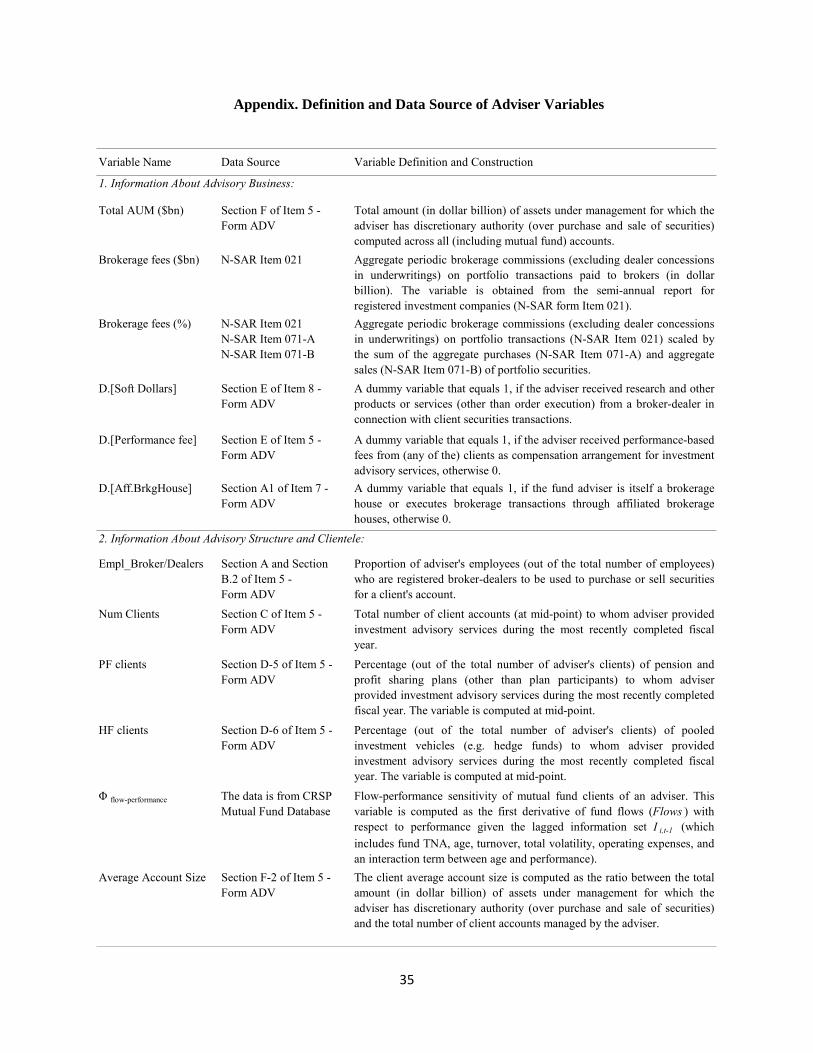
35
Appendix. Definition and Data Source of Adviser Variables
Variable Name Data Source Variable Definition and Construction
Total AUM ($bn) Section F of Item 5 - Form ADV
Total amount (in dollar billion) of assets under management for which theadviser has discretionary authority (over purchase and sale of securities)computed across all (including mutual fund) accounts.
Brokerage fees ($bn) N-SAR Item 021 Aggregate periodic brokerage commissions (excluding dealer concessionsin underwritings) on portfolio transactions paid to brokers (in dollarbillion). The variable is obtained from the semi-annual report forregistered investment companies (N-SAR form Item 021).
Brokerage fees (%) N-SAR Item 021 N-SAR Item 071-A N-SAR Item 071-B
Aggregate periodic brokerage commissions (excluding dealer concessionsin underwritings) on portfolio transactions (N-SAR Item 021) scaled bythe sum of the aggregate purchases (N-SAR Item 071-A) and aggregatesales (N-SAR Item 071-B) of portfolio securities.
D.[Soft Dollars] Section E of Item 8 - Form ADV
A dummy variable that equals 1, if the adviser received research and otherproducts or services (other than order execution) from a broker-dealer inconnection with client securities transactions.
D.[Performance fee] Section E of Item 5 - Form ADV
A dummy variable that equals 1, if the adviser received performance-basedfees from (any of the) clients as compensation arrangement for investmentadvisory services, otherwise 0.
D.[Aff.BrkgHouse] Section A1 of Item 7 - Form ADV
A dummy variable that equals 1, if the fund adviser is itself a brokeragehouse or executes brokerage transactions through affiliated brokeragehouses, otherwise 0.
2. Information About Advisory Structure and Clientele:
Empl_Broker/Dealers Section A and Section B.2 of Item 5 - Form ADV
Proportion of adviser's employees (out of the total number of employees)who are registered broker-dealers to be used to purchase or sell securitiesfor a client's account.
Num Clients Section C of Item 5 - Form ADV
Total number of client accounts (at mid-point) to whom adviser providedinvestment advisory services during the most recently completed fiscalyear.
PF clients Section D-5 of Item 5 - Form ADV
Percentage (out of the total number of adviser's clients) of pension andprofit sharing plans (other than plan participants) to whom adviserprovided investment advisory services during the most recently completedfiscal year. The variable is computed at mid-point.
HF clients Section D-6 of Item 5 - Form ADV
Percentage (out of the total number of adviser's clients) of pooledinvestment vehicles (e.g. hedge funds) to whom adviser providedinvestment advisory services during the most recently completed fiscalyear. The variable is computed at mid-point.
Φ flow-performance The data is from CRSP Mutual Fund Database
Flow-performance sensitivity of mutual fund clients of an adviser. Thisvariable is computed as the first derivative of fund flows (Flows ) withrespect to performance given the lagged information set I i,t-1 (which
includes fund TNA, age, turnover, total volatility, operating expenses, andan interaction term between age and performance).
Average Account Size Section F-2 of Item 5 - Form ADV
The client average account size is computed as the ratio between the totalamount (in dollar billion) of assets under management for which theadviser has discretionary authority (over purchase and sale of securities)and the total number of client accounts managed by the adviser.
1. Information About Advisory Business:
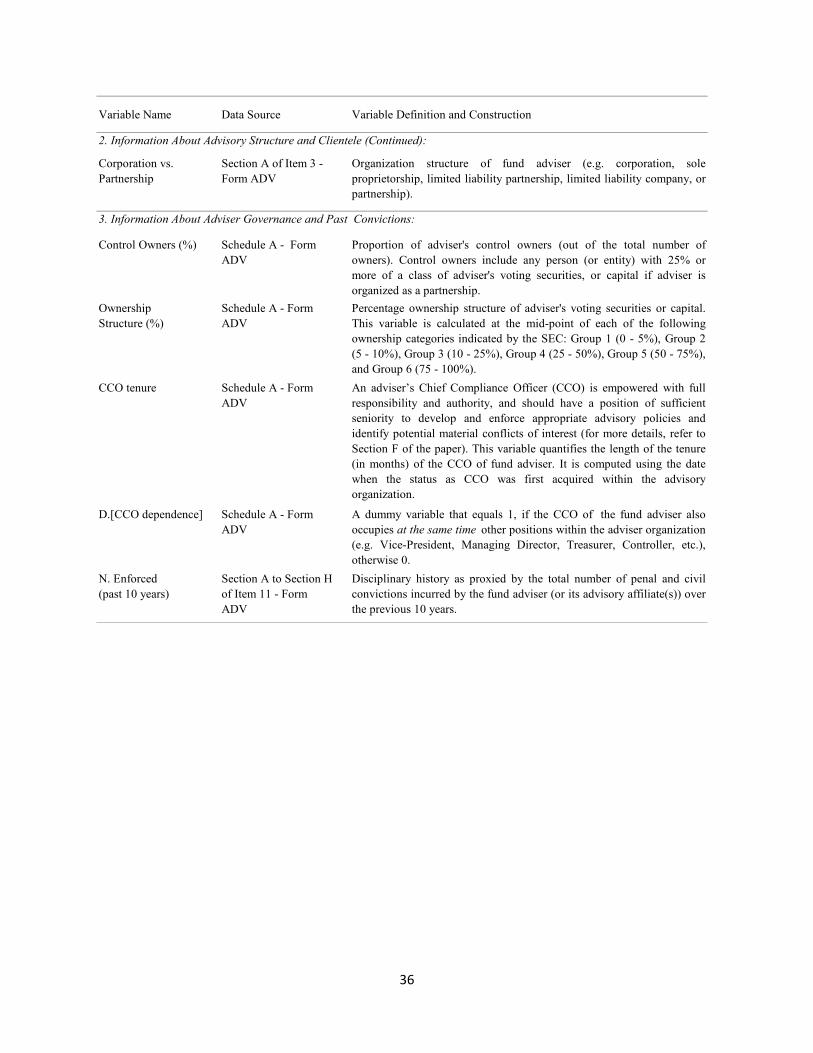
36
Variable Name Data Source Variable Definition and Construction
2. Information About Advisory Structure and Clientele (Continued):
Corporation vs. Partnership
Section A of Item 3 - Form ADV
Organization structure of fund adviser (e.g. corporation, soleproprietorship, limited liability partnership, limited liability company, orpartnership).
Control Owners (%) Schedule A - Form ADV
Proportion of adviser's control owners (out of the total number ofowners). Control owners include any person (or entity) with 25% ormore of a class of adviser's voting securities, or capital if adviser isorganized as a partnership.
Ownership Structure (%)
Schedule A - Form ADV
Percentage ownership structure of adviser's voting securities or capital.This variable is calculated at the mid-point of each of the followingownership categories indicated by the SEC: Group 1 (0 - 5%), Group 2(5 - 10%), Group 3 (10 - 25%), Group 4 (25 - 50%), Group 5 (50 - 75%),and Group 6 (75 - 100%).
CCO tenure Schedule A - Form ADV
An adviser’s Chief Compliance Officer (CCO) is empowered with fullresponsibility and authority, and should have a position of sufficientseniority to develop and enforce appropriate advisory policies andidentify potential material conflicts of interest (for more details, refer toSection F of the paper). This variable quantifies the length of the tenure(in months) of the CCO of fund adviser. It is computed using the datewhen the status as CCO was first acquired within the advisoryorganization.
D.[CCO dependence] Schedule A - Form ADV
A dummy variable that equals 1, if the CCO of the fund adviser alsooccupies at the same time other positions within the adviser organization(e.g. Vice-President, Managing Director, Treasurer, Controller, etc.),otherwise 0.
N. Enforced (past 10 years)
Section A to Section H of Item 11 - Form ADV
Disciplinary history as proxied by the total number of penal and civilconvictions incurred by the fund adviser (or its advisory affiliate(s)) overthe previous 10 years.
3. Information About Adviser Governance and Past Convictions:
37
REFERENCES
Baer, M.; A. Kempf; and S. Ruenzi, “Team management and mutual funds”. Unpublished working paper (2005). University of Cologne.
Barber, B.; T. Odean; and L. Zheng. “Out of sight, out of mind: The effects of expenses on mutual fund flows.” Journal of Business, 78 (2005), 2095-2120.
Bhattacharya, U.; J. Lee; and V. Pool. “Conflicting family values in mutual fund families.” Journal of Finance, 68 (2013), 173-200.
Berk, J.; and R. Green. “Mutual fund flows and performance in rational markets.” Journal of Political Economy, 112 (2004), 1269-1295.
Blume, M. “Soft dollars and the brokerage industry.” Financial Analysts Journal, 49, (March-April 1993), 36-44.
Carhart, M. “On persistence in mutual fund performance.” Journal of Finance, 52 (1997), 57-82.
Chen, Q.; I. Goldstein; and W. Jiang. “Directors' ownership in the U.S. mutual fund industry.” Journal of Finance, 63 (2008), 2629-2677.
Chen, J.; H. Hong; M. Huang; and J. Kubik. “Does fund size erode mutual fund performance? The role of liquidity and organization,” American Economic Review, 94 (2004), 1276-1302.
Chen, J.; H. Hong; and J. Kubik. “Outsourcing mutual fund management: Firm boundaries, incentives and performance.” Journal of Finance. Forthcoming (2013).
Chevalier, J.; and G. Ellison. “Risk taking by mutual funds as a response to incentives.” Journal of Political Economy, 105 (1997), 1167-1200.
Christoffersen, S.; and D. Musto. “Demand curves and the pricing of money management.” Review of Financial Studies, 15 (2002), 1499-1524.
Cici, G.; S. Gibson; and R. Moussawi. “Mutual fund performance when parent firms simultaneously manage hedge funds.” Journal of Financial Intermediation, 19 (2010), 169-187.
Cremers, M.; J. Driessen; P. Maenhout; and D. Weinbaum. “Does skin in the game matter? Director incentives and governance in the mutual fund industry.” Journal of Financial and Quantitative Analysis, 44 (2009), 1345-1373.
Del Guercio, D.; and P. Tkac. “The determinants of the flow of funds of managed portfolios: Mutual funds vs. pension funds.” Journal of Financial and Quantitative Analysis, 37 (2002), 523-557.
Deli, D. “Mutual fund advisory contracts: An empirical investigation.” Journal of Finance, 57 (2002), 109-133.
Edelen, R.; R. Evans; and G. Kadlec. “Scale effects in mutual fund performance: The role of trading costs.” Unpublished working paper. Boston College (2007).
Edelen, R.; R. Evans; and G. Kadlec. “What soft-dollars buy? Performance, expense shifting, agency costs.” Unpublished working paper. University of Virginia (2008).
38
Fama, E.; and K. French. “Common risk factors in the returns on stocks and bonds.” Journal of Financial Economics, 33 (1993), 3-56.
Fama, E.; and J. MacBeth. “Risk, return and equilibrium: Empirical tests.” Journal of Political Economy, 81 (1973), 607-636.
Ferson, W.; and R. Schadt. “Measuring fund strategy and performance in changing economic conditions.” Journal of Finance, 61 (1996), 73-104.
Gaspar, J.; M. Massa; and P. Matos. “Favoritism in mutual fund families? Evidence on strategic cross-fund subsidization.” Journal of Finance, 61 (2006), 73-104.
Goetzmann, W.; and N. Peles. “Cognitive dissonance and mutual fund investors.” Journal of Financial Research, 20 (1997), 145-158.
Gruber, M. “Another puzzle: The growth in actively managed mutual funds.” Journal of Finance, 52 (1996), 783-810.
Huang, J.; K. Wei; and H. Yan. “Participation costs and the sensitivity of fund flows to past performance.” Journal of Finance, 62 (2007), 1273-1311.
Ippolito, R. “Consumer reaction to measures of poor quality: Evidence from the mutual fund industry.” Journal of Law and Economics, 35 (1992), 45-70.
Khorana, A.; H. Servaes; and L. Wedge. “Portfolio manager ownership and fund performance.” Journal of Financial Economics, 85 (2007), 179-204.
Lakonishok, J.; A. Shleifer; and R. Vishny. “The structure and performance of the money management industry.” Brookings Papers on Economic Activity: Microeconomics (1992), 339-391.
Lynch, A.; and D. Musto. “How investors interpret past returns.” Journal of Finance, 58 (2003), 2033-2058.
Massa, M. “How do family strategies affect fund performance? When performance-maximization is not the only game in town.” Journal of Financial Economics, 67 (2003), 249-304.
Nanda, V.; J. Wang; and L. Zheng. “Family values and the star phenomenon: Strategies of mutual fund families.” Review of Financial Studies, 17 (2004), 667-698.
Newey, W.; and K. West. “A simple, positive semi-definite, heteroscedasticity and autocorrelation consistent covariance matrix.” Econometrica, 55 (1987), 703-708.
Nohel, T.; J. Wang; and L. Zheng. “Side-by-side management of hedge funds and mutual funds.” Review of Financial Studies, 23 (2010), 2342-2373.
Siggelkow, N. “Why focus? A study of intra-industry focus effects.” Journal of Industrial Organization, 51 (2003), 121-150.
Sirri, E.; and P. Tufano. “Costly search and mutual fund flows.” Journal of Finance, 53 (1998), 1589-1622.
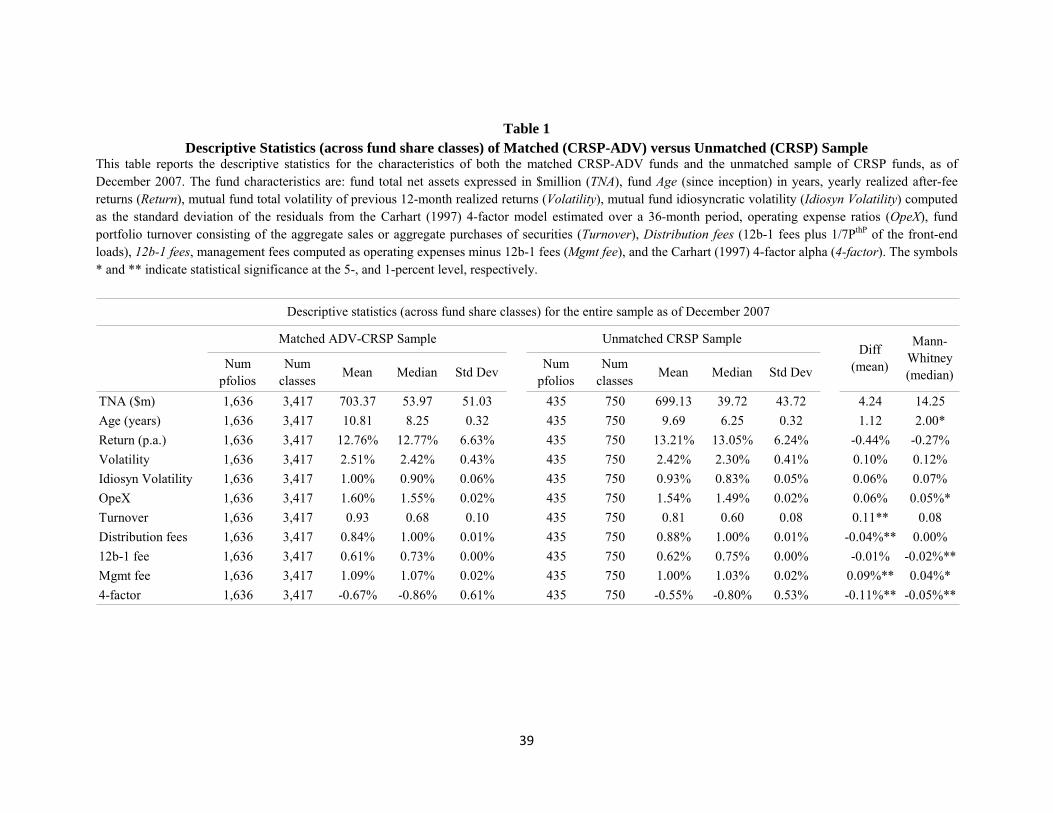
39
Table 1 Descriptive Statistics (across fund share classes) of Matched (CRSP-ADV) versus Unmatched (CRSP) Sample
This table reports the descriptive statistics for the characteristics of both the matched CRSP-ADV funds and the unmatched sample of CRSP funds, as of December 2007. The fund characteristics are: fund total net assets expressed in $million (TNA), fund Age (since inception) in years, yearly realized after-fee returns (Return), mutual fund total volatility of previous 12-month realized returns (Volatility), mutual fund idiosyncratic volatility (Idiosyn Volatility) computed as the standard deviation of the residuals from the Carhart (1997) 4-factor model estimated over a 36-month period, operating expense ratios (OpeX), fund portfolio turnover consisting of the aggregate sales or aggregate purchases of securities (Turnover), Distribution fees (12b-1 fees plus 1/7PthP of the front-end loads), 12b-1 fees, management fees computed as operating expenses minus 12b-1 fees (Mgmt fee), and the Carhart (1997) 4-factor alpha (4-factor). The symbols * and ** indicate statistical significance at the 5-, and 1-percent level, respectively.
Num pfolios
Num classes
Mean Median Std DevNum
pfoliosNum
classesMean Median Std Dev
TNA ($m) 1,636 3,417 703.37 53.97 51.03 435 750 699.13 39.72 43.72 4.24 14.25
Age (years) 1,636 3,417 10.81 8.25 0.32 435 750 9.69 6.25 0.32 1.12 2.00*
Return (p.a.) 1,636 3,417 12.76% 12.77% 6.63% 435 750 13.21% 13.05% 6.24% -0.44% -0.27%
Volatility 1,636 3,417 2.51% 2.42% 0.43% 435 750 2.42% 2.30% 0.41% 0.10% 0.12%
Idiosyn Volatility 1,636 3,417 1.00% 0.90% 0.06% 435 750 0.93% 0.83% 0.05% 0.06% 0.07%
OpeX 1,636 3,417 1.60% 1.55% 0.02% 435 750 1.54% 1.49% 0.02% 0.06% 0.05%*
Turnover 1,636 3,417 0.93 0.68 0.10 435 750 0.81 0.60 0.08 0.11** 0.08
Distribution fees 1,636 3,417 0.84% 1.00% 0.01% 435 750 0.88% 1.00% 0.01% -0.04%** 0.00%
12b-1 fee 1,636 3,417 0.61% 0.73% 0.00% 435 750 0.62% 0.75% 0.00% -0.01% -0.02%**
Mgmt fee 1,636 3,417 1.09% 1.07% 0.02% 435 750 1.00% 1.03% 0.02% 0.09%** 0.04%*
4-factor 1,636 3,417 -0.67% -0.86% 0.61% 435 750 -0.55% -0.80% 0.53% -0.11%** -0.05%**
Descriptive statistics (across fund share classes) for the entire sample as of December 2007
Matched ADV-CRSP Sample Unmatched CRSP Sample Diff
(mean)
Mann-Whitney (median)
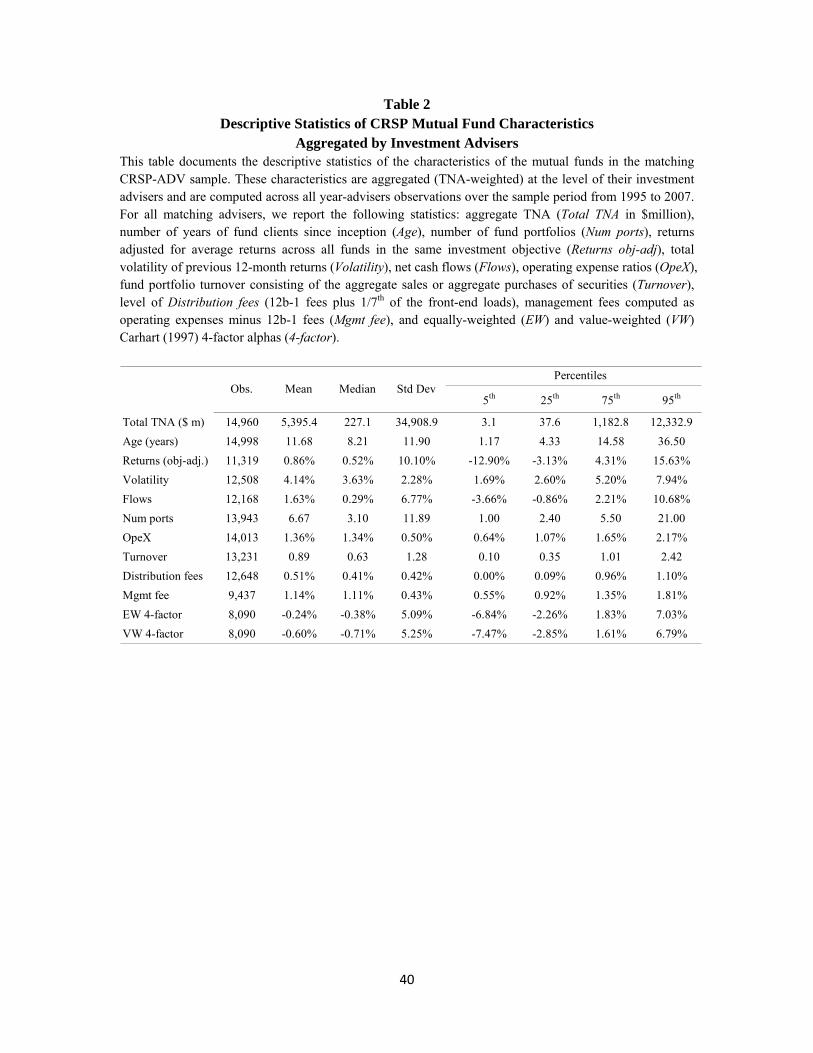
40
Table 2 Descriptive Statistics of CRSP Mutual Fund Characteristics
Aggregated by Investment Advisers This table documents the descriptive statistics of the characteristics of the mutual funds in the matching CRSP-ADV sample. These characteristics are aggregated (TNA-weighted) at the level of their investment advisers and are computed across all year-advisers observations over the sample period from 1995 to 2007. For all matching advisers, we report the following statistics: aggregate TNA (Total TNA in $million), number of years of fund clients since inception (Age), number of fund portfolios (Num ports), returns adjusted for average returns across all funds in the same investment objective (Returns obj-adj), total volatility of previous 12-month returns (Volatility), net cash flows (Flows), operating expense ratios (OpeX), fund portfolio turnover consisting of the aggregate sales or aggregate purchases of securities (Turnover), level of Distribution fees (12b-1 fees plus 1/7th of the front-end loads), management fees computed as operating expenses minus 12b-1 fees (Mgmt fee), and equally-weighted (EW) and value-weighted (VW) Carhart (1997) 4-factor alphas (4-factor).
5th 25th 75th 95th
Total TNA ($ m) 14,960 5,395.4 227.1 34,908.9 3.1 37.6 1,182.8 12,332.9
Age (years) 14,998 11.68 8.21 11.90 1.17 4.33 14.58 36.50
Returns (obj-adj.) 11,319 0.86% 0.52% 10.10% -12.90% -3.13% 4.31% 15.63%
Volatility 12,508 4.14% 3.63% 2.28% 1.69% 2.60% 5.20% 7.94%
Flows 12,168 1.63% 0.29% 6.77% -3.66% -0.86% 2.21% 10.68%
Num ports 13,943 6.67 3.10 11.89 1.00 2.40 5.50 21.00
OpeX 14,013 1.36% 1.34% 0.50% 0.64% 1.07% 1.65% 2.17%
Turnover 13,231 0.89 0.63 1.28 0.10 0.35 1.01 2.42
Distribution fees 12,648 0.51% 0.41% 0.42% 0.00% 0.09% 0.96% 1.10%
Mgmt fee 9,437 1.14% 1.11% 0.43% 0.55% 0.92% 1.35% 1.81%
EW 4-factor 8,090 -0.24% -0.38% 5.09% -6.84% -2.26% 1.83% 7.03%
VW 4-factor 8,090 -0.60% -0.71% 5.25% -7.47% -2.85% 1.61% 6.79%
Obs. Mean Median Std DevPercentiles
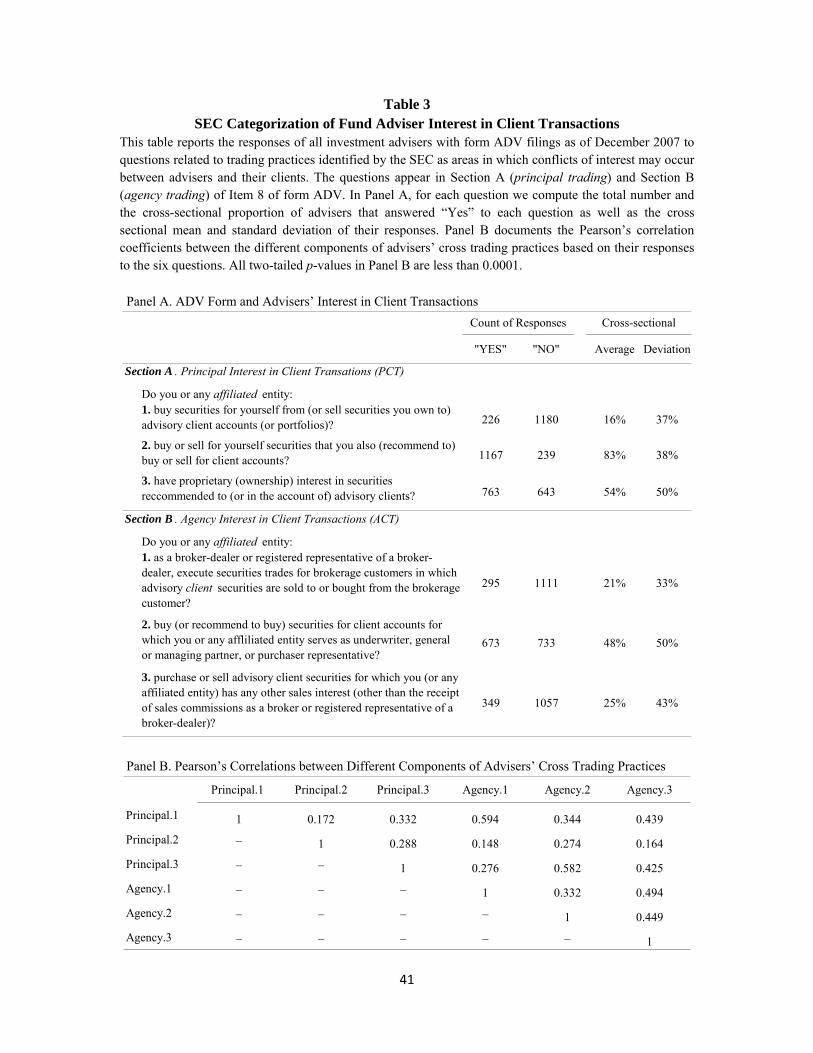
41
Table 3 SEC Categorization of Fund Adviser Interest in Client Transactions
This table reports the responses of all investment advisers with form ADV filings as of December 2007 to questions related to trading practices identified by the SEC as areas in which conflicts of interest may occur between advisers and their clients. The questions appear in Section A (principal trading) and Section B (agency trading) of Item 8 of form ADV. In Panel A, for each question we compute the total number and the cross-sectional proportion of advisers that answered “Yes” to each question as well as the cross sectional mean and standard deviation of their responses. Panel B documents the Pearson’s correlation coefficients between the different components of advisers’ cross trading practices based on their responses to the six questions. All two-tailed p-values in Panel B are less than 0.0001.
Panel A. ADV Form and Advisers’ Interest in Client Transactions
"YES" "NO" Average Deviation
Do you or any affiliated entity:1. buy securities for yourself from (or sell securities you own to) advisory client accounts (or portfolios)? 226 1180 16% 37%
2. buy or sell for yourself securities that you also (recommend to) buy or sell for client accounts? 1167 239 83% 38%
3. have proprietary (ownership) interest in securities reccommended to (or in the account of) advisory clients? 763 643 54% 50%
Do you or any affiliated entity:1. as a broker-dealer or registered representative of a broker-dealer, execute securities trades for brokerage customers in which advisory client securities are sold to or bought from the brokerage customer?
295 1111 21% 33%
2. buy (or recommend to buy) securities for client accounts for which you or any affliliated entity serves as underwriter, general or managing partner, or purchaser representative?
673 733 48% 50%
3. purchase or sell advisory client securities for which you (or any affiliated entity) has any other sales interest (other than the receipt of sales commissions as a broker or registered representative of a broker-dealer)?
349 1057 25% 43%
Section B . Agency Interest in Client Transactions (ACT)
Cross-sectional
Section A . Principal Interest in Client Transations (PCT)
Count of Responses
Panel B. Pearson’s Correlations between Different Components of Advisers’ Cross Trading Practices
Principal.1 Principal.2 Principal.3 Agency.1 Agency.2 Agency.3
Principal.1 1 0.172 0.332 0.594 0.344 0.439
Principal.2 _1 0.288 0.148 0.274 0.164
Principal.3 _ _1 0.276 0.582 0.425
Agency.1 _ _ _1 0.332 0.494
Agency.2 _ _ _ _1 0.449
Agency.3 _ _ _ _ _1
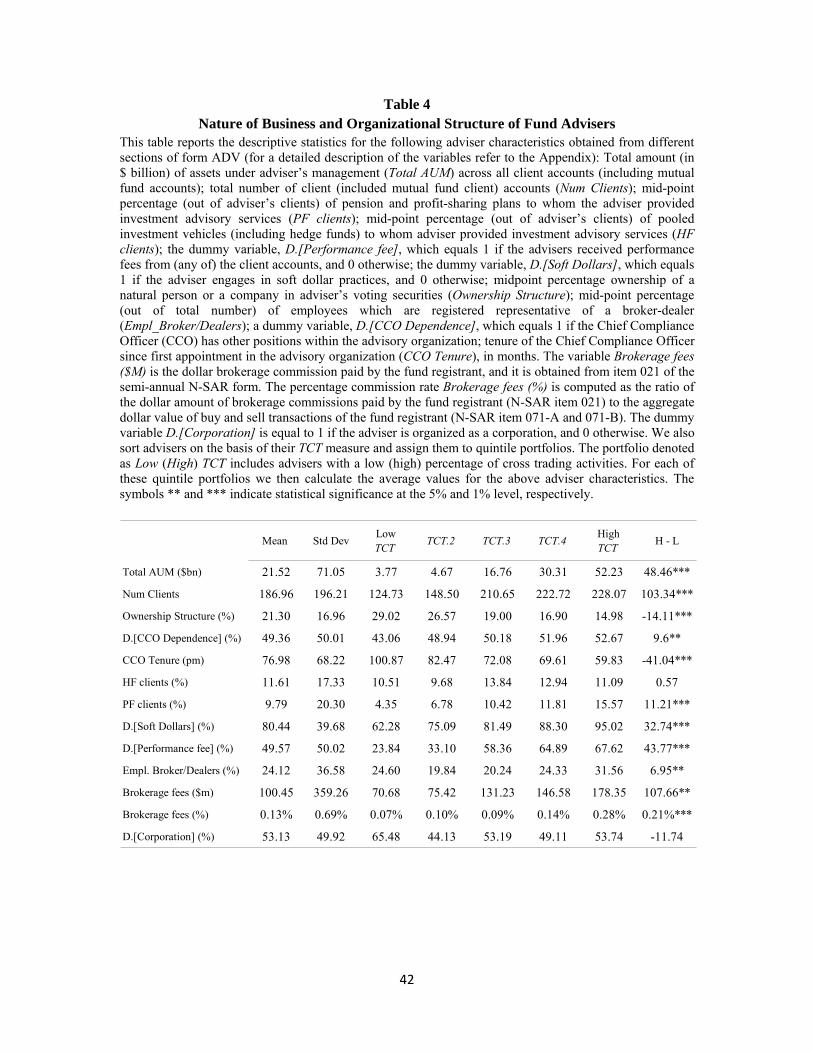
42
Table 4 Nature of Business and Organizational Structure of Fund Advisers
This table reports the descriptive statistics for the following adviser characteristics obtained from different sections of form ADV (for a detailed description of the variables refer to the Appendix): Total amount (in $ billion) of assets under adviser’s management (Total AUM) across all client accounts (including mutual fund accounts); total number of client (included mutual fund client) accounts (Num Clients); mid-point percentage (out of adviser’s clients) of pension and profit-sharing plans to whom the adviser provided investment advisory services (PF clients); mid-point percentage (out of adviser’s clients) of pooled investment vehicles (including hedge funds) to whom adviser provided investment advisory services (HF clients); the dummy variable, D.[Performance fee], which equals 1 if the advisers received performance fees from (any of) the client accounts, and 0 otherwise; the dummy variable, D.[Soft Dollars], which equals 1 if the adviser engages in soft dollar practices, and 0 otherwise; midpoint percentage ownership of a natural person or a company in adviser’s voting securities (Ownership Structure); mid-point percentage (out of total number) of employees which are registered representative of a broker-dealer (Empl_Broker/Dealers); a dummy variable, D.[CCO Dependence], which equals 1 if the Chief Compliance Officer (CCO) has other positions within the advisory organization; tenure of the Chief Compliance Officer since first appointment in the advisory organization (CCO Tenure), in months. The variable Brokerage fees ($M) is the dollar brokerage commission paid by the fund registrant, and it is obtained from item 021 of the semi-annual N-SAR form. The percentage commission rate Brokerage fees (%) is computed as the ratio of the dollar amount of brokerage commissions paid by the fund registrant (N-SAR item 021) to the aggregate dollar value of buy and sell transactions of the fund registrant (N-SAR item 071-A and 071-B). The dummy variable D.[Corporation] is equal to 1 if the adviser is organized as a corporation, and 0 otherwise. We also sort advisers on the basis of their TCT measure and assign them to quintile portfolios. The portfolio denoted as Low (High) TCT includes advisers with a low (high) percentage of cross trading activities. For each of these quintile portfolios we then calculate the average values for the above adviser characteristics. The symbols ** and *** indicate statistical significance at the 5% and 1% level, respectively.
Mean Std DevLow TCT
TCT.2 TCT.3 TCT.4High TCT
H - L
Total AUM ($bn) 21.52 71.05 3.77 4.67 16.76 30.31 52.23 48.46***
Num Clients 186.96 196.21 124.73 148.50 210.65 222.72 228.07 103.34***
Ownership Structure (%) 21.30 16.96 29.02 26.57 19.00 16.90 14.98 -14.11***
D.[CCO Dependence] (%) 49.36 50.01 43.06 48.94 50.18 51.96 52.67 9.6**
CCO Tenure (pm) 76.98 68.22 100.87 82.47 72.08 69.61 59.83 -41.04***
HF clients (%) 11.61 17.33 10.51 9.68 13.84 12.94 11.09 0.57
PF clients (%) 9.79 20.30 4.35 6.78 10.42 11.81 15.57 11.21***
D.[Soft Dollars] (%) 80.44 39.68 62.28 75.09 81.49 88.30 95.02 32.74***
D.[Performance fee] (%) 49.57 50.02 23.84 33.10 58.36 64.89 67.62 43.77***
Empl. Broker/Dealers (%) 24.12 36.58 24.60 19.84 20.24 24.33 31.56 6.95**
Brokerage fees ($m) 100.45 359.26 70.68 75.42 131.23 146.58 178.35 107.66**
Brokerage fees (%) 0.13% 0.69% 0.07% 0.10% 0.09% 0.14% 0.28% 0.21%***
D.[Corporation] (%) 53.13 49.92 65.48 44.13 53.19 49.11 53.74 -11.74
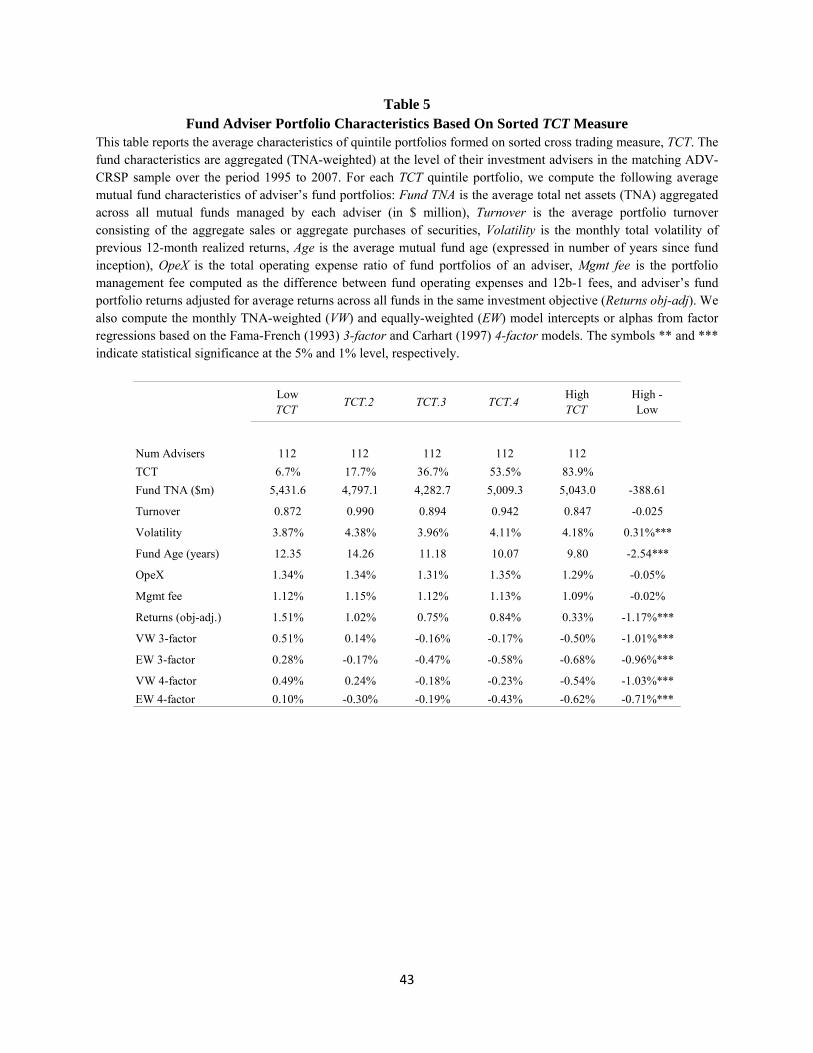
43
Table 5 Fund Adviser Portfolio Characteristics Based On Sorted TCT Measure
This table reports the average characteristics of quintile portfolios formed on sorted cross trading measure, TCT. The fund characteristics are aggregated (TNA-weighted) at the level of their investment advisers in the matching ADV-CRSP sample over the period 1995 to 2007. For each TCT quintile portfolio, we compute the following average mutual fund characteristics of adviser’s fund portfolios: Fund TNA is the average total net assets (TNA) aggregated across all mutual funds managed by each adviser (in $ million), Turnover is the average portfolio turnover consisting of the aggregate sales or aggregate purchases of securities, Volatility is the monthly total volatility of previous 12-month realized returns, Age is the average mutual fund age (expressed in number of years since fund inception), OpeX is the total operating expense ratio of fund portfolios of an adviser, Mgmt fee is the portfolio management fee computed as the difference between fund operating expenses and 12b-1 fees, and adviser’s fund portfolio returns adjusted for average returns across all funds in the same investment objective (Returns obj-adj). We also compute the monthly TNA-weighted (VW) and equally-weighted (EW) model intercepts or alphas from factor regressions based on the Fama-French (1993) 3-factor and Carhart (1997) 4-factor models. The symbols ** and *** indicate statistical significance at the 5% and 1% level, respectively.
Low TCT
TCT.2 TCT.3 TCT.4High TCT
High - Low
Num Advisers 112 112 112 112 112
TCT 6.7% 17.7% 36.7% 53.5% 83.9%
Fund TNA ($m) 5,431.6 4,797.1 4,282.7 5,009.3 5,043.0 -388.61
Turnover 0.872 0.990 0.894 0.942 0.847 -0.025
Volatility 3.87% 4.38% 3.96% 4.11% 4.18% 0.31%***
Fund Age (years) 12.35 14.26 11.18 10.07 9.80 -2.54***
OpeX 1.34% 1.34% 1.31% 1.35% 1.29% -0.05%
Mgmt fee 1.12% 1.15% 1.12% 1.13% 1.09% -0.02%
Returns (obj-adj.) 1.51% 1.02% 0.75% 0.84% 0.33% -1.17%***
VW 3-factor 0.51% 0.14% -0.16% -0.17% -0.50% -1.01%***
EW 3-factor 0.28% -0.17% -0.47% -0.58% -0.68% -0.96%***
VW 4-factor 0.49% 0.24% -0.18% -0.23% -0.54% -1.03%***
EW 4-factor 0.10% -0.30% -0.19% -0.43% -0.62% -0.71%***
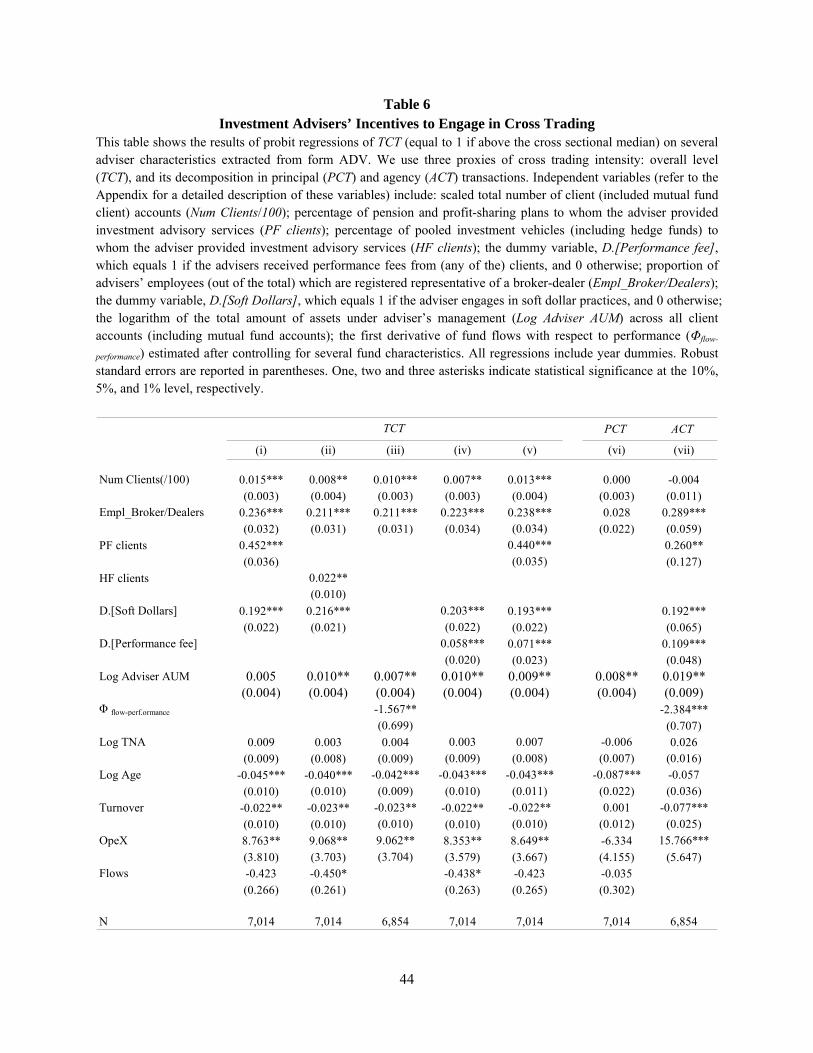
44
Table 6 Investment Advisers’ Incentives to Engage in Cross Trading
This table shows the results of probit regressions of TCT (equal to 1 if above the cross sectional median) on several adviser characteristics extracted from form ADV. We use three proxies of cross trading intensity: overall level (TCT), and its decomposition in principal (PCT) and agency (ACT) transactions. Independent variables (refer to the Appendix for a detailed description of these variables) include: scaled total number of client (included mutual fund client) accounts (Num Clients/100); percentage of pension and profit-sharing plans to whom the adviser provided investment advisory services (PF clients); percentage of pooled investment vehicles (including hedge funds) to whom the adviser provided investment advisory services (HF clients); the dummy variable, D.[Performance fee], which equals 1 if the advisers received performance fees from (any of the) clients, and 0 otherwise; proportion of advisers’ employees (out of the total) which are registered representative of a broker-dealer (Empl_Broker/Dealers); the dummy variable, D.[Soft Dollars], which equals 1 if the adviser engages in soft dollar practices, and 0 otherwise; the logarithm of the total amount of assets under adviser’s management (Log Adviser AUM) across all client accounts (including mutual fund accounts); the first derivative of fund flows with respect to performance (Φflow-
performance) estimated after controlling for several fund characteristics. All regressions include year dummies. Robust standard errors are reported in parentheses. One, two and three asterisks indicate statistical significance at the 10%, 5%, and 1% level, respectively.
PCT ACT
(i) (ii) (iii) (iv) (v) (vi) (vii)
Num Clients(/100) 0.015*** 0.008** 0.010*** 0.007** 0.013*** 0.000 -0.004(0.003) (0.004) (0.003) (0.003) (0.004) (0.003) (0.011)
Empl_Broker/Dealers 0.236*** 0.211*** 0.211*** 0.223*** 0.238*** 0.028 0.289***(0.032) (0.031) (0.031) (0.034) (0.034) (0.022) (0.059)
PF clients 0.452*** 0.440*** 0.260**(0.036) (0.035) (0.127)
HF clients 0.022**(0.010)
D.[Soft Dollars] 0.192*** 0.216*** 0.203*** 0.193*** 0.192***(0.022) (0.021) (0.022) (0.022) (0.065)
D.[Performance fee] 0.058*** 0.071*** 0.109***(0.020) (0.023) (0.048)
Log Adviser AUM 0.005 0.010** 0.007** 0.010** 0.009** 0.008** 0.019**(0.004) (0.004) (0.004) (0.004) (0.004) (0.004) (0.009)
Φ flow-perf.ormance -1.567** -2.384***(0.699) (0.707)
Log TNA 0.009 0.003 0.004 0.003 0.007 -0.006 0.026(0.009) (0.008) (0.009) (0.009) (0.008) (0.007) (0.016)
Log Age -0.045*** -0.040*** -0.042*** -0.043*** -0.043*** -0.087*** -0.057
(0.010) (0.010) (0.009) (0.010) (0.011) (0.022) (0.036)Turnover -0.022** -0.023** -0.023** -0.022** -0.022** 0.001 -0.077***
(0.010) (0.010) (0.010) (0.010) (0.010) (0.012) (0.025)OpeX 8.763** 9.068** 9.062** 8.353** 8.649** -6.334 15.766***
(3.810) (3.703) (3.704) (3.579) (3.667) (4.155) (5.647)Flows -0.423 -0.450* -0.438* -0.423 -0.035
(0.266) (0.261) (0.263) (0.265) (0.302)
N 7,014 7,014 6,854 7,014 7,014 7,014 6,854
TCT
45
Table 7 Cross Trading and Performance of Mutual Fund Advisers: Multivariate Analysis
This table reports the results of estimating several regression models relating advisers’ annual performance to proxies for cross trading intensity during the period 1995 to 2007. The advisers’ performance is calculated as the value-weighted average of the performance measures for their client funds. In Panel A, we use different measures of advisers’ value-weighted yearly performance as dependent variable: the unconditional Fama and French (1993) 3-factor alpha and the unconditional Carhart (1997) 4-factor alpha. We also use as dependent variable the Ferson and Schadt (1996) 4-factor alphas (Conditional 4-factor). Our proxies for the adviser’s cross trading intensity include: the overall level of cross trading (TCT), and its decomposition at the principal (PCT) and agency (ACT) levels. We control for the following fund adviser characteristics: standardized product differentiation (Differentiation (Γc)) computed as the standard deviation of mutual fund charges (fees plus loads) to investors in the c-th investment category (Massa, 2003); and the logarithm of total assets under adviser’s management (Log Adviser AUM) across all client accounts (including mutual fund accounts). We also control for the average client fund managers’ tenure (in years) in funds under the control of an adviser (Manager Tenure), and the average size of the management team (Team Size) managing funds of an adviser. Other lagged fund control variables (aggregated at the adviser level) include: the logarithm of fund TNA (Log TNA); the logarithm of the number of years since fund inception (Log Age); operating expenses (OpeX); portfolio Turnover consisting of the aggregate sales or aggregate purchases of securities; and the volatility of monthly returns (Volatility). In column (v) the dependent variable is the equally-weighted unconditional Carhart (1997) 4-factor model intercept. Coefficients in column (iii) are estimated by pooled OLS. In all other columns, we report Fama-Macbeth (1973) estimates with robust standard errors (in parentheses). In Panel B, we repeat the analysis of Panel A by focusing on the most problematic cross-trading transactions. In particular, we construct the dummy variable Section A.1 which equals 1 if the fund indicates to the SEC that it engages in proprietary trading (Section A.1 of Item 8 of form ADV), and 0 otherwise, and the dummy variable Section B.1 which equals 1 if the fund indicates to the SEC that it engages in agency cross trading (Section B.1 of Item 8 of form ADV), and 0 otherwise. In Panel C, we analyze the performance consequences of the initial cross-trading activities based on the ADV filings extracted in 2007 over the subsequent period (2008 – 2011) following the identification of fund adviser cross trading activities. In Panel B and Panel C we report Fama-Macbeth (1973) estimates with Newey-West autocorrelation and heteroskedasticity robust standard errors (in parentheses). The symbols *, ** and *** indicate statistical significance at the 10%, 5% and 1% level, respectively.
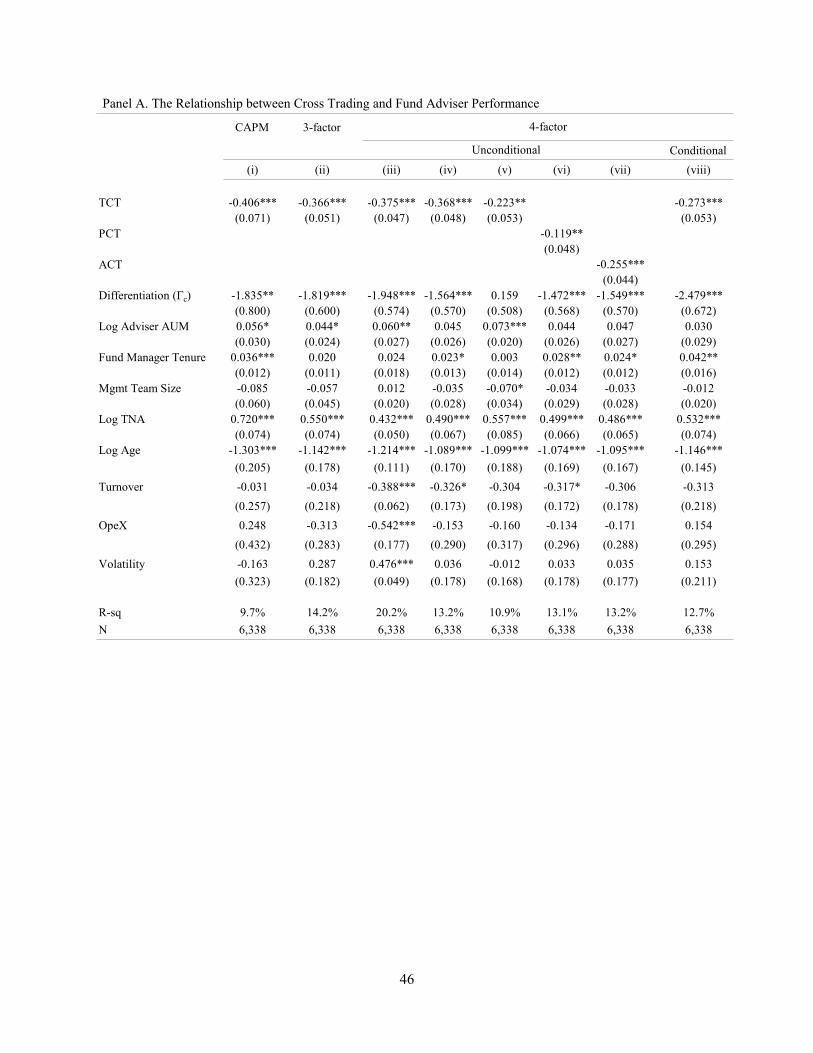
46
Panel A. The Relationship between Cross Trading and Fund Adviser Performance
CAPM 3-factor
Conditional
(i) (ii) (iii) (iv) (v) (vi) (vii) (viii)
TCT -0.406*** -0.366*** -0.375*** -0.368*** -0.223** -0.273***(0.071) (0.051) (0.047) (0.048) (0.053) (0.053)
PCT -0.119**(0.048)
ACT -0.255***(0.044)
Differentiation (Γc) -1.835** -1.819*** -1.948*** -1.564*** 0.159 -1.472*** -1.549*** -2.479***(0.800) (0.600) (0.574) (0.570) (0.508) (0.568) (0.570) (0.672)
Log Adviser AUM 0.056* 0.044* 0.060** 0.045 0.073*** 0.044 0.047 0.030(0.030) (0.024) (0.027) (0.026) (0.020) (0.026) (0.027) (0.029)
Fund Manager Tenure 0.036*** 0.020 0.024 0.023* 0.003 0.028** 0.024* 0.042**(0.012) (0.011) (0.018) (0.013) (0.014) (0.012) (0.012) (0.016)
Mgmt Team Size -0.085 -0.057 0.012 -0.035 -0.070* -0.034 -0.033 -0.012(0.060) (0.045) (0.020) (0.028) (0.034) (0.029) (0.028) (0.020)
Log TNA 0.720*** 0.550*** 0.432*** 0.490*** 0.557*** 0.499*** 0.486*** 0.532***(0.074) (0.074) (0.050) (0.067) (0.085) (0.066) (0.065) (0.074)
Log Age -1.303*** -1.142*** -1.214*** -1.089*** -1.099*** -1.074*** -1.095*** -1.146***
(0.205) (0.178) (0.111) (0.170) (0.188) (0.169) (0.167) (0.145)
Turnover -0.031 -0.034 -0.388*** -0.326* -0.304 -0.317* -0.306 -0.313
(0.257) (0.218) (0.062) (0.173) (0.198) (0.172) (0.178) (0.218)
OpeX 0.248 -0.313 -0.542*** -0.153 -0.160 -0.134 -0.171 0.154
(0.432) (0.283) (0.177) (0.290) (0.317) (0.296) (0.288) (0.295)
Volatility -0.163 0.287 0.476*** 0.036 -0.012 0.033 0.035 0.153
(0.323) (0.182) (0.049) (0.178) (0.168) (0.178) (0.177) (0.211)
R-sq 9.7% 14.2% 20.2% 13.2% 10.9% 13.1% 13.2% 12.7%
N 6,338 6,338 6,338 6,338 6,338 6,338 6,338 6,338
Unconditional
4-factor
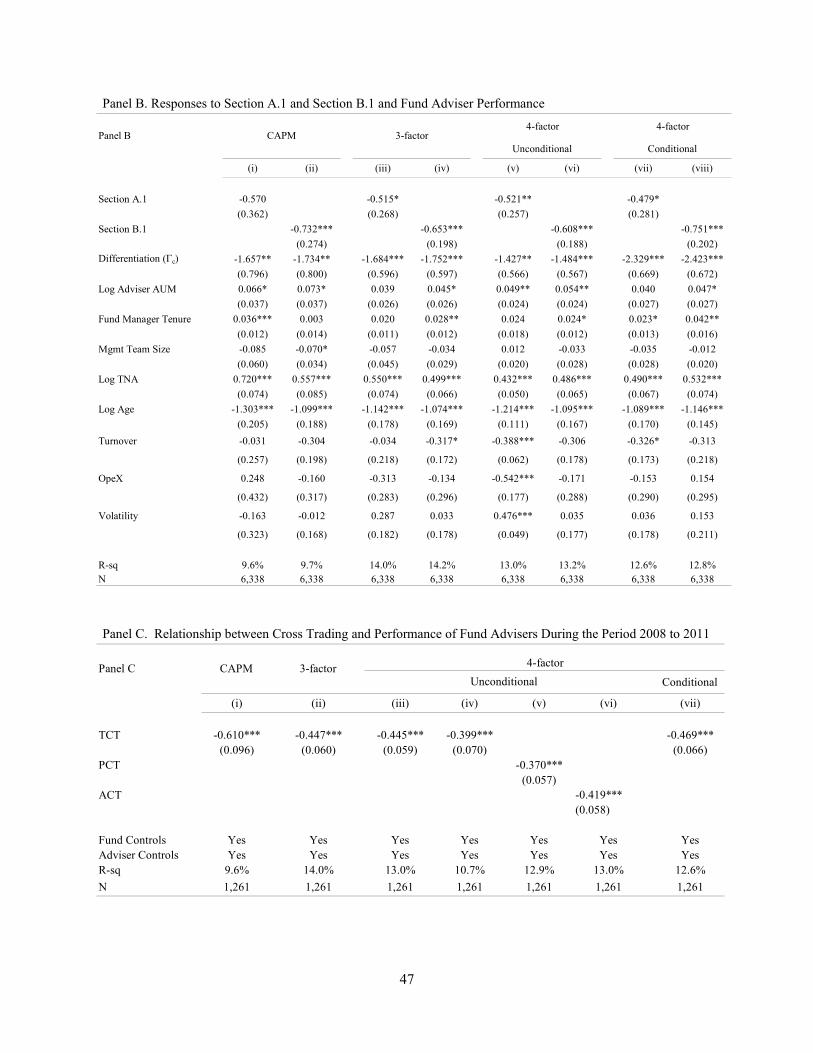
47
Panel B. Responses to Section A.1 and Section B.1 and Fund Adviser Performance
(i) (ii) (iii) (iv) (v) (vi) (vii) (viii)
Section A.1 -0.570 -0.515* -0.521** -0.479*
(0.362) (0.268) (0.257) (0.281)
Section B.1 -0.732*** -0.653*** -0.608*** -0.751***
(0.274) (0.198) (0.188) (0.202)
Differentiation (Γc) -1.657** -1.734** -1.684*** -1.752*** -1.427** -1.484*** -2.329*** -2.423***
(0.796) (0.800) (0.596) (0.597) (0.566) (0.567) (0.669) (0.672)
Log Adviser AUM 0.066* 0.073* 0.039 0.045* 0.049** 0.054** 0.040 0.047*
(0.037) (0.037) (0.026) (0.026) (0.024) (0.024) (0.027) (0.027)
Fund Manager Tenure 0.036*** 0.003 0.020 0.028** 0.024 0.024* 0.023* 0.042**
(0.012) (0.014) (0.011) (0.012) (0.018) (0.012) (0.013) (0.016)
Mgmt Team Size -0.085 -0.070* -0.057 -0.034 0.012 -0.033 -0.035 -0.012
(0.060) (0.034) (0.045) (0.029) (0.020) (0.028) (0.028) (0.020)
Log TNA 0.720*** 0.557*** 0.550*** 0.499*** 0.432*** 0.486*** 0.490*** 0.532***
(0.074) (0.085) (0.074) (0.066) (0.050) (0.065) (0.067) (0.074)
Log Age -1.303*** -1.099*** -1.142*** -1.074*** -1.214*** -1.095*** -1.089*** -1.146***
(0.205) (0.188) (0.178) (0.169) (0.111) (0.167) (0.170) (0.145)
Turnover -0.031 -0.304 -0.034 -0.317* -0.388*** -0.306 -0.326* -0.313
(0.257) (0.198) (0.218) (0.172) (0.062) (0.178) (0.173) (0.218)
OpeX 0.248 -0.160 -0.313 -0.134 -0.542*** -0.171 -0.153 0.154
(0.432) (0.317) (0.283) (0.296) (0.177) (0.288) (0.290) (0.295)
Volatility -0.163 -0.012 0.287 0.033 0.476*** 0.035 0.036 0.153
(0.323) (0.168) (0.182) (0.178) (0.049) (0.177) (0.178) (0.211)
R-sq 9.6% 9.7% 14.0% 14.2% 13.0% 13.2% 12.6% 12.8%N 6,338 6,338 6,338 6,338 6,338 6,338 6,338 6,338
Unconditional
4-factor
ConditionalPanel B CAPM 3-factor
4-factor
Panel C. Relationship between Cross Trading and Performance of Fund Advisers During the Period 2008 to 2011
Conditional
(i) (ii) (iii) (iv) (v) (vi) (vii)
TCT -0.610*** -0.447*** -0.445*** -0.399*** -0.469***(0.096) (0.060) (0.059) (0.070) (0.066)
PCT -0.370***(0.057)
ACT -0.419***(0.058)
Fund Controls Yes Yes Yes Yes Yes Yes YesAdviser Controls Yes Yes Yes Yes Yes Yes YesR-sq 9.6% 14.0% 13.0% 10.7% 12.9% 13.0% 12.6%
N 1,261 1,261 1,261 1,261 1,261 1,261 1,261
3-factor CAPMUnconditional
4-factorPanel C
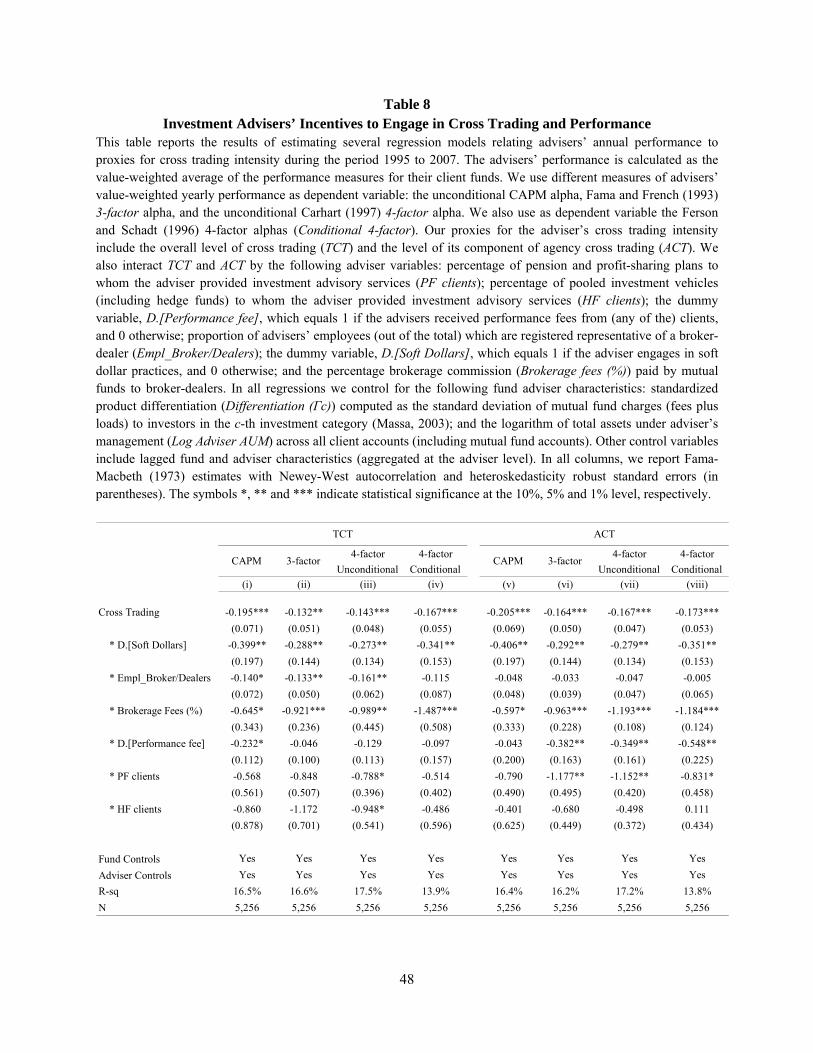
48
Table 8 Investment Advisers’ Incentives to Engage in Cross Trading and Performance
This table reports the results of estimating several regression models relating advisers’ annual performance to proxies for cross trading intensity during the period 1995 to 2007. The advisers’ performance is calculated as the value-weighted average of the performance measures for their client funds. We use different measures of advisers’ value-weighted yearly performance as dependent variable: the unconditional CAPM alpha, Fama and French (1993) 3-factor alpha, and the unconditional Carhart (1997) 4-factor alpha. We also use as dependent variable the Ferson and Schadt (1996) 4-factor alphas (Conditional 4-factor). Our proxies for the adviser’s cross trading intensity include the overall level of cross trading (TCT) and the level of its component of agency cross trading (ACT). We also interact TCT and ACT by the following adviser variables: percentage of pension and profit-sharing plans to whom the adviser provided investment advisory services (PF clients); percentage of pooled investment vehicles (including hedge funds) to whom the adviser provided investment advisory services (HF clients); the dummy variable, D.[Performance fee], which equals 1 if the advisers received performance fees from (any of the) clients, and 0 otherwise; proportion of advisers’ employees (out of the total) which are registered representative of a broker-dealer (Empl_Broker/Dealers); the dummy variable, D.[Soft Dollars], which equals 1 if the adviser engages in soft dollar practices, and 0 otherwise; and the percentage brokerage commission (Brokerage fees (%)) paid by mutual funds to broker-dealers. In all regressions we control for the following fund adviser characteristics: standardized product differentiation (Differentiation (Γc)) computed as the standard deviation of mutual fund charges (fees plus loads) to investors in the c-th investment category (Massa, 2003); and the logarithm of total assets under adviser’s management (Log Adviser AUM) across all client accounts (including mutual fund accounts). Other control variables include lagged fund and adviser characteristics (aggregated at the adviser level). In all columns, we report Fama-Macbeth (1973) estimates with Newey-West autocorrelation and heteroskedasticity robust standard errors (in parentheses). The symbols *, ** and *** indicate statistical significance at the 10%, 5% and 1% level, respectively.
4-factor 4-factor 4-factor 4-factor
Unconditional Conditional Unconditional Conditional
(i) (ii) (iii) (iv) (v) (vi) (vii) (viii)
Cross Trading -0.195*** -0.132** -0.143*** -0.167*** -0.205*** -0.164*** -0.167*** -0.173***
(0.071) (0.051) (0.048) (0.055) (0.069) (0.050) (0.047) (0.053)
* D.[Soft Dollars] -0.399** -0.288** -0.273** -0.341** -0.406** -0.292** -0.279** -0.351**
(0.197) (0.144) (0.134) (0.153) (0.197) (0.144) (0.134) (0.153)
* Empl_Broker/Dealers -0.140* -0.133** -0.161** -0.115 -0.048 -0.033 -0.047 -0.005
(0.072) (0.050) (0.062) (0.087) (0.048) (0.039) (0.047) (0.065)
* Brokerage Fees (%) -0.645* -0.921*** -0.989** -1.487*** -0.597* -0.963*** -1.193*** -1.184***
(0.343) (0.236) (0.445) (0.508) (0.333) (0.228) (0.108) (0.124)
* D.[Performance fee] -0.232* -0.046 -0.129 -0.097 -0.043 -0.382** -0.349** -0.548**
(0.112) (0.100) (0.113) (0.157) (0.200) (0.163) (0.161) (0.225)
* PF clients -0.568 -0.848 -0.788* -0.514 -0.790 -1.177** -1.152** -0.831*
(0.561) (0.507) (0.396) (0.402) (0.490) (0.495) (0.420) (0.458)
* HF clients -0.860 -1.172 -0.948* -0.486 -0.401 -0.680 -0.498 0.111
(0.878) (0.701) (0.541) (0.596) (0.625) (0.449) (0.372) (0.434)
Fund Controls Yes Yes Yes Yes Yes Yes Yes Yes
Adviser Controls Yes Yes Yes Yes Yes Yes Yes Yes
R-sq 16.5% 16.6% 17.5% 13.9% 16.4% 16.2% 17.2% 13.8%
N 5,256 5,256 5,256 5,256 5,256 5,256 5,256 5,256
3-factor
TCT ACT
CAPM 3-factor CAPM
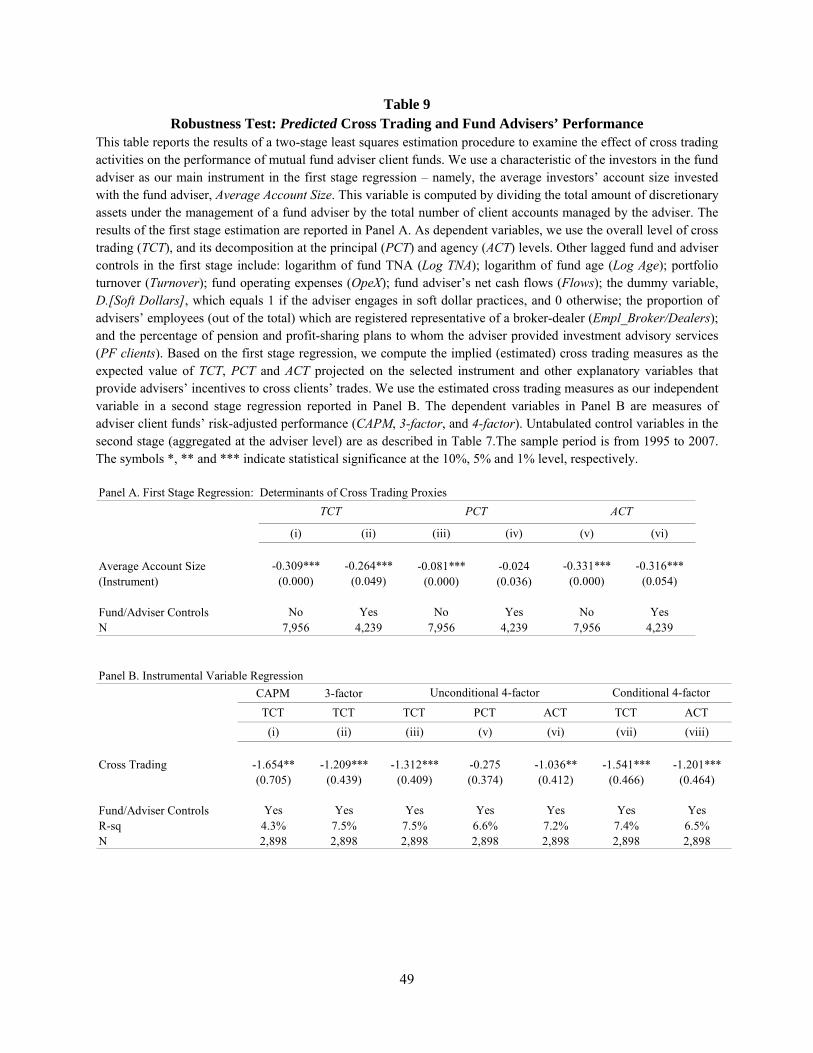
49
Table 9 Robustness Test: Predicted Cross Trading and Fund Advisers’ Performance
This table reports the results of a two-stage least squares estimation procedure to examine the effect of cross trading activities on the performance of mutual fund adviser client funds. We use a characteristic of the investors in the fund adviser as our main instrument in the first stage regression – namely, the average investors’ account size invested with the fund adviser, Average Account Size. This variable is computed by dividing the total amount of discretionary assets under the management of a fund adviser by the total number of client accounts managed by the adviser. The results of the first stage estimation are reported in Panel A. As dependent variables, we use the overall level of cross trading (TCT), and its decomposition at the principal (PCT) and agency (ACT) levels. Other lagged fund and adviser controls in the first stage include: logarithm of fund TNA (Log TNA); logarithm of fund age (Log Age); portfolio turnover (Turnover); fund operating expenses (OpeX); fund adviser’s net cash flows (Flows); the dummy variable, D.[Soft Dollars], which equals 1 if the adviser engages in soft dollar practices, and 0 otherwise; the proportion of advisers’ employees (out of the total) which are registered representative of a broker-dealer (Empl_Broker/Dealers); and the percentage of pension and profit-sharing plans to whom the adviser provided investment advisory services (PF clients). Based on the first stage regression, we compute the implied (estimated) cross trading measures as the expected value of TCT, PCT and ACT projected on the selected instrument and other explanatory variables that provide advisers’ incentives to cross clients’ trades. We use the estimated cross trading measures as our independent variable in a second stage regression reported in Panel B. The dependent variables in Panel B are measures of adviser client funds’ risk-adjusted performance (CAPM, 3-factor, and 4-factor). Untabulated control variables in the second stage (aggregated at the adviser level) are as described in Table 7.The sample period is from 1995 to 2007. The symbols *, ** and *** indicate statistical significance at the 10%, 5% and 1% level, respectively.
Panel A. First Stage Regression: Determinants of Cross Trading Proxies
(i) (ii) (iii) (iv) (v) (vi)
Average Account Size -0.309*** -0.264*** -0.081*** -0.024 -0.331*** -0.316***(Instrument) (0.000) (0.049) (0.000) (0.036) (0.000) (0.054)
Fund/Adviser Controls No Yes No Yes No YesN 7,956 4,239 7,956 4,239 7,956 4,239
TCT PCT ACT
Panel B. Instrumental Variable Regression
CAPM 3-factor
TCT TCT TCT PCT ACT TCT ACT
(i) (ii) (iii) (v) (vi) (vii) (viii)
Cross Trading -1.654** -1.209*** -1.312*** -0.275 -1.036** -1.541*** -1.201***(0.705) (0.439) (0.409) (0.374) (0.412) (0.466) (0.464)
Fund/Adviser Controls Yes Yes Yes Yes Yes Yes YesR-sq 4.3% 7.5% 7.5% 6.6% 7.2% 7.4% 6.5%N 2,898 2,898 2,898 2,898 2,898 2,898 2,898
Unconditional 4-factor Conditional 4-factor
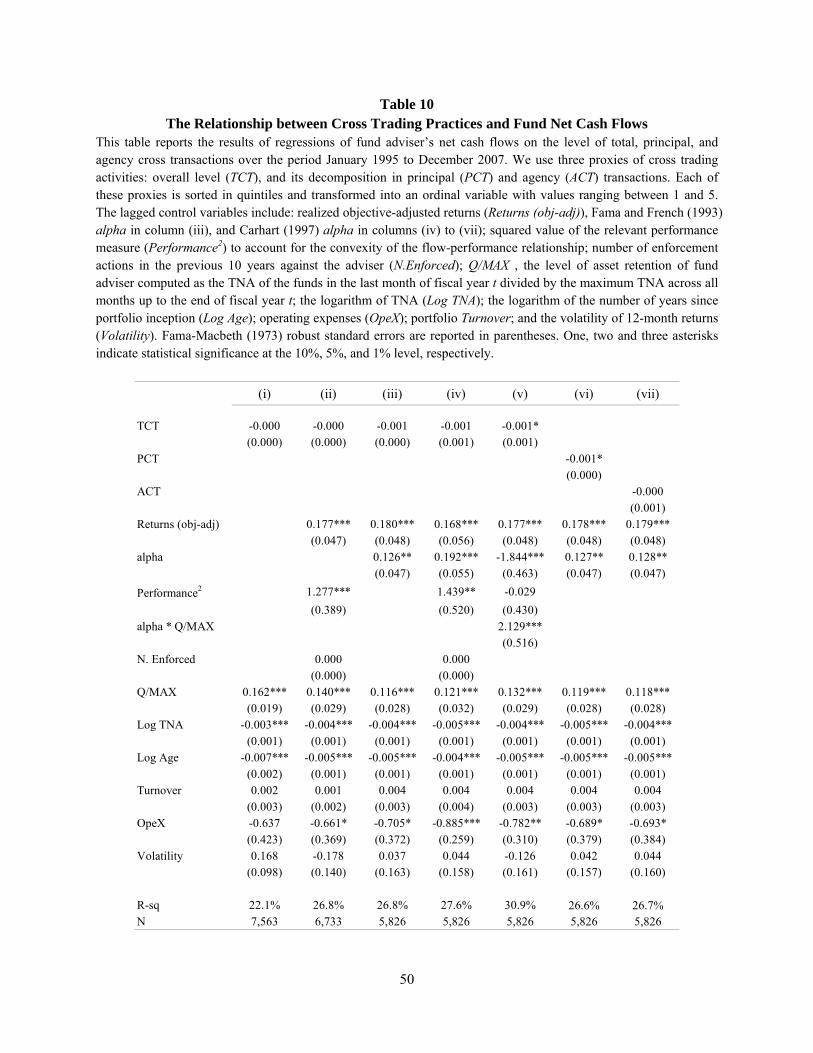
50
Table 10 The Relationship between Cross Trading Practices and Fund Net Cash Flows
This table reports the results of regressions of fund adviser’s net cash flows on the level of total, principal, and agency cross transactions over the period January 1995 to December 2007. We use three proxies of cross trading activities: overall level (TCT), and its decomposition in principal (PCT) and agency (ACT) transactions. Each of these proxies is sorted in quintiles and transformed into an ordinal variable with values ranging between 1 and 5. The lagged control variables include: realized objective-adjusted returns (Returns (obj-adj)), Fama and French (1993) alpha in column (iii), and Carhart (1997) alpha in columns (iv) to (vii); squared value of the relevant performance measure (Performance2) to account for the convexity of the flow-performance relationship; number of enforcement actions in the previous 10 years against the adviser (N.Enforced); Q/MAX , the level of asset retention of fund adviser computed as the TNA of the funds in the last month of fiscal year t divided by the maximum TNA across all months up to the end of fiscal year t; the logarithm of TNA (Log TNA); the logarithm of the number of years since portfolio inception (Log Age); operating expenses (OpeX); portfolio Turnover; and the volatility of 12-month returns (Volatility). Fama-Macbeth (1973) robust standard errors are reported in parentheses. One, two and three asterisks indicate statistical significance at the 10%, 5%, and 1% level, respectively.
(i) (ii) (iii) (iv) (v) (vi) (vii)
TCT -0.000 -0.000 -0.001 -0.001 -0.001*(0.000) (0.000) (0.000) (0.001) (0.001)
PCT -0.001*(0.000)
ACT -0.000(0.001)
Returns (obj-adj) 0.177*** 0.180*** 0.168*** 0.177*** 0.178*** 0.179***(0.047) (0.048) (0.056) (0.048) (0.048) (0.048)
alpha 0.126** 0.192*** -1.844*** 0.127** 0.128**(0.047) (0.055) (0.463) (0.047) (0.047)
Performance2 1.277*** 1.439** -0.029
(0.389) (0.520) (0.430)alpha * Q/MAX 2.129***
(0.516)N. Enforced 0.000 0.000
(0.000) (0.000)Q/MAX 0.162*** 0.140*** 0.116*** 0.121*** 0.132*** 0.119*** 0.118***
(0.019) (0.029) (0.028) (0.032) (0.029) (0.028) (0.028)Log TNA -0.003*** -0.004*** -0.004*** -0.005*** -0.004*** -0.005*** -0.004***
(0.001) (0.001) (0.001) (0.001) (0.001) (0.001) (0.001)Log Age -0.007*** -0.005*** -0.005*** -0.004*** -0.005*** -0.005*** -0.005***
(0.002) (0.001) (0.001) (0.001) (0.001) (0.001) (0.001)Turnover 0.002 0.001 0.004 0.004 0.004 0.004 0.004
(0.003) (0.002) (0.003) (0.004) (0.003) (0.003) (0.003)OpeX -0.637 -0.661* -0.705* -0.885*** -0.782** -0.689* -0.693*
(0.423) (0.369) (0.372) (0.259) (0.310) (0.379) (0.384)Volatility 0.168 -0.178 0.037 0.044 -0.126 0.042 0.044
(0.098) (0.140) (0.163) (0.158) (0.161) (0.157) (0.160)
R-sq 22.1% 26.8% 26.8% 27.6% 30.9% 26.6% 26.7%N 7,563 6,733 5,826 5,826 5,826 5,826 5,826
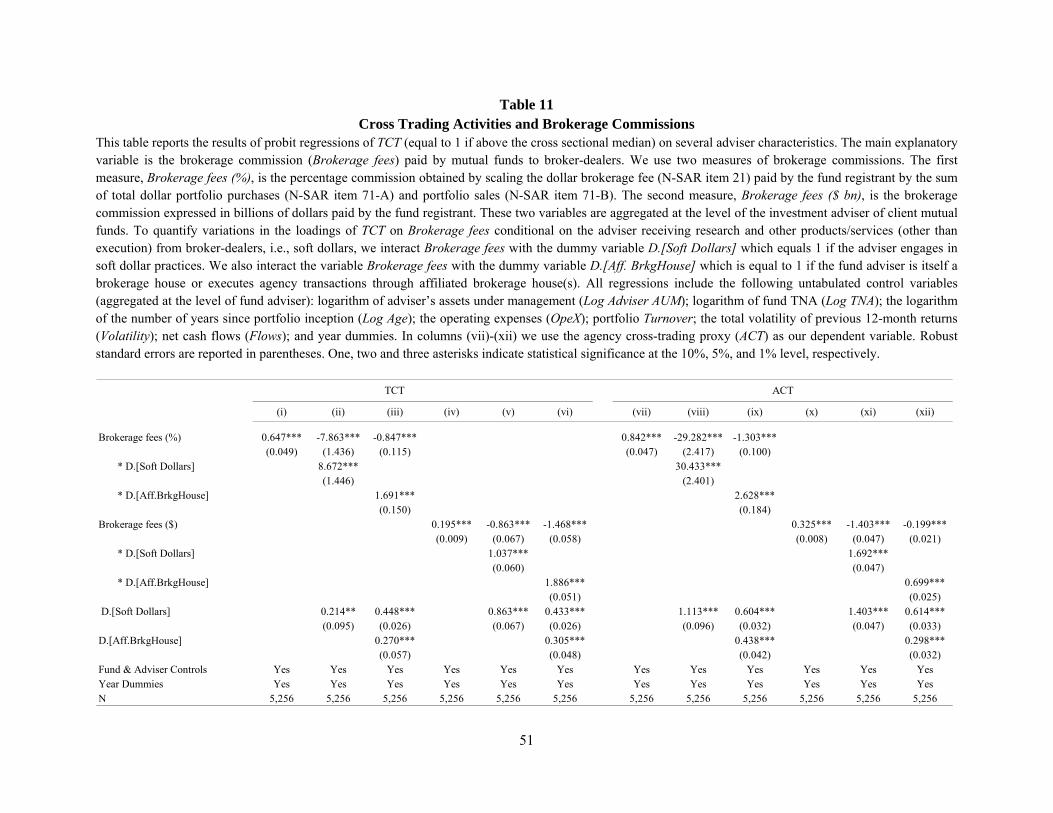
51
Table 11 Cross Trading Activities and Brokerage Commissions
This table reports the results of probit regressions of TCT (equal to 1 if above the cross sectional median) on several adviser characteristics. The main explanatory variable is the brokerage commission (Brokerage fees) paid by mutual funds to broker-dealers. We use two measures of brokerage commissions. The first measure, Brokerage fees (%), is the percentage commission obtained by scaling the dollar brokerage fee (N-SAR item 21) paid by the fund registrant by the sum of total dollar portfolio purchases (N-SAR item 71-A) and portfolio sales (N-SAR item 71-B). The second measure, Brokerage fees ($ bn), is the brokerage commission expressed in billions of dollars paid by the fund registrant. These two variables are aggregated at the level of the investment adviser of client mutual funds. To quantify variations in the loadings of TCT on Brokerage fees conditional on the adviser receiving research and other products/services (other than execution) from broker-dealers, i.e., soft dollars, we interact Brokerage fees with the dummy variable D.[Soft Dollars] which equals 1 if the adviser engages in soft dollar practices. We also interact the variable Brokerage fees with the dummy variable D.[Aff. BrkgHouse] which is equal to 1 if the fund adviser is itself a brokerage house or executes agency transactions through affiliated brokerage house(s). All regressions include the following untabulated control variables (aggregated at the level of fund adviser): logarithm of adviser’s assets under management (Log Adviser AUM); logarithm of fund TNA (Log TNA); the logarithm of the number of years since portfolio inception (Log Age); the operating expenses (OpeX); portfolio Turnover; the total volatility of previous 12-month returns (Volatility); net cash flows (Flows); and year dummies. In columns (vii)-(xii) we use the agency cross-trading proxy (ACT) as our dependent variable. Robust standard errors are reported in parentheses. One, two and three asterisks indicate statistical significance at the 10%, 5%, and 1% level, respectively.
(i) (ii) (iii) (iv) (v) (vi) (vii) (viii) (ix) (x) (xi) (xii)
Brokerage fees (%) 0.647*** -7.863*** -0.847*** 0.842*** -29.282*** -1.303***(0.049) (1.436) (0.115) (0.047) (2.417) (0.100)
* D.[Soft Dollars] 8.672*** 30.433***(1.446) (2.401)
* D.[Aff.BrkgHouse] 1.691*** 2.628***(0.150) (0.184)
Brokerage fees ($) 0.195*** -0.863*** -1.468*** 0.325*** -1.403*** -0.199***(0.009) (0.067) (0.058) (0.008) (0.047) (0.021)
* D.[Soft Dollars] 1.037*** 1.692***(0.060) (0.047)
* D.[Aff.BrkgHouse] 1.886*** 0.699***(0.051) (0.025)
D.[Soft Dollars] 0.214** 0.448*** 0.863*** 0.433*** 1.113*** 0.604*** 1.403*** 0.614***(0.095) (0.026) (0.067) (0.026) (0.096) (0.032) (0.047) (0.033)
D.[Aff.BrkgHouse] 0.270*** 0.305*** 0.438*** 0.298***(0.057) (0.048) (0.042) (0.032)
Fund & Adviser Controls Yes Yes Yes Yes Yes Yes Yes Yes Yes Yes Yes YesYear Dummies Yes Yes Yes Yes Yes Yes Yes Yes Yes Yes Yes YesN 5,256 5,256 5,256 5,256 5,256 5,256 5,256 5,256 5,256 5,256 5,256 5,256
TCT ACT
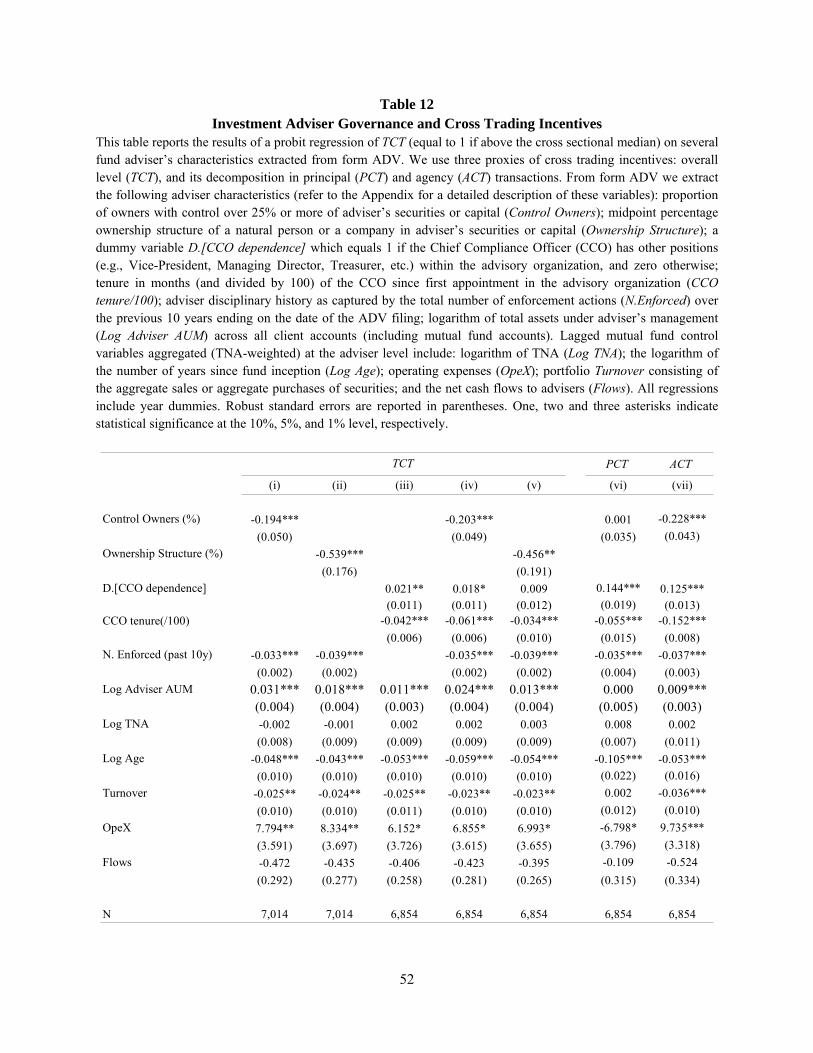
52
Table 12 Investment Adviser Governance and Cross Trading Incentives
This table reports the results of a probit regression of TCT (equal to 1 if above the cross sectional median) on several fund adviser’s characteristics extracted from form ADV. We use three proxies of cross trading incentives: overall level (TCT), and its decomposition in principal (PCT) and agency (ACT) transactions. From form ADV we extract the following adviser characteristics (refer to the Appendix for a detailed description of these variables): proportion of owners with control over 25% or more of adviser’s securities or capital (Control Owners); midpoint percentage ownership structure of a natural person or a company in adviser’s securities or capital (Ownership Structure); a dummy variable D.[CCO dependence] which equals 1 if the Chief Compliance Officer (CCO) has other positions (e.g., Vice-President, Managing Director, Treasurer, etc.) within the advisory organization, and zero otherwise; tenure in months (and divided by 100) of the CCO since first appointment in the advisory organization (CCO tenure/100); adviser disciplinary history as captured by the total number of enforcement actions (N.Enforced) over the previous 10 years ending on the date of the ADV filing; logarithm of total assets under adviser’s management (Log Adviser AUM) across all client accounts (including mutual fund accounts). Lagged mutual fund control variables aggregated (TNA-weighted) at the adviser level include: logarithm of TNA (Log TNA); the logarithm of the number of years since fund inception (Log Age); operating expenses (OpeX); portfolio Turnover consisting of the aggregate sales or aggregate purchases of securities; and the net cash flows to advisers (Flows). All regressions include year dummies. Robust standard errors are reported in parentheses. One, two and three asterisks indicate statistical significance at the 10%, 5%, and 1% level, respectively.
PCT ACT
(i) (ii) (iii) (iv) (v) (vi) (vii)
Control Owners (%) -0.194*** -0.203*** 0.001 -0.228***
(0.050) (0.049) (0.035) (0.043)
Ownership Structure (%) -0.539*** -0.456**
(0.176) (0.191)
D.[CCO dependence] 0.021** 0.018* 0.009 0.144*** 0.125***(0.011) (0.011) (0.012) (0.019) (0.013)
CCO tenure(/100) -0.042*** -0.061*** -0.034*** -0.055*** -0.152***
(0.006) (0.006) (0.010) (0.015) (0.008)
N. Enforced (past 10y) -0.033*** -0.039*** -0.035*** -0.039*** -0.035*** -0.037***
(0.002) (0.002) (0.002) (0.002) (0.004) (0.003)
Log Adviser AUM 0.031*** 0.018*** 0.011*** 0.024*** 0.013*** 0.000 0.009***(0.004) (0.004) (0.003) (0.004) (0.004) (0.005) (0.003)
Log TNA -0.002 -0.001 0.002 0.002 0.003 0.008 0.002
(0.008) (0.009) (0.009) (0.009) (0.009) (0.007) (0.011)
Log Age -0.048*** -0.043*** -0.053*** -0.059*** -0.054*** -0.105*** -0.053***
(0.010) (0.010) (0.010) (0.010) (0.010) (0.022) (0.016)
Turnover -0.025** -0.024** -0.025** -0.023** -0.023** 0.002 -0.036***
(0.010) (0.010) (0.011) (0.010) (0.010) (0.012) (0.010)
OpeX 7.794** 8.334** 6.152* 6.855* 6.993* -6.798* 9.735***
(3.591) (3.697) (3.726) (3.615) (3.655) (3.796) (3.318)
Flows -0.472 -0.435 -0.406 -0.423 -0.395 -0.109 -0.524
(0.292) (0.277) (0.258) (0.281) (0.265) (0.315) (0.334)
N 7,014 7,014 6,854 6,854 6,854 6,854 6,854
TCT
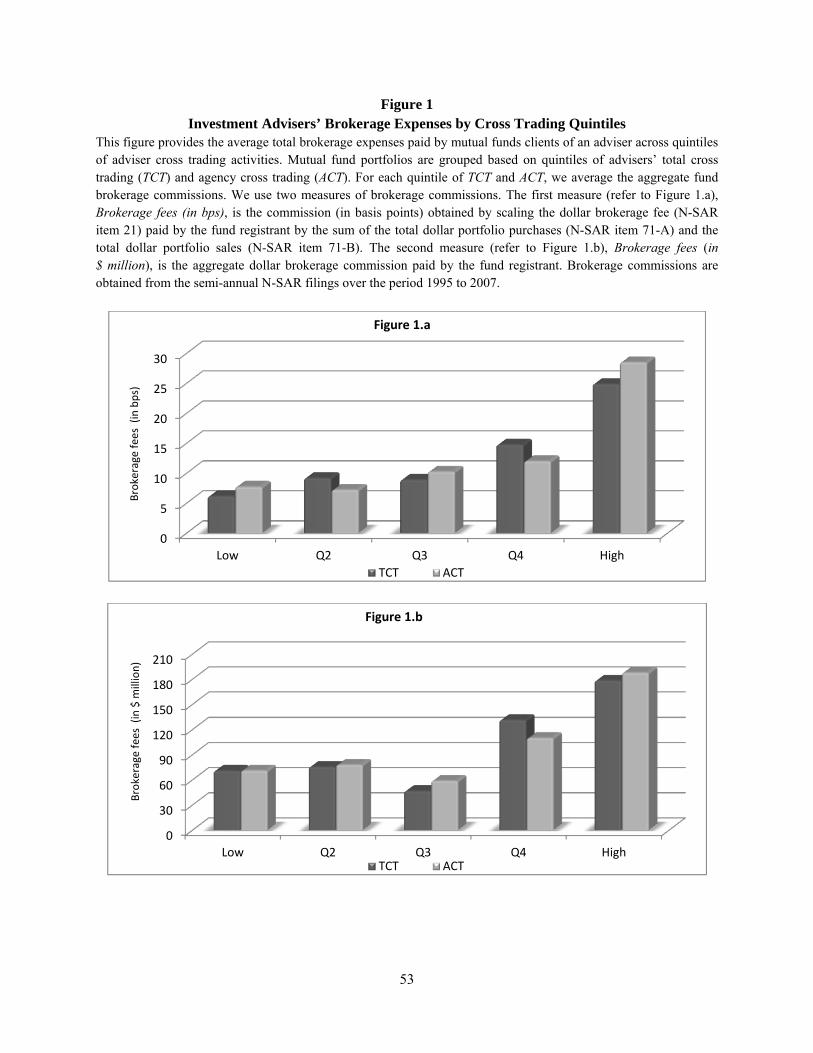
53
Figure 1 Investment Advisers’ Brokerage Expenses by Cross Trading Quintiles
This figure provides the average total brokerage expenses paid by mutual funds clients of an adviser across quintiles of adviser cross trading activities. Mutual fund portfolios are grouped based on quintiles of advisers’ total cross trading (TCT) and agency cross trading (ACT). For each quintile of TCT and ACT, we average the aggregate fund brokerage commissions. We use two measures of brokerage commissions. The first measure (refer to Figure 1.a), Brokerage fees (in bps), is the commission (in basis points) obtained by scaling the dollar brokerage fee (N-SAR item 21) paid by the fund registrant by the sum of the total dollar portfolio purchases (N-SAR item 71-A) and the total dollar portfolio sales (N-SAR item 71-B). The second measure (refer to Figure 1.b), Brokerage fees (in $ million), is the aggregate dollar brokerage commission paid by the fund registrant. Brokerage commissions are obtained from the semi-annual N-SAR filings over the period 1995 to 2007.
0
5
10
15
20
25
30
Low Q2 Q3 Q4 High
Brokerage fees (in bps)
Figure 1.a
TCT ACT
0
30
60
90
120
150
180
210
Low Q2 Q3 Q4 High
Brokerage fees (in $ m
illion)
Figure 1.b
TCT ACT