Embed Size (px)
Citation preview
Journal of Critical Care (2011) 26, 388–394
Cross-validation of a modified score to predict mortality incancer patients admitted to the intensive care unit☆
Joseph L. Nates MD, MBAa,⁎,1, Marylou Cárdenas-Turanzas MD, DrPHa,1,Joe Ensor PhDb, Chris Wakefield BS c, Susannah Kish Wallace MSN, RNd,Kristen J. Price MDa
aDepartment of Critical Care, Unit 112, The University of Texas MD Anderson Cancer Center, Houston, TX 77030-4009, USAbDepartment of Biostatistics, Unit 1401, The University of Texas MD Anderson Cancer Center, Houston, TX 77030-4009, USAcDivision of Quantitative Sciences, Unit 522, The University of Texas MD Anderson Cancer Center, Houston,TX 77030-4009, USAdOffice of Performance Improvement, Unit 1441, The University of Texas MD Anderson Cancer Center, Houston,TX 77030-4009, USA
u
re
0d
Keywords:Cancer;Critically ill;Mortality;ROC curve analysis
AbstractPurpose: The aim of this studywas to cross-validate an automated and customized severity of illness scoreas a means of predicting death among adult cancer patients admitted to the intensive care unit (ICU).Materials and Methods:We conducted a retrospective study of ICU discharges between January 1, 2001,and December 31, 2005, in a university comprehensive cancer center. We randomly selected training andvalidation samples in 2 ICU groups (medical and surgical patients). We used logistic regression tocalculate the probabilities of death in the ICU and in-hospital death in training samples and applied theseprobabilities to the validation samples to calculate sensitivity and specificity, construct curves, anddetermined the areas under the receiver operating characteristic curve (AUC).Results: We included 6880 patients. In predicting ICU mortality, the AUC was 0.77 (95% confidenceinterval [CI], 0.73-0.82) for the medical validation group and 0.8207 (95% CI, 0.7304-0.9109) for thesurgical validation group. For in-hospital mortality, the AUCs for the groups of medical and surgicalpatients were 0.73 (95% CI, 0.69-0.76) and 0.77 (95% CI, 0.73-0.80), respectively.Conclusions: The modified Sequential Organ Failure Assessment score is a good and valid predictor ofcancer patients' risk of dying in the ICU and/or hospital despite the modifications needed to automate thescore using existing electronic data.© 2011 Elsevier Inc. All rights reserved.
☆ No institutional funding or other sources of financial support weresed for this study.⁎ Corresponding author. Tel.: +1 713 792 5040; fax: +1 713 745 1869.E-mail address: [email protected] (J.L. Nates).1 Authors contributed equally to this manuscript and agree to share
sponsibility for first authorship.
883-9441/$ – see front matter © 2011 Elsevier Inc. All rights reserved.oi:10.1016/j.jcrc.2010.10.016
1. Introduction
Critical care costs have risen to 4.2% of the nationalhealth expenditures in the United States. Patients who areadmitted to the intensive care unit (ICU) have substantiallyhigher rates of death and morbidity, increased length of stay
389Cross-validation of a modified score for cancer patients
(LOS), and higher hospital costs than do patients who havenon-ICU hospital stays. Investigators have attempted tomitigate these negative effects of ICU admission bydeveloping scoring systems that assess the severity of illnessin critically ill patients. When outcomes can be predictedduring these patients' first 24 hours in the ICU, moreeffective and consistent decisions can be made by cliniciansand family members about interventions [1].
One of the scoring systems used to guide interventionsand research in the ICU is the Sequential Organ FailureAssessment (SOFA), which was developed in 1994 topredict mortality in patients with sepsis [2]. A later versionincluding the specific clinical parameters to calculate thescore was published by Peres-Bota et al [3] in 2002. Today,SOFA is widely used to assess severity of illness in patientsadmitted to the ICU. The SOFA has been validated in severalpatient populations and has also been customized to assessthe severity of illness in specific populations, includingpediatric patients [4], adult surgical patients [5], and patientswith severe neurologic injury [6]. However, despite theavailability of this and a number of similar or more complexprediction tools, none of these scores can be easily calculatedfor a large number of patients evaluated retrospectively usingelectronically available data. Until everyone has a completeelectronic medical record, certain aspects of the scores suchas the Glasgow coma score (GCS), urinary output, or vitalsigns are not available electronically. Therefore, we modifiedthe SOFA score to assess the risk of mortality for cancerpatients admitted to the ICU. We omitted the neurologiccomponent of the SOFA and modified the cardiovascularcomponent of the score. Patients may be partially sedatedupon their admission to the ICU as a result of prior surgery ormechanical ventilation following acute respiratory failure.The effect of sedation on those patients' central nervoussystem function can be inaccurately interpreted by themedical personnel calculating the GCS and consequentlyaffect the calculation of the conventional SOFA's neurologiccomponent values. Also, ICU patients with cancer mayreceive high doses of vasopressors or more than 1vasopressor at the same time. Because the cardiovascularcomponent of the conventional SOFA assigns an increasedrisk of death when the patient is receiving multiple or higherdoses of vasopressors, cancer patients receiving vasopressorsmay be accurately assessed with a treatment-dependentvariable measuring the number of vasopressors administered.
Customizing the SOFA for critically ill patients withcancer can provide a much needed tool for assessing theirrisk of dying in the ICU. Validating an electronic version ofthe SOFA can confirm that the modified score measures therisk of mortality as it was intended to measure. Thecustomized and validated score can also benefit research,surveillance for quality of care, and allocation of resourcesfor patients with cancer admitted to the ICU. Furthermore,validating the electronic version of the SOFA for specificgroups of cancer patients such as the surgical and medicalgroups can facilitate the generalization of our results to other
groups of patients with cancer. We thus aimed to evaluateand validate the discriminative performance of an automatedand modified SOFA (mSOFA) score to predict mortalityamong the groups of surgical and medical cancer patientsadmitted to the ICU of our comprehensive cancer center [7].First, we omitted the neurologic component of the SOFA,modified the cardiovascular component, and developed afully computerized data collection and scoring systembecause of the lack of the necessary information in therecords. Second, we tested the assessment using patientrecords that were electronically collected and analyzedretrospectively. Third, we categorized patients by type ofadmissions (surgical and medical) and separated eachadmission group in training and validation samples. Wehypothesized that our mSOFA will satisfactorily predict ICUand in-hospital mortality among the validation groups ofcritical care patients with cancer admitted to the ICU.
2. Materials and methods
2.1. Patient selection
Following approval by The University of Texas MDAnderson Cancer Center's Institutional Review Board, weconducted this study in 2009 using electronic medicalrecords that were maintained in an institutional database. Weextracted the records of all patients discharged from thecenter's ICU between January 1, 2001, and December 31,2005. From the extracted records, we included in our studyonly patients who were 18 years or older and were in the ICUfor 24 hours or more. For patients who had multipleadmissions to the ICU during the same hospital stay, weincluded data from only the first admission.
We separated the patients into 2 ICU groups, thoseadmitted for postsurgical care and those admitted for othermedical care. In addition, from the medical records, wecollected data on age, sex, ethnicity (white, black, Hispanic,or other), type of cancer (hematologic or nonhematologic),dates of admission and discharge (for both the hospital andthe ICU), and discharge status (whether patients died or weredischarged). Dates of admission and discharge were used tocalculate LOS in the ICU and LOS in the hospital. For allpatients included in the study, we calculated an mSOFAscore based on data recorded during their first 24 hours in theICU. A detailed explanation on how the scores werecalculated follows.
2.2. Customization of the SOFA
To assess the risk of mortality in our cancer patientpopulation, we customized the SOFA as described by Peres-Bota et al [3] by omitting the neurologic component andmodifying the cardiovascular component. Due to the lack ofthe GCS documentation, the neurologic component of thescore was not calculated. For the cardiovascular component,
390 J.L. Nates et al.
in contrast with the original SOFA score that measures themean arterial pressure and the doses and numbers ofvasopressors used, we only determined the total number ofvasopressors administered during the first 24 hours in theICU. We made this decision because the doses ofvasopressors used were not available in the data files. Theomission of the neurologic component and modification ofthe cardiovascular component yielded a score range of 0 to20 for our mSOFA [7].
To calculate the hepatic, renal, coagulation, and respira-tory components of the score during the first 24 hours ofadmission, missing data were carried forward or inputted.We carried forward values that were available in the chartbefore arrival to the unit and inputted values as normal whenmissing. This strategy attempts to reflect the medicaldecision-making process of physicians not ordering tests,unless the physician suspects organ failure. We foundmissing data and inputted normal values as follows: renal(0.7%), hepatic (40%), coagulation (0.6%), and respiratory(10%). The pharmacologic data in our unit are complete andreliable; therefore, it was not necessary to input thecardiovascular component of the score.
The goal of the study was to validate the score and itsperformance in surgical and medical patients. We validatedthe score by comparing its accuracy in predicting mortality inthe ICU as well as in-hospital mortality in validation groupsof medical and surgical patients. The probabilities of deathfor each cutpoint of the score were calculated by analyzingthe data of the training groups (surgical or medical), appliedthe logistic regression equation from the training groupsto the validation groups, and compared the observed andexpected deaths. The discriminative performance of the scorewas evaluated by calculating the areas under the curve(AUCs) derived from receiver operating characteristic(ROC) curves of the validation groups of surgical andmedical patients. The discharge status of the patient from theICU (deceased or alive) as well as from the hospital was thereference values for the ROC curves.
2.3. Statistical analysis
We used frequencies and measures of central tendency todescribe the surgical and medical ICU groups. We evaluateddemographic and clinical characteristics associated with thetype of ICU admission (surgical or medical) by using the χ2
test for ordinal and categorical variables and the t test forcontinuous variables. The Fisher exact test was preferredwhen the expected count in the cells of a contingency tablehad less than 5 cases.
We assessed the discriminative performance of themSOFA to predict ICU mortality in medical and surgicalpatients separately. In the medical group, we used logisticregression analysis to evaluate how accurately the mSOFAscore predicted ICU mortality. We randomly split themedical patient group into 2 groups, one with 75% of thepatients and the other with 25%. The larger group was used
for training, and the smaller group was used for validation ofthe logistic regression model. In this way, we assessed howwell the model based in the training sample would performfor the overall population of surgical patients extracted fromour database. We considered the logistic regression model tobe appropriate if the accuracy in the validation sample waswithin 10% of the accuracy in the training sample. Wereported the results of the logistic regression analysis fromeach of the training samples and evaluated the goodness-of-fit of the training models by using the Hosmer-Lemeshowgoodness-of-fit test. For the validation models, we reportedthe observed and predicted number of patients dischargeddead or alive in the partition groups used to determine theHosmer-Lemeshow goodness-of-fit tests in each of themodels. We followed the same analysis to evaluate ICUmortality in surgical patients.
The same analysis plan was used to assess theperformance of the mSOFA score to predict in-hospitalmortality in the medical and surgical groups of patients.
In the last step, we constructed ROC curves andcalculated the areas under the ROC curves (AUC) to predictICU mortality and in-hospital mortality in the medical andsurgical admissions. A P value of less than .05 wasconsidered statistically significant.
We used SPSS 15.0 for Windows (SPSS Inc, Chicago, Ill)and Stata version 10 statistical software (StataCorp LP,College Station, Tex) for the statistical analysis.
3. Results
We included 6880 patients in the study. Overall, thepatients' mean age was 57.6 years (median, 59 years), andmost patients (57.4%) were men. The men were significantlyolder than the women (58.5 years vs 56.3 years, P b .001).Most of the patients (63.8%) were admitted into the surgicalunit. Table 1 shows demographic characteristics and selectedfindings for the surgical and medical ICU patient groups.
We found race/ethnicity associated with the type of unit ofadmission. Compared with whites, the medical patients weremore likely to be black, Hispanic, or from other groups (P ≤.001), and this association persisted after adjusting for age.We observed that the hospital LOS (P b .001), ICU LOS(P ≤ .001), mortality (P ≤ .001), the type of cancer (P ≤.001), and the mSOFA score (P ≤ .001) were significantlyassociated with the type of unit of admission (see Table 1).
The medical group included 2491 patients, of whom 508(20.44%) died in the ICU. Medical patients who died in theunit had a mean mSOFA score at admission to the ICU of6.8 ± 3.1, whereas patients who did not die in the hospitalhad a mean mSOFA score of 3.7 ± 2.8. We randomlyassigned 1879 patients (75.4%) to the training group and612 patients (24.6%) to the validation group. The mortalityrate was 20% in the training group and 22% in thevalidation group (P = .16). In the training sample, we foundthat the mSOFA score was significantly (P ≤ .001)
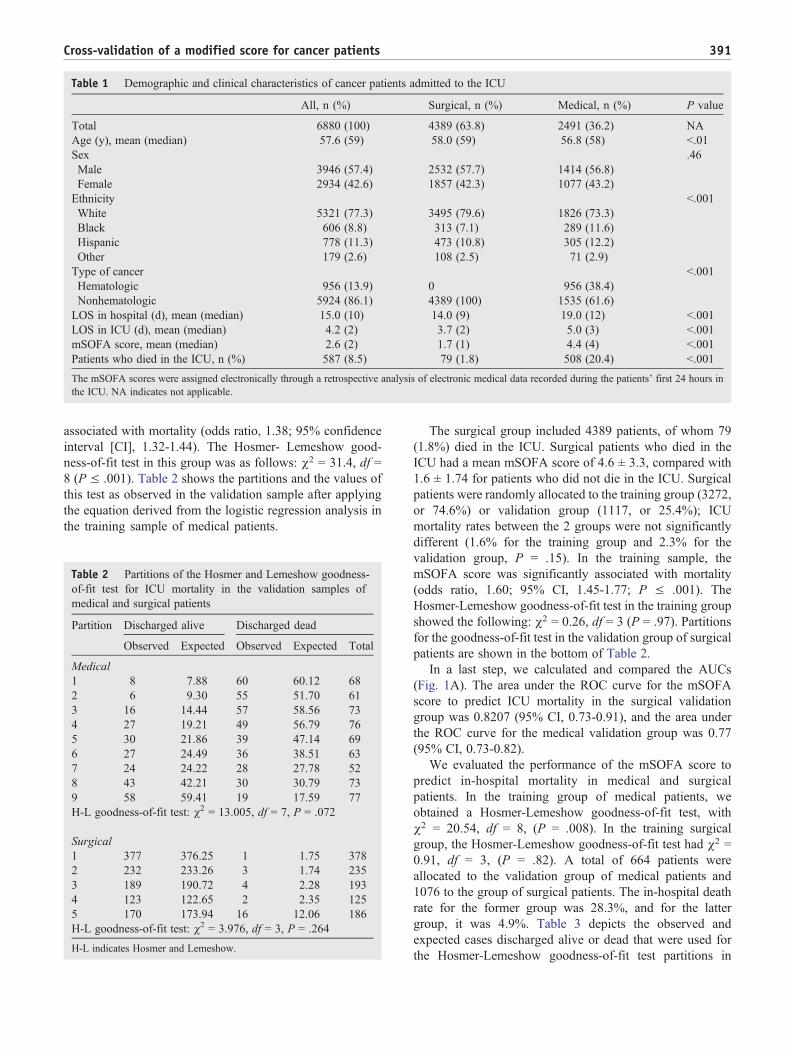
Table 1 Demographic and clinical characteristics of cancer patients admitted to the ICU
All, n (%) Surgical, n (%) Medical, n (%) P value
Total 6880 (100) 4389 (63.8) 2491 (36.2) NAAge (y), mean (median) 57.6 (59) 58.0 (59) 56.8 (58) b.01Sex .46Male 3946 (57.4) 2532 (57.7) 1414 (56.8)Female 2934 (42.6) 1857 (42.3) 1077 (43.2)Ethnicity b.001White 5321 (77.3) 3495 (79.6) 1826 (73.3)Black 606 (8.8) 313 (7.1) 289 (11.6)Hispanic 778 (11.3) 473 (10.8) 305 (12.2)Other 179 (2.6) 108 (2.5) 71 (2.9)Type of cancer b.001Hematologic 956 (13.9) 0 956 (38.4)Nonhematologic 5924 (86.1) 4389 (100) 1535 (61.6)LOS in hospital (d), mean (median) 15.0 (10) 14.0 (9) 19.0 (12) b.001LOS in ICU (d), mean (median) 4.2 (2) 3.7 (2) 5.0 (3) b.001mSOFA score, mean (median) 2.6 (2) 1.7 (1) 4.4 (4) b.001Patients who died in the ICU, n (%) 587 (8.5) 79 (1.8) 508 (20.4) b.001
The mSOFA scores were assigned electronically through a retrospective analysis of electronic medical data recorded during the patients' first 24 hours inthe ICU. NA indicates not applicable.
391Cross-validation of a modified score for cancer patients
associated with mortality (odds ratio, 1.38; 95% confidenceinterval [CI], 1.32-1.44). The Hosmer- Lemeshow good-ness-of-fit test in this group was as follows: χ2 = 31.4, df =8 (P ≤ .001). Table 2 shows the partitions and the values ofthis test as observed in the validation sample after applyingthe equation derived from the logistic regression analysis inthe training sample of medical patients.
Table 2 Partitions of the Hosmer and Lemeshow goodness-of-fit test for ICU mortality in the validation samples ofmedical and surgical patients
Partition Discharged alive Discharged dead
Observed Expected Observed Expected Total
Medical1 8 7.88 60 60.12 682 6 9.30 55 51.70 613 16 14.44 57 58.56 734 27 19.21 49 56.79 765 30 21.86 39 47.14 696 27 24.49 36 38.51 637 24 24.22 28 27.78 528 43 42.21 30 30.79 739 58 59.41 19 17.59 77H-L goodness-of-fit test: χ2 = 13.005, df = 7, P = .072
Surgical1 377 376.25 1 1.75 3782 232 233.26 3 1.74 2353 189 190.72 4 2.28 1934 123 122.65 2 2.35 1255 170 173.94 16 12.06 186H-L goodness-of-fit test: χ2 = 3.976, df = 3, P = .264
H-L indicates Hosmer and Lemeshow.
The surgical group included 4389 patients, of whom 79(1.8%) died in the ICU. Surgical patients who died in theICU had a mean mSOFA score of 4.6 ± 3.3, compared with1.6 ± 1.74 for patients who did not die in the ICU. Surgicalpatients were randomly allocated to the training group (3272,or 74.6%) or validation group (1117, or 25.4%); ICUmortality rates between the 2 groups were not significantlydifferent (1.6% for the training group and 2.3% for thevalidation group, P = .15). In the training sample, themSOFA score was significantly associated with mortality(odds ratio, 1.60; 95% CI, 1.45-1.77; P ≤ .001). TheHosmer-Lemeshow goodness-of-fit test in the training groupshowed the following: χ2 = 0.26, df = 3 (P = .97). Partitionsfor the goodness-of-fit test in the validation group of surgicalpatients are shown in the bottom of Table 2.
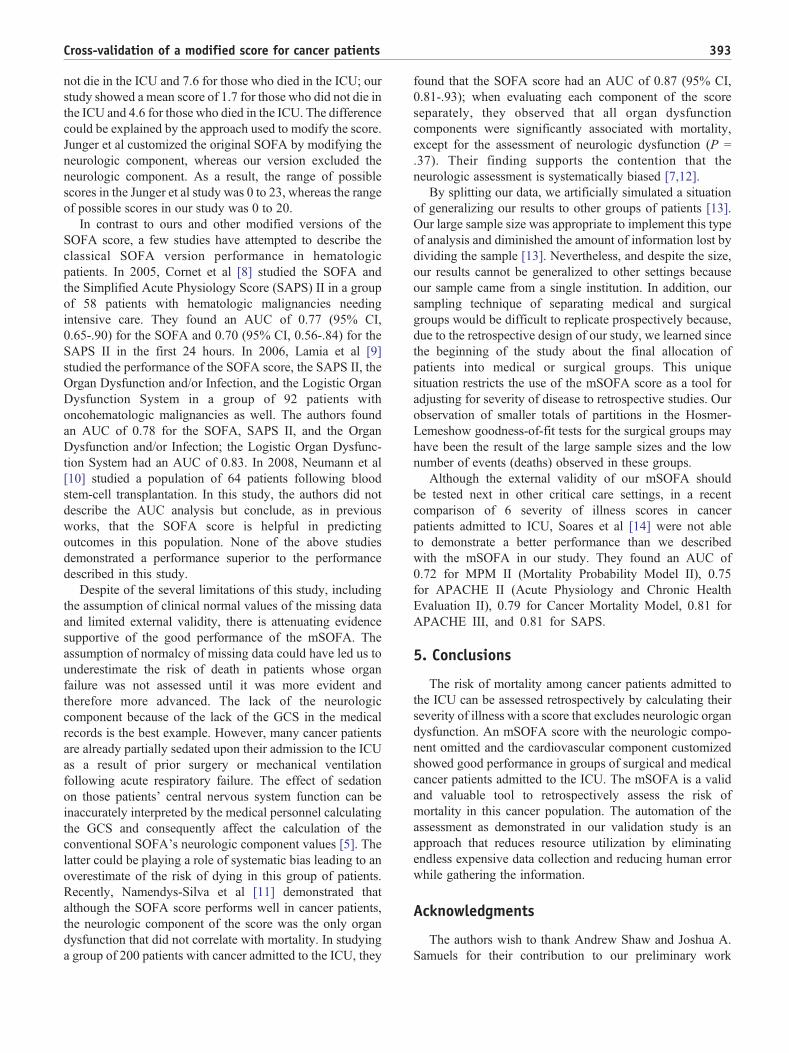
In a last step, we calculated and compared the AUCs(Fig. 1A). The area under the ROC curve for the mSOFAscore to predict ICU mortality in the surgical validationgroup was 0.8207 (95% CI, 0.73-0.91), and the area underthe ROC curve for the medical validation group was 0.77(95% CI, 0.73-0.82).
We evaluated the performance of the mSOFA score topredict in-hospital mortality in medical and surgicalpatients. In the training group of medical patients, weobtained a Hosmer-Lemeshow goodness-of-fit test, withχ2 = 20.54, df = 8, (P = .008). In the training surgicalgroup, the Hosmer-Lemeshow goodness-of-fit test had χ2 =0.91, df = 3, (P = .82). A total of 664 patients wereallocated to the validation group of medical patients and1076 to the group of surgical patients. The in-hospital deathrate for the former group was 28.3%, and for the lattergroup, it was 4.9%. Table 3 depicts the observed andexpected cases discharged alive or dead that were used forthe Hosmer-Lemeshow goodness-of-fit test partitions in
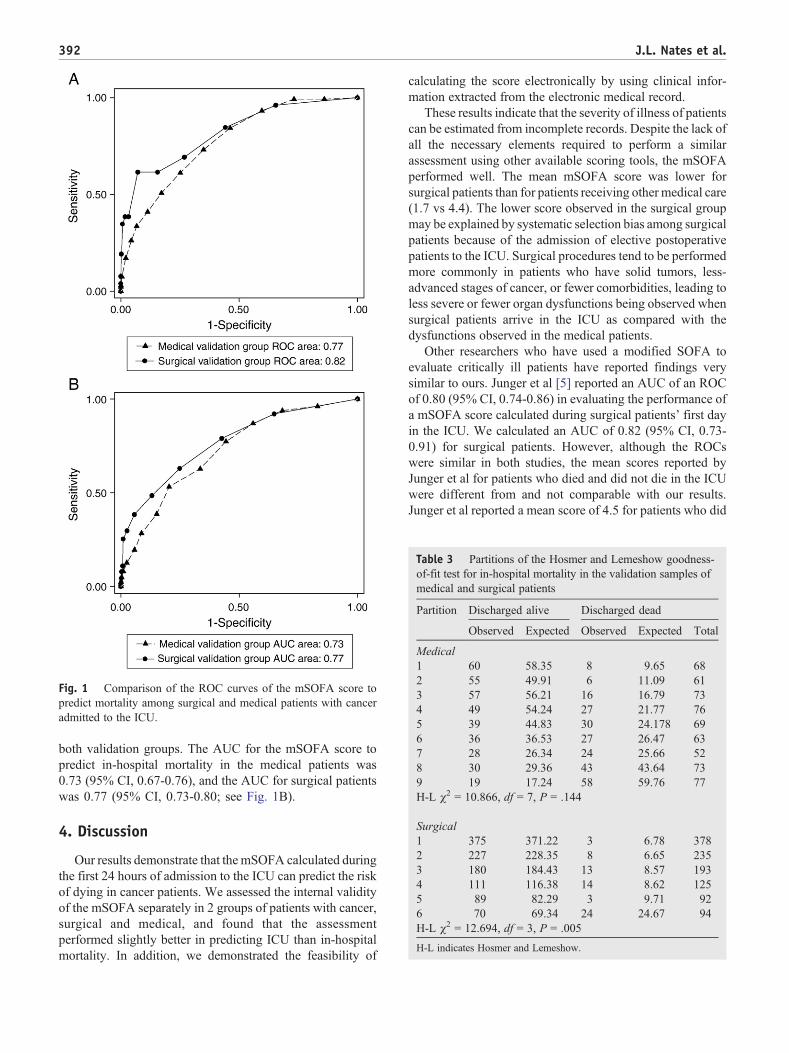
Fig. 1 Comparison of the ROC curves of the mSOFA score topredict mortality among surgical and medical patients with canceradmitted to the ICU.
Table 3 Partitions of the Hosmer and Lemeshow goodness-of-fit test for in-hospital mortality in the validation samples ofmedical and surgical patients
Partition Discharged alive Discharged dead
Observed Expected Observed Expected Total
Medical1 60 58.35 8 9.65 682 55 49.91 6 11.09 613 57 56.21 16 16.79 734 49 54.24 27 21.77 765 39 44.83 30 24.178 696 36 36.53 27 26.47 637 28 26.34 24 25.66 528 30 29.36 43 43.64 739 19 17.24 58 59.76 77H-L χ2 = 10.866, df = 7, P = .144
Surgical1 375 371.22 3 6.78 3782 227 228.35 8 6.65 2353 180 184.43 13 8.57 1934 111 116.38 14 8.62 1255 89 82.29 3 9.71 926 70 69.34 24 24.67 94H-L χ2 = 12.694, df = 3, P = .005
H-L indicates Hosmer and Lemeshow.
392 J.L. Nates et al.
both validation groups. The AUC for the mSOFA score topredict in-hospital mortality in the medical patients was0.73 (95% CI, 0.67-0.76), and the AUC for surgical patientswas 0.77 (95% CI, 0.73-0.80; see Fig. 1B).
4. Discussion
Our results demonstrate that the mSOFA calculated duringthe first 24 hours of admission to the ICU can predict the riskof dying in cancer patients. We assessed the internal validityof the mSOFA separately in 2 groups of patients with cancer,surgical and medical, and found that the assessmentperformed slightly better in predicting ICU than in-hospitalmortality. In addition, we demonstrated the feasibility of
calculating the score electronically by using clinical infor-mation extracted from the electronic medical record.
These results indicate that the severity of illness of patientscan be estimated from incomplete records. Despite the lack ofall the necessary elements required to perform a similarassessment using other available scoring tools, the mSOFAperformed well. The mean mSOFA score was lower forsurgical patients than for patients receiving other medical care(1.7 vs 4.4). The lower score observed in the surgical groupmay be explained by systematic selection bias among surgicalpatients because of the admission of elective postoperativepatients to the ICU. Surgical procedures tend to be performedmore commonly in patients who have solid tumors, less-advanced stages of cancer, or fewer comorbidities, leading toless severe or fewer organ dysfunctions being observed whensurgical patients arrive in the ICU as compared with thedysfunctions observed in the medical patients.
Other researchers who have used a modified SOFA toevaluate critically ill patients have reported findings verysimilar to ours. Junger et al [5] reported an AUC of an ROCof 0.80 (95% CI, 0.74-0.86) in evaluating the performance ofa mSOFA score calculated during surgical patients' first dayin the ICU. We calculated an AUC of 0.82 (95% CI, 0.73-0.91) for surgical patients. However, although the ROCswere similar in both studies, the mean scores reported byJunger et al for patients who died and did not die in the ICUwere different from and not comparable with our results.Junger et al reported a mean score of 4.5 for patients who did
393Cross-validation of a modified score for cancer patients
not die in the ICU and 7.6 for those who died in the ICU; ourstudy showed a mean score of 1.7 for those who did not die inthe ICU and 4.6 for those who died in the ICU. The differencecould be explained by the approach used to modify the score.Junger et al customized the original SOFA by modifying theneurologic component, whereas our version excluded theneurologic component. As a result, the range of possiblescores in the Junger et al study was 0 to 23, whereas the rangeof possible scores in our study was 0 to 20.
In contrast to ours and other modified versions of theSOFA score, a few studies have attempted to describe theclassical SOFA version performance in hematologicpatients. In 2005, Cornet et al [8] studied the SOFA andthe Simplified Acute Physiology Score (SAPS) II in a groupof 58 patients with hematologic malignancies needingintensive care. They found an AUC of 0.77 (95% CI,0.65-.90) for the SOFA and 0.70 (95% CI, 0.56-.84) for theSAPS II in the first 24 hours. In 2006, Lamia et al [9]studied the performance of the SOFA score, the SAPS II, theOrgan Dysfunction and/or Infection, and the Logistic OrganDysfunction System in a group of 92 patients withoncohematologic malignancies as well. The authors foundan AUC of 0.78 for the SOFA, SAPS II, and the OrganDysfunction and/or Infection; the Logistic Organ Dysfunc-tion System had an AUC of 0.83. In 2008, Neumann et al[10] studied a population of 64 patients following bloodstem-cell transplantation. In this study, the authors did notdescribe the AUC analysis but conclude, as in previousworks, that the SOFA score is helpful in predictingoutcomes in this population. None of the above studiesdemonstrated a performance superior to the performancedescribed in this study.
Despite of the several limitations of this study, includingthe assumption of clinical normal values of the missing dataand limited external validity, there is attenuating evidencesupportive of the good performance of the mSOFA. Theassumption of normalcy of missing data could have led us tounderestimate the risk of death in patients whose organfailure was not assessed until it was more evident andtherefore more advanced. The lack of the neurologiccomponent because of the lack of the GCS in the medicalrecords is the best example. However, many cancer patientsare already partially sedated upon their admission to the ICUas a result of prior surgery or mechanical ventilationfollowing acute respiratory failure. The effect of sedationon those patients' central nervous system function can beinaccurately interpreted by the medical personnel calculatingthe GCS and consequently affect the calculation of theconventional SOFA's neurologic component values [5]. Thelatter could be playing a role of systematic bias leading to anoverestimate of the risk of dying in this group of patients.Recently, Namendys-Silva et al [11] demonstrated thatalthough the SOFA score performs well in cancer patients,the neurologic component of the score was the only organdysfunction that did not correlate with mortality. In studyinga group of 200 patients with cancer admitted to the ICU, they
found that the SOFA score had an AUC of 0.87 (95% CI,0.81-.93); when evaluating each component of the scoreseparately, they observed that all organ dysfunctioncomponents were significantly associated with mortality,except for the assessment of neurologic dysfunction (P =.37). Their finding supports the contention that theneurologic assessment is systematically biased [7,12].
By splitting our data, we artificially simulated a situationof generalizing our results to other groups of patients [13].Our large sample size was appropriate to implement this typeof analysis and diminished the amount of information lost bydividing the sample [13]. Nevertheless, and despite the size,our results cannot be generalized to other settings becauseour sample came from a single institution. In addition, oursampling technique of separating medical and surgicalgroups would be difficult to replicate prospectively because,due to the retrospective design of our study, we learned sincethe beginning of the study about the final allocation ofpatients into medical or surgical groups. This uniquesituation restricts the use of the mSOFA score as a tool foradjusting for severity of disease to retrospective studies. Ourobservation of smaller totals of partitions in the Hosmer-Lemeshow goodness-of-fit tests for the surgical groups mayhave been the result of the large sample sizes and the lownumber of events (deaths) observed in these groups.
Although the external validity of our mSOFA shouldbe tested next in other critical care settings, in a recentcomparison of 6 severity of illness scores in cancerpatients admitted to ICU, Soares et al [14] were not ableto demonstrate a better performance than we describedwith the mSOFA in our study. They found an AUC of0.72 for MPM II (Mortality Probability Model II), 0.75for APACHE II (Acute Physiology and Chronic HealthEvaluation II), 0.79 for Cancer Mortality Model, 0.81 forAPACHE III, and 0.81 for SAPS.
5. Conclusions
The risk of mortality among cancer patients admitted tothe ICU can be assessed retrospectively by calculating theirseverity of illness with a score that excludes neurologic organdysfunction. An mSOFA score with the neurologic compo-nent omitted and the cardiovascular component customizedshowed good performance in groups of surgical and medicalcancer patients admitted to the ICU. The mSOFA is a validand valuable tool to retrospectively assess the risk ofmortality in this cancer population. The automation of theassessment as demonstrated in our validation study is anapproach that reduces resource utilization by eliminatingendless expensive data collection and reducing human errorwhile gathering the information.
Acknowledgments
The authors wish to thank Andrew Shaw and Joshua A.Samuels for their contribution to our preliminary work
394 J.L. Nates et al.
modifying the SOFA score [7] and to John C. LeBas III forhis help in reviewing this manuscript.
References
[1] Halpern NA. Can the costs of critical care be controlled? Curr OpinCrit Care 2009;15:591-6.
[2] Vincent JL, Moreno R, Takala J, et al. The SOFA (Sepsis-relatedOrgan Failure Assessment) score to describe organ dysfunction/failure.On behalf of the Working Group on Sepsis-Related Problems of theEuropean Society of Intensive Care Medicine. Intensive Care Med1996;22:707-10.
[3] Peres Bota D, Melot C, Lopes Ferreira F, et al. The Multiple OrganDysfunction Score (MODS) versus the Sequential Organ FailureAssessment (SOFA) score in outcome prediction. Intensive Care Med2002;28:1619-24.
[4] Shime N, Kageyama K, Ashida H, et al. Application of modifiedSequential Organ Failure Assessment score in children after cardiacsurgery. J Cardiothorac Vasc Anesth 2001;15:463-8.
[5] Junger A, Engel J, Benson M, et al. Discriminative power on mortalityof a modified Sequential Organ Failure Assessment score for completeautomatic computation in an operative intensive care unit. Crit CareMed 2002;30:338-42.
[6] Zygun DA, Doig CJ, Gupta AK, et al. Non-neurological organdysfunction in neurocritical care. J Crit Care 2003;18:238-44.
[7] Nates JL, Cardenas-Turanzas M, Wakefield C, et al. Automating andsimplifying the SOFA score in critically ill patients with cancer. HealthInformatics J 2010;16:35-47.
[8] Cornet AD, Issa AI, van de Loosdrecht AA, et al. Sequential organfailure predicts mortality of patients with a haematological malignancyneeding intensive care. Eur J Haematol 2005;74:511-6.
[9] Lamia B, Hellot MF, Girault C, et al. Changes in severity and organfailure scores as prognostic factors in onco-hematological malignancypatients admitted to the ICU. Intensive Care Med 2006;32:1560-8.
[10] Neumann F, Lobitz O, Fenk R, et al. The sepsis-related Organ FailureAssessment (SOFA) score is predictive for survival of patientsadmitted to the intensive care unit following allogeneic blood stemcell transplantation. Ann Hematol 2008;87:299-304.
[11] Namendys-Silva SA, Texcocano-Becerra J, Herrera-Gomez A.Application of the Sequential Organ Failure Assessment (SOFA)score to patients with cancer admitted to the intensive care unit. Am JHosp Palliat Care 2009;26:341-6.
[12] Graciano AL, Balko JA, Rahn DS, et al. The Pediatric Multiple OrganDysfunction Score (P-MODS): development and validation of anobjective scale to measure the severity of multiple organ dysfunction incritically ill children. Crit Care Med 2005;33:1484-91.
[13] Picard R, Cook R. Cross-validation of regression models. J Am StatAssoc 1984;79:575-83.
[14] Soares M, Fontes F, Dantas J, et al. Performance of six severity-of-illness scores in cancer patients requiring admission to the intensivecare unit: a prospective observational study. Crit Care 2004;8:R194-203.