Embed Size (px)
Citation preview
Crossed source–detector geometry for a novel spraydiagnostic: Monte Carlo simulation and analytical results
Edouard Berrocal, Dmitry Y. Churmakov, Vadim P. Romanov,Mark C. Jermy, and Igor V. Meglinski
Sprays and other industrially relevant turbid media can be quantitatively characterized by light scat-tering. However, current optical diagnostic techniques generate errors in the intermediate scatteringregime where the average number of light scattering is too great for the single scattering to be assumed,but too few for the diffusion approximation to be applied. Within this transitional single-to-multiplescattering regime, we consider a novel crossed source–detector geometry that allows the intensity ofsingle scattering to be measured separately from the higher scattering orders. We verify Monte Carlocalculations that include the imperfections of the experiment against analytical results. We show quan-titatively the influence of the detector numerical aperture and the angle between the source and thedetector on the relative intensity of the scattering orders in the intermediate single-to-multiple scatteringregime. Monte Carlo and analytical calculations of double light-scattering intensity are made with smallparticles that exhibit isotropic scattering. The agreement between Monte Carlo and analytical techniquesvalidates use of the Monte Carlo approach in the intermediate scattering regime. Monte Carlo calcula-tions are then performed for typical parameters of sprays and aerosols with anisotropic (Mie) scatteringin the intermediate single-to-multiple scattering regime. © 2005 Optical Society of America
OCIS codes: 010.1110, 080.2710, 120.1740, 290.4210, 290.7050.
1. Introduction
The scattering of light by disperse randomly inho-mogeneous scattering media is important in manyapplications including optical diagnostics in mete-orology, powder industries and sprays for combus-tors, firefighting, drug delivery, and biomedicine. Inall these applications, knowledge and measure-ments of optical parameters of disperse medium arerequired. Typical parameters measured are themean free transport path length, shape and size ofthe scattering particles, and their concentrationwithin the medium. If the scattering power of themedium is low (mean number of scattering events is�3), these parameters can be recovered from the in-tensity of single-scattered radiation by assuming thatonly single scattering takes place.1–3 However, if the
medium is turbid (mean number of scattering eventsis �3–6), the intensity due to high orders of scatter-ing dominates that due to single scattering at thedetector, and the single-scattering assumption be-comes invalid. Nevertheless, the average parametersof such a medium can be obtained by the diffusionapproximation.4,5
Greater complications arise in the intermediatecase (mean number of scattering events is �3–6),where the average number of scattering events is toohigh for single scattering to be assumed, but too lowfor the diffusion approximation to be applied. Thissituation is typical for many practical applications,including industrial sprays. It should be pointed out,however, that, in the field of sprays and aerosols,most currently available optical diagnostic instru-ments are designed to operate in media of low scat-tering power with the single-scattering assumption.The development of instruments operating in the in-termediate scattering regime is required. The inter-mediate scattering regime is encountered whenmeasurements are made near the nozzle (as requiredfor boundary-condition data for computational fluiddynamics calculations of spray systems or to validateliquid breakup models) or when the path length of thelight in the spray is long (as in the case of high-flow-rate mixing systems such as fuel atomizers for large
E. Berrocal ([email protected]), D. Y. Churmakov,M. C. Jermy, and I. V. Meglinski are with the School of Engineer-ing, Cranfield University, Cranfield MK43 0AL, UK. V. P. Ro-manov is with the Department of Physics, St. Petersburg StateUniversity, Petrodvoretz 198504, Russia.
Received 12 February 2004; revised manuscript received 15 July2004; accepted 9 November 2004.
0003-6935/05/132519-11$15.00/0© 2005 Optical Society of America
1 May 2005 � Vol. 44, No. 13 � APPLIED OPTICS 2519
combustors). To develop such instruments and tocharacterize their accuracy, an estimation of themain scattering orders is required. It is necessary tohave a computing photon-tracking technique vali-dated in this intermediate regime.
For dilute intermediate scattering media the pa-rameters of scattering particles can be obtained fromthe angular dependence of the scattered light inten-sity, from attenuation of light due scattering and ab-sorption, or by interference and diffraction effects.Attenuation methods can be applied not only to smallparticles but also to large particles, i.e., with diame-ters greater than the incident laser beam diameter.6,7
The principal advantages of diffraction methods aretheir good repeatability and the detailed informationthey give on the particle size distribution.8,9 For an-gular dependence methods, one of the most efficientapproaches is multiwavelength measurement.10–12
More recently, polarization methods have becomecommon.13 In addition there are methods based onthe comparative analysis of both elastic scatteringand fluorescence arising from fluorescent dyes mixedinto the particles.14
The transport of light in such turbid media can bepredicted by the solution of the radiation transportequation coupled with an appropriate scattering the-ory, e.g., Mie1 or Rayleigh–Gans scattering.2 How-ever, because of the complex geometries and range ofparticle sizes encountered in practical applications, itis rarely possible to find an analytical solution. In-stead numerical solutions are used. One of the mostpopular and versatile is the Monte Carlo (MC)approach.15–17 MC photon transport simulation iswell established in biomedical applications,18,19 astro-nomical and meteorological applications,17,20–24 andmore recently in industrial sprays.25–27 Recently,with a combination of the stochastic MC techniqueand an iterative solution of the Bethe–Salpeter equa-tion, it has been shown that the simulation of theoptical path of a photon packet undergoing an nthscattering event directly corresponds to the nth-orderladder diagram contribution.28,29 MC simulationsusually describe only the trajectory of the scatteredradiation, but polarization changes inside and out-side of the medium can also be taken into accountbased on the Stokes–Muller formalism,30–32 theJones formalism,33 and the Rayleigh–Debye scatter-ing theory.34–36
The MC simulation allows for the quantification ofthe effect of differences between ideal theoretical ge-ometries and experiments with their imperfections(e.g., imperfectly monodisperse particles, divergenceof a laser beam, finite apertures). It is important,however, to verify the operation of any simulationcode by comparison with theory and experimentalresults. In this paper we compare analytical calcula-tions of scalar intensity for the double light scatteringwith the results of MC simulation. The comparisonserves two purposes. First, it verifies the MC codeagainst the analytical solution. Second, it allows theanalytical solution to be tested by indirect compari-son with (imperfect) the experimental results
through the MC results. Similar MC and analyticalcomparisons have been carried out for detection ge-ometries other than the one presented here to sup-port the MC investigation of meteorological37
colloidal suspension38 and biomedical39 problems.This paper is organized as follows. In Section 2 thetheoretical aspects of the scattering problem are ex-plained, and general analytical formulas for the in-tensity of different scattering orders are derived. Thedesign of the MC code and descriptions of the simu-lation are considered in Section 3. The results anddiscussions are presented in Section 4, and some re-marks and conclusions are given in Section 5. Appen-dix A is a list of the nomenclature used in the paper.
2. Analytical Description of Low Scattering Orders
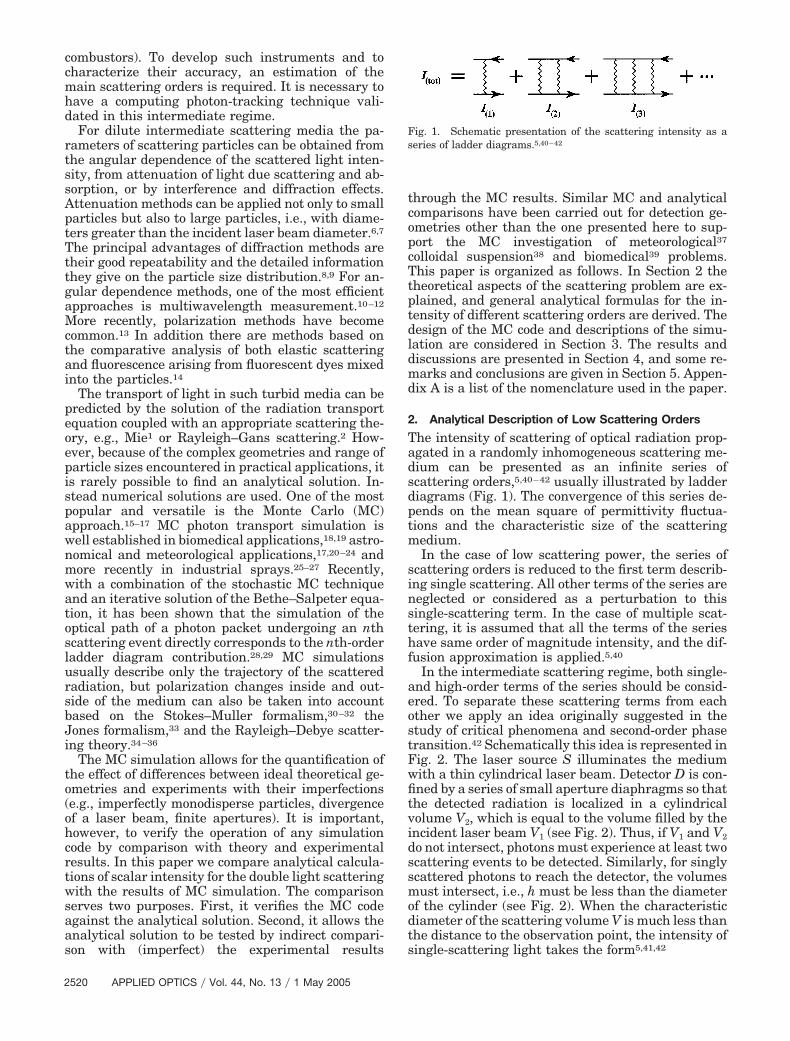
The intensity of scattering of optical radiation prop-agated in a randomly inhomogeneous scattering me-dium can be presented as an infinite series ofscattering orders,5,40–42 usually illustrated by ladderdiagrams (Fig. 1). The convergence of this series de-pends on the mean square of permittivity fluctua-tions and the characteristic size of the scatteringmedium.
In the case of low scattering power, the series ofscattering orders is reduced to the first term describ-ing single scattering. All other terms of the series areneglected or considered as a perturbation to thissingle-scattering term. In the case of multiple scat-tering, it is assumed that all the terms of the serieshave same order of magnitude intensity, and the dif-fusion approximation is applied.5,40
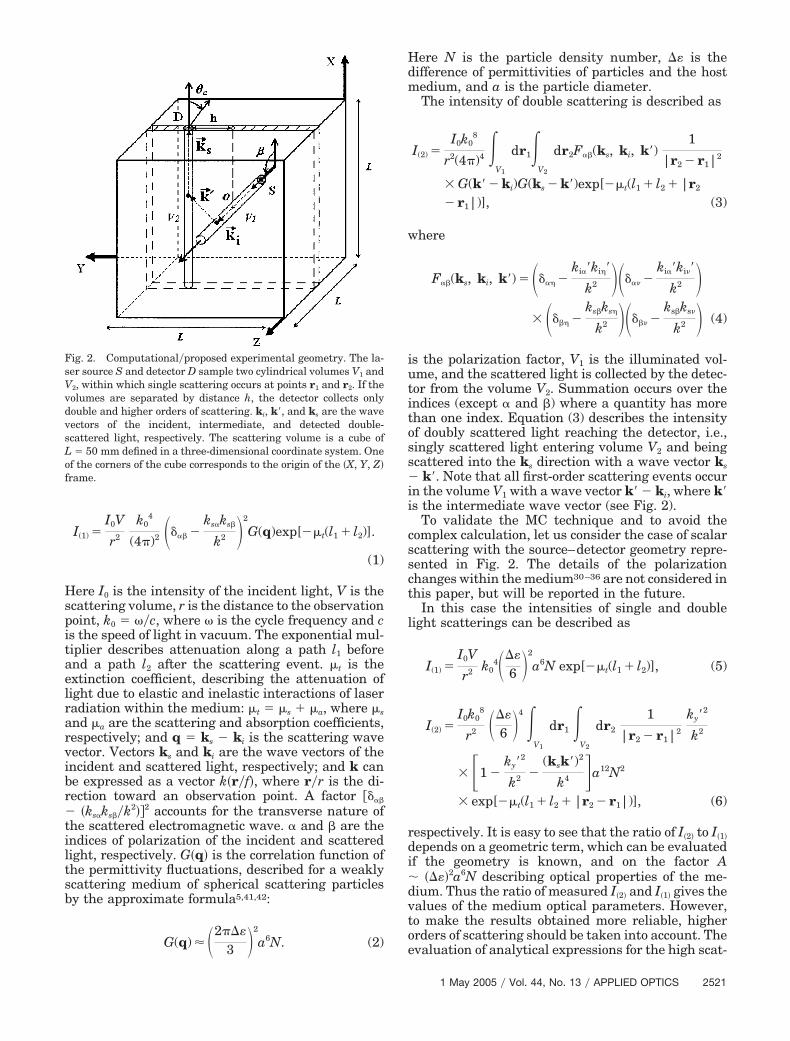
In the intermediate scattering regime, both single-and high-order terms of the series should be consid-ered. To separate these scattering terms from eachother we apply an idea originally suggested in thestudy of critical phenomena and second-order phasetransition.42 Schematically this idea is represented inFig. 2. The laser source S illuminates the mediumwith a thin cylindrical laser beam. Detector D is con-fined by a series of small aperture diaphragms so thatthe detected radiation is localized in a cylindricalvolume V2, which is equal to the volume filled by theincident laser beam V1 (see Fig. 2). Thus, if V1 and V2do not intersect, photons must experience at least twoscattering events to be detected. Similarly, for singlyscattered photons to reach the detector, the volumesmust intersect, i.e., h must be less than the diameterof the cylinder (see Fig. 2). When the characteristicdiameter of the scattering volume V is much less thanthe distance to the observation point, the intensity ofsingle-scattering light takes the form5,41,42
Fig. 1. Schematic presentation of the scattering intensity as aseries of ladder diagrams.5,40–42
2520 APPLIED OPTICS � Vol. 44, No. 13 � 1 May 2005
I(1) �I0V
r2
k04
(4�)2 ���� �ks�ks�
k2 �2
G(q)exp[�t(l1 l2)].
(1)
Here I0 is the intensity of the incident light, V is thescattering volume, r is the distance to the observationpoint, k0 � ��c, where � is the cycle frequency and cis the speed of light in vacuum. The exponential mul-tiplier describes attenuation along a path l1 beforeand a path l2 after the scattering event. t is theextinction coefficient, describing the attenuation oflight due to elastic and inelastic interactions of laserradiation within the medium: t � s a, where s
and a are the scattering and absorption coefficients,respectively; and q � ks � ki is the scattering wavevector. Vectors ks and ki are the wave vectors of theincident and scattered light, respectively; and k canbe expressed as a vector k�r�f�, where r�r is the di-rection toward an observation point. A factor ����
� �ks�ks��k2��2 accounts for the transverse nature ofthe scattered electromagnetic wave. � and � are theindices of polarization of the incident and scatteredlight, respectively. G�q� is the correlation function ofthe permittivity fluctuations, described for a weaklyscattering medium of spherical scattering particlesby the approximate formula5,41,42:
G(q) �2��
3 �2
a6N. (2)
Here N is the particle density number, � is thedifference of permittivities of particles and the hostmedium, and a is the particle diameter.
The intensity of double scattering is described as
I(2) �I0k0
8
r2(4�)4 V1
dr1V2
dr2F��(ks, ki, k�)1
|r2 � r1|2
� G(k� � ki)G(ks � k�)exp[�t(l1 l2 |r2
� r1|)], (3)
where
F��(ks, ki, k�) � ���� �ki��ki��
k2 ����� �ki��ki��
k2 �� ���� �
ks�ks�
k2 ����� �ks�ks�
k2 � (4)
is the polarization factor, V1 is the illuminated vol-ume, and the scattered light is collected by the detec-tor from the volume V2. Summation occurs over theindices (except � and �) where a quantity has morethan one index. Equation (3) describes the intensityof doubly scattered light reaching the detector, i.e.,singly scattered light entering volume V2 and beingscattered into the ks direction with a wave vector ks
� k�. Note that all first-order scattering events occurin the volume V1 with a wave vector k� � ki, where k�is the intermediate wave vector (see Fig. 2).
To validate the MC technique and to avoid thecomplex calculation, let us consider the case of scalarscattering with the source–detector geometry repre-sented in Fig. 2. The details of the polarizationchanges within the medium30–36 are not considered inthis paper, but will be reported in the future.
In this case the intensities of single and doublelight scatterings can be described as
I(1) �I0V
r2 k04��
6 �2
a6N exp[�t(l1 l2)], (5)
I(2) �I0k0
8
r2 ��
6 �4 V1
dr1 V2
dr2
1
|r2 � r1|2
ky�2
k2
� �1 �ky�
2
k2 �(ksk�)2
k4 �a12N2
� exp[�t(l1 l2 |r2 � r1|)], (6)
respectively. It is easy to see that the ratio of I�2� to I�1�depends on a geometric term, which can be evaluatedif the geometry is known, and on the factor A� �� �2a6N describing optical properties of the me-dium. Thus the ratio of measured I�2� and I�1� gives thevalues of the medium optical parameters. However,to make the results obtained more reliable, higherorders of scattering should be taken into account. Theevaluation of analytical expressions for the high scat-
Fig. 2. Computational�proposed experimental geometry. The la-ser source S and detector D sample two cylindrical volumes V1 andV2, within which single scattering occurs at points r1 and r2. If thevolumes are separated by distance h, the detector collects onlydouble and higher orders of scattering. ki, k�, and ks are the wavevectors of the incident, intermediate, and detected double-scattered light, respectively. The scattering volume is a cube ofL � 50 mm defined in a three-dimensional coordinate system. Oneof the corners of the cube corresponds to the origin of the �X, Y, Z�frame.
1 May 2005 � Vol. 44, No. 13 � APPLIED OPTICS 2521
tering orders I�3�, I�4�, I�5�, and so on is an extraordinarycomplex mathematical problem requiring the calcu-lation of multifold integrals. The double-scatteringintensity calculation needs cumbersome computationof the sixfold integral [Eq. (7)], whereas I�3� requirescalculation of the ninefold integral, I�4� of the 12-foldintegral, and so on.
I(2) � A �L1�2
L1�2
dl1 �L2�2
L2�2
dl2 0
R1
r1dr10
R2
r2dr2
� 0
2�
d�1 0
2�
d�2
1
|r2 � r1|2
� exp[�t(l1 l2 |r2 � r1|)], (7)
where L1, L2 are the lengths and R1, R2 are the radiiof the V1 and V2 cylinders directed along the axes Zand X, respectively (see Fig. 2).
To avoid this complex calculation, the numericalMC technique is applied to calculate the higher-orderscattering terms.
3. Monte Carlo Simulation
The exact implementation of the MC technique forcalculation of scattering light intensity in an inhomo-geneous scattering medium depends on theapplication.18–30 The MC scheme presented here issuitable for the geometry described in Fig. 2 andpossesses the following characteristics. The scatter-ing medium is defined by a cube of L � L1 � L2� 50 mm in a three-dimensional coordinate system.The medium is assumed nonabsorbing �a � 0� andhomogeneous. The source S is defined by a cylindricallaser beam 1 mm in diameter (i.e., R1 � R2� 0.5 mm), which enters through a face of the sam-pling cube with an angle � corresponding to thesource–detector angle. This angle � ranges between0° (forward-scattering detection) and 180° (backscat-tering detection) so that the laser beam alwayspasses through the central point O of the cube, illu-minating a cylindrical volume V1 through the scat-tering medium (Fig. 2). The detector D is representedby an aperture 1 mm in diameter located on the topface of the cube and positioned at different distancesh from the central vertical axis of the cube. The scat-tering coefficient s ranges between 0.04 and0.18 mm�1. This range allows the transition from sin-gle to multiple scattering to be investigated in thegiven geometry.
MC modeling of the photon trajectories within themedium consists of the following steps. The pathlength of a photon packet between two scatteringevents is given by15
li �ln(�)
s, (8)
where � is a random number uniformly distributedbetween 0 and 1. To specify the position of a photon
and its direction of propagation, the absolute andlocal coordinate systems are used. After scattering,the new direction is specified by the polar and azi-muth angles, i.e., by �s and �, respectively.
The directions of the photon packet propagationbefore and after each scattering event are defined byunit vectors ui and us, with ui and us being collinearto vectors ki and ks, respectively. The following trans-formation relates them:
�usx
usy
usz��
1
(1 � uiz2)1�2 uixuiz �
1
(1 � uiz2)1�2 uiy uix
1
(1 � uiz2)1�2 uiyuiz
1
(1 � uiz2)1�2 uix uiy
�(1 � uiz2)1�2 0 uiz
��sin �s cos �
sin �s sin �
cos �s�. (9)
The direction of the photon packet ui together with itsfree path length li determines the point at which thenext scattering event takes place: ri1 � ri liui. Atthis point a new direction and path length are deter-mined, and the steps described above are repeateduntil the photon exits the scattering medium.
The polar scattering angle is sampled from a scat-tering phase function24:
p(ki, ks) ��(ki, ks)
4�
�(ki, ks)d�s
. (10)
Depending on the purpose of the study, the Mie,1,2,43
Rayleigh–Gans,1,2 or Henyey–Greenstein44 phasefunction is typically used. The change in polar angle�s is determined from its inverse cumulative proba-bility density function (iCPDF),45 �s � CPDF�1���.When the analytical form of the iCPDF is not avail-able, CPDF is stored in a look-up table45,46 and theinverse transformation is performed at each scatter-ing event.
The first step is to validate the MC techniqueagainst analytical results. To do this we consider iso-tropic scattering. It is possible to obtain the corre-sponding analytical results when the scattering isisotropic. Also, the number of parameters to be con-sidered is reduced. In this case CPDF��s� is obtainedfrom cos ��s� � �2� � 1�, and CPDF��� is obtainedfrom � � 2��.
In the second step, MC simulations were performedwith two different anisotropic phase functions, based,respectively, on spherical droplets of 1 and 15 m indiameter. These phase functions were deduced fromMie-scattering theory, considering a realistic spraydiagnostic problem. The source wavelength � is532 nm, the refractive index of the droplet is 1.4
2522 APPLIED OPTICS � Vol. 44, No. 13 � 1 May 2005
0.0i, and the refractive index of the surroundingmedium is 1 0.0i. The corresponding factor of an-isotropy g equals 0.782 for the 1-m sphere and 0.818for the 15-m sphere. This represents a spray of hy-drocarbon fuel in air.
Photon packets are assumed to have been detectedif they reach the detector D with an incident angle �s
less than detector acceptance angle �a��s � �a�. Foreach detected photon packet the scattering order andthe distance h from the incident beam are stored inthe data file. The intensity of different scattering or-ders is then determined by the number of photonsrecorded and can be plotted as a function of h.
If the detector acceptance angle is very small ��a
� 2°�, the number of photon packets detected is lowand the data show strong statistical fluctuations. Toobtain less noisy results for the small acceptance an-gle ��a � 0°�, we use a semianalytical MC scheme.20,47
This scheme uses the probability W that the scatteredphoton packet strikes the detector at normal inci-dence:
W � p(kd � k�)d�d exp(�t, d). (11)
Here kd is the vector of normal toward the detector,d�d is the elementary solid angle spanning a linenormal to the detector, and d is the distance betweenthe photon scattering and the detector. p�kd � k�� isthe scattering phase function, constant for isotropicscattering: p�kd � k�� � 1�4�. The intensity of thescattering orders is then obtained by calculation ofthis probability for all the scattering events. Thissignificantly reduces the computational time re-quired for a given noise level (by a factor of �100) andallows accurate comparisons between the MC and theanalytical approaches.
The MC computational time is directly dependanton the optical parameters of the scattering medium,on the geometry of this medium, and on the numberof photons sent. Considering anisotropic scatteringprocess with s � 0.08 mm�1, a typical MC computa-tional time of �8 is required for an amount of 1 billionof photons sent with a P4 2.5-GHz CPU.
4. Results and Discussion
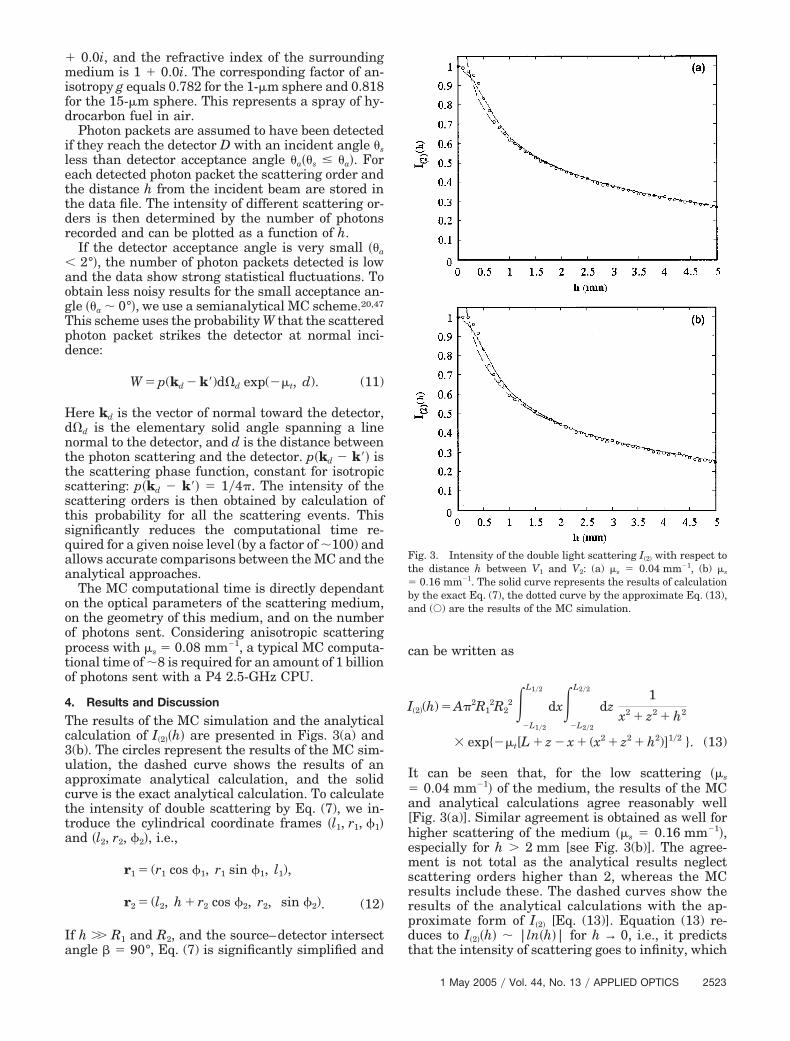
The results of the MC simulation and the analyticalcalculation of I�2��h� are presented in Figs. 3(a) and3(b). The circles represent the results of the MC sim-ulation, the dashed curve shows the results of anapproximate analytical calculation, and the solidcurve is the exact analytical calculation. To calculatethe intensity of double scattering by Eq. (7), we in-troduce the cylindrical coordinate frames �l1, r1, �1�and �l2, r2, �2�, i.e.,
r1 � (r1 cos �1, r1 sin �1, l1),
r2 � (l2, h r2 cos �2, r2, sin �2). (12)
If h �� R1 and R2, and the source–detector intersectangle � � 90°, Eq. (7) is significantly simplified and
can be written as
I(2)(h) � A�2R12R2
2 �L1�2
L1�2
dx�L2�2
L2�2
dz1
x2 z2 h2
� exp{�t[L z � x (x2 z2 h2)]1�2 }. (13)
It can be seen that, for the low scattering �s
� 0.04 mm�1� of the medium, the results of the MCand analytical calculations agree reasonably well[Fig. 3(a)]. Similar agreement is obtained as well forhigher scattering of the medium �s � 0.16 mm�1�,especially for h � 2 mm [see Fig. 3(b)]. The agree-ment is not total as the analytical results neglectscattering orders higher than 2, whereas the MCresults include these. The dashed curves show theresults of the analytical calculations with the ap-proximate form of I�2� [Eq. (13)]. Equation (13) re-duces to I�2��h� � |ln�h�| for h → 0, i.e., it predictsthat the intensity of scattering goes to infinity, which
Fig. 3. Intensity of the double light scattering I�2� with respect tothe distance h between V1 and V2: (a) s � 0.04 mm�1, (b) s
� 0.16 mm�1. The solid curve represents the results of calculationby the exact Eq. (7), the dotted curve by the approximate Eq. (13),and (Œ) are the results of the MC simulation.
1 May 2005 � Vol. 44, No. 13 � APPLIED OPTICS 2523
is unphysical. The discrepancy between the exact Eq.(7) [solid curves in Figs. 3(a) and 3(b)] and the ap-proximate Eq. (13) begins at h � 1.2 mm, which isclose to the diameter of the cylinders.
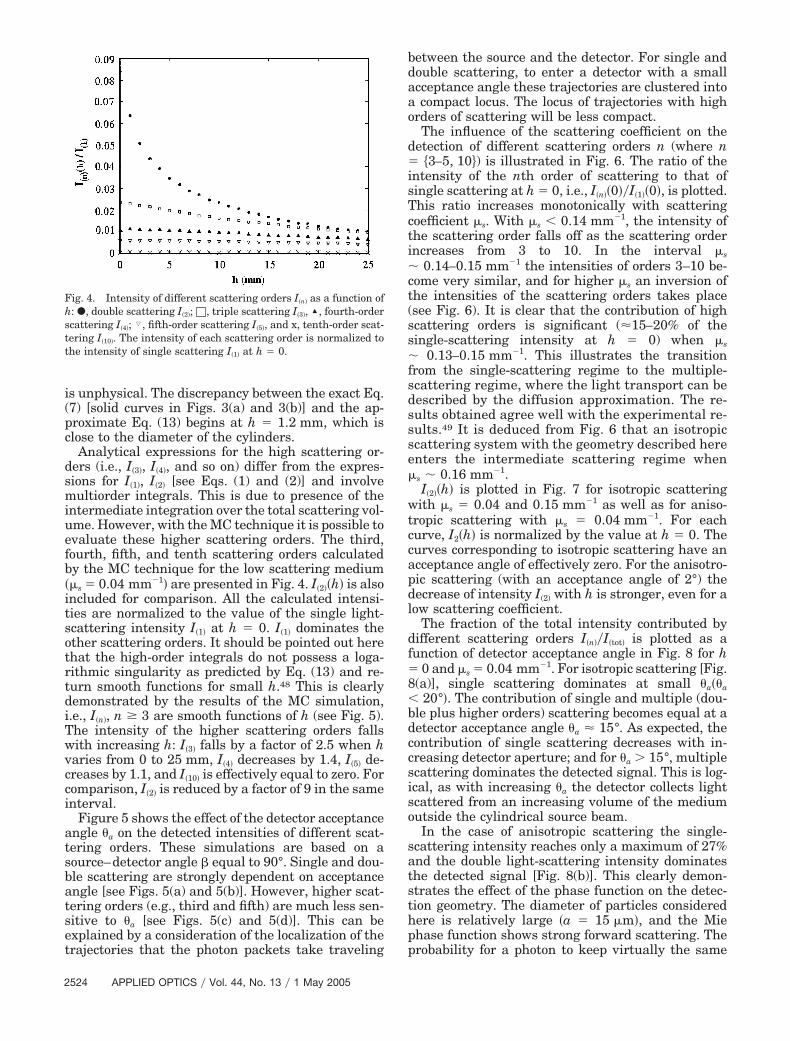
Analytical expressions for the high scattering or-ders (i.e., I�3�, I�4�, and so on) differ from the expres-sions for I�1�, I�2� [see Eqs. (1) and (2)] and involvemultiorder integrals. This is due to presence of theintermediate integration over the total scattering vol-ume. However, with the MC technique it is possible toevaluate these higher scattering orders. The third,fourth, fifth, and tenth scattering orders calculatedby the MC technique for the low scattering medium�s � 0.04 mm�1� are presented in Fig. 4. I�2��h� is alsoincluded for comparison. All the calculated intensi-ties are normalized to the value of the single light-scattering intensity I�1� at h � 0. I�1� dominates theother scattering orders. It should be pointed out herethat the high-order integrals do not possess a loga-rithmic singularity as predicted by Eq. (13) and re-turn smooth functions for small h.48 This is clearlydemonstrated by the results of the MC simulation,i.e., I�n�, n � 3 are smooth functions of h (see Fig. 5).The intensity of the higher scattering orders fallswith increasing h: I�3� falls by a factor of 2.5 when hvaries from 0 to 25 mm, I�4� decreases by 1.4, I�5� de-creases by 1.1, and I�10� is effectively equal to zero. Forcomparison, I�2� is reduced by a factor of 9 in the sameinterval.
Figure 5 shows the effect of the detector acceptanceangle �a on the detected intensities of different scat-tering orders. These simulations are based on asource–detector angle � equal to 90°. Single and dou-ble scattering are strongly dependent on acceptanceangle [see Figs. 5(a) and 5(b)]. However, higher scat-tering orders (e.g., third and fifth) are much less sen-sitive to �a [see Figs. 5(c) and 5(d)]. This can beexplained by a consideration of the localization of thetrajectories that the photon packets take traveling
between the source and the detector. For single anddouble scattering, to enter a detector with a smallacceptance angle these trajectories are clustered intoa compact locus. The locus of trajectories with highorders of scattering will be less compact.
The influence of the scattering coefficient on thedetection of different scattering orders n (where n� 3–5, 10�) is illustrated in Fig. 6. The ratio of theintensity of the nth order of scattering to that ofsingle scattering at h � 0, i.e., I�n��0��I�1��0�, is plotted.This ratio increases monotonically with scatteringcoefficient s. With s � 0.14 mm�1, the intensity ofthe scattering order falls off as the scattering orderincreases from 3 to 10. In the interval s
� 0.14–0.15 mm�1 the intensities of orders 3–10 be-come very similar, and for higher s an inversion ofthe intensities of the scattering orders takes place(see Fig. 6). It is clear that the contribution of highscattering orders is significant (15–20% of thesingle-scattering intensity at h � 0) when s
� 0.13–0.15 mm�1. This illustrates the transitionfrom the single-scattering regime to the multiple-scattering regime, where the light transport can bedescribed by the diffusion approximation. The re-sults obtained agree well with the experimental re-sults.49 It is deduced from Fig. 6 that an isotropicscattering system with the geometry described hereenters the intermediate scattering regime whens � 0.16 mm�1.
I�2��h� is plotted in Fig. 7 for isotropic scatteringwith s � 0.04 and 0.15 mm�1 as well as for aniso-tropic scattering with s � 0.04 mm�1. For eachcurve, I2�h� is normalized by the value at h � 0. Thecurves corresponding to isotropic scattering have anacceptance angle of effectively zero. For the anisotro-pic scattering (with an acceptance angle of 2°) thedecrease of intensity I�2� with h is stronger, even for alow scattering coefficient.
The fraction of the total intensity contributed bydifferent scattering orders I�n��I�tot� is plotted as afunction of detector acceptance angle in Fig. 8 for h� 0 and s � 0.04 mm�1. For isotropic scattering [Fig.8(a)], single scattering dominates at small �a��a
� 20°�. The contribution of single and multiple (dou-ble plus higher orders) scattering becomes equal at adetector acceptance angle �a 15°. As expected, thecontribution of single scattering decreases with in-creasing detector aperture; and for �a � 15°, multiplescattering dominates the detected signal. This is log-ical, as with increasing �a the detector collects lightscattered from an increasing volume of the mediumoutside the cylindrical source beam.
In the case of anisotropic scattering the single-scattering intensity reaches only a maximum of 27%and the double light-scattering intensity dominatesthe detected signal [Fig. 8(b)]. This clearly demon-strates the effect of the phase function on the detec-tion geometry. The diameter of particles consideredhere is relatively large �a � 15 m�, and the Miephase function shows strong forward scattering. Theprobability for a photon to keep virtually the same
Fig. 4. Intensity of different scattering orders I�n� as a function ofh: �, double scattering I�2�; □, triple scattering I�3�, ‘, fourth-orderscattering I�4�; �, fifth-order scattering I�5�, and x, tenth-order scat-tering I�10�. The intensity of each scattering order is normalized tothe intensity of single scattering I�1� at h � 0.
2524 APPLIED OPTICS � Vol. 44, No. 13 � 1 May 2005
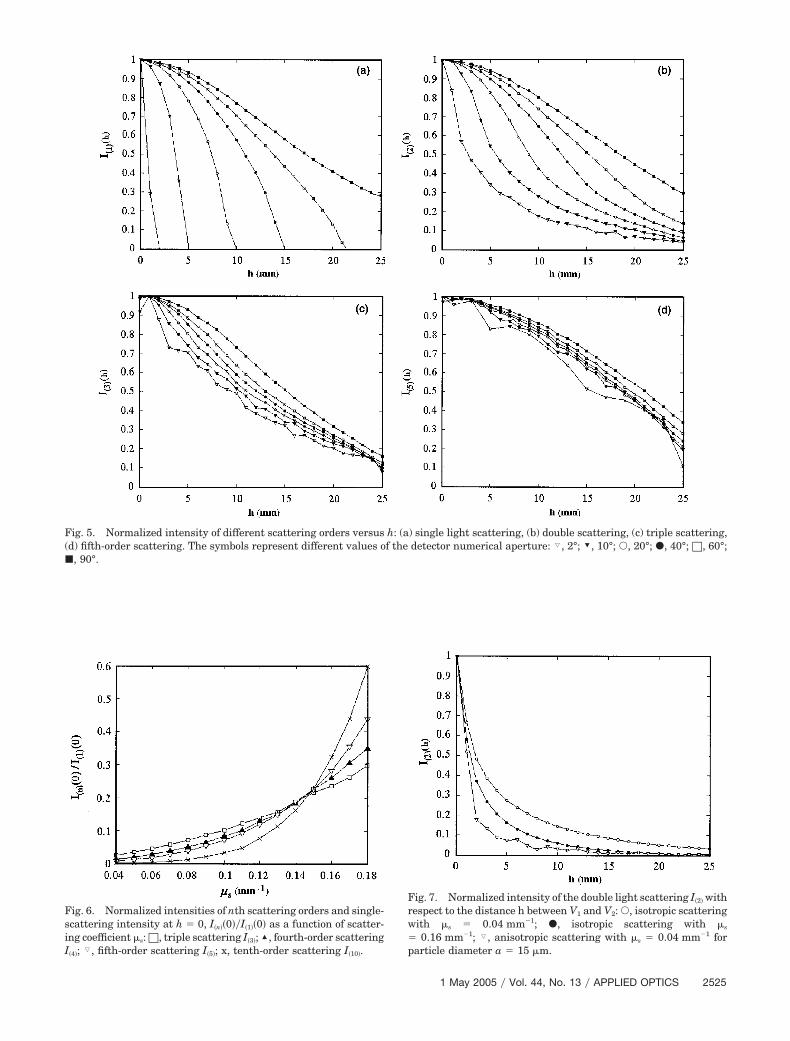
Fig. 6. Normalized intensities of nth scattering orders and single-scattering intensity at h � 0, I�n��0��I�1��0� as a function of scatter-ing coefficient s: □, triple scattering I�3�; ‘, fourth-order scatteringI�4�; �, fifth-order scattering I�5�; x, tenth-order scattering I�10�.
Fig. 7. Normalized intensity of the double light scattering I�2� withrespect to the distance h between V1 and V2: Œ, isotropic scatteringwith s � 0.04 mm�1; �, isotropic scattering with s
� 0.16 mm�1; �, anisotropic scattering with s � 0.04 mm�1 forparticle diameter a � 15 m.
Fig. 5. Normalized intensity of different scattering orders versus h: (a) single light scattering, (b) double scattering, (c) triple scattering,(d) fifth-order scattering. The symbols represent different values of the detector numerical aperture: �, 2°; ’, 10°; Œ, 20°; �, 40°; □, 60°;�, 90°.
1 May 2005 � Vol. 44, No. 13 � APPLIED OPTICS 2525
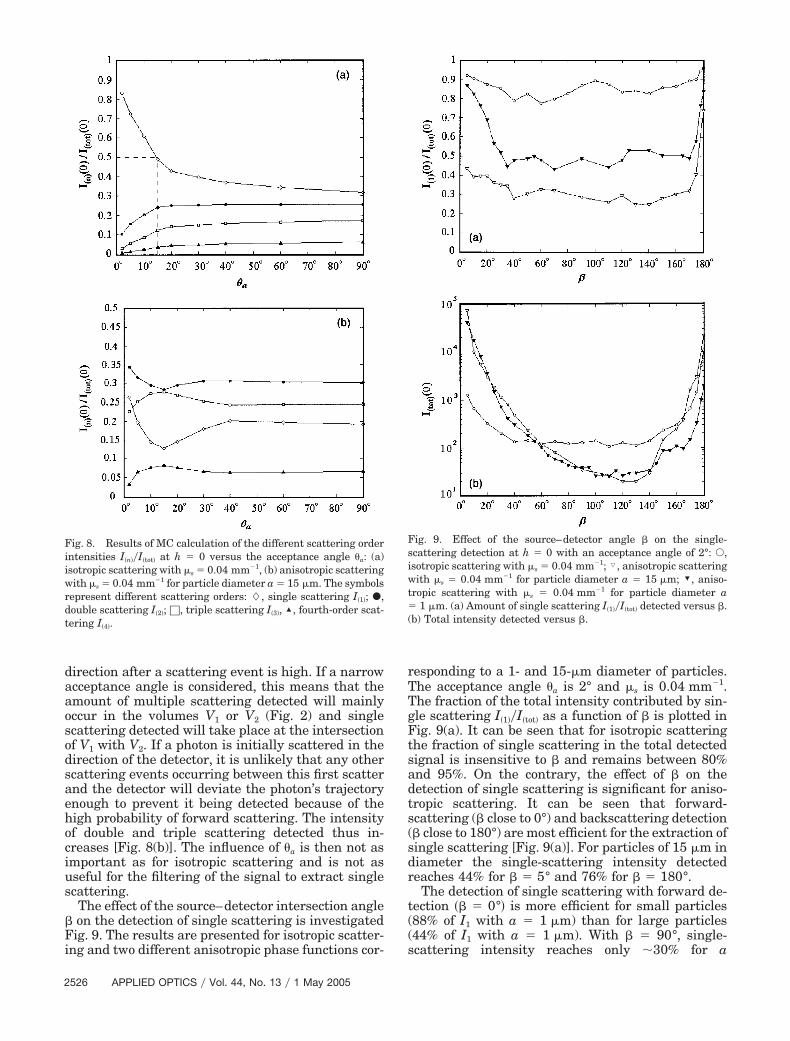
direction after a scattering event is high. If a narrowacceptance angle is considered, this means that theamount of multiple scattering detected will mainlyoccur in the volumes V1 or V2 (Fig. 2) and singlescattering detected will take place at the intersectionof V1 with V2. If a photon is initially scattered in thedirection of the detector, it is unlikely that any otherscattering events occurring between this first scatterand the detector will deviate the photon’s trajectoryenough to prevent it being detected because of thehigh probability of forward scattering. The intensityof double and triple scattering detected thus in-creases [Fig. 8(b)]. The influence of �a is then not asimportant as for isotropic scattering and is not asuseful for the filtering of the signal to extract singlescattering.
The effect of the source–detector intersection angle� on the detection of single scattering is investigatedFig. 9. The results are presented for isotropic scatter-ing and two different anisotropic phase functions cor-
responding to a 1- and 15-m diameter of particles.The acceptance angle �a is 2° and s is 0.04 mm�1.The fraction of the total intensity contributed by sin-gle scattering I�1��I�tot� as a function of � is plotted inFig. 9(a). It can be seen that for isotropic scatteringthe fraction of single scattering in the total detectedsignal is insensitive to � and remains between 80%and 95%. On the contrary, the effect of � on thedetection of single scattering is significant for aniso-tropic scattering. It can be seen that forward-scattering (� close to 0°) and backscattering detection(� close to 180°) are most efficient for the extraction ofsingle scattering [Fig. 9(a)]. For particles of 15 m indiameter the single-scattering intensity detectedreaches 44% for � � 5° and 76% for � � 180°.
The detection of single scattering with forward de-tection �� � 0°� is more efficient for small particles(88% of I1 with a � 1 m) than for large particles(44% of I1 with a � 1 m). With � � 90°, single-scattering intensity reaches only �30% for a
Fig. 8. Results of MC calculation of the different scattering orderintensities I�n��I�tot� at h � 0 versus the acceptance angle �a: (a)isotropic scattering with s � 0.04 mm�1, (b) anisotropic scatteringwith s � 0.04 mm�1 for particle diameter a � 15 m. The symbolsrepresent different scattering orders: �, single scattering I�1�; �,double scattering I�2�; □, triple scattering I�3�, ‘, fourth-order scat-tering I�4�.
Fig. 9. Effect of the source–detector angle � on the single-scattering detection at h � 0 with an acceptance angle of 2°: Œ,isotropic scattering with s � 0.04 mm�1; �, anisotropic scatteringwith s � 0.04 mm�1 for particle diameter a � 15 m; ’, aniso-tropic scattering with s � 0.04 mm�1 for particle diameter a� 1 m. (a) Amount of single scattering I�1��I�tot� detected versus �.(b) Total intensity detected versus �.
2526 APPLIED OPTICS � Vol. 44, No. 13 � 1 May 2005
� 15 m, �50% for a � 1 m, but �85% for isotropicscattering. Perpendicular detection of first scatteringorders seems then more appropriate for scatteringprocesses close to isotropic scattering. However, thebackscattering detection �� � 180°� allows a highamount of single scattering to be detected for isotro-pic and for both anisotropic cases: 84% of I1 with a� 1 m and 74% of I1 with a � 15 m.
Figure 9(b) shows the total intensity detected as afunction of the source–detector angle � for s
� 0.04 mm�1. This total intensity reaches a maxi-mum for the forward detection with both of the aniso-tropic scattering processes considered. However, I�tot�is strong for isotropic scattering at � � 90° as well asat forward scatter and backscatter. Backscatteringintensity is strong for all three scattering processesinvestigated.
Considering Figs. 9(a) and 9(b) together it seemsthat forward-scattering detection allows detection ofboth a high fraction of single scattering and a strongtotal signal. It is possible to detect a signal that isstrongly dominated by single scattering at near-forward and near-backward scatter. If high spatialresolution is desired, care must be taken that � (inthe case of forward scatter) or � close to 180° (in thecase of backscatter) is greater than the acceptanceangle so that the volume in which the detected signalis scattered is kept small. In the case of forwardscattering, keeping � greater than the acceptanceangle avoids the detection of unscattered light.
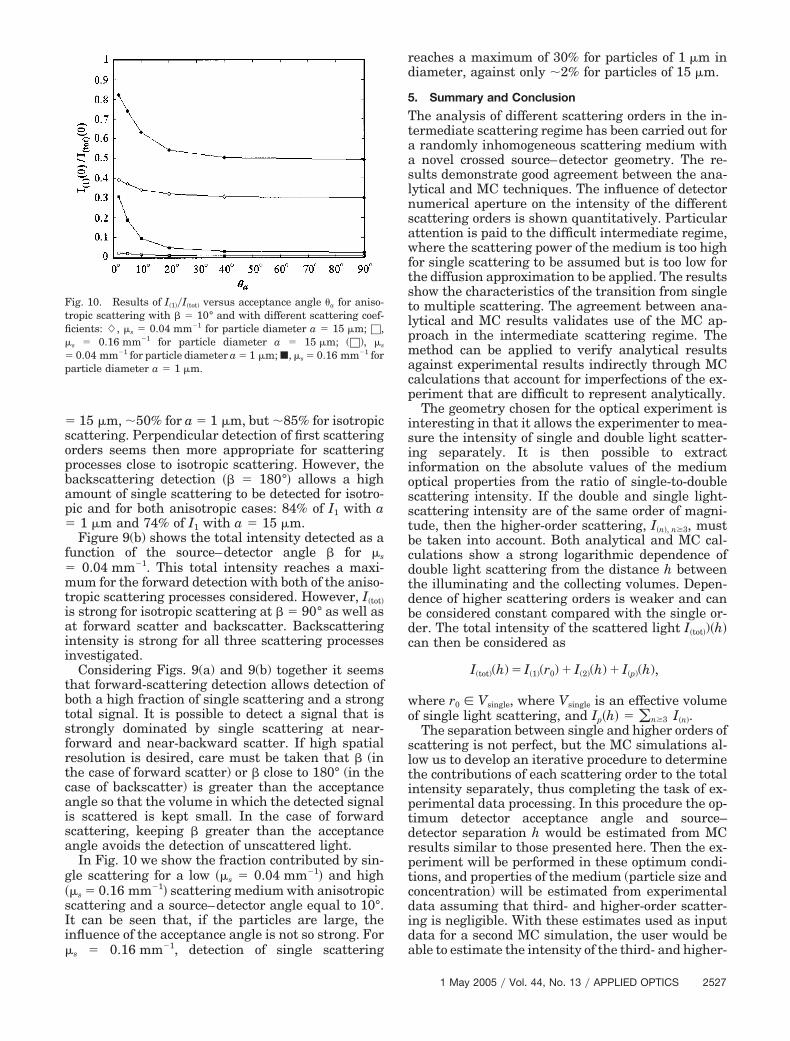
In Fig. 10 we show the fraction contributed by sin-gle scattering for a low �s � 0.04 mm�1� and high�s � 0.16 mm�1� scattering medium with anisotropicscattering and a source–detector angle equal to 10°.It can be seen that, if the particles are large, theinfluence of the acceptance angle is not so strong. Fors � 0.16 mm�1, detection of single scattering
reaches a maximum of 30% for particles of 1 m indiameter, against only �2% for particles of 15 m.
5. Summary and Conclusion
The analysis of different scattering orders in the in-termediate scattering regime has been carried out fora randomly inhomogeneous scattering medium witha novel crossed source–detector geometry. The re-sults demonstrate good agreement between the ana-lytical and MC techniques. The influence of detectornumerical aperture on the intensity of the differentscattering orders is shown quantitatively. Particularattention is paid to the difficult intermediate regime,where the scattering power of the medium is too highfor single scattering to be assumed but is too low forthe diffusion approximation to be applied. The resultsshow the characteristics of the transition from singleto multiple scattering. The agreement between ana-lytical and MC results validates use of the MC ap-proach in the intermediate scattering regime. Themethod can be applied to verify analytical resultsagainst experimental results indirectly through MCcalculations that account for imperfections of the ex-periment that are difficult to represent analytically.
The geometry chosen for the optical experiment isinteresting in that it allows the experimenter to mea-sure the intensity of single and double light scatter-ing separately. It is then possible to extractinformation on the absolute values of the mediumoptical properties from the ratio of single-to-doublescattering intensity. If the double and single light-scattering intensity are of the same order of magni-tude, then the higher-order scattering, I�n�, n�3, mustbe taken into account. Both analytical and MC cal-culations show a strong logarithmic dependence ofdouble light scattering from the distance h betweenthe illuminating and the collecting volumes. Depen-dence of higher scattering orders is weaker and canbe considered constant compared with the single or-der. The total intensity of the scattered light I�tot�)�h�can then be considered as
I(tot)(h) � I(1)(r0) I(2)(h) I(p)(h),
where r0 � Vsingle, where Vsingle is an effective volumeof single light scattering, and Ip�h� � �n�3 I�n�.
The separation between single and higher orders ofscattering is not perfect, but the MC simulations al-low us to develop an iterative procedure to determinethe contributions of each scattering order to the totalintensity separately, thus completing the task of ex-perimental data processing. In this procedure the op-timum detector acceptance angle and source–detector separation h would be estimated from MCresults similar to those presented here. Then the ex-periment will be performed in these optimum condi-tions, and properties of the medium (particle size andconcentration) will be estimated from experimentaldata assuming that third- and higher-order scatter-ing is negligible. With these estimates used as inputdata for a second MC simulation, the user would beable to estimate the intensity of the third- and higher-
Fig. 10. Results of I�1��I�tot� versus acceptance angle �a for aniso-tropic scattering with � � 10° and with different scattering coef-ficients: �, s � 0.04 mm�1 for particle diameter a � 15 m; □,s � 0.16 mm�1 for particle diameter a � 15 m; (□), s
� 0.04 mm�1 for particle diameter a � 1 m; �, s � 0.16 mm�1 forparticle diameter a � 1 m.
1 May 2005 � Vol. 44, No. 13 � APPLIED OPTICS 2527
order scattering parameters, which can be used todetermine an improved estimate of the particle prop-erties. The procedure would be iterated until the es-timated properties converged.
The MC method was successfully applied to calcu-late the intensities of different orders of scattering.These results can be used to infer the optical param-eters of inhomogeneous media with the experimentalgeometry shown in Fig. 2. The proposed experimentalgeometry can be used in a practical experiment tomeasure the particulate scattering field properties.The illumination and detection volumes cannot beideally cylindrical; but with a laser with a high con-focal parameter and a tightly collimated detectorthey can be near cylindrical, and the MC code can beused to quantify the effect of these experimental im-perfections.
Another advantage of the suggested approach isthat both the dependence of the scattered light inten-sity on the distance parameter h and the angularintensity dependence, i.e., the dependence on �a, canbe obtained. In addition, the results validate and sup-port use of the MC method in the intermediate scat-tering regime and provide details of transition fromlow scattering (where the intensity of a scatteringorder drops as the order increases) to multiple scat-tering (where the intensity increases with order).
We have demonstrated the agreement between MCand analytical results in a system of isotropic scat-terers. We then considered anisotropic scatter anddeduced the experimental parameters (detector ac-ceptance angle, source–detector angle and offset)that deliver the optimum discrimination between thefirst and higher scattering orders.
The MC procedure can be readily generalized tocover spatially inhomogeneous media and systemscontaining particles of different sizes (polydispersemedia). As a next step in the current study, we intendto include the polarization in the MC code verifiedhere, apply the code to the estimation and suppres-sion of errors in existing spray diagnostics, and de-velop new optical spray diagnostic techniques.
Appendix A: Nomenclature
1. Symbols
a, particle diameter;c, speed of light in vacuum;h, distance between the hypothetical volumes of
incident and scattered light;G�q�, correlation function of the permittivity fluc-
tuations;h, distance between the hypothetical volumes of
incident and scattered light;ks and ki, wave vectors of the incident and scat-
tered light;k�, intermediate wave vector;kd, vector of normal toward the detector;I�n�, intensity of the nth scattering order;I�tot�, total intensity of the scattered light;li, path length of a photon packet;
l1 and l2, paths before and after the scatteringevent;
L1, L2, lengths of V1 and V2 cylinders;N, particle density number;p�ki, ks�, phase function;g, factor of anisotropy;q, scattering wave vector;R1, R2, radii of V1 and V2 cylinders;ui and us, unit vectors;V1 and V2, cylindrical volumes of incident and scat-
tered laser beams.
2. Greek Symbols
�, source–detector angle;� , difference of permittivities of particles and host
medium;�a, detector acceptance angle;�s, polar angle;�, azimuth angle;�, wavelength of the light source;t, extinction coefficient;s and a, scattering and absorption coefficients;�, cycle frequency;�, random number uniformly distributed between 0
and 1;d�d, the elementary solid angle.
3. Subscripts
� and �, indices of polarization of the incident andscattered light;
i, sequential number of scattering events.
We are grateful to V. L. Kuzmin for valuable com-ments and discussions. This study was partially sup-ported by the Royal Society (project 15298), NATO(project PST.CLG.979652), the Engineering andPhysical Sciences Research Council (UK) (grantGR/R92653), and an Overseas Research Scholarship.
References1. H. C. van de Hulst, Light Scattering by Small Particles (Dover,
New York, 1981).2. C. Bohren and D. Huffman, Absorption and Scattering of Light
by Small Particles (Wiley, New York, 1983).3. A. Ishimaru, Wave Propagation and Scattering in Random
Media (Oxford U. Press, Oxford, UK, 1997).4. B. A. van Tiggelen and S. E. Skipetrov, Wave Scattering in
Complex Media: From Theory to Applications, Vol. 107 ofNATO Science Series: II: Mathematics, Physics and Chemistry(Kluwer Academic, Dordrecht, The Netherlands, 2003).
5. V. L. Kuz’min and V. P. Romanov, “Coherent phenomena inlight scattering from disordered systems,” Usp. Fiz. Nauk 39,231–260 (1996).
6. J. Q. Shen and U. Riebel, “Extinction by a large sphericalparticle located in a narrow Gaussian beam,” Part. Part. Syst.Charact. 18, 254–261 (2001).
7. G. Gouesbet, B. Maheu, and G. Grehan, “Light scattering froma sphere arbitrarily located in a Gaussian beam, using a Brom-wich formulation,” J. Opt. Soc. Am. A 5, 1427–1443 (1988).
8. Z. Ma, H. G. Merkus, H. G. van der Veen, M. Wong, and B.Scarlett, “On-line measurement of particle size and shape us-ing laser diffraction,” Part. Part. Syst. Charact. 18, 243–247(2001).
9. M. Kocifaj and M. Drzik, “Retrieving the size distribution of
2528 APPLIED OPTICS � Vol. 44, No. 13 � 1 May 2005
microparticles by scanning the diffraction halo with a mobilering-gap detector,” J. Aerosol. Sci. 28, 797–804 (1997).
10. M. Kerker and D. D. Cooke, “Remote sensing of particle sizeand refractive index by varying the wavelength,” Appl. Opt.15, 2105–2111 (1976).
11. A. R. Jones, “Scattering of electromagnetic radiation in partic-ulate laden fluids,” Prog. Energy Combust. Sci. 5, 73–96(1979).
12. W. C. Hinds, Aerosol Technology: Properties, Behavior, andMeasurement of Airborne Particles (Wiley, New York, 1982).
13. F. Zhao, Z. Gong, H. Hu, M. Tanaka, and T. Hayasaka, “Si-multaneous determination of the aerosol complex index of re-fraction and size distribution from scattering measurements ofpolarized light,” Appl. Opt. 36, 7992–8001 (1997).
14. M. C. Jermy and D. A. Greenhalgh, “Planar dropsizing byelastic and fluorescence scattering in sprays too dense forphase Doppler measurement,” Appl. Phys. B 71, 703–710(2000).
15. I. M. Sobol’, The Monte Carlo Method (University of Chicago,Chicago, Ill., 1974).
16. G. I. Marchuk, G. A. Mikhailov, M. A. Nazaraliev, R. A.Darbinjan, B. A. Kargin, and B. S. Elepov, The Monte CarloMethod in Atmospheric Optics (Springer, Berlin, 1980).
17. V. P. Kandidov, “Monte Carlo methods in nonlinear statisticaloptics,” Usp. Fiz. Nauk 39, 1243–1272 (1996).
18. S. A. Prahl, M. Keijzer, S. L. Jacques, and A. J. Welch, “AMonte Carlo model of light propagation in tissue,” in Dosime-try of Laser Radiation in Medicine and Biology, G. J. Müllerand D. H. Sliney, eds., Vol. IS5 of the SPIE Institute Series(SPIE, Bellingham, Wash., 1989), pp. 102–111.
19. I. V. Meglinsky and S. J. Matcher, “Modeling the samplingvolume for skin blood oxygenation measurements,” Med. Biol.Eng. Comput. 39, 44–50 (2001).
20. R. R. Meier, J.-S. Lee, and D. E. Anderson, “Atmospheric scat-tering of middle UV radiation from an internal source,” Appl.Opt. 17, 3216–3225 (1978).
21. C. Lavigne, A. Robin, V. Outters, S. Langlois, T. Girasole, andC. Roze, “Comparison of iterative and Monte Carlo methods forcalculation of the aureole about a point source in the Earth’satmosphere,” Appl. Opt. 38, 6237–6246 (1999).
22. E. A. Bucher, “Computer simulation of light pulse propagationfor communication through thick clouds,” Appl. Opt. 12, 2391–2400 (1973).
23. A. I. Carswell, “Laser measurements in clouds,” in Clouds:Their Formation, Optical Properties and Effects, A. Deepakand P. V. Hobbs, eds. (Academic, New York, 1981), pp. 363–406.
24. G. E. Thomas and K. Stamnes, Radiative Transfer in the At-mosphere and Ocean (Cambridge U. Press, Cambridge, UK,1999).
25. M. C. Jermy and A. Allen, “Simulating the effects of multiplescattering on images of dense sprays and particle fields,” Appl.Opt. 41, 4188–4196 (2002).
26. M. C. Jermy, A. Allen, and A. K. Vuorenkoski, “Simulating theeffect of multiple scattering on images of dense sprays,” inOptical and Laser Diagnostics: Proceedings of the First IOPConference Series, C. Arcoumanis and K. T. V. Grattan, eds.(Institute of Physics, Bristol, UK, 2003), Vol. 177, pp. 89–94.
27. E. Berrocal, A. Allen, and M. Jermy, “Monte Carlo simulationof laser imaging diagnostics in polydisperse dense sprays,”http://optics.sgu.ru/SFM/2003/internet/berrocal/index_files/frame.htm.
28. V. L. Kuzmin and I. V. Meglinski, “Coherent multiple scatter-ing effects and Monte Carlo method,” JETP Lett. 79, 109–112(2004).
29. I. V. Meglinski, V. L. Kuzmin, D. Y. Churmakov, and D. A.
Greenhalgh, “Monte Carlo simulation of coherent effects inmultiple scattering,” Proc. R. Soc. London Ser. A 461, 43–53(2005).
30. S. Bartel and A. H. Hielscher, “Monte Carlo simulations of thediffuse backscattering Mueller matrix for highly scatteringmedia,” Appl. Opt. 39, 1580–1588 (2000).
31. X. Wang, L.-H. Wang, C.-W. Sun, and C. C. Yang, “Polarizedlight propagation through the scattering media: time-resolvedMonte Carlo and experiments,” J. Biomed. Opt. 8, 608–617(2003).
32. K. Muinonen, “Coherent backscattering of light by complexrandom media of spherical scatterers: numerical solution,”Waves Random Media 14, 365–388 (2004).
33. S. V. Gangnus, S. J. Matcher, and I. V. Meglinski, “MonteCarlo modeling of polarized light propagation in biological tis-sues,” Laser Phys. 14, 886–891 (2004).
34. T. Iwai, H. Furukawa, and T. Asakura, “Numerical analysis onenhanced backscatterings of light based on Rayleigh-Debyescattering theory,” Opt. Rev. 2, 413–419 (1995).
35. A. S. Martinez and R. Maynard, “Polarization statistics inmultiple scattering of light: a Monte Carlo approach,” in Pho-tonic Band Gaps and Localization, C. M. Souloukis, ed. (Ple-num, New York, 1993), pp. 99–114.
36. V. L. Kuzmin, I. V. Meglinski, and D. Y. Churmakov, “Coher-ent effects under multiple scattering of linearly polarizedlight,” Opt. Spectrosc. 98, 673–679 (2005).
37. H. Ishimoto and K. Masuda, “A Monte Carlo approach for thecalculation of polarized light: application to an incident narrowbeam,” J. Quant. Spectrosc. Radiat. Transfer 72, 467–483(2002).
38. M. J. Rakovic, G. W. Kattawar, M. Mehrübeoglu, B. D. Cam-eron, L. V. Wang, S. Rastegar, and G. L. Coté, “Light back-scattering polarization patterns from turbid media: theory andexperiment,” Appl. Opt. 38, 3399–3408 (1999).
39. X. Wang and L. V. Wang, “Propagation of polarized light inbirefringent turbid media: a Monte Carlo study,” J. Biomed.Opt. 7, 279–290 (2002).
40. S. M. Rytov, Yu. A. Kravtsov, and V. I. Tatarski, Principles ofStatistical Radiophysics (Springer, Berlin, 1987).
41. P. M. Chaikin and T. C. Lubensky, Principles of CondensedMatter Physics (Cambridge U. Press, Cambridge, UK, 1995).
42. V. L. Kuzmin, V. P. Romanov, and L. A. Zubkov, “Propagationand scattering of light in fluctuating media,” Phys. Rep. 248,71–368 (1994).
43. G. Mie, “Considerations on the optic of turbid media, especiallycolloidal metal sols,” Ann. Phys. (Leipzig) 25, 377–442 (1908).
44. L. G. Henyey and J. L. Greenstein, “Diffuse radiation in thegalaxy,” Astrophys. J. 93, 70–83 (1941).
45. J. R. Zijp and J. ten Bosch, “Use of tabulated cumulativedensity functions to generate pseudorandom numbers obeyingspecific distributions for Monte Carlo simulations,” Appl. Opt.33, 533–534 (1994).
46. D. Toublanc, “Henyey–Greenstein and Mie phase functions inMonte Carlo radiative transfer computations,” Appl. Opt. 35,3270–3274 (1996).
47. E. Tilnet, S. Avrillier, and M. Tualle, “Fast semianalyticalMonte Carlo simulation for time-resolved light propagation inturbid media,” J. Opt. Soc. Am. A 13, 1903–1915 (1996).
48. L. V. Adzhemyan, L. Ts. Adzhemyan, L. A. Zubkov, and V. P.Romanov, “Molecular light scattering of varying multiplicity,”Sov. Phys. JEPT 53, 278–281 (1981).
49. K. K. Bizheva, A. M. Siegel, and D. A. Boas, “Path-lengthresolved dynamic light scattering in highly scattering randommedia: the transition to diffusing wave spectroscopy,” Phys.Rev. E 58, 7664–7667 (1998).
1 May 2005 � Vol. 44, No. 13 � APPLIED OPTICS 2529