Embed Size (px)
Citation preview

Crossing insoccer has a
strongnegativeimpact onscoring:
Jan Vecer,FrankfurtSchool of
Finance andManagement
Motivation
The StatisticalModel
Graphs
Conclusions
Crossing in soccer has a strong negative
impact on scoring:
Evidence from the English Premier League and the GermanBundesliga
Jan Vecer, Frankfurt School of Finance and Management
NESSIS 2013, Harvard University
September 21, 2013

Crossing insoccer has a
strongnegativeimpact onscoring:
Jan Vecer,FrankfurtSchool of
Finance andManagement
Motivation
The StatisticalModel
Graphs
Conclusions
Abstract
Crossing in soccer plays a significant role in scoring, about 15% of allgoals scored in the recent seasons of the English Premier League arethe result of open play crosses. However, crossing from an open playis hugely inefficient, only 1 open cross out of 91.92 leads to a goal onaverage. When we estimate the impact of open crossing on scoring ofthe individual teams using multilevel Poisson regression, we concludethat the net effect of crossing is typically negative or neutral at best.An average team can score up to additional 0.656(?) goals per gameif it reduced open crossing. The quality of the team is the majorexplanatory factor on the number of such missed scoringopportunities, stronger teams miss more goal opportunities in generalwhen crossing than weaker teams.

Crossing insoccer has a
strongnegativeimpact onscoring:
Jan Vecer,FrankfurtSchool of
Finance andManagement
Motivation
The StatisticalModel
Graphs
Conclusions
Abstract
Stronger teams have more options how to score and open playcrossing seems as one of the suboptimal ways of a goal creation.Teams such as Arsenal, Chelsea, Liverpool, Manchester City orTottenham have a potential of scoring an extra goal per match ifthey reduced open crossing. A reversed picture is seen in the defenseanalysis, more goal opportunities are missed in general when crossingagainst weak teams than crossing against strong teams. Interestingly,the actual conversion of open crosses to goals plays only a minor rolefor explaining the impact of open crossing on goals.

Crossing insoccer has a
strongnegativeimpact onscoring:
Jan Vecer,FrankfurtSchool of
Finance andManagement
Motivation
The StatisticalModel
Graphs
Conclusions
Original Motivation
The original question leading to this research was if there is any wayto get a better prediction of the outcome of the soccer game fromstatistics obtained during the game. There is a large and liquidin-play betting market on soccer that trades various events:
Win,
Draw,
Loss,
a team in a given game plus additional contracts such as the
Total Number of Goals (including more than N + 0.5 goals),
Exact Score,
Team to Score Next + No Goal.
There is an extensive paid database of the betting quotes fromBetfair.

Crossing insoccer has a
strongnegativeimpact onscoring:
Jan Vecer,FrankfurtSchool of
Finance andManagement
Motivation
The StatisticalModel
Graphs
Conclusions
How to Compute these Odds?
A reasonable approximation of the dynamics of the soccer score is aPoisson process for the goal distribution. The goals scored in theremainder of the game should follow
P(XT − Xt = k) = e−λtλkt
k!
for the home team and
P(YT − Yt = l) = e−µtµlt
l !
Here, the λt and µt play the role of scoring intensities for the twoteams, the expected number of goals to be scored in the remainder ofthe match. Furthermore, if we assume independence of the goalsscored, it is relatively straightforward to obtain all the betting quotesfrom the Poisson model, where parameters λt and µt serve as inputs.

Crossing insoccer has a
strongnegativeimpact onscoring:
Jan Vecer,FrankfurtSchool of
Finance andManagement
Motivation
The StatisticalModel
Graphs
Conclusions
Known Limitations of Poisson Model
The scores are not independent. The correlation of the score inthe English Premier League since 2006 is −0.057. Moreover,the realized fraction of draws is higher than implied from anindependent Poisson model.
There is some memory in goals, but this effect is reasonablysmall. One can fully estimate this effect from betting contractson the Next Goal (which team scores next). The Poisson modelimplies that the quote on the Next Goal should stay the samebefore and after each goal.

Crossing insoccer has a
strongnegativeimpact onscoring:
Jan Vecer,FrankfurtSchool of
Finance andManagement
Motivation
The StatisticalModel
Graphs
Conclusions
Implied Intensities
0 20 40 60 80 100
0.0
0.5
1.0
1.5
Figure: Arsenal-Chelsea 0:0, April 21, 2012

Crossing insoccer has a
strongnegativeimpact onscoring:
Jan Vecer,FrankfurtSchool of
Finance andManagement
Motivation
The StatisticalModel
Graphs
Conclusions
Inference of the Intensities from the Athletic
Performance
Do the scoring intensities depend on some athletic performance data?Source of data:
OPTA (since 2008, 1900+ games)
www.espnfc.com (match reports since 2008)
www.premierleague.com (since 2006, 2700+ games)
www.bundesliga.de (since 2009, 1250+ games, tracking since2011)
What are the significant variables?
Top Speed (Bundesliga)
Discipline + Stoppages
Open Crosses(!)

Crossing insoccer has a
strongnegativeimpact onscoring:
Jan Vecer,FrankfurtSchool of
Finance andManagement
Motivation
The StatisticalModel
Graphs
Conclusions
Some Facts about Crossing
A cross is an airborn delivery of a ball from the side of the field across tothe front of the goal.
An average EPL team makes 18.2 open crosses per game and scores1.33 goals per game, an average Bundesliga team makes 11 opencrosses per game and scores 1.45 goals per game.
In the EPL, 18.2 open crosses produce 3.7 good crosses and 14.5 badcrosses, meaning that the vast majority of open crosses results in aloss of the possession in a favorable position.
A goal is scored per 92 open crosses.
The quality of crossing is highly variable among the teams,Manchester United needs 43.8 crosses to score a goal, Southamptonneeds 143.2 crosses to score a goal.
Stong observational bias on TV highlights that show mostly goodcrosses and crosses leading to goals.
There is an ongoing discussion about effectiveness of open crossingamong football bloggers, but the analysis has been limited only todescriptive statistics.

Crossing insoccer has a
strongnegativeimpact onscoring:
Jan Vecer,FrankfurtSchool of
Finance andManagement
Motivation
The StatisticalModel
Graphs
Conclusions
Football Pitch

Crossing insoccer has a
strongnegativeimpact onscoring:
Jan Vecer,FrankfurtSchool of
Finance andManagement
Motivation
The StatisticalModel
Graphs
Conclusions
Conversion Statistics - Attack
Conversion
MiddlesbroughBirmingham City
PortsmouthWigan Athletic
BlackburnSouthampton
Stoke CityWest Ham
WolverhamptonHull CityFulham
West BromwichBolton
QP RangersNewcastle Utd
TottenhamSunderland
Swansea CityReadingEverton
LiverpoolBlackpool
Aston VillaArsenal
Manchester CityBurnley
Norwich CityChelsea
Manchester Utd
0.01 0.02 0.03 0.04
Figure: The fraction of open crosses (blue), final third entries (red)and outside the box shots (green) that results in a goal for individualattacking teams.
Crossing insoccer has a
strongnegativeimpact onscoring:
Jan Vecer,FrankfurtSchool of
Finance andManagement
Motivation
The StatisticalModel
Graphs
Conclusions
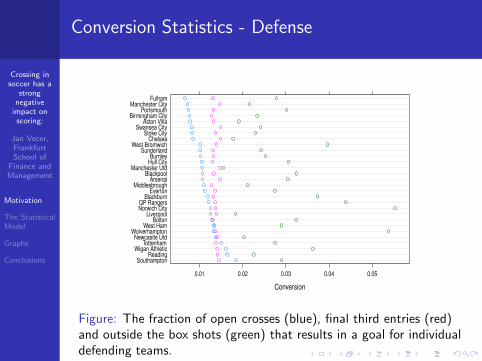
Conversion Statistics - Defense
Conversion
SouthamptonReading
Wigan AthleticTottenham
Newcastle UtdWolverhampton
West HamBolton
LiverpoolNorwich CityQP Rangers
BlackburnEverton
MiddlesbroughArsenal
BlackpoolManchester Utd
Hull CityBurnley
SunderlandWest Bromwich
ChelseaStoke City
Swansea CityAston Villa
Birmingham CityPortsmouth
Manchester CityFulham
0.01 0.02 0.03 0.04 0.05
Figure: The fraction of open crosses (blue), final third entries (red)and outside the box shots (green) that results in a goal for individualdefending teams.

Crossing insoccer has a
strongnegativeimpact onscoring:
Jan Vecer,FrankfurtSchool of
Finance andManagement
Motivation
The StatisticalModel
Graphs
Conclusions
Concerns
Estimation of the impact of crossing on goals should addresses thefollowing issues:
Crosses may lead to goals indirectly in a follow up play.
By crossing the team is giving up an alternative way of playing.
Analysis of Goals regressed on Open Crosses addresses that.

Crossing insoccer has a
strongnegativeimpact onscoring:
Jan Vecer,FrankfurtSchool of
Finance andManagement
Motivation
The StatisticalModel
Graphs
Conclusions
The Statistical Model
Multilevel cross sectional Poisson regression: the teams are groupedaccording to the attack (using variable j [i ]) and the defense (usingvariable k [i ]):
Goalsi ∼ Poisson(
exp(
(βI + uIj[i ] + v Ik[i ])
+ βH· Homei + (βC + uCj[i ] + vC
k[i ]) · Crossi))
(1)
uj ∼ N(0,Σu)
vk ∼ N(0,Σv)

Crossing insoccer has a
strongnegativeimpact onscoring:
Jan Vecer,FrankfurtSchool of
Finance andManagement
Motivation
The StatisticalModel
Graphs
Conclusions
EPL Model
Model 1
(Intercept) 0.473376(0.100849)
OpenCross -0.022861(0.003196)
Home 0.417204(0.029636)
AIC 4229BIC 4286Log Likelihood -2106Deviance 4211Num. obs. 3800Num. groups: Team 29Num. groups: Against 29Variance: Team.(Intercept) 0.121923Variance: Team.OpenCross 0.000110Variance: Against.(Intercept) 0.112291Variance: Against.OpenCross 0.000028

Crossing insoccer has a
strongnegativeimpact onscoring:
Jan Vecer,FrankfurtSchool of
Finance andManagement
Motivation
The StatisticalModel
Graphs
Conclusions
EPL Model - Attack
(Intercept) OpenCross Home
Arsenal 1.042368 -0.030510 0.417203Aston Villa 0.425882 -0.019876 0.417203
Chelsea 1.097310 -0.031954 0.417203Everton 0.671642 -0.024262 0.417203Fulham 0.273865 -0.017672 0.417203
Liverpool 0.860616 -0.029654 0.417203Manchester City 0.846105 -0.029128 0.417203Manchester Utd 0.798300 -0.011707 0.417203Newcastle Utd 0.565930 -0.024579 0.417203Norwich City 0.377409 -0.017618 0.417203Southampton 0.593570 -0.025884 0.417203
Stoke City 0.011150 -0.011515 0.417203Sunderland 0.472198 -0.026832 0.417203
Swansea City 0.387274 -0.022690 0.417203Tottenham 1.024221 -0.040664 0.417203
West Bromwich 0.539959 -0.027303 0.417203West Ham 0.241390 -0.015480 0.417203

Crossing insoccer has a
strongnegativeimpact onscoring:
Jan Vecer,FrankfurtSchool of
Finance andManagement
Motivation
The StatisticalModel
Graphs
Conclusions
EPL Model - Defense
(Intercept) OpenCross Home
Arsenal 0.048665 -0.016203 0.417203Aston Villa 0.446672 -0.022443 0.417203
Chelsea -0.093416 -0.013975 0.417203Everton 0.146778 -0.017741 0.417203Fulham 0.331304 -0.020634 0.417203
Liverpool -0.062757 -0.014456 0.417203Manchester City 0.003006 -0.015487 0.417203Manchester Utd -0.152201 -0.013053 0.417203Newcastle Utd 0.569296 -0.024365 0.417203Norwich City 0.646480 -0.025575 0.417203Southampton 0.541325 -0.023927 0.417203
Stoke City 0.358285 -0.021057 0.417203Sunderland 0.439709 -0.022333 0.417203
Swansea City 0.340518 -0.020778 0.417203Tottenham 0.149979 -0.017791 0.417203
West Bromwich 0.670652 -0.025954 0.417203West Ham 0.612075 -0.025036 0.417203

Crossing insoccer has a
strongnegativeimpact onscoring:
Jan Vecer,FrankfurtSchool of
Finance andManagement
Motivation
The StatisticalModel
Graphs
Conclusions
Bundesliga Model
Model 1
(Intercept) 0.374347(0.088441)
OpenCross -0.020001(0.004450)
Home 0.281266(0.034298)
AIC 3009BIC 3061Log Likelihood -1495Deviance 2991Num. obs. 2536Num. groups: Team 24Num. groups: Against 24Variance: Team.(Intercept) 0.064105Variance: Team.OpenCross 0.000080Variance: Against.(Intercept) 0.070237Variance: Against.OpenCross 0.000070

Crossing insoccer has a
strongnegativeimpact onscoring:
Jan Vecer,FrankfurtSchool of
Finance andManagement
Motivation
The StatisticalModel
Graphs
Conclusions
Bundesliga Model - Attack
(Intercept) OpenCross Home
1899 Hoffenheim 0.343475 -0.015867 0.2812661.FC Nurnberg 0.278478 -0.024494 0.281266
1.FSV Mainz 05 0.384550 -0.026493 0.281266Bayer 04 Leverkusen 0.662520 -0.021821 0.281266Borussia Dortmund 0.860156 -0.027790 0.281266Borussia Mgladbach 0.390397 -0.021744 0.281266Eintracht Frankfurt 0.326103 -0.019196 0.281266FC Bayern Munchen 0.903426 -0.015981 0.281266
FC Schalke 04 0.506178 -0.012962 0.281266Hamburger SV 0.419429 -0.021852 0.281266Hannover 96 0.483677 -0.024369 0.281266SC Freiburg 0.332071 -0.020679 0.281266
SV Werder Bremen 0.462857 -0.011292 0.281266VfB Stuttgart 0.624621 -0.027100 0.281266VfL Wolfsburg 0.511445 -0.017644 0.281266

Crossing insoccer has a
strongnegativeimpact onscoring:
Jan Vecer,FrankfurtSchool of
Finance andManagement
Motivation
The StatisticalModel
Graphs
Conclusions
Bundesliga Model - Defense
(Intercept) OpenCross Home
1899 Hoffenheim 0.397648 -0.020738 0.2812661.FC Nurnberg 0.326835 -0.018498 0.281266
1.FSV Mainz 05 0.260753 -0.016407 0.281266Bayer 04 Leverkusen 0.162643 -0.013303 0.281266Borussia Dortmund -0.158434 -0.003145 0.281266Borussia Mgladbach 0.426736 -0.021658 0.281266Eintracht Frankfurt 0.356889 -0.019448 0.281266FC Bayern Munchen -0.327126 0.002192 0.281266
FC Schalke 04 0.134238 -0.012404 0.281266Hamburger SV 0.384058 -0.020308 0.281266Hannover 96 0.482066 -0.023409 0.281266SC Freiburg 0.398418 -0.020762 0.281266
SV Werder Bremen 0.517723 -0.024537 0.281266VfB Stuttgart 0.403881 -0.020935 0.281266VfL Wolfsburg 0.479178 -0.023317 0.281266
Crossing insoccer has a
strongnegativeimpact onscoring:
Jan Vecer,FrankfurtSchool of
Finance andManagement
Motivation
The StatisticalModel
Graphs
Conclusions
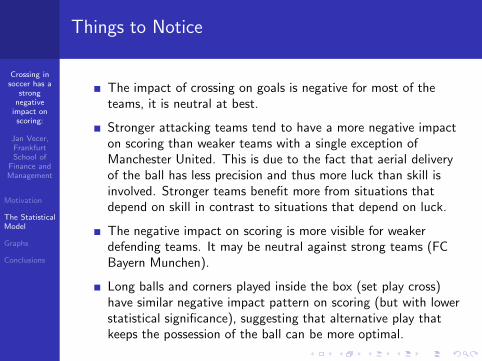
Things to Notice
The impact of crossing on goals is negative for most of theteams, it is neutral at best.
Stronger attacking teams tend to have a more negative impacton scoring than weaker teams with a single exception ofManchester United. This is due to the fact that aerial deliveryof the ball has less precision and thus more luck than skill isinvolved. Stronger teams benefit more from situations thatdepend on skill in contrast to situations that depend on luck.
The negative impact on scoring is more visible for weakerdefending teams. It may be neutral against strong teams (FCBayern Munchen).
Long balls and corners played inside the box (set play cross)have similar negative impact pattern on scoring (but with lowerstatistical significance), suggesting that alternative play thatkeeps the possession of the ball can be more optimal.

Crossing insoccer has a
strongnegativeimpact onscoring:
Jan Vecer,FrankfurtSchool of
Finance andManagement
Motivation
The StatisticalModel
Graphs
Conclusions
Tottenham Attack
0 10 20 30 40 50
02
46
8
Tottenham
Open Cross
Go
als

Crossing insoccer has a
strongnegativeimpact onscoring:
Jan Vecer,FrankfurtSchool of
Finance andManagement
Motivation
The StatisticalModel
Graphs
Conclusions
Arsenal Attack
0 10 20 30 40 50
02
46
8
Arsenal
Open Cross
Go
als

Crossing insoccer has a
strongnegativeimpact onscoring:
Jan Vecer,FrankfurtSchool of
Finance andManagement
Motivation
The StatisticalModel
Graphs
Conclusions
Manchester United Attack
0 10 20 30 40 50
02
46
8
Manchester Utd
Open Cross
Go
als

Crossing insoccer has a
strongnegativeimpact onscoring:
Jan Vecer,FrankfurtSchool of
Finance andManagement
Motivation
The StatisticalModel
Graphs
Conclusions
Chelsea Attack
0 10 20 30 40 50
02
46
8
Chelsea
Open Cross
Go
als

Crossing insoccer has a
strongnegativeimpact onscoring:
Jan Vecer,FrankfurtSchool of
Finance andManagement
Motivation
The StatisticalModel
Graphs
Conclusions
Liverpool Attack
0 10 20 30 40 50
02
46
8
Liverpool
Open Cross
Go
als

Crossing insoccer has a
strongnegativeimpact onscoring:
Jan Vecer,FrankfurtSchool of
Finance andManagement
Motivation
The StatisticalModel
Graphs
Conclusions
Manchester City Attack
0 10 20 30 40 50
02
46
8
Manchester City
Open Cross
Go
als

Crossing insoccer has a
strongnegativeimpact onscoring:
Jan Vecer,FrankfurtSchool of
Finance andManagement
Motivation
The StatisticalModel
Graphs
Conclusions
Stoke City Attack
0 10 20 30 40 50
02
46
8
Stoke City
Open Cross
Go
als

Crossing insoccer has a
strongnegativeimpact onscoring:
Jan Vecer,FrankfurtSchool of
Finance andManagement
Motivation
The StatisticalModel
Graphs
Conclusions
FC Bayern Munich Attack
0 10 20 30 40 50
02
46
8
FC Bayern Munchen
Open Cross
Go
als

Crossing insoccer has a
strongnegativeimpact onscoring:
Jan Vecer,FrankfurtSchool of
Finance andManagement
Motivation
The StatisticalModel
Graphs
Conclusions
Borussia Dortmund Attack
0 10 20 30 40 50
02
46
8
Borussia Dortmund
Open Cross
Go
als

Crossing insoccer has a
strongnegativeimpact onscoring:
Jan Vecer,FrankfurtSchool of
Finance andManagement
Motivation
The StatisticalModel
Graphs
Conclusions
Werder Bremen Attack
0 10 20 30 40 50
02
46
8
SV Werder Bremen
Open Cross
Go
als

Crossing insoccer has a
strongnegativeimpact onscoring:
Jan Vecer,FrankfurtSchool of
Finance andManagement
Motivation
The StatisticalModel
Graphs
Conclusions
Manchester United Defense
0 10 20 30 40 50
02
46
8
Manchester Utd
Open Cross
Go
als

Crossing insoccer has a
strongnegativeimpact onscoring:
Jan Vecer,FrankfurtSchool of
Finance andManagement
Motivation
The StatisticalModel
Graphs
Conclusions
Tottenham Defense
0 10 20 30 40 50
02
46
8
Tottenham
Open Cross
Go
als

Crossing insoccer has a
strongnegativeimpact onscoring:
Jan Vecer,FrankfurtSchool of
Finance andManagement
Motivation
The StatisticalModel
Graphs
Conclusions
Arsenal Defense
0 10 20 30 40 50
02
46
8
Arsenal
Open Cross
Go
als

Crossing insoccer has a
strongnegativeimpact onscoring:
Jan Vecer,FrankfurtSchool of
Finance andManagement
Motivation
The StatisticalModel
Graphs
Conclusions
Chelsea Defense
0 10 20 30 40 50
02
46
8
Chelsea
Open Cross
Go
als

Crossing insoccer has a
strongnegativeimpact onscoring:
Jan Vecer,FrankfurtSchool of
Finance andManagement
Motivation
The StatisticalModel
Graphs
Conclusions
Liverpool Defense
0 10 20 30 40 50
02
46
8
Liverpool
Open Cross
Go
als

Crossing insoccer has a
strongnegativeimpact onscoring:
Jan Vecer,FrankfurtSchool of
Finance andManagement
Motivation
The StatisticalModel
Graphs
Conclusions
Manchester City Defense
0 10 20 30 40 50
02
46
8
Manchester City
Open Cross
Go
als
Crossing insoccer has a
strongnegativeimpact onscoring:
Jan Vecer,FrankfurtSchool of
Finance andManagement
Motivation
The StatisticalModel
Graphs
Conclusions
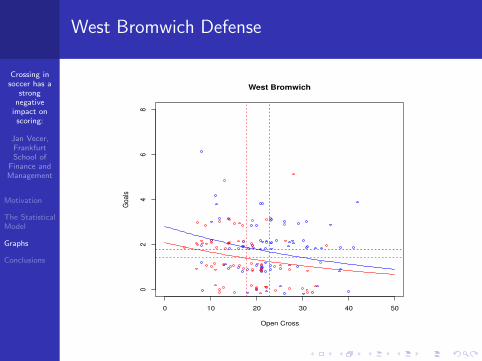
West Bromwich Defense
0 10 20 30 40 50
02
46
8
West Bromwich
Open Cross
Go
als

Crossing insoccer has a
strongnegativeimpact onscoring:
Jan Vecer,FrankfurtSchool of
Finance andManagement
Motivation
The StatisticalModel
Graphs
Conclusions
FC Bayern Munich Defense
0 10 20 30 40 50
02
46
8
FC Bayern Munchen
Open Cross
Go
als

Crossing insoccer has a
strongnegativeimpact onscoring:
Jan Vecer,FrankfurtSchool of
Finance andManagement
Motivation
The StatisticalModel
Graphs
Conclusions
Borussia Dortmund Defense
0 10 20 30 40 50
02
46
8
Borussia Dortmund
Open Cross
Go
als

Crossing insoccer has a
strongnegativeimpact onscoring:
Jan Vecer,FrankfurtSchool of
Finance andManagement
Motivation
The StatisticalModel
Graphs
Conclusions
Werder Bremen Defense
0 10 20 30 40 50
02
46
8
SV Werder Bremen
Open Cross
Go
als

Crossing insoccer has a
strongnegativeimpact onscoring:
Jan Vecer,FrankfurtSchool of
Finance andManagement
Motivation
The StatisticalModel
Graphs
Conclusions
Conclusions
Is open crossing dead?
No, but it should be either used by weaker teams playing againststronger teams when the luck plays a more important role, or thestronger teams must improve the crossing quality to the point ofManchester United (43.8 open crosses per goal) to make it neutral.This would need a big improvement, the second best crossing team,Chelsea, needs 62.6 open crosses per goal.
At the present time, the teams seem to overuse open crossing. Itsreduction can increase scoring for most of the teams. Some topteams can score 40+ extra goals in seasons by reducing crossing.That’s about how many goals scores Messi in his top season.

Crossing insoccer has a
strongnegativeimpact onscoring:
Jan Vecer,FrankfurtSchool of
Finance andManagement
Motivation
The StatisticalModel
Graphs
Conclusions
Conclusions
So what if we see indeed the decrease of open crossing and increaseof scoring?
Do not forget to send me a check for such goals or for winning thechampionship, I am OK with half of Messi’s salary.
I do not need the Golden Shoe for the best scorer.

Crossing insoccer has a
strongnegativeimpact onscoring:
Jan Vecer,FrankfurtSchool of
Finance andManagement
Motivation
The StatisticalModel
Graphs
Conclusions
Conclusions
I will post a new version of the paper on www.ssrn.com in the nearfuture. An old version that uses a standard linear regression isavailable, but the conclusions are pretty much the same.


![[RKRD] 2,4 MB Bundesliga](https://img.pdfslide.net/doc/110x75/568bd6511a28ab20349b9fe9/rkrd-24-mb-bundesliga.jpg)