Embed Size (px)
Citation preview
CROSSOVER INVESTOR UPDATE
September 2021
Strictly Private and Confidential
A SCHEME OF EDELWEISS ALTERNATIVE INVESTMENTS OPPRTUNITIES TRUST , A CATEGORY II ALTERNATIVE INVESTMENT FUND (AIF) REGISTERED WITH SEBI UNDER SEBI (ALTERNATIVE INVESTMENT FUNDS) REGULATIONS, 2012 AND HAVING SEBI REGISTRATION NUMBER IN/AIF2/17-18/0502
Edelweiss Crossover Opportunities Fund (Crossover I) is managed by Edelweiss Asset Management Limited, an Edelweiss Group Company. Mr. Pranav Parikh was designated as the Fund Manager of these schemes up to November 10, 2020 and he is currently a Member of the Investment Committee of these schemes.

Recap of Crossover Strategy

3
Crossover strategy is built on 3 pillars of value-creation designed for Pre-IPO/ Late-stage PE investing…
Pillars of Value Creation
Team with blend of PE-style
rigour, analytical background
and public markets expertise
Team’s proprietary sourcing for Pre-IPO / late-stage PE
and IPOs
Edelweiss’ relationships
Crossover Brand in Pre-IPOs
Exit management focus during selection of
investment and post investment
Risk management capabilities
SELECTION ACCESSRISK
MANAGEMENT

4
THEMATICBIAS
LEADERSHIP BIAS
FUNDAMENTAL BIAS
Growing sectors driven by structural Indian underpenetrated consumer growth
▪ Large market potential and underpenetrated
▪ Visible room for structural growth over at least 5+ years
Leadership in high growth sectors
▪ Capabilities as a market leader or path to leadership
▪ Higher growth than industry (increasing market share)
Profitable growth with low leverage
▪ Higher growth in revenues and profitability compared to peers and industry
▪ Proven unit economics with a capital efficient business model
▪ Low or no leverage and low susceptibility to market shocks
Our proprietary value investment approach to selection has deep focus on fundamentals

5
Resulting in a portfolio of high-quality leaders across sectors
*Exited

6
…and demonstrated success in selection and providing access to high quality IPOs
Source: Edelweiss Research – NSE, Prime Database; *IPO Market = All IPOs listed between 17-Nov-17 and 30-Sep-20 [48 Nos.]; Crossover Picks = IPO companies where Crossover invested >10 Cr; #Abs. Return includes – price gains as on 30-Sep-21
Crossover IPO selections’ 1-yr returns beats IPO
market by ~10%
Amber CAMS Polycab Affle
Listing day gain 44% 13% 22% 18%
Absolute Return# 280% 147% 344% 620%
Crossover Access Pre-IPO Pre-IPO Anchor/QIB Anchor/QIB
Capital for INR 1 Cr Allocation 1 Cr 1 Cr 24 Cr 24 Cr
NII Access IPO IPO IPO IPO
Capital for INR 1 Cr Allocation 519 Cr 112 Cr 110 Cr 199 Cr
Crossover to NII Allocation (same application amount)
519x 112x 5x 8x
Crossover provides an effective way to access the
most sought-after IPOs
Investing through Crossover provides significantly better allocations
3%
17%
12%
27%
Median Listing DayGain
Median Gains 1-yrfrom listing
IPO Market* Crossover picks

Performance Update

Current Investments,
72 Lakhs
Cash & Other Assets, 21 Lakhs
Fees & Expenses, 7
Lakhs
Distributions,72 Lakhs
1.72 Crore As on 30th Sep‘21 72 Lakhs
As on 30th Sep’21
INR 1 Cr investment in Crossover is now ~INR 1.72 Cr (Gross)
Crossover I inception date 17th Nov’17Numbers might not add up to 1.72 Cr because of rounding off. Please note these figures corresponds to average per crore investment at fund level. Each individual portfolio value might vary. Individual investors should refer to their statement of account for their actual portfolio value.
Pre-IPO63 Lakhs
Anchor/QIB3 Lakhs
Open Market5 Lakhs

Distribution # DateDistribution
Capital AmountGains + Other
IncomeFees + Expenses
Cash TDS
Distribution 1 31-Oct-19 4.0 0.5 3.1 4.8 -3.2
Distribution 2 20-Feb-20 6.1 0.2 4.1 3.1 -0.9
Distribution 3 15-May-20 8.7 - 8.7 - -
Distribution 4 10-Jul-20 6.2 - 6.2 - -
Distribution 5 15-Aug-20 4.9 - 4.9 - -
Distribution 6 30-Sep-20 5.1 - 5.1 - -
Distribution 7 25-Feb-21 12.9 0.4 10.5 4.7 -1.9
Distribution 8 8-Jun-21 11.5 0.3 7.6 4.7 -0.5
Distribution 9 18-Aug-21 10.2 0.3 6.8 4.1 -0.5
Total 69.7 1.7 57.2 21.4 -6.9
Total distributions of INR 71.4 lakhs made for every 1 Cr of investment including Cash & TDS
Breakdown of distributions (For a sample Class A1 investor)
Assuming drawdowns amounts were paid on respective due datesActual distributions might change based on commitment & drawdown dates; Numbers might not add up because of rounding off.Pre-MF gains are not included in the above distribution table.

Breakup of all Distributions
Payment Details CapitalGain/Loss +
Other Income
Expense +
TDS
Net
PaymentCapital Narration
18-Jun - 4 -2 2 Gains Prior to End of Commitment Period
19-Nov 44 67 -46 60 Indiamart (8 cr) + IRCTC (2.6 cr) + Metropolis ( 32.9 cr)
20-Feb 59 44 -14 88 Metropolis (33 cr) + Ujjivan ( 2.7 cr) +Amber ( 22.5cr )
20-May 125 - - 125 Undeployed Capital ( 124.53 cr)
20-Jul 113 -12 -12 89 Indostar (87.7 cr ) + Affle (11.0 cr) + Amber (14.3 cr)
20-Aug 44 30 -3 70 Polycab (19.2 cr ) + Affle (5.06 cr) + Amber (19.7 cr)
20-Sep 135 -60 -5 73 Future Supply (21.6 cr ) + Affle (3.85 cr) + Amber (45.88 cr)
21-Feb 90 111 -13 188 Amber (95.66cr) + Gangadi (60.74cr) + Yes Bank (37.15cr) + Affle (6.04cr)
21-Jun 109 67 -11 165
RITES (11.79 cr) + IRCTC (7.84 cr) + SBI cards (23.7 cr)
+Polycab (38.38 cr) + NSE (11.35 cr) + Bandhan Bank
(16.25 cr)
21-Aug 98 59 -12 145 NSE (65.77 cr) + PNB Housing Finance (28.34 cr) +Polycab (3.7 cr)
21-Oct 145 155 -21 279 NSE (39.59 cr) + SBI Life (97.07 cr) + Polycab (2.22 cr) + Ujjivan SFB (5.94 cr)
Total
Distributions till
21st
October’21
962 465 -137 1285
~ % of Total
Contribution67% 33% -10% 90%
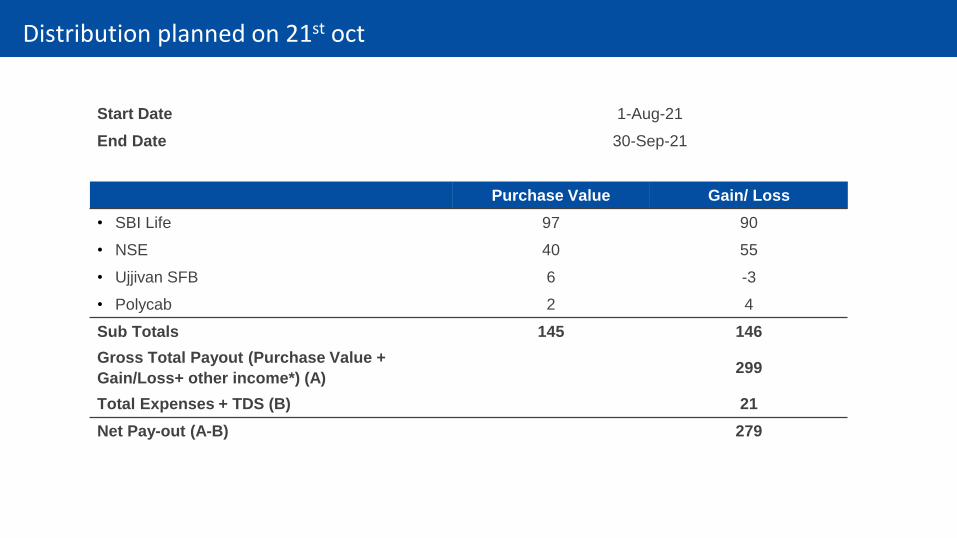
Distribution planned on 21st oct
Start Date 1-Aug-21
End Date 30-Sep-21
Purchase Value Gain/ Loss
• SBI Life 97 90
• NSE 40 55
• Ujjivan SFB 6 -3
• Polycab 2 4
Sub Totals 145 146
Gross Total Payout (Purchase Value +
Gain/Loss+ other income*) (A)299
Total Expenses + TDS (B) 21
Net Pay-out (A-B) 279

Attribution analysis – Unrealized P/L
Security Name Type of Deal
Cost per Cr of investor
capital (INR Lakh)
MTM Value per Cr of investor capital
(INR Lakh)
Absolute Gross Return
Contribution to
Gross Return
Investment IRR
NSE Pre-IPO 13.0 39.3 201% 26.2% 54.6%
Sapphire Foods Pre-IPO 9.6 23.9 147% 14.2% 38.9%
SBI Life Open Market 1.6 2.9 80% 1.3% 48.6%
Spandana Sphoorty Anchor/ QIB 4.9 3.2 -35% -1.7% -18.8%
PNB Housing Finance Open Market 2.8 2.2 -19% -0.5% -1.1%
Total Portfolio : Unrealized
32.0 71.5 123.4% 39.4%
All data as on 30th Sep ’21

Attribution analysis – Realized P/L
Security Name Type of Deal
Cost per Cr of investor
capital (INR Lakh)
Exit Value per Cr of investor capital
(INR Lakh)
Absolute Gross Return
Contribution to
Gross Return
Investment IRR
NSE Pre-IPO 8.0 16.6 106% 8.6% 25.4%
SBI Life Open Market 7.1 13.4 88% 6.3% 30.2%
Amber Enterprises Pre-IPO 7.7 17.4 126% 9.7% 37.6%
Future Supply Chain Pre-IPO 7.9 1.5 -81% -6.5% -46.2%
IndoStar Capital Finance Anchor/ QIB 6.1 3.3 -46% -2.8% -26.2%
Other positions 27.8 39.7 43% 14.1%
Total Portfolio : Realised
64.6 91.9 45% 29.4%
All data as on 30th Sep ’21

Attribution analysis – Crossover Portfolio has performed across the board
Security NameCost per Cr of
investor capital (INR Lakh)
Current/Exit Value per Cr of investor capital
(INR Lakh)
Absolute Gross Return
Contribution to Gross Return
Fund Net IRR
Unrealized P/L 32.0 71.5 123% 39.4%
Realized P/L 64.6 91.9 45% 29.4%
Dividend/Interest & Other income 2.9%
Total 96.6 163.4 71.6% 71.6% 20.03%
Net IRR For class A1 (minimum investment INR 1 Crore) assuming drawdowns amounts were paid on respective due date.Difference between 172 (Gross) & 163.4 is due to Mutual funds, Dividends, interest & other income All data as on 30 Sep’21.

And has outperformed benchmarks* with relatively much lower fall in value since inception
Nifty and other indices returns since launch of Crossover 1 i.e. 17th Nov 2017 to 30th Sep 2021.All maximum losses as on 31st March 2020 – nearest NAV date the max drawdown values are calculated as the lowest value reached with respect to inception valueCrossover IRR for Class A1 Units *Please refer to the performance benchmarking alternate investment funds (AIFs) as per SEBI guidelines at the end of this presentation
-5%
-14%
-39%
-56%
20.0%
13.5%
9.7%
2.2%
Crossover 1
Nifty50 TRI
Nifty Midcap100 TRI
Nifty Smallcap100 TRI
IRR Max. Drawdown

22.9
18.0
16.0
13.4
2.0
7.0
12.0
17.0
22.0
Nov-17 Jun-18 Dec-18 Jul-19 Jan-20 Aug-20 Mar-21 Sep-21
NA
V
Crossover I Nifty 50 TRI Nifty Midcap 100 TRI Nifty smallcap 100 TRI
…with significantly lower volatility and drawdowns through periods of crises…
Crossover Funds max. decline in value since inception was <5% - even during NBFC and COVID Crises
Fall in NAV / Index
Crossover I -5%
Nifty50 TRI -14%
MidCap100 TRI -39%
SmallCap100 TRI -56%
10.0
Source: Edelweiss Research – NSE; Inception Date: 17th November 2017; NAV for Class A1 shareholders assuming that all payments are done on time. Data as on 30th Sep’21.

Crossover % of Invested Corpus Absolute Gain*
Pre-IPO
NSE 22% 165%
Sapphire Foods 10% 147%
Amber Enterprises 8% 127%
Future Supply Chain Solutions 8% -81%
MedPlus 2% 110%
Anchor/QIB
IndoStar Capital Finance 6% -46%
Polycab India 5% 95%
Metropolis Healthcare 5% 45%
Spandana Sphoorty 5% -35%
SBI Cards 2% 31%
Others 5% 38%
Open Market
SBI Life 9% 86%
PNB Housing Finance 5% -25%
Yes Bank 2% 49%
Others 5% 16%
With performance across categories and investments
*Absolute Gain- realised and unrealised gains as on 30th Sep ’21

A look at our late-stage PE/Pre-IPO positions

19
1,2
60
1,4
61
1,5
93
1,9
00
PAT**
3,5
10
NSE: identified early, invested big
Fit with Crossover Strategy
ThematicBias
▪ Long runway for growth
▪ High operating leverage
FundamentalBias
▪ Long-term growth driven by GDP growth
▪ Foreign investor interest in EM / India
▪ Increasing financialization of savings
LeadershipBias
▪ Dominant #1 player, 95+% share in cash equities and
99+% in equity derivatives
▪ Defensible moat – “liquidity begets liquidity”
IPO visibility
▪ IPO ready from all perspectives – scale, profitability,
governance, etc.
▪ Strong publicly-stated intent of IPO
Public market interest
▪ High investor interest from all classes of investors –
FIIs, DIIs, HNIs
▪ One of the most widely held private stock
Growth in Revenue & Profitability [INR Cr]
2,1
04
2,6
09
3,0
28
3,5
14
Revenue
FY17 FY18 FY19 FY20 FY21
5,6
25
28%
**PAT is normalized for non-operating costs
High Conviction built over few months of research led to a large position built over few quarters and strategically sourced
Source: Edelweiss Research, Company financials
29%

20
81
6
96
6
1,2
04
1,3
52
Revenue
FY17 FY18 FY19 FY20
Sapphire Foods: great brands and resilience shines through
Fit with Crossover Strategy Growth in Revenue & Profitability [INR Cr]
ThematicBias
▪ Consumption-driven compounding story
▪ Unbranded to branded shift
FundamentalBias
▪ Headroom for high growth
▪ Scale of the brands proven globally
LeadershipBias
▪ One of the largest restaurant operators - 400+ stores
in India and Sri Lanka
▪ KFC India and Pizza Hut Sri Lanka are category
leaders in respective markets
IPO visibility
▪ Scale-wise IPO ready; investment plan envisaged
EBITDA improvement for maximal IPO outcome
▪ IPO intent agreed among stakeholders
▪ DRHP filing underway
Source: Edelweiss Research, VCC Edge database
2 17
48
19
7
EBITDA**
**EBITDA for FY20 is Post Ind-AS 116 and hence may not be comparable
Financial data available only till FY20 due to regulatory constraints.
18%

Disclaimers
AIF Benchmarking as on 30th September 2020 – As per SEBI GuidelinesPlease find below performance data as per SEBI circular SEBI/HO/IMD/DF6/CIR/P/2020/24 dated February 5, 2020, read along with SEBI circular SEBI/HO/IMD/DF6/CIR/P/2020/99 dated June 12, 2020, notifying mandatory performancebenchmarking of Alternative Investment Funds (AIFs).Edelweiss Crossover Opportunities Fund: IRR 2.17% vs CRISIL AIF CAT II Benchmark Vintage Year FY18: IRR 8.69% | AIF Benchmark Indices data as provided by rating agency – CRISIL till 30th September 2020. Schemes that have completed atleast one year since their first close as on September 30, 2020, have been considered. Returns and ratios refer to post-expense, pre-carry, pre-tax values. Only those vintage years have been considered that have at least three schemesavailable.Past Performance is not an indication of future performance. Investments in the Securities Market are subject to Market Risk. Please read the Private Placement Memorandum (PPM) and Scheme related documents carefully before investing.This document has been prepared by Edelweiss Asset Management Limited (“Edelweiss”) Investment Manager of Edelweiss Multi Strategy Investment Trust (SEBI Reg. No.IN/AIF3/12-13/0004) and Edelweiss Alpha Fund (SEBI Reg. No.IN/AIF3/13-14/0047), a Cat. III Alternative Investment Funds (AIF) and Edelweiss Alternative Investment Opportunities Trust (SEBI Reg No. IN/AIF2/17-18/0502), a Cat. II AIF. This Document is strictly confidential and is intended for the use byrecipient only and may not be circulated, redistributed, retransmitted or disclosed, in whole or in part, or in any form or manner, without the express written consent of Edelweiss. The information set forth has been obtained from sourcesbelieved by Edelweiss to be reliable however Edelweiss does not make any warranty as to the information’s accuracy or completeness. The terms and conditions presented in the fund structure are subject in their entirety to the Fund’soffering document / Private Placement Memorandum (PPM) as amended from time to time. This representation does not constitute an offer or solicitation to any person in any jurisdiction in which such offer or solicitation is not authorized orto any person to whom it would be unlawful to make such an offer.
Investors must take their own investment decision and take appropriate advice as to any applicable legal requirements and any applicable taxation and exchange control regulations in the countries of their citizenship, residence ordomicile, which might be relevant to the subscription, purchase, holding, redemption or disposal of any investments. Performance may vary by investor and can differ due to timing of investment, strategies employed and other marketconditions. For data reference to any third party in this document (material) no such party will assume any liability for the same. Edelweiss (including its affiliates) and any of its officers, partners, directors, personnel and employees, shall notbe liable for any loss, damage of any nature, including but not limited to direct, indirect, punitive, special, exemplary, and consequential, as also any loss of profit in any way arising from the use of this material in any manner. The recipientalone shall be fully responsible/are liable for any decision taken on the basis of this material. Edelweiss has/may included statements/opinions/recommendations in this document which contain words or phrases such as “will”, “expect”,“should” and similar expressions or variations of such expressions, that are “forward looking statements”. The yields may fluctuate depending on various factors affecting capital/debt markets. Actual results may differ materially from thosesuggested by the forward looking statements due to risks or uncertainties associated with our expectations with respect to, but not limited to, exposure to market risks, general economic and political conditions in India and other countriesglobally, which have an impact on our services and/or investments, the monetary and interest policies of India, inflation, deflation, unanticipated turbulence in interest rates, foreign exchange rates, equity prices, the performance of thefinancial markets in India and globally, changes in domestic and foreign laws, regulations and taxes and changes in competition in the industry. Hypothetical results are presented for illustrative purposes only.Notwithstanding the foregoing, each investor (and each director, partner, employee, representative, or other agent thereof) may disclose to any and all persons, without limitation of any kind, the tax treatment and tax structure of any Fundand its investments and all materials of any kind (including opinions or other tax analyses) that are provided to such investor relating to such tax treatment and tax structure, provided however, that such disclosure shall not include the name(or other identifying information not relevant to the tax structure or tax treatment) to any person and shall not include information for which nondisclosure is reasonably necessary in order to comply with applicable securities laws. Edelweissdoes not assume any responsibility for any mistakes which might appear in contents received from third parties. For data reference to any third party in the material in this document, no such party will assume any liability for the same. Anyaction taken by you on the basis of the information contained herein is your responsibility alone and Edelweiss or its directors, partners or employees will not be liable in any manner for the consequences of such action taken by you.Edelweiss and/or its directors, partners and/or its employees may have interests or positions, financial or otherwise, in the securities mentioned in this documentation.There is a risk of substantial loss associated with trading in equities, futures, options, leverage, etc. Before investing please carefully consider your financial position and risk tolerance to determine if the proposed trading style is appropriate,seek appropriate professional advice. Investors should realize that when engaging in leverage, trading in futures, commodities and/or granting/writing options one could lose the full balance of their account. It is also possible to lose more thanthe initial deposit. All funds committed should be purely risk capital. The portfolio risk management process includes an effort to monitor and manage risk but should not be confused with and does not imply low risk.

The risks and mitigation measures at the fund level are enumerated below:Concentration Risk: Applicable as per the SEBI (AIF) Regulations, 2012 and adhered to at all times.Foreign Exchange Risk: Not ApplicableLeverage Risk: As per the SEBI (AIF) Regulations, 2012 and adhered to at all times.Realization Risk at Fund and Investee Company level: Realization value from the investments may not fully protect our investment in all cases.Strategy Risk at Investee Company level: LowReputation Risk: At fund level, continuous monitoring mechanism of investments and appropriate controls are in place.Environmental, Social and Corporate Governance Risks: At fund level: Robust mechanism is in place.At investee company levels: Data on extra-financial risks is available in public domain while details of leverage risk at investee company levels are not available;Realization risk and strategy risk (i.e. change in or divergence from business strategy at investee company level) is not applicable.Conflict of Interest: Presently, the Fund is availing securities broking services and custody services of its group entities viz. Edelweiss Broking Limited, Edelweiss Securities Limited and Edelweiss Custodial Services Limited. Such transactionsare at arms length relationship basis and in the ordinary course of its business. Edelweiss Global Wealth Management Limited is the sponsor to the AIFs.The risks and mitigation measures at the fund level are enumerated below:Concentration Risk: Applicable as per the SEBI (AIF) Regulations, 2012 and adhered to at all times.Foreign Exchange Risk: Not ApplicableLeverage Risk: As per the SEBI (AIF) Regulations, 2012 and adhered to at all times.Realization Risk at Fund and Investee Company level: Realization value from the investments may not fully protect our investment in all cases.Strategy Risk at Investee Company level: LowReputation Risk: At fund level, continuous monitoring mechanism of investments and appropriate controls are in place.Environmental, Social and Corporate Governance Risks: At fund level: Robust mechanism is in place.At investee company levels: Data on extra-financial risks is available in public domain while details of leverage risk at investee company levels are not available;Realization risk and strategy risk (i.e. change in or divergence from business strategy at investee company level) is not applicable.Conflict of Interest: Presently, the Fund is availing securities broking services and custody services of its group entities viz. Edelweiss Broking Limited, Edelweiss Securities Limited and Edelweiss Custodial Services Limited. Such transactionsare at arms length relationship basis and in the ordinary course of its business. Edelweiss Global Wealth Management Limited is the sponsor to the AIFs.
Disclaimers


![Investor Update/ Presentation [Company Update]](https://img.pdfslide.net/doc/110x75/577ca57b1a28abea748b8d65/investor-update-presentation-company-update.jpg)

![Investor Update Q1 FY16 [Company Update]](https://img.pdfslide.net/doc/110x75/577cb41b1a28aba7118c4de4/investor-update-q1-fy16-company-update.jpg)
![Investor Update [Company Update]](https://img.pdfslide.net/doc/110x75/577ca7aa1a28abea748c8178/investor-update-company-update-578a5bfde230f.jpg)


![Investor Update - March 2016 [Company Update]](https://img.pdfslide.net/doc/110x75/577c852e1a28abe054bc09a3/investor-update-march-2016-company-update.jpg)

![Investor Presentation / Intimation of investor conference [Company Update]](https://img.pdfslide.net/doc/110x75/577c7b771a28abe05497d5fd/investor-presentation-intimation-of-investor-conference-company-update.jpg)


![Q4 & FY16 Investor Update [Company Update]](https://img.pdfslide.net/doc/110x75/577c7fc91a28abe054a60c7a/q4-fy16-investor-update-company-update.jpg)

![Updates on Investor Update [Company Update]](https://img.pdfslide.net/doc/110x75/577cb4961a28aba7118c90ad/updates-on-investor-update-company-update.jpg)