Embed Size (px)
Citation preview
ew Mexico has a long tradition of rapid growth compared with the rest of the United States. The so-called Great Recession
touched virtually every region, and New Mexico was no exception. But while the U.S. economy has been in recovery mode since the summer of 2009, New Mexico has struggled to keep up the pace. The nation has recovered 77 percent of the 8.7 million jobs lost to the reces-sion. Although New Mexico’s job losses were similar to those of the U.S. in per-centage terms, the state’s performance in restoring lost jobs has been very poor in comparison; the state has added back only 27 percent of the 51,700 jobs lost.1
Data indicate there is a significant difference in economic performance between northern and southern New Mexico, with the southeast leading the recovery. Strong economic growth in southeast New Mexico has been driven mostly by energy.2 The economic per-formance of this area was discussed at a recent Federal Reserve Bank of Dallas conference, “The Role of Southeast New Mexico in the Global Economy,” in Carlsbad and Hobbs, N.M.
Southeast New Mexico Shines as State Economy Slowly Mendsby Avilia Bueno and Roberto A. Coronado
Data indicate there is a
significant difference in
economic performance
between northern
and southern New
Mexico, with the
southeast leading the
recovery. Strong
economic growth in
southeast New Mexico
has been driven mostly
by energy.
}
CrossroadsECONOMIC TRENDS IN THE DESERT SOUTHWEST
EL PASO BRANCH • ISSUE 1 • 2013 DALLASFED
The sessions examined topics such as the role of energy markets, refining and petrochemicals, and trade as well as current economic conditions in the U.S. and the world. What follows is a summary of those presentations and discussions.3
Southeast N.M. and Energy New Mexico State University profes-
sor Jim Peach noted in his presentation that Eddy and Lea counties in southeast New Mexico are very different from the rest of the state. The current oil boom has greatly benefited the two counties. Crude oil production in the state was around 84.4 million barrels in 2012, and Eddy and Lea took the lead, producing 44 million and 35.8 million barrels, respec-tively (Chart 1). The counties combined accounted for over 90 percent of the state’s crude oil production. In addition, the production of potash, a potassium-bearing mineral used primarily in fertil-izer, has been rising and is likely to bring considerable investment to the region in the coming years.
From April 2012 to April 2013, employment growth was 3.9 percent
N
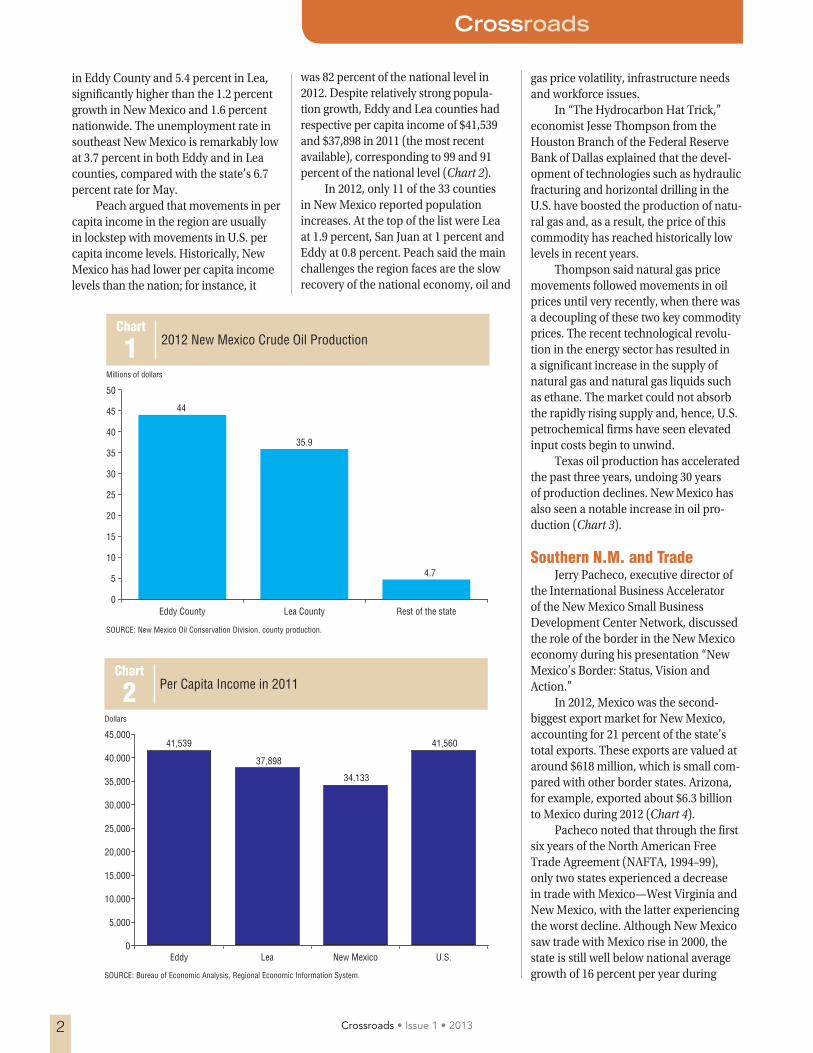
was 82 percent of the national level in 2012. Despite relatively strong popula-tion growth, Eddy and Lea counties had respective per capita income of $41,539 and $37,898 in 2011 (the most recent available), corresponding to 99 and 91 percent of the national level (Chart 2).
In 2012, only 11 of the 33 counties in New Mexico reported population increases. At the top of the list were Lea at 1.9 percent, San Juan at 1 percent and Eddy at 0.8 percent. Peach said the main challenges the region faces are the slow recovery of the national economy, oil and
gas price volatility, infrastructure needs and workforce issues.
In “The Hydrocarbon Hat Trick,” economist Jesse Thompson from the Houston Branch of the Federal Reserve Bank of Dallas explained that the devel-opment of technologies such as hydraulic fracturing and horizontal drilling in the U.S. have boosted the production of natu-ral gas and, as a result, the price of this commodity has reached historically low levels in recent years.
Thompson said natural gas price movements followed movements in oil prices until very recently, when there was a decoupling of these two key commodity prices. The recent technological revolu-tion in the energy sector has resulted in a significant increase in the supply of natural gas and natural gas liquids such as ethane. The market could not absorb the rapidly rising supply and, hence, U.S. petrochemical firms have seen elevated input costs begin to unwind.
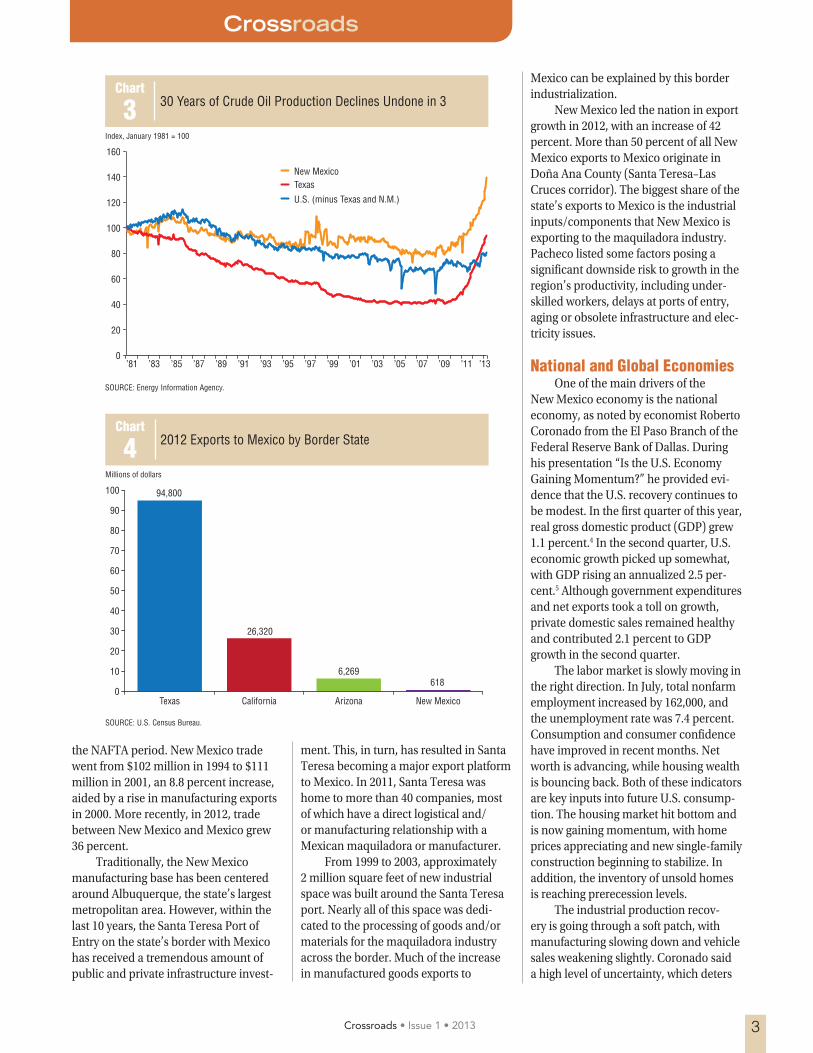
Texas oil production has accelerated the past three years, undoing 30 years of production declines. New Mexico has also seen a notable increase in oil pro-duction (Chart 3).
Southern N.M. and Trade Jerry Pacheco, executive director of
the International Business Accelerator of the New Mexico Small Business Development Center Network, discussed the role of the border in the New Mexico economy during his presentation “New Mexico’s Border: Status, Vision and Action.”
In 2012, Mexico was the second-biggest export market for New Mexico, accounting for 21 percent of the state’s total exports. These exports are valued at around $618 million, which is small com-pared with other border states. Arizona, for example, exported about $6.3 billion to Mexico during 2012 (Chart 4).
Pacheco noted that through the first six years of the North American Free Trade Agreement (NAFTA, 1994–99), only two states experienced a decrease in trade with Mexico—West Virginia and New Mexico, with the latter experiencing the worst decline. Although New Mexico saw trade with Mexico rise in 2000, the state is still well below national average growth of 16 percent per year during
Crossroads • Issue 1 • 20132
Crossroads
in Eddy County and 5.4 percent in Lea, significantly higher than the 1.2 percent growth in New Mexico and 1.6 percent nationwide. The unemployment rate in southeast New Mexico is remarkably low at 3.7 percent in both Eddy and in Lea counties, compared with the state’s 6.7 percent rate for May.
Peach argued that movements in per capita income in the region are usually in lockstep with movements in U.S. per capita income levels. Historically, New Mexico has had lower per capita income levels than the nation; for instance, it
Chart
1 2012 New Mexico Crude Oil Production
Millions of dollars
0
5
10
15
20
25
30
35
40
45
50
Rest of the stateLea CountyEddy County
44
35.9
4.7
SOURCE: New Mexico Oil Conservation Division, county production.
Chart
2 Per Capita Income in 2011
Dollars
0
5,000
10,000
15,000
20,000
25,000
30,000
35,000
40,000
45,000
30,319
41,539
37,898
34,133
41,560
U.S.New MexicoLeaEddy
SOURCE: Bureau of Economic Analysis, Regional Economic Information System.
the NAFTA period. New Mexico trade went from $102 million in 1994 to $111 million in 2001, an 8.8 percent increase, aided by a rise in manufacturing exports in 2000. More recently, in 2012, trade between New Mexico and Mexico grew 36 percent.
Traditionally, the New Mexico manufacturing base has been centered around Albuquerque, the state’s largest metropolitan area. However, within the last 10 years, the Santa Teresa Port of Entry on the state’s border with Mexico has received a tremendous amount of public and private infrastructure invest-
ment. This, in turn, has resulted in Santa Teresa becoming a major export platform to Mexico. In 2011, Santa Teresa was home to more than 40 companies, most of which have a direct logistical and/or manufacturing relationship with a Mexican maquiladora or manufacturer.
From 1999 to 2003, approximately 2 million square feet of new industrial space was built around the Santa Teresa port. Nearly all of this space was dedi-cated to the processing of goods and/or materials for the maquiladora industry across the border. Much of the increase in manufactured goods exports to
Crossroads • Issue 1 • 2013 3
Crossroads
Mexico can be explained by this border industrialization.
New Mexico led the nation in export growth in 2012, with an increase of 42 percent. More than 50 percent of all New Mexico exports to Mexico originate in Doña Ana County (Santa Teresa–Las Cruces corridor). The biggest share of the state’s exports to Mexico is the industrial inputs/components that New Mexico is exporting to the maquiladora industry. Pacheco listed some factors posing a significant downside risk to growth in the region’s productivity, including under-skilled workers, delays at ports of entry, aging or obsolete infrastructure and elec-tricity issues.
National and Global EconomiesOne of the main drivers of the
New Mexico economy is the national economy, as noted by economist Roberto Coronado from the El Paso Branch of the Federal Reserve Bank of Dallas. During his presentation “Is the U.S. Economy Gaining Momentum?” he provided evi-dence that the U.S. recovery continues to be modest. In the first quarter of this year, real gross domestic product (GDP) grew 1.1 percent.4 In the second quarter, U.S. economic growth picked up somewhat, with GDP rising an annualized 2.5 per-cent.5 Although government expenditures and net exports took a toll on growth, private domestic sales remained healthy and contributed 2.1 percent to GDP growth in the second quarter.
The labor market is slowly moving in the right direction. In July, total nonfarm employment increased by 162,000, and the unemployment rate was 7.4 percent. Consumption and consumer confidence have improved in recent months. Net worth is advancing, while housing wealth is bouncing back. Both of these indicators are key inputs into future U.S. consump-tion. The housing market hit bottom and is now gaining momentum, with home prices appreciating and new single-family construction beginning to stabilize. In addition, the inventory of unsold homes is reaching prerecession levels.
The industrial production recov-ery is going through a soft patch, with manufacturing slowing down and vehicle sales weakening slightly. Coronado said a high level of uncertainty, which deters
Chart
3 30 Years of Crude Oil Production Declines Undone in 3
Index, January 1981 = 100
0
20
40
60
80
100
120
140
160
New MexicoTexas
U.S. (minus Texas and N.M.)
’13’11’09’07’05’03’01’99’97’95’93’91’89’87’85’83’81
SOURCE: Energy Information Agency.
Chart
4 2012 Exports to Mexico by Border State
Millions of dollars
0
10
20
30
40
50
60
70
80
90
100
New MexicoArizonaCaliforniaTexas
94,800
26,320
6,269618
SOURCE: U.S. Census Bureau.
Sposi argued that in the short run, higher demand for energy products from emerging economies will benefit south-east New Mexico. In the long run, popu-lation and income growth in emerging economies and a declining agricultural workforce—leading to a need for fertilizer and energy-intensive inputs as substi-tutes for labor—will boost demand for potash. New Mexico has the largest con-centration of the mineral in the U.S.
Uneven RecoveryThe New Mexico economy is going
through a difficult recovery—it has gained back only 13,800 of the 51,700 jobs lost during the recession. The recovery has been led by southeast New Mexico, spurred by rising commodity prices. Global demand for commodities is expected to continue, driven by emerging economies. While this is good news for New Mexico overall, the benefits of rising
commodity demand are unevenly spread across the state, with the southeastern region capturing most of the share.
Bueno is a senior research analyst and Coronado is assistant vice president in charge and a senior economist at the El Paso Branch of the Federal Reserve Bank of Dallas.
Notes1 Employment data are as of July 2013 for the U.S. and June for New Mexico. 2 For more details, see “New Mexico Recovery Still Struggles in 2012,” by Monica Bonilla-Romero and Robert W. Gilmer, Federal Reserve Bank of Dallas Crossroads, no. 1, 2012.3 Conference presentations may be viewed at www.dallasfed.org/research/events/2013/nm.cfm.4 For a more current discussion of the U.S. economy, see the Federal Reserve Bank of Dallas National Economic Update at www.dallasfed.org/research/update/us/index.cfm.5 The second quarter GDP growth rate was released after the conference.6 For a more current discussion of the global economy, see the Federal Reserve Bank of Dallas International Economic Update at www.dallasfed.org/institute/update/index.cfm.
Crossroads
consumption and investment spending, is the biggest threat to the continuing U.S. recovery. Sources of uncertainty include the euro zone crisis, the federal budget sequestration and the lack of lending availability to consumers and businesses.
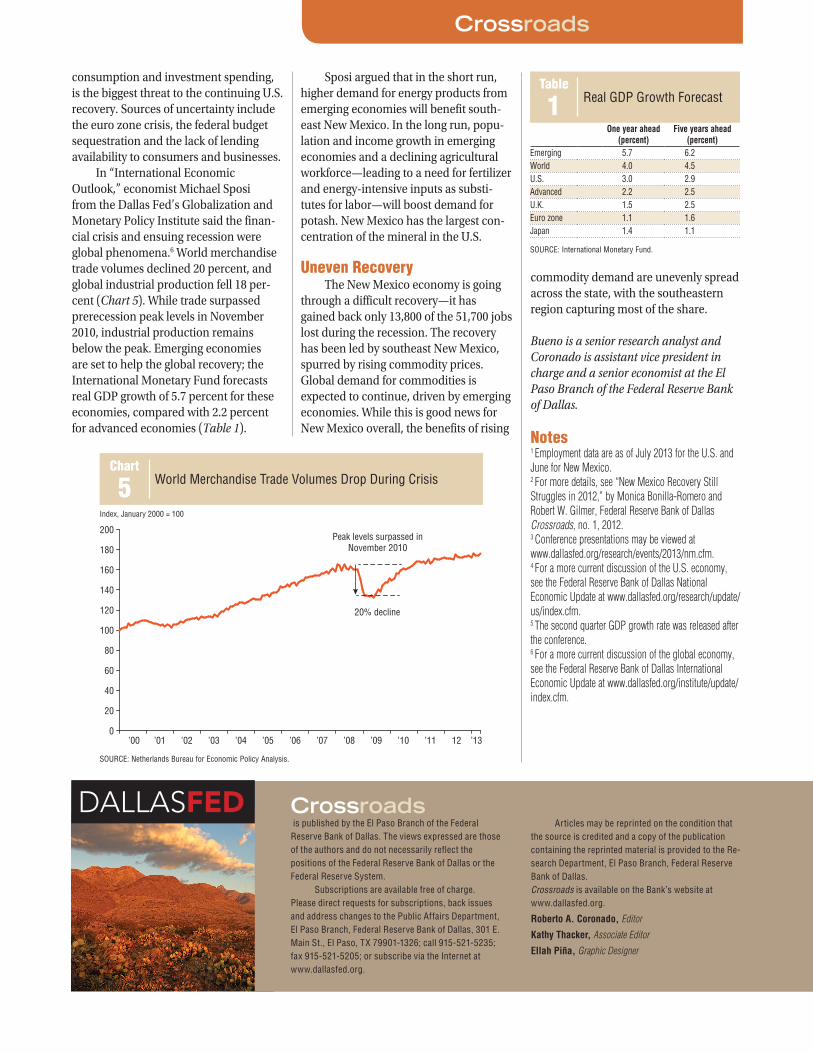
In “International Economic Outlook,” economist Michael Sposi from the Dallas Fed’s Globalization and Monetary Policy Institute said the finan-cial crisis and ensuing recession were global phenomena.6 World merchandise trade volumes declined 20 percent, and global industrial production fell 18 per-cent (Chart 5). While trade surpassed prerecession peak levels in November 2010, industrial production remains below the peak. Emerging economies are set to help the global recovery; the International Monetary Fund forecasts real GDP growth of 5.7 percent for these economies, compared with 2.2 percent for advanced economies (Table 1).
Table
1 Real GDP Growth Forecast
One year ahead(percent)
Five years ahead(percent)
Emerging 5.7 6.2World 4.0 4.5U.S. 3.0 2.9Advanced 2.2 2.5U.K. 1.5 2.5Euro zone 1.1 1.6Japan 1.4 1.1
SOURCE: International Monetary Fund.
Crossroads is published by the El Paso Branch of the Federal Reserve Bank of Dallas. The views expressed are those of the authors and do not necessarily reflect the positions of the Federal Reserve Bank of Dallas or the Federal Reserve System. Subscriptions are available free of charge. Please direct requests for subscriptions, back issues and address changes to the Public Affairs Department, El Paso Branch, Federal Reserve Bank of Dallas, 301 E. Main St., El Paso, TX 79901-1326; call 915-521-5235; fax 915-521-5205; or subscribe via the Internet at www.dallasfed.org.
Articles may be reprinted on the condition that the source is credited and a copy of the publication containing the reprinted material is provided to the Re-search Department, El Paso Branch, Federal Reserve Bank of Dallas. Crossroads is available on the Bank’s website at www.dallasfed.org.
Roberto A. Coronado, Editor
Kathy Thacker, Associate Editor
Ellah Piña, Graphic Designer
DALLASFED
Chart
5 World Merchandise Trade Volumes Drop During Crisis
Index, January 2000 = 100
0
20
40
60
80
100
120
140
160
180
200
’1312’11’10’09’08’07’06’05’04’03’02’01’00
Peak levels surpassed inNovember 2010
20% decline
SOURCE: Netherlands Bureau for Economic Policy Analysis.