Embed Size (px)
Citation preview
IEA 2019. All rights reserved
Crude oil and petroleum product flows and related important statisticsStève GervaisJoint APEC-JODI Workshop on Oil and Gas Statistics
IEA
June 11-13, 2019, Tokyo
IEA 2019. All rights reserved
Presentation overview
Key oil trends
Key concepts
Key points for reporting monthly oil

IEA 2019. All rights reserved
Key oil trends
IEA 2019. All rights reserved
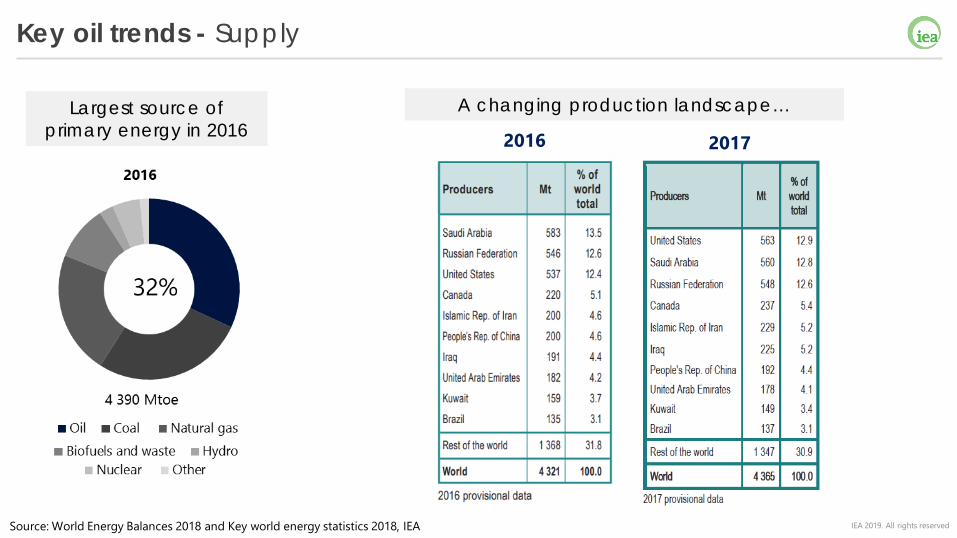
Key oil trends - Supply
Largest source of primary energy in 2016
A changing production landscape…
2016 2017
Source: World Energy Balances 2018 and Key world energy statistics 2018, IEA
IEA 2019. All rights reserved
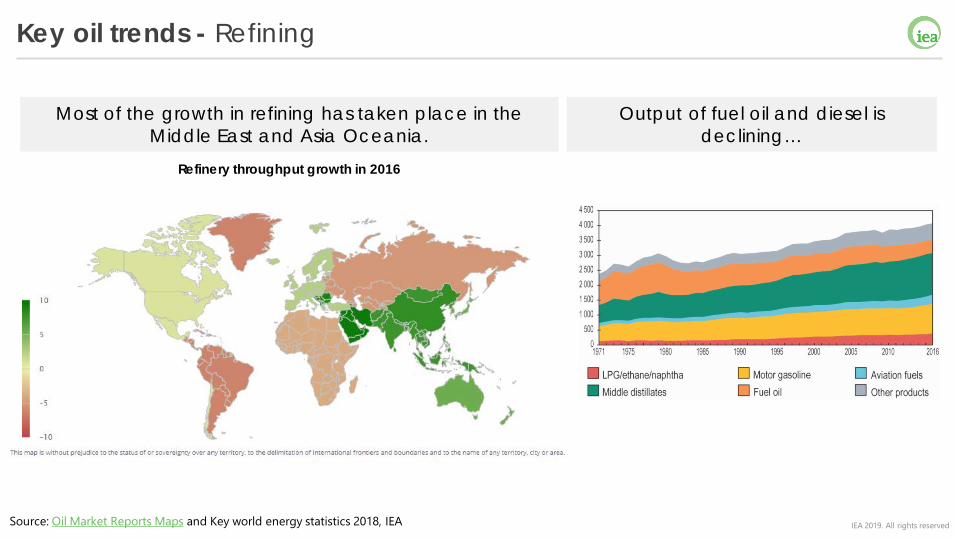
Key oil trends - Refining
Most of the growth in refining has taken place in the Middle East and Asia Oceania.
Refinery throughput growth in 2016
Source: Oil Market Reports Maps and Key world energy statistics 2018, IEA
Output of fuel oil and diesel is declining…
IEA 2019. All rights reserved
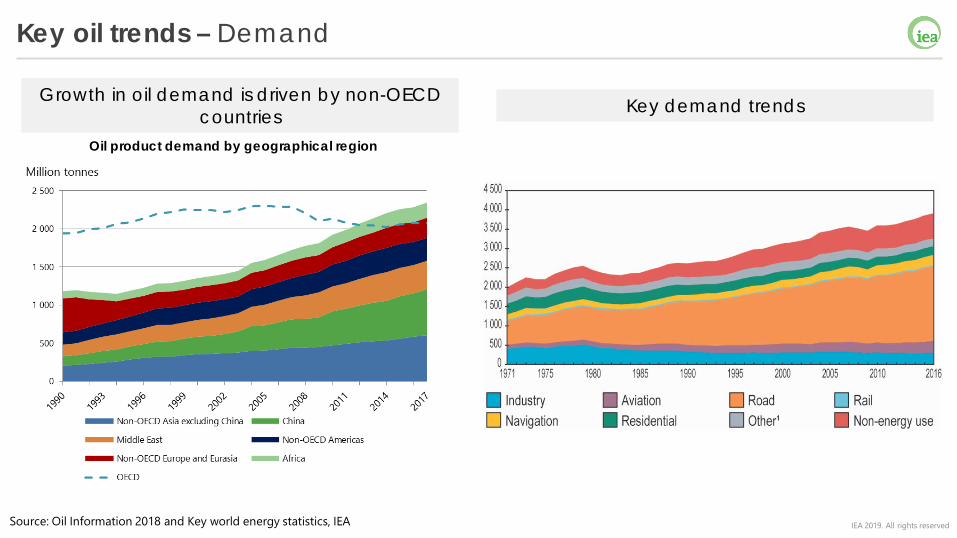
Key oil trends – Demand
Growth in oil demand is driven by non-OECD countries
Oil product demand by geographical region
Source: Oil Information 2018 and Key world energy statistics, IEA
Key demand trends
IEA 2019. All rights reserved
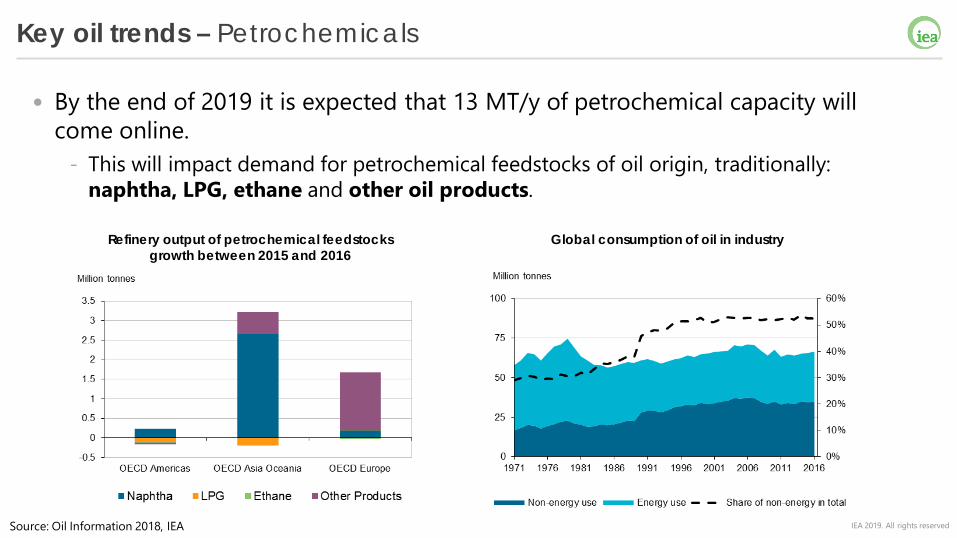
Key oil trends – Petrochemicals
• By the end of 2019 it is expected that 13 MT/y of petrochemical capacity will come online.
- This will impact demand for petrochemical feedstocks of oil origin, traditionally: naphtha, LPG, ethane and other oil products.
Refinery output of petrochemical feedstocks growth between 2015 and 2016
Global consumption of oil in industry
Source: Oil Information 2018, IEA

IEA 2019. All rights reserved
Key concepts
IEA 2019. All rights reserved
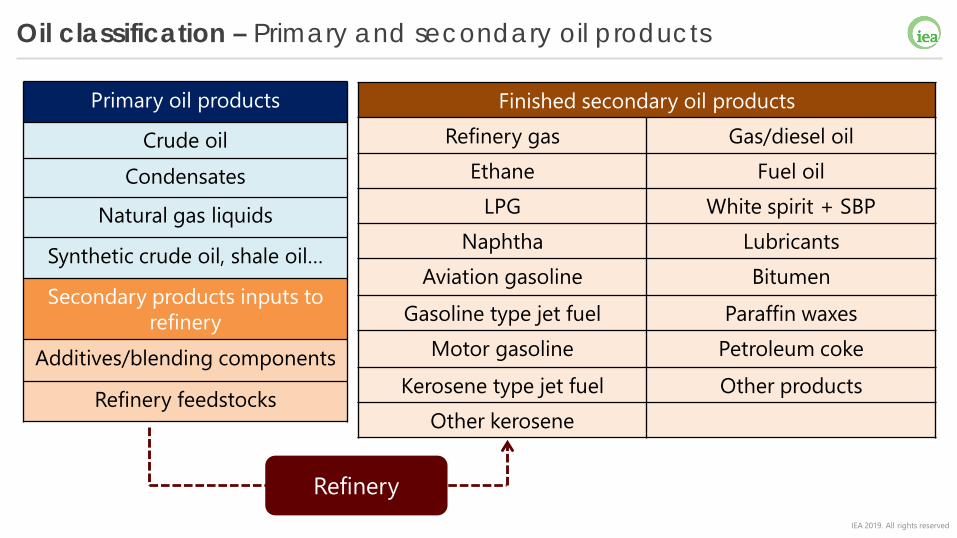
Oil classification – Primary and secondary oil products
Primary oil products
Crude oilCondensates
Natural gas liquids
Synthetic crude oil, shale oil…
Secondary products inputs to refinery
Additives/blending components
Refinery feedstocks
Finished secondary oil productsRefinery gas Gas/diesel oil
Ethane Fuel oilLPG White spirit + SBP
Naphtha LubricantsAviation gasoline Bitumen
Gasoline type jet fuel Paraffin waxesMotor gasoline Petroleum coke
Kerosene type jet fuel Other productsOther kerosene
Refinery
IEA 2019. All rights reserved
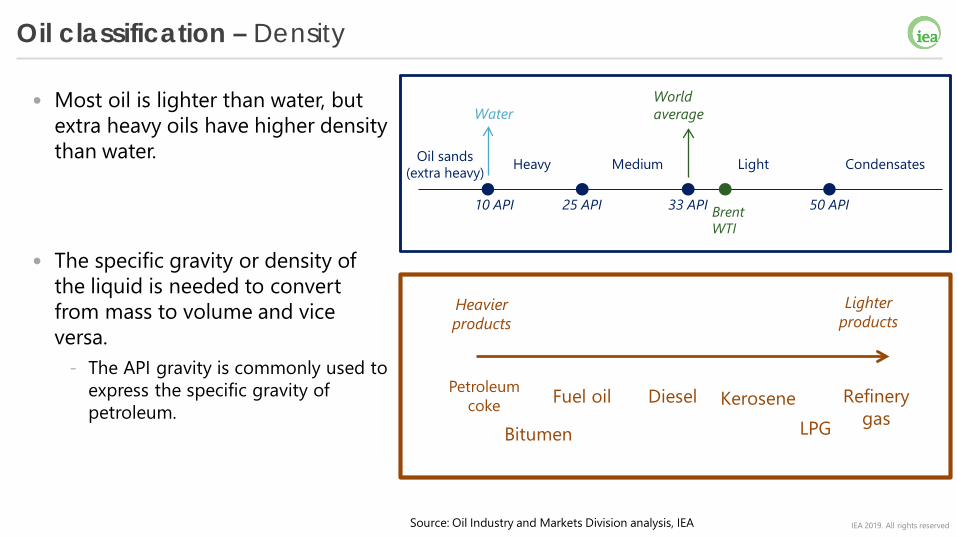
Oil classification – Density
• Most oil is lighter than water, but extra heavy oils have higher density than water.
• The specific gravity or density of the liquid is needed to convert from mass to volume and vice versa.
- The API gravity is commonly used to express the specific gravity of petroleum.
10 API 25 API 33 API 50 API
Oil sands (extra heavy) Heavy Medium Light Condensates
WaterWorld average
BrentWTI
Source: Oil Industry and Markets Division analysis, IEA
Lighterproducts
Heavierproducts
Petroleumcoke
Bitumen
Fuel oil Diesel KeroseneLPG
Refinerygas
IEA 2019. All rights reserved
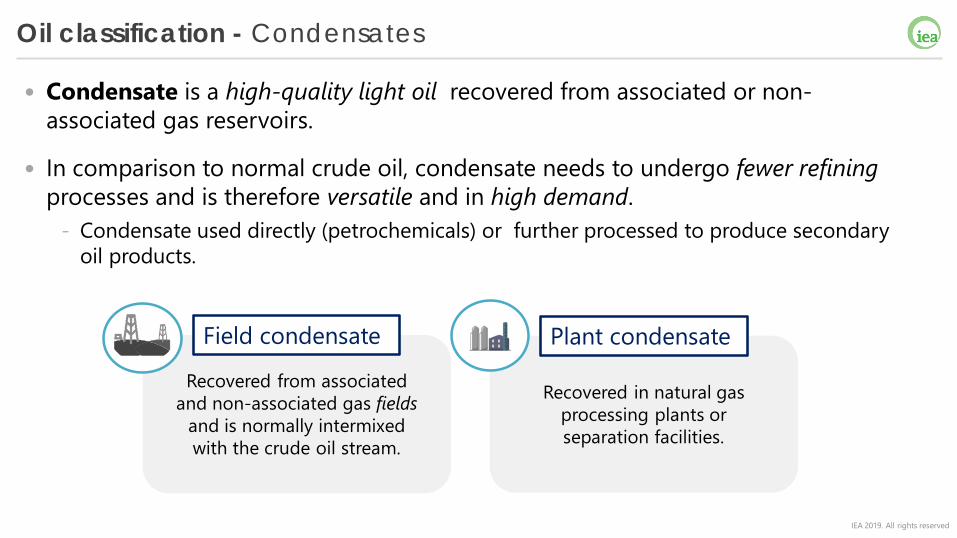
Oil classification - Condensates
• Condensate is a high-quality light oil recovered from associated or non-associated gas reservoirs.
• In comparison to normal crude oil, condensate needs to undergo fewer refining processes and is therefore versatile and in high demand.
- Condensate used directly (petrochemicals) or further processed to produce secondary oil products.
Recovered from associated and non-associated gas fields
and is normally intermixed with the crude oil stream.
Field condensate
Recovered in natural gas processing plants or separation facilities.
Plant condensate
IEA 2019. All rights reserved
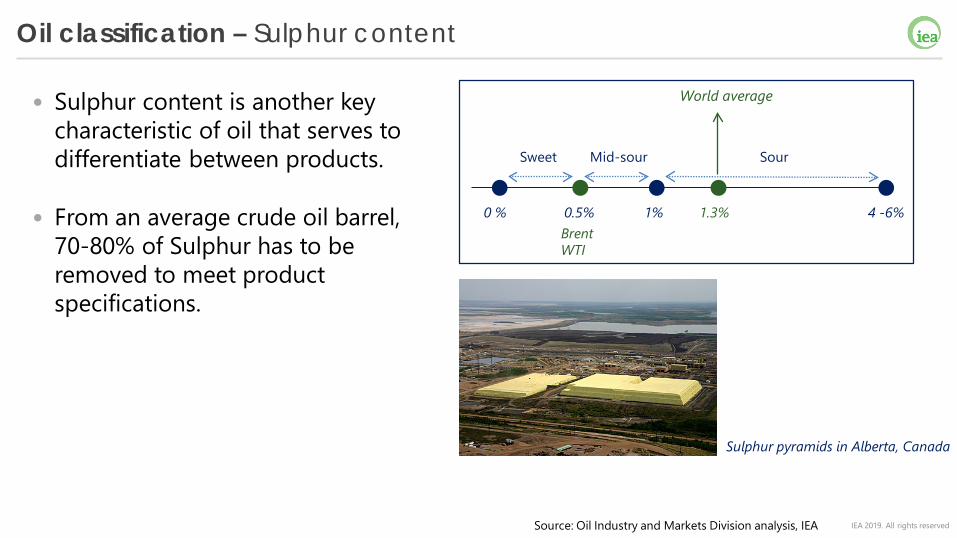
Oil classification – Sulphur content
• Sulphur content is another key characteristic of oil that serves to differentiate between products.
• From an average crude oil barrel, 70-80% of Sulphur has to be removed to meet product specifications.
0.5%
Sour
0 % 1% 4 -6%
Sweet Mid-sour
World average
1.3%BrentWTI
Source: Oil Industry and Markets Division analysis, IEA
Sulphur pyramids in Alberta, Canada
IEA 2019. All rights reserved
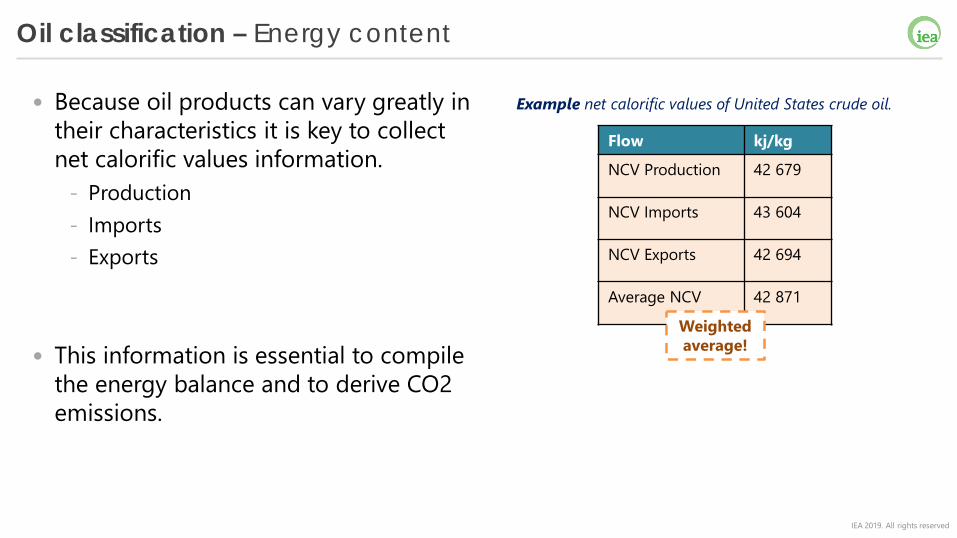
Oil classification – Energy content
• Because oil products can vary greatly in their characteristics it is key to collect net calorific values information.
- Production- Imports- Exports
Example net calorific values of United States crude oil.
Flow kj/kg
NCV Production 42 679
NCV Imports 43 604
NCV Exports 42 694
Average NCV 42 871
Weighted average!• This information is essential to compile
the energy balance and to derive CO2 emissions.
IEA 2019. All rights reserved
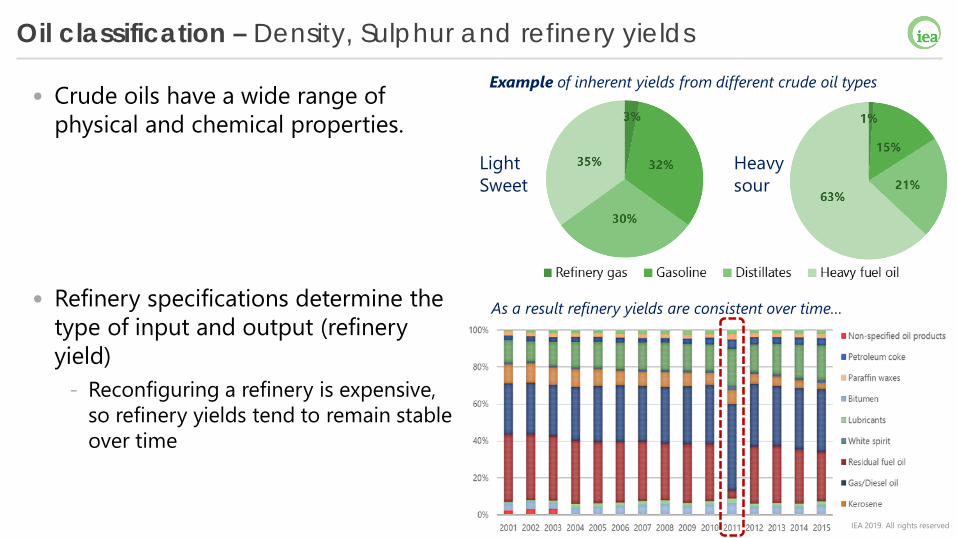
Oil classification – Density, Sulphur and refinery yields
• Crude oils have a wide range of physical and chemical properties.
• Refinery specifications determine the type of input and output (refinery yield)
- Reconfiguring a refinery is expensive, so refinery yields tend to remain stable over time
Example of inherent yields from different crude oil types
LightSweet
Heavy sour
As a result refinery yields are consistent over time…
IEA 2019. All rights reserved
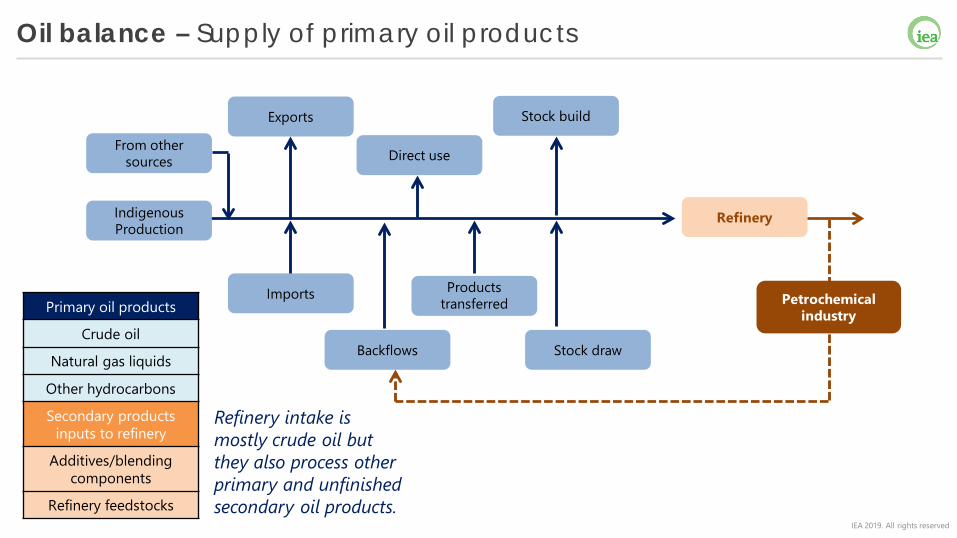
Oil balance – Supply of primary oil products
Indigenous Production
From other sources
Imports
Exports
Backflows
Products transferred
Direct use
Stock build
Stock draw
Refinery
Petrochemical industryPrimary oil products
Crude oil
Natural gas liquids
Other hydrocarbons
Secondary products inputs to refinery
Additives/blending components
Refinery feedstocks
Refinery intake is mostly crude oil but they also process other primary and unfinished secondary oil products.
IEA 2019. All rights reserved
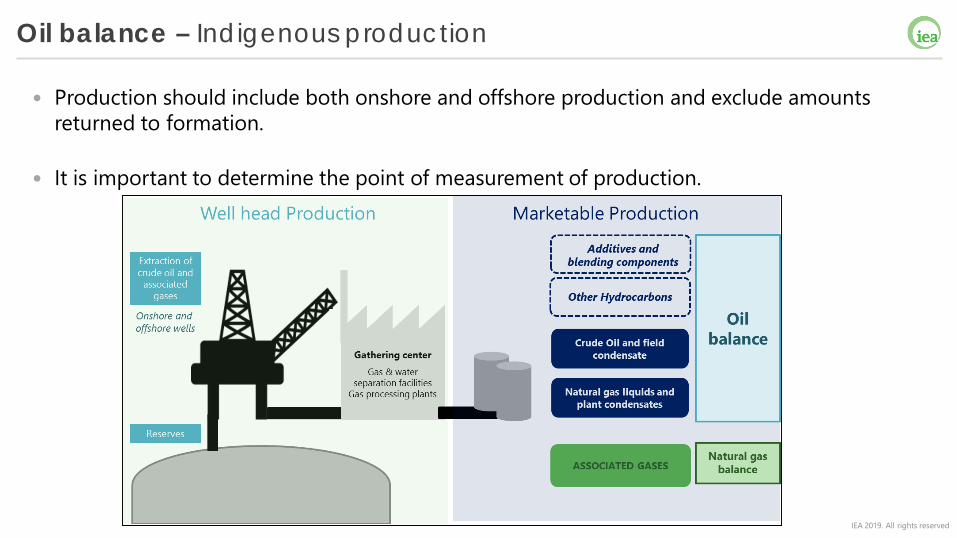
Oil balance – Indigenous production
• Production should include both onshore and offshore production and exclude amounts returned to formation.
• It is important to determine the point of measurement of production.
IEA 2019. All rights reserved
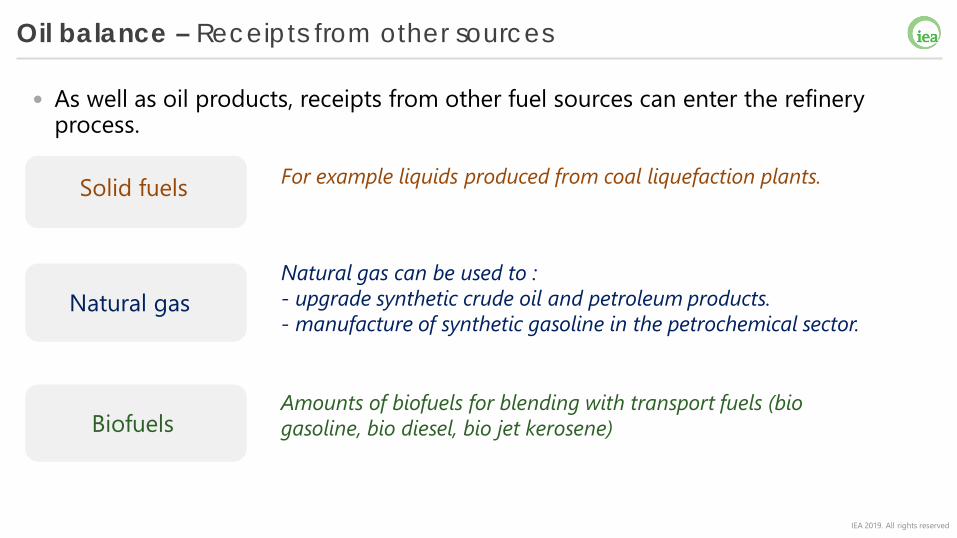
Oil balance – Receipts from other sources
• As well as oil products, receipts from other fuel sources can enter the refinery process.
Solid fuels For example liquids produced from coal liquefaction plants.
Natural gasNatural gas can be used to :- upgrade synthetic crude oil and petroleum products.- manufacture of synthetic gasoline in the petrochemical sector.
BiofuelsAmounts of biofuels for blending with transport fuels (bio gasoline, bio diesel, bio jet kerosene)
IEA 2019. All rights reserved
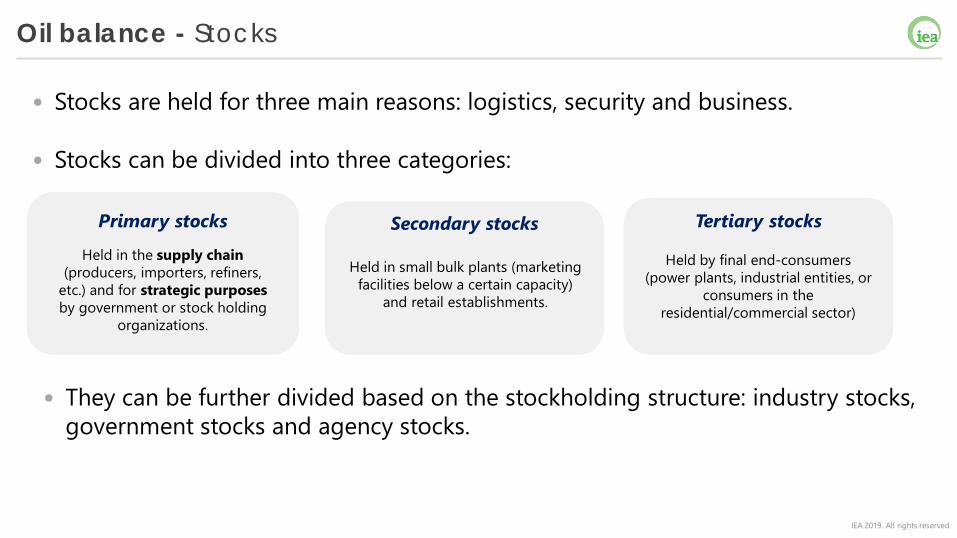
Oil balance - Stocks
• Stocks are held for three main reasons: logistics, security and business.
• Stocks can be divided into three categories:
Primary stocks
Held in the supply chain (producers, importers, refiners,
etc.) and for strategic purposes by government or stock holding
organizations.
Secondary stocks
Held in small bulk plants (marketing facilities below a certain capacity)
and retail establishments.
Tertiary stocks
Held by final end-consumers (power plants, industrial entities, or
consumers in the residential/commercial sector)
• They can be further divided based on the stockholding structure: industry stocks, government stocks and agency stocks.
IEA 2019. All rights reserved
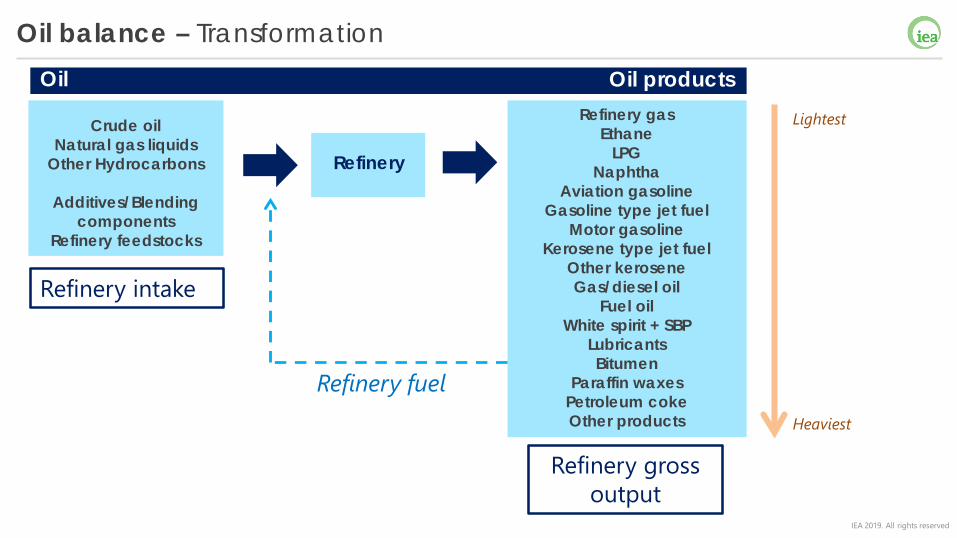
Oil balance – TransformationOil
Crude oilNatural gas liquids
Other Hydrocarbons
Additives/Blending components
Refinery feedstocks
Lightest
Heaviest
Refinery gasEthane
LPGNaphtha
Aviation gasolineGasoline type jet fuel
Motor gasolineKerosene type jet fuel
Other keroseneGas/diesel oil
Fuel oilWhite spirit + SBP
LubricantsBitumen
Paraffin waxesPetroleum cokeOther products
Refinery
Oil products
Refinery intake
Refinery gross output
Refinery fuel
IEA 2019. All rights reserved
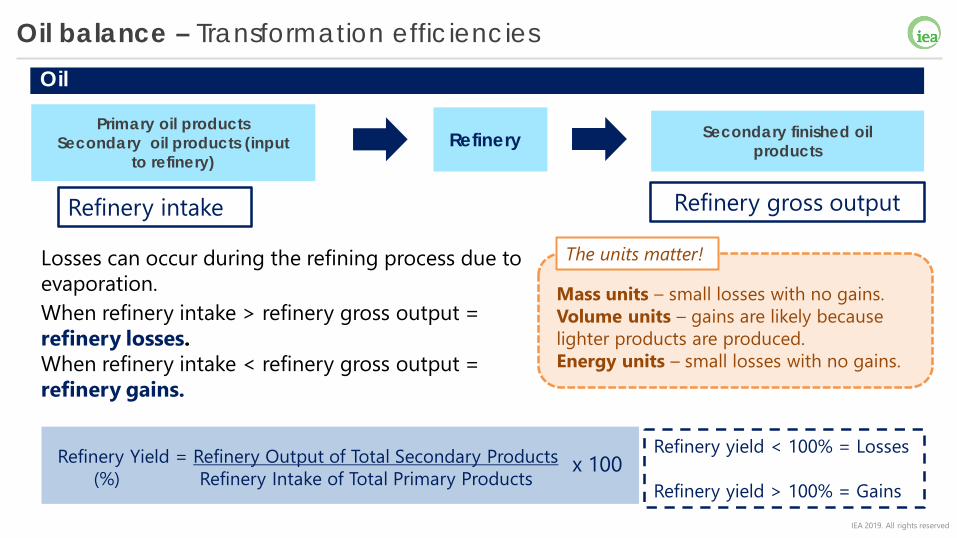
Oil balance – Transformation efficiencies
Losses can occur during the refining process due to evaporation.
The units matter!
Mass units – small losses with no gains.Volume units – gains are likely because lighter products are produced.Energy units – small losses with no gains.
Refinery Yield = Refinery Output of Total Secondary Products(%) Refinery Intake of Total Primary Products
x 100Refinery yield < 100% = Losses
Refinery yield > 100% = Gains
Oil
Primary oil productsSecondary oil products (input
to refinery)
Secondary finished oil productsRefinery
When refinery intake > refinery gross output =refinery losses.When refinery intake < refinery gross output =refinery gains.
Refinery intake Refinery gross output
IEA 2019. All rights reserved
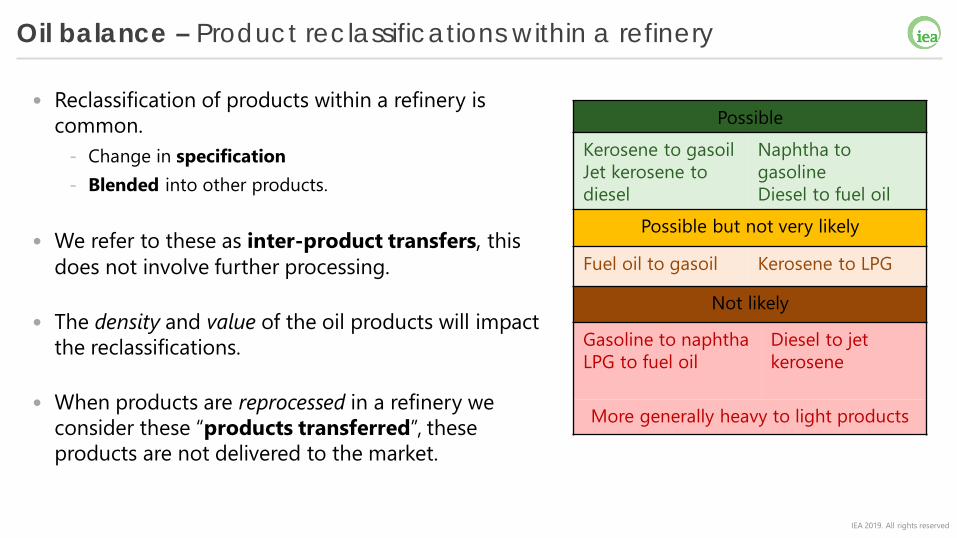
Oil balance – Product reclassifications within a refinery
• Reclassification of products within a refinery is common.
- Change in specification- Blended into other products.
• We refer to these as inter-product transfers, this does not involve further processing.
• The density and value of the oil products will impact the reclassifications.
• When products are reprocessed in a refinery we consider these “products transferred”, these products are not delivered to the market.
PossibleKerosene to gasoilJet kerosene to diesel
Naphtha to gasolineDiesel to fuel oil
Possible but not very likely
Fuel oil to gasoil Kerosene to LPG
Not likely
Gasoline to naphthaLPG to fuel oil
Diesel to jet kerosene
More generally heavy to light products
IEA 2019. All rights reserved
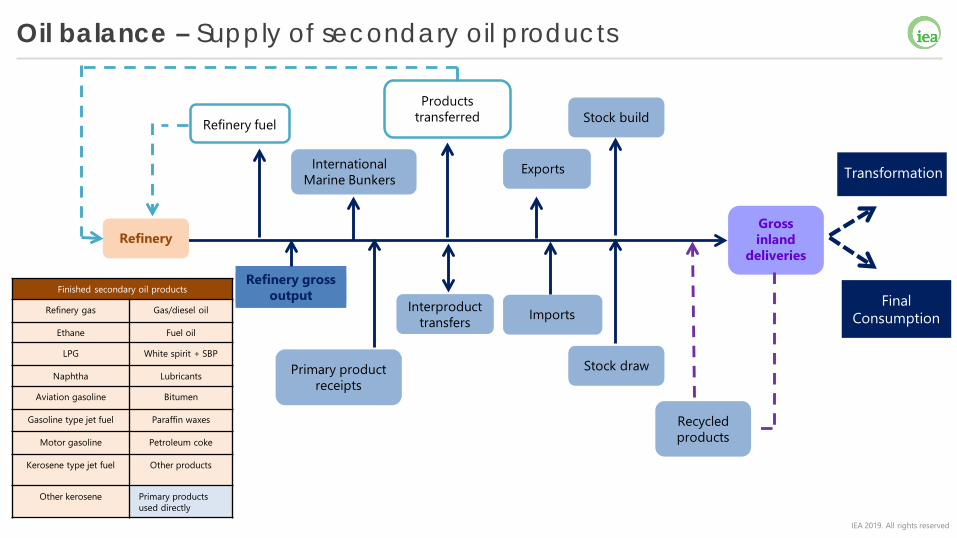
Oil balance – Supply of secondary oil products
Finished secondary oil products
Refinery gas Gas/diesel oil
Ethane Fuel oil
LPG White spirit + SBP
Naphtha Lubricants
Aviation gasoline Bitumen
Gasoline type jet fuel Paraffin waxes
Motor gasoline Petroleum coke
Kerosene type jet fuel Other products
Other kerosene Primary products used directly
Refinery gross output
Imports
International Marine Bunkers
Recycled products
Interproduct transfers
Exports
Products transferred
Stock draw
Refinery
Primary product receipts
Stock buildRefinery fuel
Gross inland
deliveries
FinalConsumption
Transformation
IEA 2019. All rights reserved
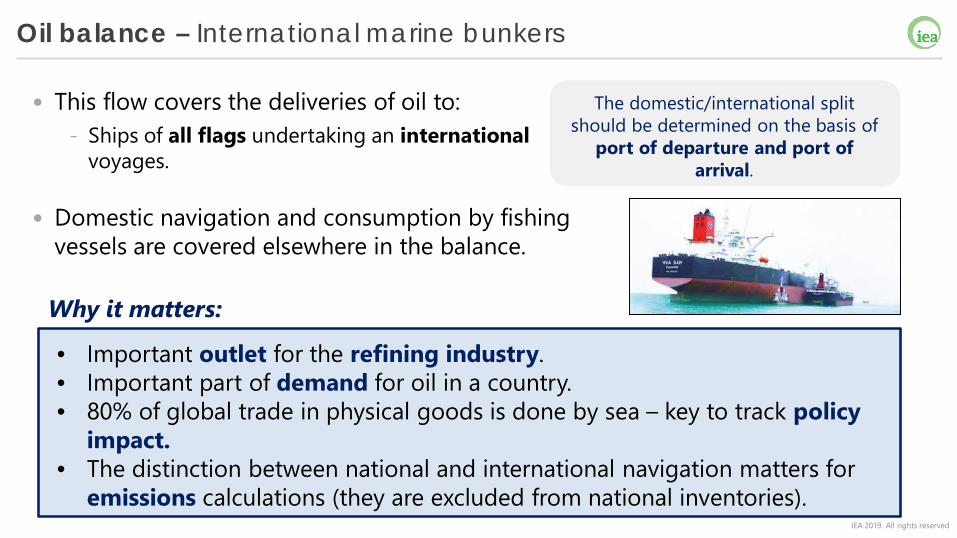
Oil balance – International marine bunkers
• This flow covers the deliveries of oil to:- Ships of all flags undertaking an international
voyages.
• Domestic navigation and consumption by fishing vessels are covered elsewhere in the balance.
The domestic/international split should be determined on the basis of
port of departure and port of arrival.
• Important outlet for the refining industry.• Important part of demand for oil in a country.• 80% of global trade in physical goods is done by sea – key to track policy
impact. • The distinction between national and international navigation matters for
emissions calculations (they are excluded from national inventories).
Why it matters:
IEA 2019. All rights reserved
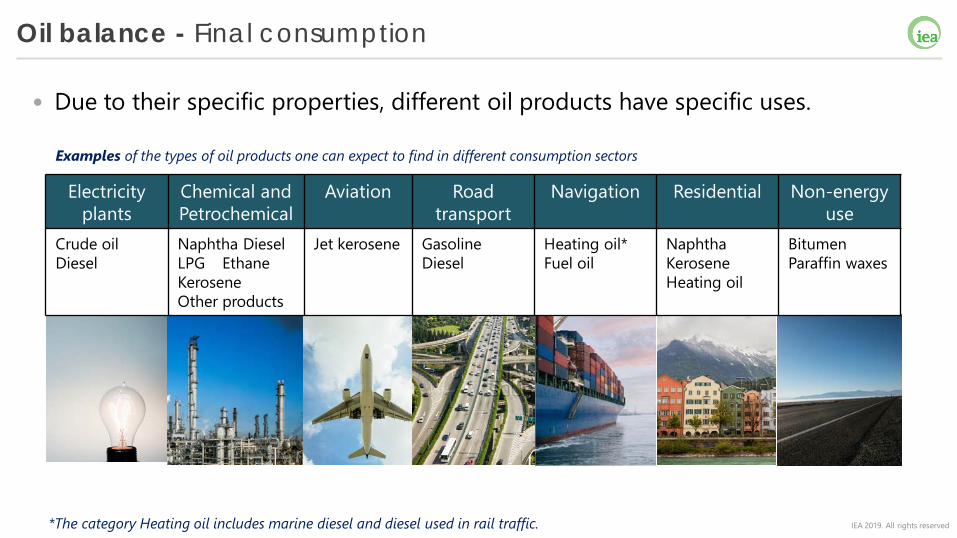
Oil balance - Final consumption
• Due to their specific properties, different oil products have specific uses.
Electricity plants
Chemical and Petrochemical
Aviation Road transport
Navigation Residential Non-energy use
Crude oilDiesel
Naphtha DieselLPG EthaneKerosene Other products
Jet kerosene GasolineDiesel
Heating oil*Fuel oil
NaphthaKeroseneHeating oil
BitumenParaffin waxes
Examples of the types of oil products one can expect to find in different consumption sectors
*The category Heating oil includes marine diesel and diesel used in rail traffic.
IEA 2019. All rights reserved
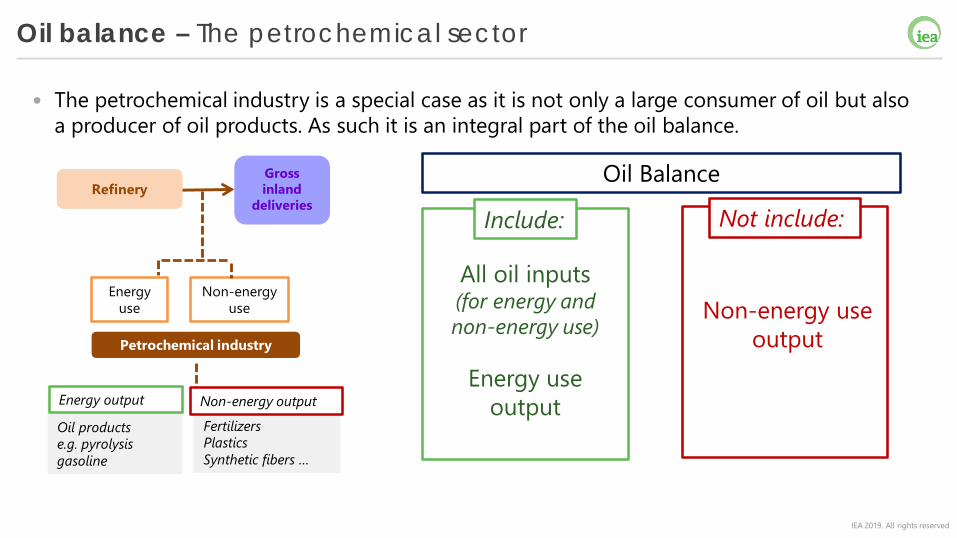
Oil balance – The petrochemical sector
• The petrochemical industry is a special case as it is not only a large consumer of oil but also a producer of oil products. As such it is an integral part of the oil balance.
FertilizersPlasticsSynthetic fibers …
Petrochemical industry
RefineryGross inland
deliveries
Energy use
Non-energy use
Non-energy output
Oil productse.g. pyrolysis gasoline
Energy output
Oil Balance
Not include:Include:
All oil inputs(for energy and non-energy use)
Energy use output
Non-energy use output
IEA 2019. All rights reserved
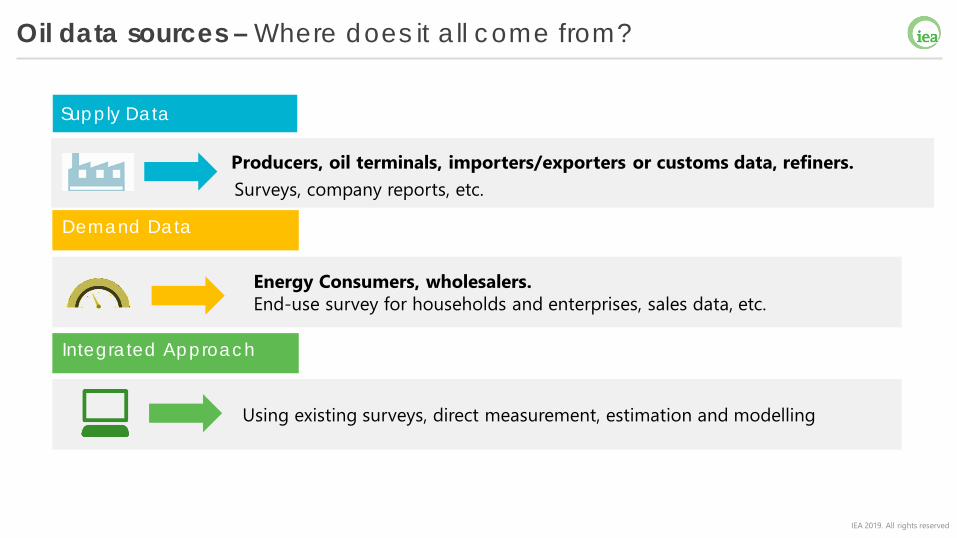
Oil data sources – Where does it all come from?
Integrated Approach
Using existing surveys, direct measurement, estimation and modelling
Demand Data
Energy Consumers, wholesalers.End-use survey for households and enterprises, sales data, etc.
Supply Data
Producers, oil terminals, importers/exporters or customs data, refiners. Surveys, company reports, etc.
IEA 2019. All rights reserved
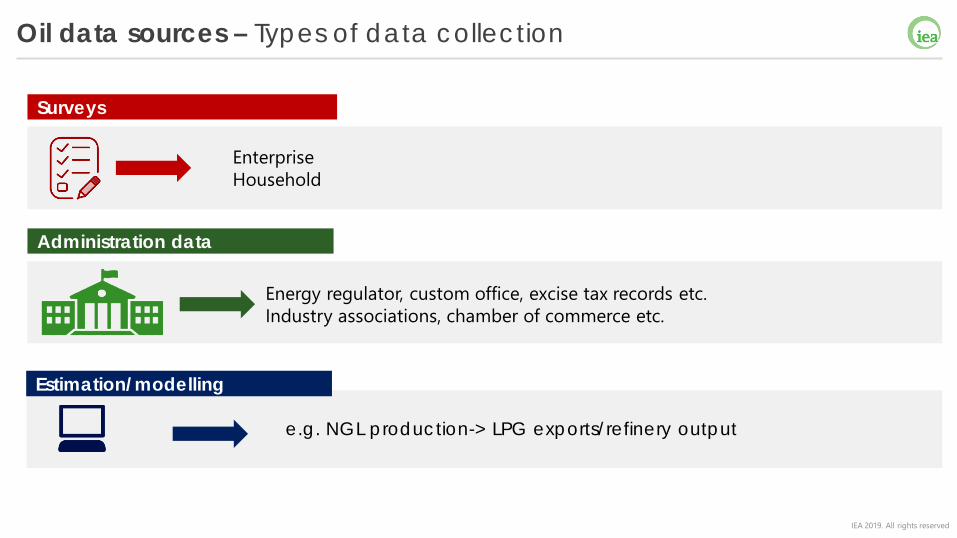
Oil data sources – Types of data collection
Enterprise Household
Surveys
Energy regulator, custom office, excise tax records etc.Industry associations, chamber of commerce etc.
Administration data
Estimation/modelling
e.g. NGL production-> LPG exports/refinery output
IEA 2019. All rights reserved
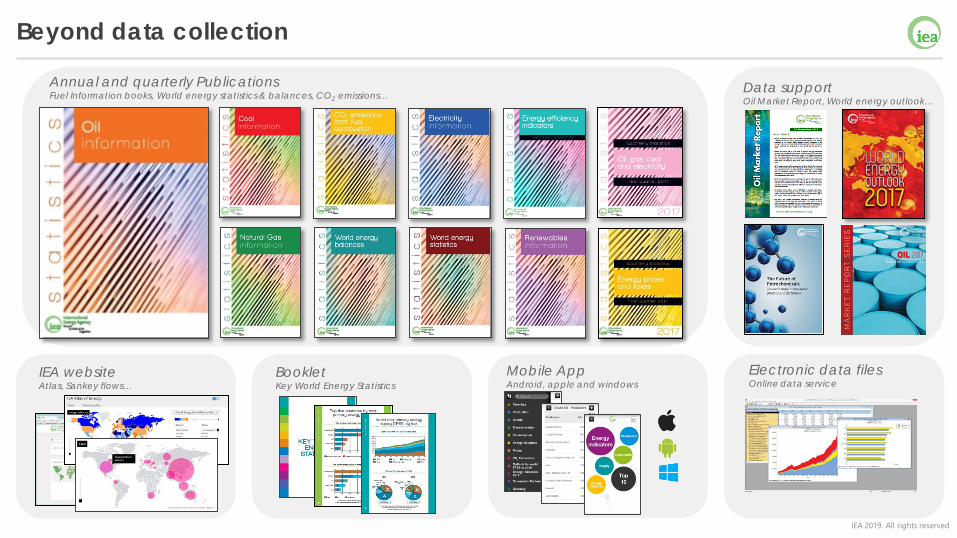
Beyond data collection
Annual and quarterly PublicationsFuel Information books, World energy statistics & balances, CO2 emissions…
Electronic data filesOnline data service
IEA websiteAtlas, Sankey flows…
BookletKey World Energy Statistics
Data support Oil Market Report, World energy outlook…
Mobile AppAndroid, apple and windows

IEA 2019. All rights reserved
Key points for reporting monthly oil
IEA 2019. All rights reserved
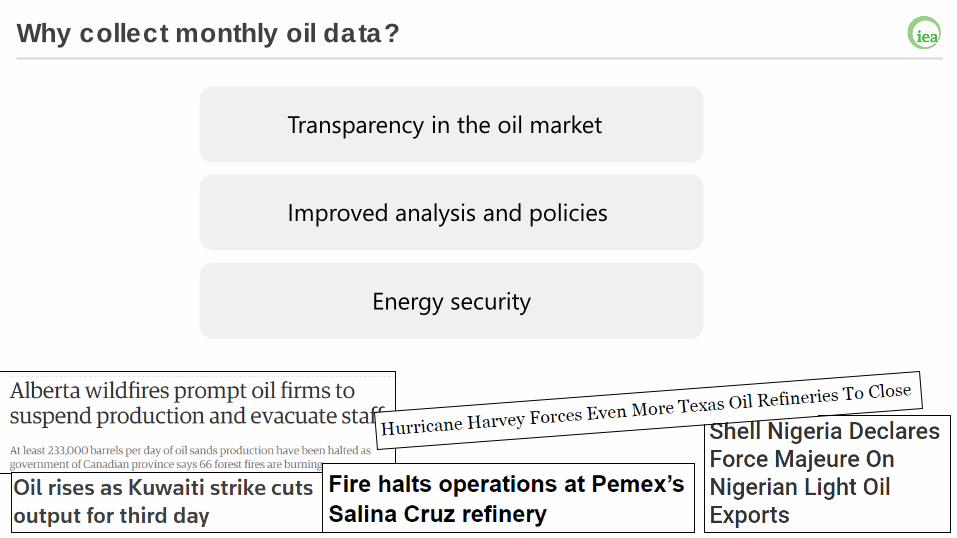
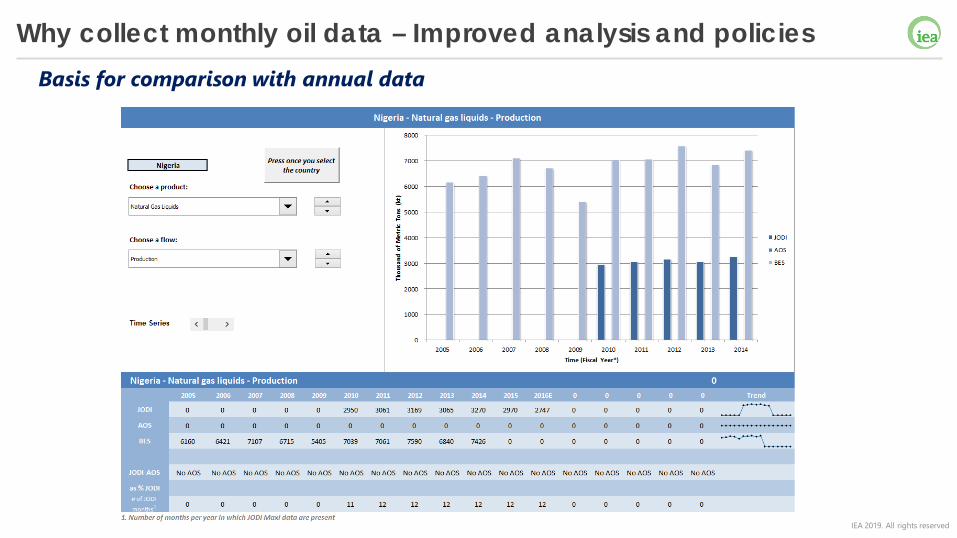
Why collect monthly oil data?
Improved analysis and policies
Transparency in the oil market
Energy security
IEA 2019. All rights reserved
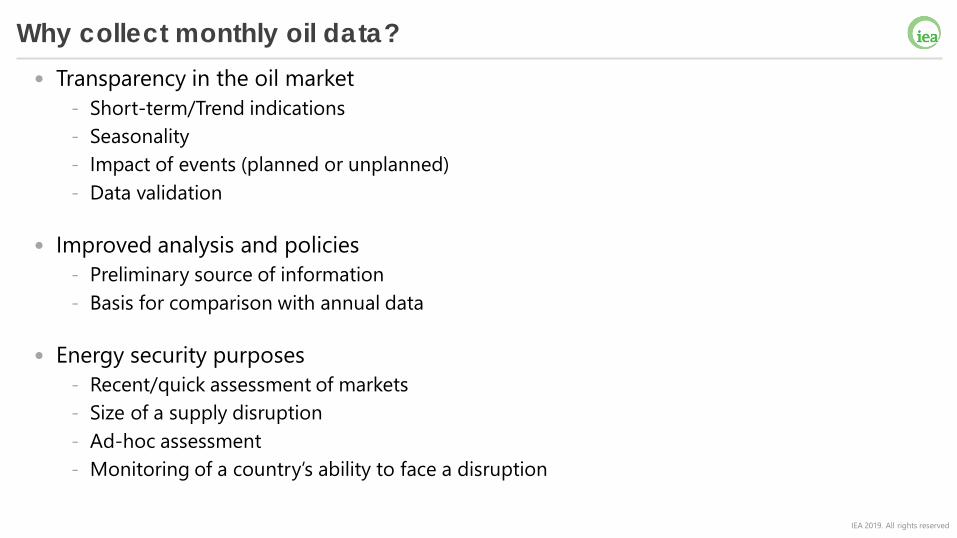
Why collect monthly oil data?• Transparency in the oil market
- Short-term/Trend indications- Seasonality- Impact of events (planned or unplanned)- Data validation
• Improved analysis and policies- Preliminary source of information- Basis for comparison with annual data
• Energy security purposes- Recent/quick assessment of markets- Size of a supply disruption- Ad-hoc assessment- Monitoring of a country’s ability to face a disruption
IEA 2019. All rights reserved
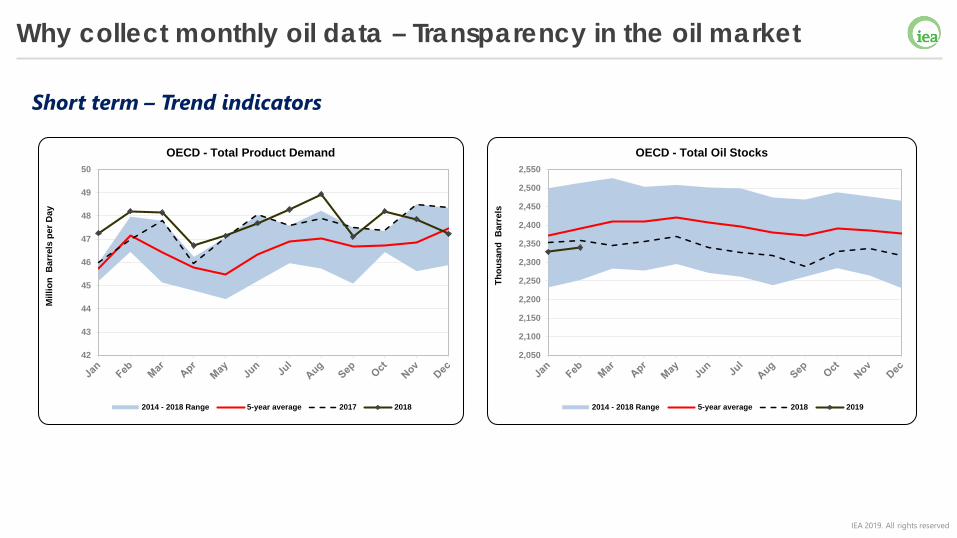
Why collect monthly oil data – Transparency in the oil market
Short term – Trend indicators
42
43
44
45
46
47
48
49
50
Mill
ion
Bar
rels
per
Day
OECD - Total Product Demand
2014 - 2018 Range 5-year average 2017 2018
2,050
2,100
2,150
2,200
2,250
2,300
2,350
2,400
2,450
2,500
2,550
Thou
sand
Bar
rels
OECD - Total Oil Stocks
2014 - 2018 Range 5-year average 2018 2019
IEA 2019. All rights reserved
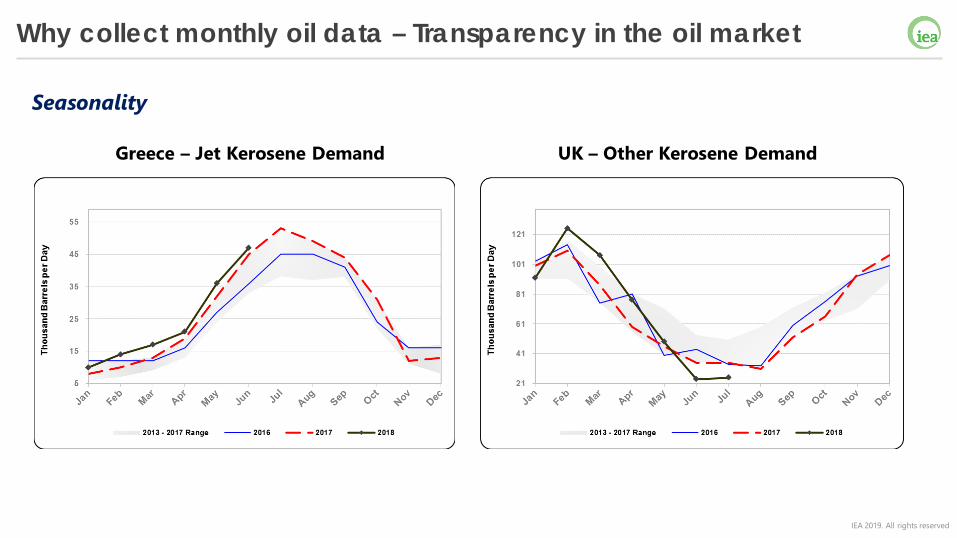
Why collect monthly oil data – Transparency in the oil market
Seasonality
Greece – Jet Kerosene Demand UK – Other Kerosene Demand
IEA 2019. All rights reserved
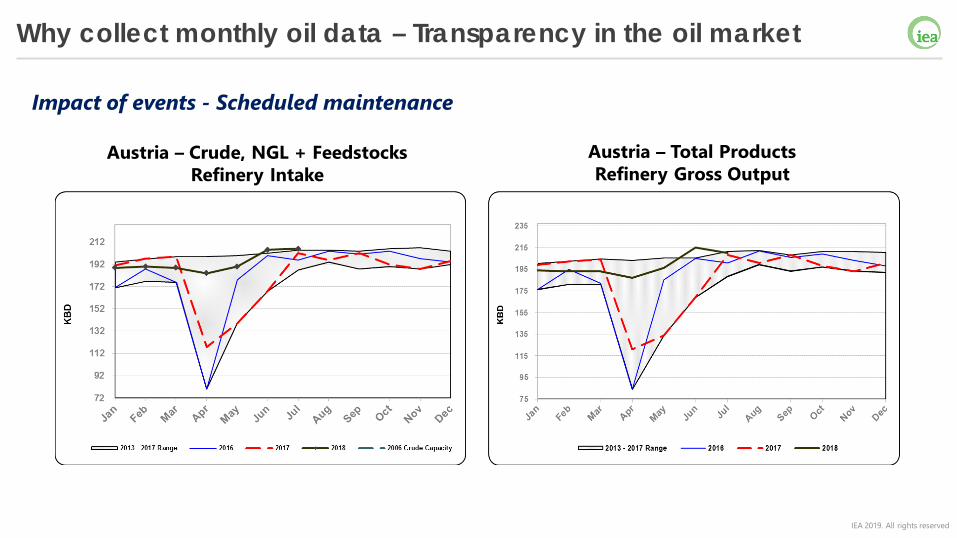
Why collect monthly oil data – Transparency in the oil market
Impact of events - Scheduled maintenance
Austria – Crude, NGL + Feedstocks Refinery Intake
Austria – Total Products Refinery Gross Output
IEA 2019. All rights reserved
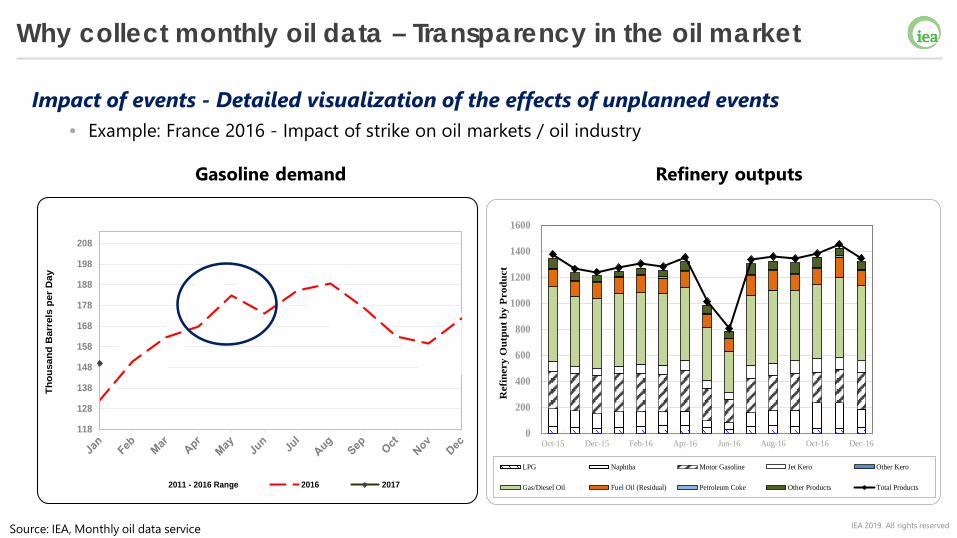
Why collect monthly oil data – Transparency in the oil market
Impact of events - Detailed visualization of the effects of unplanned events• Example: France 2016 - Impact of strike on oil markets / oil industry
0
200
400
600
800
1000
1200
1400
1600
Oct-15 Dec-15 Feb-16 Apr-16 Jun-16 Aug-16 Oct-16 Dec-16
Ref
iner
y O
utpu
t by
Prod
uct
LPG Naphtha Motor Gasoline Jet Kero Other Kero
Gas/Diesel Oil Fuel Oil (Residual) Petroleum Coke Other Products Total Products
118
128
138
148
158
168
178
188
198
208
Thou
sand
Bar
rels
per
Day
2011 - 2016 Range 2016 2017
Gasoline demand Refinery outputs
Source: IEA, Monthly oil data service
IEA 2019. All rights reserved
Why collect monthly oil data – Transparency in the oil market
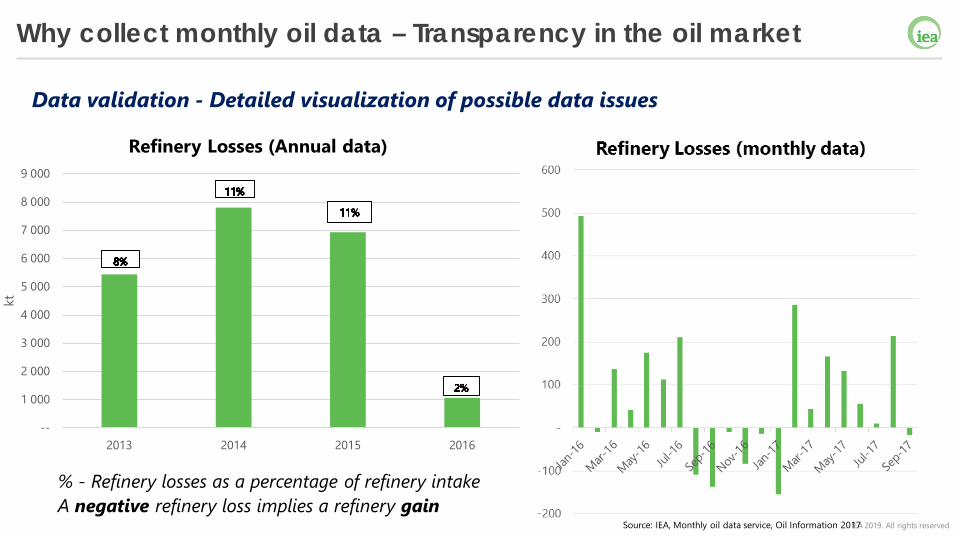
A negative refinery loss implies a refinery gainSource: IEA, Monthly oil data service, Oil Information 2017
--
1 000
2 000
3 000
4 000
5 000
6 000
7 000
8 000
9 000
2013 2014 2015 2016
kt
Refinery Losses (Annual data)
% - Refinery losses as a percentage of refinery intake
Data validation - Detailed visualization of possible data issues
IEA 2019. All rights reserved
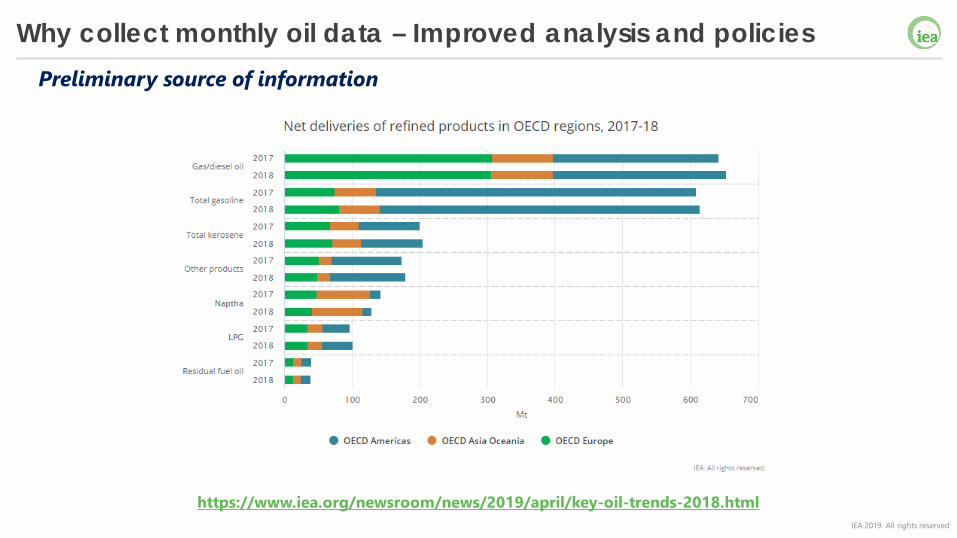
Why collect monthly oil data – Improved analysis and policiesPreliminary source of information
https://www.iea.org/newsroom/news/2019/april/key-oil-trends-2018.html
IEA 2019. All rights reserved
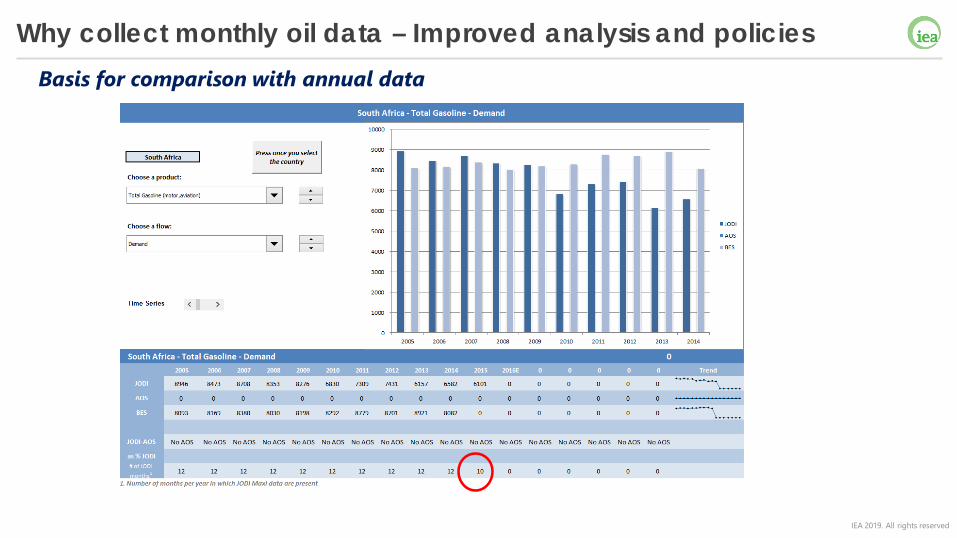
Why collect monthly oil data – Improved analysis and policiesBasis for comparison with annual data
IEA 2019. All rights reserved
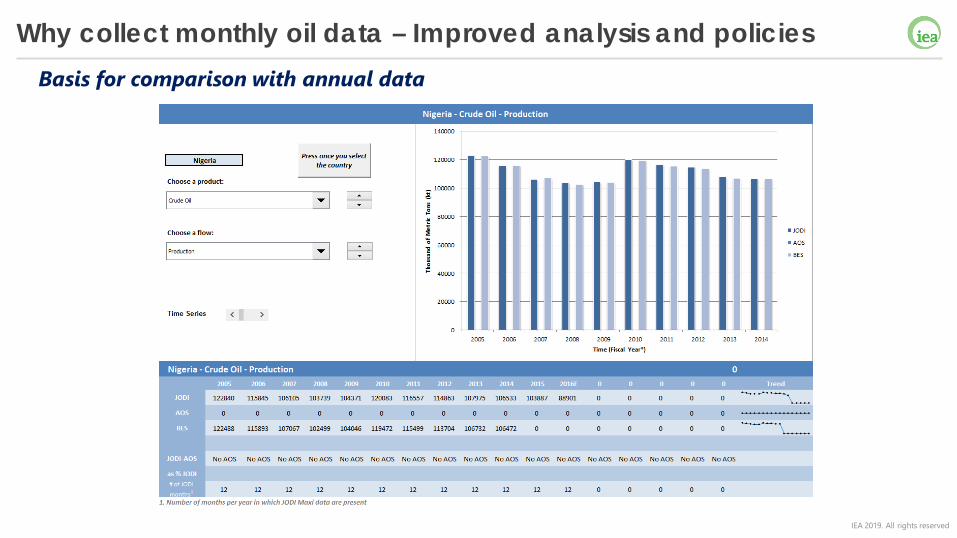
Why collect monthly oil data – Improved analysis and policiesBasis for comparison with annual data
IEA 2019. All rights reserved
Why collect monthly oil data – Improved analysis and policiesBasis for comparison with annual data
IEA 2019. All rights reserved
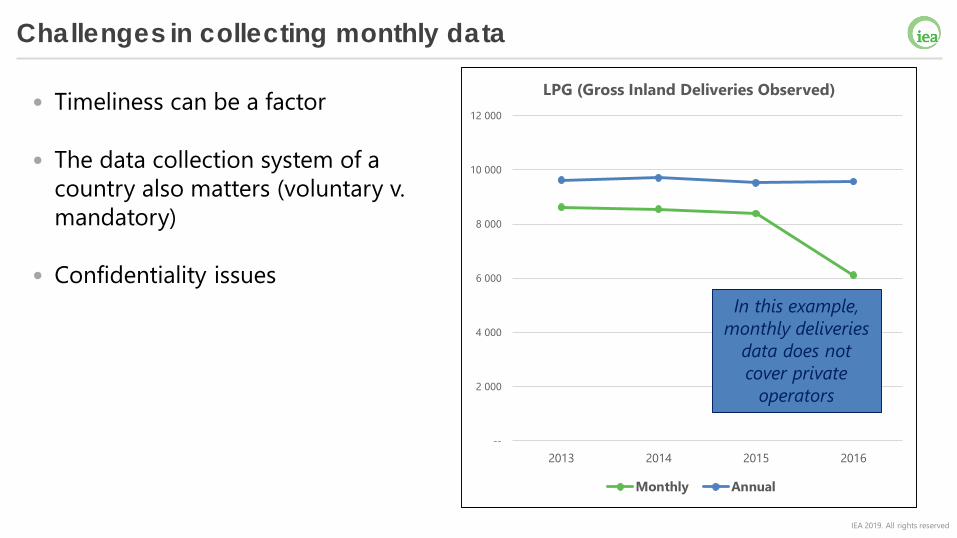
Challenges in collecting monthly data
• Timeliness can be a factor
• The data collection system of a country also matters (voluntary v. mandatory)
• Confidentiality issues
--
2 000
4 000
6 000
8 000
10 000
12 000
2013 2014 2015 2016
LPG (Gross Inland Deliveries Observed)
Monthly Annual
In this example, monthly deliveries
data does not cover private
operators

IEA 2019. All rights reserved
www.iea.org