Embed Size (px)
Citation preview

Cruise Report for ARSV LM Gould (LMG 11-10)
November 2 – December 1, 2011
Authors: A. Bucklin, J.D. Warren, P.H. Wiebe, and P.G. Batta-Lona
Submitted by Ann Bucklin, University of Connecticut LMG11-10 Chief Scientist and Project P.I. for B-285-L
December 6, 2011
LMG11-10 Cruise Report – December 6, 2011 Page 1

LMG11-10 Cruise Photo – November 30, 2011
Left to right: (back row): Jullie Jackson, Alan Shaw, Chelsea Stanley, Kris Merrill, Krista Tyburski, Melissa Paddock, Joe Warren, Charles (Mike) Epperson, George Aukon. Front row: Melissa Patrician, Kelley Watson, Paola Batta-Lona, Melissa Mazzocco, Kari Anderson, Iva Neveux, Katharine Wurtzell, Ann Bucklin, Peter Wiebe, Austin Gajewski, Bethany Goodrich.
Acknowledgments: We would like to express our sincere appreciation and gratitude for the assistance and support of the LM GOULD Captain and crew, Raytheon Polar Support Co. science support team, Palmer Station manager and residents, and all our shipmates on cruise LMG11-10.
LMG11-10 Cruise Report – December 6, 2011 Page 2

LMG11-10 Cruise Report – December 6, 2011 Page 3
TABLE of CONTENTS
I. Introduction and Cruise Overview ........................................................................................ 4
II. Cruise Plan........................................................................................................................... 6
III. LMG11-10 Cruise Narrative................................................................................................. 9
IV. Cruise Operat ions and Scientific Protocols ....................................................................... 291) XBT Transect ....................................2) Meteorological Data
...............................................................................................................................29
3) Underway Seawater ....................................................................................................................................................29Sampli
4) MOCNESS Oper ng ...............................................................................................................................31
3) Isaac Kidd Mid ation ....................................................................................................................................................33
4) Hand Net Tow water Trawl .....................................................................................................................................37
s............................5) CTD Cast Data ..............................
....................................................................................................................................39....................................................................................................................................396) CTD Rosette Water Samples....................................................................................................................................40
V. Individual Project Reports ....... .......................................................................................... 421) Project B-285-L (Ann Bucklin) ..............................................................................................................................422) Project B-393-L (Joe Warren) ................................................................................................................................44
VI. Additional Activities and Findings...... ............................................................................... 491) Visual Strip Transect of Flandres Bay ................. ..................2) Hydrographic Section along Bransfield Strait ..................
............................................................................49............................................................................493) Antarctic Circumpolar Current Hydrographic Section ............................................................................51
VII. LMG11-10 participants: ................................................................................................... 54
Appendix I. LM Gould Cruise LMG11-10 Event Log................................................................. 56
Appendix II. Summary of MOCNESS Tow Data....................................................................... 67
Appendix III. Flash-frozen Krill Specimens ............................................................................. 72
Appendix IV. CTD Cast Summary. .......................................................................................... 73

LMG11-10 Cruise Report – December 6, 2011 Page 4
I. Introduction and Cruise Overview Cruise LMG11-10 supported Palmer Station, the seasonal opening of the Cape Shirreff marine mammal research facility, and two NSF-funded primary research projects (described below; see Table 1). These two projects operated in close collaboration, and the term “Salp Survey” was used in reference to both collectively. Dr. Ann Bucklin, the PI for project B-285-L, was designated as Chief Scientist for the cruise. This meant that, in addition to her own research project, Dr. Bucklin had the added responsibility of ensuring that all other projects on the cruise were given appropriate support. Primary Science Projects Project B-285-L: Population Ecology of Salpa thompsoni based on Molecular Indicators. PI: Dr. Ann Bucklin, University of Connecticut Science objectives: The overall objectives of this effort were to examine genome-wide patterns of gene expression, target gene expression levels, and patterns of population genetic diversity and structure of the Antarctic salp, Salpa thompsoni in relation to biological and physical environmental parameters in the Western Antarctic Peninsula region. Major activities: Sampling from shelf and oceanic waters between 0 and 2,500 meters took place at selected stations using a 1-m2 MOCNESS to characterize the planktonic assemblage. A Reeve net was also on hand to collect live material for molecular and biochemical analysis, but was not used. Environmental parameters measured include standard hydrographic variables (temperature, salinity, depth), as well as fluorescence and turbidity. Water samples were collected using a CTD rosette to determine nutrient and particulate concentrations and C:H:N ratios. Project B-393-L: Acoustic Assessment of Southern Ocean Salps and their Ecosystem PI: Dr. Joseph Warren, Stony Brook University Science objectives: To collect live specimens of salps and other zooplankton to conduct experiments to improve our ability to use acoustic techniques to estimate the distribution and abundance of these organisms. In addition, environmental sampling and acoustic backscatter measurements were made throughout the survey. Major activities: Zooplankton samples were collected from approximately 25 stations via net tow, maintained in ship-board aquaria, and acoustically-important animal parameters were measured including: body shape and size, animal density, and animal soundspeed. Multiple-frequency acoustic backscatter data were collected from several different echosounder platforms to provide information about the distribution of salps, krill, and other zooplankton.CTD casts were conducted to characterize the hydrography of the survey area, with water samples size-fractionated for analysis of chlorophyll content.

Cape Shirreff Opening The seasonal opening of the NOAA/AMLR marine mammal research facility on Cape Shirreff, Livingston Island was the first objective on the cruise schedule. Cape Shirreff is designated ASPA 149 (Antarctic Specially Protected Area 149) under the Antarctic Conservation Act; RPSC’s opening activities are authorized under ACA permit #2011-12, for which a report of opening activities must be submitted to NSF. Opening operations usually entail the Zodiac offload and subsequent shore transport of cargo (food, fuel, and scientific equipment), plus whatever snow and ice mitigation is needed to open the facility, plus the disembarkation of the Cape Shirreff researchers (identified in the following section). This activity generally takes between a half day and a full day under good conditions, but is highly weather-dependent. Opening operations are highly labor-intensive, and all personnel are usually encouraged to participate. A separate report of this activity was submitted directly to the responsible parties; no additional information of this event is included here. NOAA Field Camp Pick-Up On the northbound transit to Punta Arenas, the LMG made a short stop at the NOAA field camp known as ‘Copa’ on the west side of Admiralty Bay, King George Island to pick up NOAA grantee Susan Trivelpiece. Any empty propane cylinders and accumulated trash were picked up at the same time. Copa is within ASPA 129; RPSC’s opening activities are authorized under ACA permit #2011-05, for which a report of opening activities must be submitted to NSF; no additional information of this event is included in this report.
Table 1. Cruise schedule for LMG11-10, including operational and scientific mission objectives and time-line.
.
Cruise Schedule
Day Date Activity / Comment 1 Nov 2 Depart Punta Arenas for Cape Shirreff (transit is 3 days) 2-4 Nov 3-5 In transit; arrive Cape Shirreff PM day 4 5 Nov 6 Open Cape Shirreff; depart for Palmer PM day 5 6 Nov 7 In Transit; Salp Survey en route (transit is1 day) 7 Nov 8 Arrive Palmer PM 8-9 Nov 9-10 At Palmer; depart day 9 for salp survey 10-25 Nov 11-26 Salp Survey; return to Palmer PM day 25 26 Nov 27 At Palmer Station; depart PM day 26 for Copa 27 Nov 28 PM stop at Copa; depart for Punta Arenas 28-29 Nov 29-30 In Transit to Punta Arenas 30 Dec 1 PM Arrive Punta Arenas
LMG11-10 Cruise Report – December 6, 2011 Page 5

LMG11-10 Cruise Report – December 6, 2011 Page 6
II. Cruise Plan The “Salp Survey” cruise plan entails sampling from a range of habitats in the Western Antarctic Peninsula (WAP) region, with collections from both shelf and oceanic waters between 0 and 2,500 m. The cruise plan and station locations were designed by consensus by the P.I.s of both projects and reflected our best effort to meet the goals and objectives of both projects. Our target areas included waters in the vicinity of Bransfield Strait, continental shelf waters west of Anvers Island, shelf and shelf break waters west of the South Shetland Islands, and the deep ocean waters off the shelf (Figs. 1 and 2). Sampling was also designed for selected stations of the Palmer LTER grid, as well as at sites to the north and farther offshore. The rationale for the field collecting plan included: 1) collection of salps by Joe Warren during LMG10-10 (December 2010) as part of his NSF-funded project; 2) records of salp distribution and abundance from analysis of zooplankton samples from the Palmer LTER project; and 3) an opportunistic, bet-hedging approach to encountering the notoriously-variable occurrence of dense salp populations by sampling from shelf, shelf slope, and offshore regions. In particular, high densities of salps are known to occur regularly in deep waters off the continental shelf, where there are established populations. Salps occur intermittently in Bransfield Strait and at LTER stations on the shelf, where newly-established populations may be sampled. Station plan: At each station, a standard set of deployments included one CTD cast with Niskin bottle water sampling to a depth of 750 m or the bottom (estimated time ~ 1 hr); one 1-m2 MOCNESS cast to 1000m (~ 4 hr); and one IKMT tow to 175 m (~ 1 hr). Net tows were done at night (dark) when logistically possible, but did not delay station operations to ensure this. Small boat (Zodiac) operations: Small boat operations were carried out opportunistically and on a site-specific basis. These included hand-net or bucket collection of salps and small-scale acoustic surveys. Estimated time for each small boat operation was 6 hrs. Eight operations were planned throughout the cruise. Deep MOC-1 tows: MOCNESS tows were carried out to near-bottom depth (2,500 m) at deep offshore stations. Estimated time for each tow was ~7 hrs. Deep MOC-1 tows were planned to be conducted at four offshore stations. Acoustic Towfish: The Biosonics towfish was deployed for survey transects between stations for a 2 hour period at a speed of ~ 5 knots, depending on sea state, presence of animals in net tows, ice conditions, etc. The timing and duration of these tows changed due to shipboard operations and the station schedule. Station Locations: The planned cruise track included 24 stations, each with a standard array of deployments; 8 sites for small boat operations; and 4 deep MOCNESS tows. Our cruise plan was designed based on information available at this time and per RPSC estimation that time available for our use totaled 17 days (408 hrs). The course under ideal weather conditions and ship operations required 135 hrs steaming and 214 hrs station work, for a total of 355 hrs (Table 2). This left 53 hrs (2 days) for weather and other possible delays. We dropped deployments or stations as necessary to accommodate longer delays.
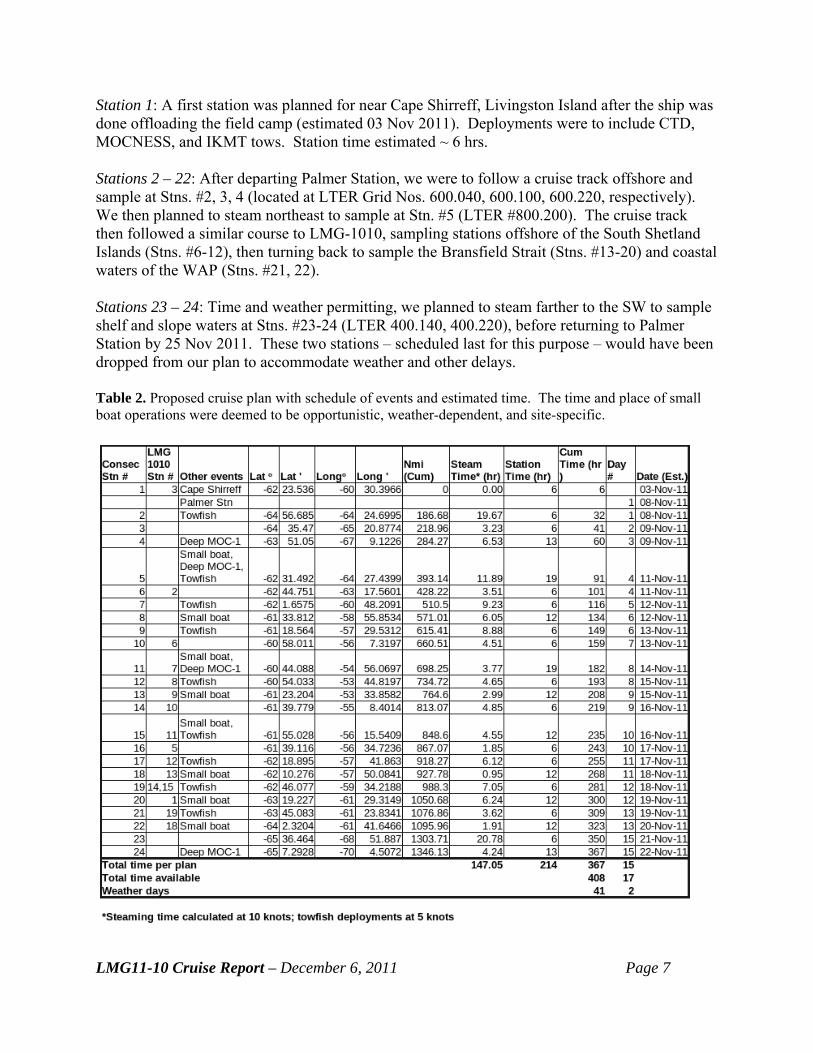
Station 1: A first station was planned for near Cape Shirreff, Livingston Island after the ship was done offloading the field camp (estimated 03 Nov 2011). Deployments were to include CTD, MOCNESS, and IKMT tows. Station time estimated ~ 6 hrs. Stations 2 – 22: After departing Palmer Station, we were to follow a cruise track offshore and sample at Stns. #2, 3, 4 (located at LTER Grid Nos. 600.040, 600.100, 600.220, respectively). We then planned to steam northeast to sample at Stn. #5 (LTER #800.200). The cruise track then followed a similar course to LMG-1010, sampling stations offshore of the South Shetland Islands (Stns. #6-12), then turning back to sample the Bransfield Strait (Stns. #13-20) and coastal waters of the WAP (Stns. #21, 22). Stations 23 – 24: Time and weather permitting, we planned to steam farther to the SW to sample shelf and slope waters at Stns. #23-24 (LTER 400.140, 400.220), before returning to Palmer Station by 25 Nov 2011. These two stations – scheduled last for this purpose – would have been dropped from our plan to accommodate weather and other delays. Table 2. Proposed cruise plan with schedule of events and estimated time. The time and place of small boat operations were deemed to be opportunistic, weather-dependent, and site-specific.
LMG11-10 Cruise Report – December 6, 2011 Page 7

Figures 1 and 2. Proposed station locations and cruise track for the LMG11-10 salp cruise. Approximate cruise track shown in red lines. Top: Consecutive station numbers; Bottom: Water column depths at station (meters). Note that steaming time between Cape Sheriff and Palmer Station (green stars) was not counted in the estimated time for Salp Survey cruise operations.
LMG11-10 Cruise Report – December 6, 2011 Page 8

LMG11-10 Cruise Report – December 6, 2011 Page 9
III. LMG11-10 Cruise Narrative Ann Bucklin, University of Connecticut LMG11-10 Chief Scientist and Project P.I. for B-285-L 01-Nov-2011 Cruise preparation The last hours before the cruise were filled with the usual intense activity. The LMG was docked in Punta Arenas, while people, personal belongings, scientific equipment and supplies, fresh food, and much more were moved aboard, stowed, and lashed down securely. Special effort for the cruise has focused on the LMG MOCNESS, for which major upgrades were done on site. Working before departure with both ETs, Peter Wiebe (WHOI and a member of the Bucklin science team) installed and tested new MOCNESS acquisition software. He also hooked in a strobe light array, an enhancement to the LMG MOC-1 system that will markedly reduce net avoidance by krill and ensure accurate sampling of krill populations. After hours of trouble-shooting with both ETs for LMG11-10, the underwater unit, strobe arrays, and options module were tested and all worked together. Additional changes were made for MOCNESS deployment (swapping winch and wire) to allow sampling to 2,500 m at deep stations. The upgrades to the LMG MOCNESS and the changes in deployment will allow characterization of the vertical distributions of salps and krill in the context of the mesozooplankton assemblage, including the deeper layers (below 1,000 m) that are frequently not sampled. The changes required considerable and concerted effort from many people, including RSPC managers, supervisors, and technicians. We are very appreciative of the outstanding effort by the RPSC support team. Another last-minute fix was to the cold van, installed on the deck for ship-board measurements and observations of living salps. An ET corrected an electrical fault and the van temperature began dropping as planned. 02-Nov-2011 Departure from Punta Arenas After a slight delay to wait for a delivery of equipment (X-ray machine) requested by Palmer Station, we got underway at 12:00 Noon and headed down the Straits of Magellan to the northeast. The first afternoon after leaving port was filled with safety briefings. All members of the science teams and the technical staff met for a review of safety procedures by the MPC and Chief Mate; we all put on life jackets and the survival suits. We then heard a briefing about the vessel life boats – and all climbed into one boat and strapped ourselves into the seats. A bit later, a lab safety briefing was given by the MST, followed by a deck safety briefing by a MT, who explained requirements for work on deck. The evening entertainment was a series of short talks by onboard scientists. Mike Goebel talked about changes in the fur seal popluations at Cape Shirreff and showed an industry-produced video about the commercial krill fishery. Ann Bucklin introduced her project on the genomics and environmental transcriptomics of salps. Paola Batta-Lona described the salp genomics work she is doing for her PhD. Peter Wiebe presented results of experiments testing the use of strobe lights on the MOCNESS for enhancing the catch of krill. Joe Warren described his acoustic studies of salps and krill and what he will do on this cruise. Throughout the evening, the weather was quite good, with 5 knot winds out of the North, giving us a comfortable ride.

03-Nov-2011 Getting our Sea Legs The science teams continued preparations for sample and data collection. Ann, Joe, and Peter talked about coordination and timing of station activities in the morning. In the afternoon, after a
fire and boat drill at 1230, the two science teams (Ann’s 285-L and Joe’s 385-L) met to discuss coordination of all planned activities. Peter pulled together an XLS spreadsheet with realistic estimates for station work and transit timing that will allow us to update and adjust our cruise planning as we go.
LMG11-10 Cruise Report – December 6, 2011 Page 10
04-Nov-2011 Crossing the Polar Front The XBT/XCTD/water watches were ongoing as we crossed the Drake Passage. The XBT and XCTD stations are spaced so we collected data every 5-6 miles. These data will be added to a time-series that the LMG has been collecting every 6 weeks for the last 5-6 years. By mid-morning, winds picked up and blew at around 25 kts, still out of 035, with 5-6 ft swells. Both wind and seas were to
our back, and our progress continued at a speedy 10-12 knts. We crossed the Polar Front and the SST dropped to 1.5o C and salinity to 33.9 PSU. The ship rolled heavily as we continued on course across the Drake Passage toward Cape Shirreff, Livingston Island (Fig. 3).
Figure 3. Chart of the Drake Passage with SST and LMG position at 1200 Nov. 4, 2011
05-Nov-2011 Waiting on Weather at Cape Shirreff A planning meeting was held at 1000 for all science and technical teams. The MPC described the overall effort of opening the observing station and the team leader, Mike Goebel, provided detailed guidance on all aspects of transferring gear and opening the camp. Just before 1200, we arrived as planned at Cape Shirreff. The weather was iffy, with winds blowing 30 kts out of the N-NW; air temperature at 2.7 degrees C; and the barometer reading 993 mb. After waiting a bit for our best weather window, a first attempt was made to launch a zodiac (Fig. 4), intended for a scout team that would survey the area and check out the research station. A few minutes after the launch, it was clear that conditions were too rough to go any further and the zodiac was brought back aboard. We held position off Cape Shirreff for the afternoon and through the night, hoping for workable conditions for small boat operations needed to transfer people and gear to open the NOAA Marine Mammal Research Station for the summer season.
Figure 4. Launching a zodiac in rough weather takes coordination of the ship’s crew and technical support team. Photo Ann Bucklin

The Captain and MPC met with the science leads, Ann, Joe, and Peter at 1830 to discuss options for the location and timing of the first test station. Once we finish work at Cape Shirreff, we will begin steaming for one of Stns #20, #21, #22 or #2, where we will do a CTD cast and IKMT and MOC-1 tows. We will hope to occupy our original Stn #1 along with nearby Stn #7 later in the cruise. Work at our first station is planned for daylight hours (and ideally regular working hours) to allow all members of both science teams to observe and learn all station activities, procedures, and sample-handling protocols. 06-Nov-2011 Weathered Out at Cape Shirreff On Sunday (06 Nov. 2011), winds blew at 15 - 20 kts out of the NE, with choppy seas and a few white caps. A check of the conditions indicated: air temperature = -0.1 degrees C; sea surface temperature (SST) = -0.9 degrees C; and salinity = 33.9 PSU. The barometer reading (986 mb) was far lower than the past few days, indicating a low pressure area and indicating bad weather might be coming our way – and so it was.
Figure 5. Panoramic view of Cape Shirreff from open sea to the east to open sea to the west (left to right in image) assembled from 12 images. Photos and photo-merge by P.H. Wiebe
By mid-morning, low fog moved in, reducing visibility from the ship and obscuring the land – not safe conditions for small boat operations. By early afternoon, it was snowing and the wind picked up to around 20 kts. Air temperature was 0.5 degrees C; the barometer reading (978 mb)
indicated that the low pressure system to the west had moved in ahead of schedule. A panoramic view of Cape Shirreff (Fig. 5) shows the conditions and lay of the land clearly – so near and yet so far away!
LMG11-10 Cruise Report – December 6, 2011 Page 11
The winds really picked up during the afternoon, blowing 30 - 35 kts. Low clouds moved in and the barometer was at 976 mb and falling. By 1700, winds were gusting out of the West to 55 kt (Fig. 6). The only good news was that the barometer is starting to move back up! The wind and weather forecast for tomorrow indicated high winds would continue through the day. The Captain (Joseph Abshire), Marine Projects
Coordinator (Jullie Jackson), Chief Scientist (Ann Bucklin), and lead scientists (Joe Warren and Peter Wiebe) met to discuss options and priorities to work toward the cruise scientific objectives
Figure 6. Data Acquisition System (DAS) screen with gusts to 50 kts.

despite the bad weather. After listening to our recommendations and considering the many competing needs and objectives of the cruise, the Captain decided to steam away from Cape Shirreff and head for our Station 22. We hoped the protected location of the station at the entrance to Gerlache Strait would allow us to occupy our first station, carrying out planned sampling and data collection. Our ETA (Estimated Time of Arrival) for Stn 22 was 0500 on Monday, Nov. 7th. We left our requests for wake-up calls with the bridge, and headed to our bunks. 07-Nov-2011 Transit to Palmer Station On our arrival at Stn #22 about 0600 on 07 Nov. 2011, it was clear that we didn’t have the protection from wind and weather we wanted to carry out our first “training station” of the cruise. Winds were still in the 30+ kt range, with gusts to 50 kts. After some discussion with the Captain and MPC on the bridge, the decision was made to head directly for Palmer Station. We hoped to be able to tie up to the dock by that evening, off-load people and cargo the next day, and head back to sea that evening. Steaming down the Gerlache Strait towards Palmer Station was spectuacular. The sun was visible through thin clouds, with sunlit mountains in the distance. Lovely! In addition to admiring the spectacular scenary, the science teams used the time to continue preparations for station work. We periodically came into extensive brash ice where the LMG slowed a bit. At first, the Captain stopped the ship to allow the heaters time to melt the ice coming in with the seawater. Crab eater seals were out on the ice in ones and twos, and several times the ship came very close – making for good photo opps. Craggy snow covered rocks jutted skyward especially as we entered the Neumayer channel - a short cut to the passage way to Palmer Station. Winds were extremely variable going from around 10 knots to well over 50 kts. Upon entering Bismark Strait, the main channel leading to Palmer Station, winds were up to 40 – 50 kts out of 320 with
large seas.
Figure 7. Pulling up to the dock at Palmer Sation in marginal weather conditions on 08 Nov 2011. Photo Peter Wiebe
Nearing the station, the ship sat in the harbor area in the broken-up pack ice for several hours, waiting for the wind to decrease. Just when most of us were resigned to a night onboard, the winds dropped and the ship began to back towards the station. Amazingly, we had gotten our window just in time, and we pulled up to the dock just before 1900 (Fig. 7).
LMG11-10 Cruise Report – December 6, 2011 Page 12

08-Nov-2011 Palmer Station Port Call
Figure 8. Calibration of the BioSonics towfish at the Palmer Station dock. A) Towfish off the stern; B) ETs and MT after successful calibration. Photos Peter Wiebe
The day started with winds out of the North at 35-40 kts, with a mixture of snow and sleet. Offloading of cargo was slow in the miserable working conditions, with the high winds, cold air, and sleet. First off were the “freshies” for Palmer Station, since the station had run out of them a week or so ago. High winds eventually shut down the crain operations; critical items were hand-carried in a human chain from the hold, to the dock, and then into vehicles. This took about 1.5 hr to get all the stuff moved to the dock. The wind blew away the ice from around the ship, providing a clear area for necessary calibration of the BioSonics acoustic echo sounder (Fig. 8). The ETs rigged the towfish with the echo sounder, which has 38 and 120 kHz split-beam transducers. In spite of the wind and sleet, the calibration was successfully finished about 1900. And then we waited – primarily for the winds to slacken enough to off load the aluminum landing craft on the 01 deck, which prevented MOC deployments from the DUSH-11 winch. We waited until critical cargo operations could be completed.
09-Nov-2011 Departure from Palmer and Our First Station Work We heard the ship’s alarm at 0600. The weather had cleared enough to finish off-loading the cargo, including a large aluminum landing craft blocking the operation of the trawl winch, and we were ready to go! The lines were dropped at 0645 (Fig. 9), and we got underway, steaming through the channel leading to Bismark Strait. Several small groups of penguins were on the small island across from the station. We headed east for the Neumayer Channel and then into the Gerlache Strait, heading back again toward our Station #22.
LMG11-10 Cruise Report – December 6, 2011 Page 13
Figure 9. Lines were dropped in the early morning as we depart Palmer Station. Photo Peter Wiebe
Figure 10. Our return passage through Gerlache Strait: a sparkling blue-and-white morning! Photo Ann Bucklin

The scenary was stunning and uniquely Antarctic (Fig. 10). Sun was peaking out from behind the clouds giving rise to great highlights on the black rock walls along the channel and the thick sheets of ice and snow that cover most of the mountains. Shear cliffs of the ice several hundred meters tall marked the waters edge along the channel. Winds in the channel were lower than in the open sea and were below 10 kts.
LMG11-10 Cruise Report – December 6, 2011 Page 14
As we approached Stn #22, the MOCNESS was moved out to the stern, positioned for deployment, and given a last check by an Electronics Technician (ET; Fig. 11). All members of the science and RSCP technical teams worked this station. The station
location was over a deep trough in the main channel that goes down to 1000 m. Our plan for the station work included a CTD cast to 1,000 m, an IKMT tow, and finally the MOCNESS tow. Weather conditions looked good; the seas were very nice and the winds were light.
Figure 11. George Aukon (LMG ET) checks out the sensors and instruments on the MOCNESS. Photo Peter Wiebe
The station work proceeded according to plan and – as expected for a first station – everything took an extra bit of time. The CTD cast was deployed from the Baltic Room (Fig. 12). We tripped two bottles at each of seven depths from the surface to 1,000 m. The water samples were collected by the science teams (Fig. 13) and filtered for analysis at UConn and SBU laboratories for chlorophyll, nutrients, particulates, and C:H:N ratios. Such biological characterization of the water column is critical to understand the “ecological niche” of the Southern Ocean salp.
Figure 12. CTD rosette with Niskin bottles deployed from the Baltic Room. Photo Peter Wiebe
Figure 13. Paola Batta-Lona (left) and Chelsea Stanley collect water samples. Photo Ann Bucklin

Immediately after the CTD cast, an Isaacs Kidd Midwater Trawl (IKMT) net was deployed from the stern and recovered after a tow to 175 m (Fig. 14). This net is particularly useful for collection of living zooplankton, especially the fragile gelatinous salps that is the focus of our study. The catch in the IKMT was pretty light, with juvenile krill, amphipods, and several ctenophores and jellyfish, but no salps.
Figure 14. Deployment and recovery of the IKMT off the stern of the ship. A) A winch is used to lift the net over the stern gate of the ship, guided by the Marine Technicians (MTs) and scientists. B) The recovery was made in calm seas; the pentagonal mouth opening of the IKMT can be clearly seen as it reaches the surface. Photos Peter Wiebe
After a break so everyone could eat dinner (quickly), we finished the setup and checkout of the MOCNESS and started the tow about 1930. At the bottom of the tow (at 822 m), we closed Net 0 and opened Net 1. During the uphaul, we sampled discrete depth strata through the water column: 822-600, 600-400, 400-200, 200-100, 100-75, 75-50, 50-25, and 25-0. The tow was carried out without difficulty and the MOCNESS was recovered about 2230 pm (Fig. 15). No salps were caught and most of the zooplankton – juvenile krill – was in the upper 25 meters. Our work at Stn #22 – including clearing our gear off the deck, filtering the water samples, splitting and preserving the zooplankton samples, updating our data records and event logs, and cleaning up the shipboard laboratories – continued for several hours. We finished up just in time for “Mid-Rats” (Midnight Rations). The science teams did a debriefing of the station work, and a consensus emerged to move the MOCNESS deployment ahead of the IKMT. This would allow time for processing the water samples, before the zooplankton samples arrived on deck and would ensure immediate attention to the critical IKMT samples, from which we intended to remove live salps – assuming of course we catch them. It was clear to all that we were planning to accomplish a lot of work at each station without much steaming time between stations with a relatively small science party. Clearly, we needed to be organized and efficient. With this plan, we headed to bed, while the LMG set course back to Cape Shirreff, a 9-hr steam. We hoped for good weather to allow the scientists to disembark via Zodiac and set up their summer camp.
LMG11-10 Cruise Report – December 6, 2011 Page 15
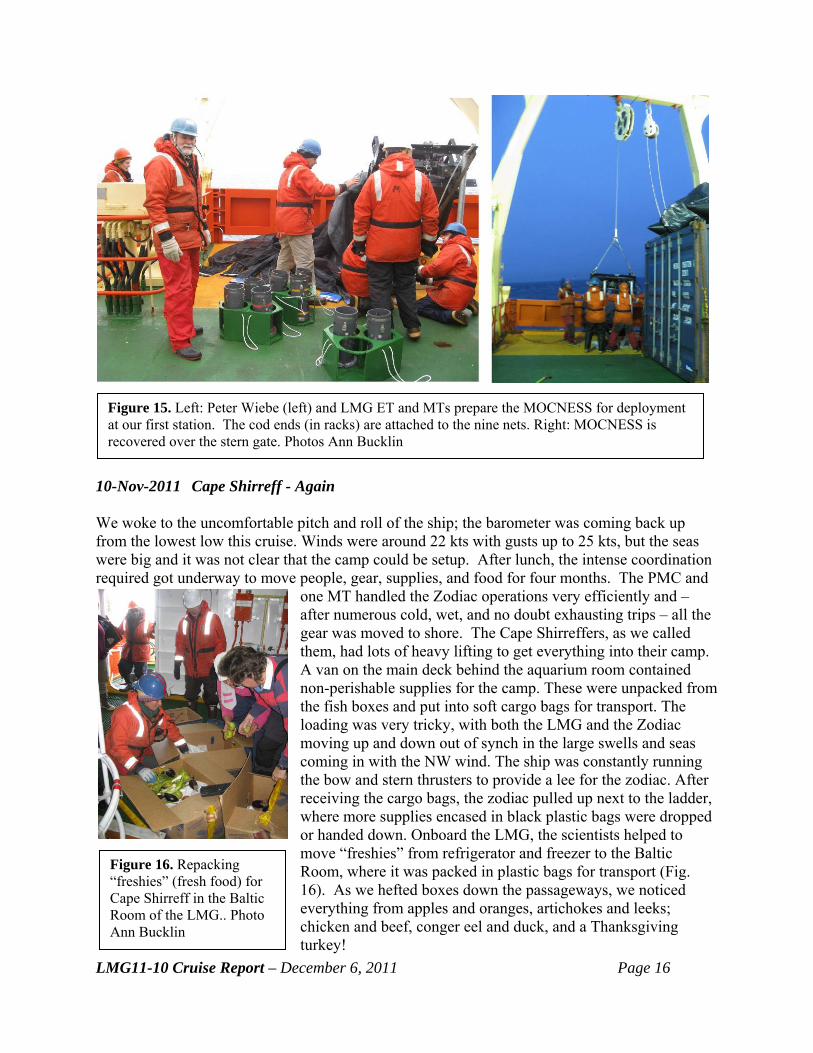
Figure 15. Left: Peter Wiebe (left) and LMG ET and MTs prepare the MOCNESS for deployment at our first station. The cod ends (in racks) are attached to the nine nets. Right: MOCNESS is recovered over the stern gate. Photos Ann Bucklin
10-Nov-2011 Cape Shirreff - Again We woke to the uncomfortable pitch and roll of the ship; the barometer was coming back up from the lowest low this cruise. Winds were around 22 kts with gusts up to 25 kts, but the seas were big and it was not clear that the camp could be setup. After lunch, the intense coordination required got underway to move people, gear, supplies, and food for four months. The PMC and
one MT handled the Zodiac operations very efficiently and – after numerous cold, wet, and no doubt exhausting trips – all the gear was moved to shore. The Cape Shirreffers, as we called them, had lots of heavy lifting to get everything into their camp. A van on the main deck behind the aquarium room contained non-perishable supplies for the camp. These were unpacked from the fish boxes and put into soft cargo bags for transport. The loading was very tricky, with both the LMG and the Zodiac moving up and down out of synch in the large swells and seas coming in with the NW wind. The ship was constantly running the bow and stern thrusters to provide a lee for the zodiac. After receiving the cargo bags, the zodiac pulled up next to the ladder, where more supplies encased in black plastic bags were dropped or handed down. Onboard the LMG, the scientists helped to move “freshies” from refrigerator and freezer to the Baltic Room, where it was packed in plastic bags for transport (Fig. 16). As we hefted boxes down the passageways, we noticed everything from apples and oranges, artichokes and leeks; chicken and beef, conger eel and duck, and a Thanksgiving turkey!
Figure 16. Repacking “freshies” (fresh food) for Cape Shirreff in the Baltic Room of the LMG.. Photo Ann Bucklin
LMG11-10 Cruise Report – December 6, 2011 Page 16

The second-to-last zodiac run left with Mike Goebel, the team leader, before dinner (Fig. 17). The final run carried several fish boxes needed to keep things secure outside the huts at the camp. The setup of the camp took about 6 hrs of intense effort by most of the ship, ending in the evening at 2000. Later, Mike Goebel called the MPC to say “thank you” to all of us and to let us know that everything was fine. He was apparently excited to find an early fur seal and more elephant seals than expected.
Figure 17. The second-to-last Zodiac, with Mike Goebel onboard, leaves the LMG for the Cape Sherriff camp, seen in the distance. Photo Ann Bucklin
With the camp setup complete, the ship headed for Stn #7, arriving on station about 2300.
11-Nov-2011 Work at Stations #7 and #8 Just after midnight, with the CTD was on board, attention turned to the MOCNESS. First, the tow cable had to be run through the block and attached to the towing bridle and plugged in. The LMG practice was to undo the tow cable from the DUSH-11 winch after each tow, because the IKMT needed a cable from the DUSH-4. After this change-over, testing of the MOC-1 began, only to discover that the motor would not step (or open and close) the nets. Peter Wiebe and ET George Aukon dissembled both the broken and the spare toggle motor assemblies, and used the new motor and old toggle together with the old coupling to get a working system. When the motor was tested in the lab it seemed to work OK, but testing the motor on the frame showed it was not working properly. Finally the deck check was done and around 0300 the MOCNESS went into the water. The tow went well and we shot the net to depth in just under an hour (~1,600 m wire out) and hauled it back in just under 2 hr, while filtering optimal quantities of water. However, the Net #8 cod-end was found inside Net #0; it had to have entered during the swirl caused by the propellers just when the net entered the water. Although Net #8 filtered quite a bit of water, it caught nothing and was torn. The catch was a bit sparse, except the upper 25 m had quite a few euphausiids, with some adults. There was still a problem in getting the MOCNESS frame to drop into the stanchion on recovery, because the base was not in the right position and too far back (Fig. 18). Peter Wiebe suggested that the base could be secured with lines from eye bolts in the deck forward of where the base was located when the frame is at rest in the stanchion. By hooking these lines into the U-bolts on the outside edges of the base, the base could not move backwards and the frame should be able to be lowered directly onto the stanchion without difficulty.
LMG11-10 Cruise Report – December 6, 2011 Page 17

The IKMT followed the MOCNESS, but there was some delay in starting the tow. As the net was being deployed, Joe Warren noticed that one of the straps holding the net to the top spreader bar was coming unstitched and needed repair. At first they were going to sew the strap back together out on the deck, but there was a backup net available, so that was installed instead. It delayed the deployment about 30 minutes. The tow went to about 40 m - targeting the shallow zone where the MOCNESS caught large krill - and a sizeable catch of krill came up in the net. The krill were moved into holding buckets and put into the cold room for experimentation. Ann Bucklin flash-froze individuals for molecular studies. Joe Warren’s group did some density measurements, but Joe decided to wait until morning to get some sound speed measurements. Unfortunately, the krill had died by morning so those measurements were not possible.
LMG11-10 Cruise Report – December 6, 2011 Page 18
Weather remained on the edge. An approaching storm was threatening higher winds, but so far the winds stayed in the mid-20 kt range out of the NW. We requested an ETA of 0600 for Stn #9 and agreed to meet then with the MPC to evaluate working conditions at the station. 12-Nov-2011 Weathered Out Again At 0600, we had 30 - 40 kt winds and high seas. The Captain and MPC considered the conditions unworkable and the scientists agreed. We made a plan to skip or drop Stns #9 and #10, and set sail for Stn #11, about 80 nmi away to the East of Elephant Island. We needed a weather window to allow us to get in the MOCNESS deep tow (to 2,500 m) planned for Stn #11. Meanwhile, with sustained winds of 30 - 40 kts out of the NW and seas building to 10 m (30 ft), we had a bumpy ride. But new 24-hr wind and wave forecasts after dinner gave welcome news that conditions may improve sooner than had been originally hoped. The MPC gave word to the bridge to call her and the science leads if winds fell below 30 kts during the night. 13-Nov-2011 Working in the Drake Passage Amazingly, we got our “weather window” - winds below 30 kts
(see Fig. 19) – and got the wake-up call at 0330. After an initial CTD cast, we launched our first “deep tow” of the cruise. The MOCNESS went over the side about 0630 and was recovered at 1145. Throughout the tow, environmental data (temperature, salinity, particulates, chlorophyll) and net information (depth, angle of the net, volume of water filtered) were displayed on the ship-board data acquisition computer (Fig. 18). Peter Wiebe discussed the ship’s track for the 7-hr tow with the bridge and set the eight vertical strata for sampling during the uphaul: 2500-
Figure 18. Problem (Top): The MOCNESS-1 frame hit the deck too far back, so the net wouldn’t rest in the stanchions. Solution (Center and bottom): Lines were tied to position the frame on recovery; the MOC was secured. Photos Peter Wiebe

2000, 2000-1500, 1500-1000, 1000-500, 500-200, 200-100, 100-50, and 50-0 (Fig. 20). Winds were now down in the 19 - 22 kt range out of the NE, having come down over the past 6 hr from the 30 to 50 kt range. The barometer had risen over the past 24 hr and was at 979 mb. Seas were still high, with swells generated far to the west.
LMG11-10 Cruise Report – December 6, 2011 Page 19
The MOCNESS tow started about 0740 on a course of 330, which was into the wind. The seas were more to the west, so the ship was rollling a bit. The wind dropped into the 15 to 20 kt range out of the N. During the 7-hour “deep tow” the barometer continued to drop, reaching 972 mb. The MOCNESS was completed at 1719. The battery failed and communication with the underwater unit was loast at the end of the tow. The MOCNESS was recovered with the last net still open; it was closed on deck. Another glitch was the flow meter, which was slowed by entanglement with a string used to keep the flowmeter from running on the deck. There were some bad T/S data points and some bad pressure readings, as well. These were cleaned up fairly easily in the post processing and plotting of the T/S profiles. The samples looked good but sparse, except for Net #5, which fished from 500-300 m and caught quite a bit. Still no salps! The IKMT tow also had a glitch, when the new net suffered the same problem as the first one: the stitching on one of the straps going to a spreader bar
came undone. They brought the net back on board and sewed it up with waxed thread. The tow was completed successfully, catching enough krill (E. superba) for both the Warren team’s density measurements and Bucklin’s flash-freezing for genomics/transcriptomics.
Figure 20 .MOCNESS data acquisition screen with net trajectory (nets identified by color), environmental parameters, and net position during a 2,500 m tow.
Figure 19. The red line shows wind speeds for previous 24 hr at 12:00 Noon GMT or 9:00 am local time on Nov. 13th.
The weather continued pretty much unchanged as we steamed for Stn #12. Several faults with the CTD sensors were discovered enroute, so we prepared the MOCNESS for deployment first on arrival at Stn #12 in the afternoon. Winds came up during the set-up and we stopped to wait for workable weather. The day ended as had the previous one: standing by near a station waiting for workable weather, with wake-up calls requested by the science leads. To put our progress in perspective, the weather challenges were pretty much as expected for this time of year in the Western Antarctic Peninsula region. We continued to work to our original cruise plan and station locations, and accommodated to weather shut-downs by rearranging the order of stations and standing by at stations to wait for workable conditions. The rearrangements

were sensible in terms of the ship track and transit times; standing by on station ensured we did not bypass high-priority stations. Our consensus-based contingency planning among the science leads, which was more-or-less continuous because of the rapid weather changes, was working well as far as the science teams were concerned. Based on samples to date, zooplankton were generally sparse, but the samples showed differences among areas and depth strata that were of considerable interest. We had not yet seen salps, but were hopeful for planned sampling in the Branfield Strait. 14-Nov-2011 Waiting on the Weather Again We didn’t get our weather window overnight – far from it (see Fig. 21) – and so no wake-up call. Late in the afternoon, the winds started to die down, but the rough seas prevented a CTD cast. We prepared the MOCNESS for deployment, but discovered that the altimeter was missing – just gone – and the electrical cable looked like it had been cut. In addition, the U-bolt at the top of the frame (near where the altimeter had been) was bent, as was the aluminum mount for the altimeter. The tow bridle on that side had a distinct new kink. We knew that the altimeter
stopped working just after Net #1 was opened at 2,500 m, but there was no indication of what happened at depth. We surmised that the ship took a large swell, the stern dipped down, and the tow bridle slackened. It must have wrapped under the U-bolt and altimeter, so when the ship came back up, the altimeter was jerked off, bending the U-bolt.
LMG11-10 Cruise Report – December 6, 2011 Page 20
The altimeter was fixed using cable from Peter Wiebe, but in the deck checkout, the battery showed low voltage and was changed. After a computer crash caused a bit more delay, the MOCNESS was launched for the tow. The intention was to sample to 800 m, but was shortened to 725 m when the altimeter and ship’s
depth estimates disagreed. The tow was plagued by a mistake in setting the net step motor, likely the toggle had about six steps instead of three when it went into the water. The MOCNESS had an electrical failure during the tow (no tab file was recorded) and lots of red battery flickers. Regardless of the technical difficulties, the tow was a huge success: we caught our first salp in Net #4 (which sampled from 200-100 m) of our fifth MOCNESS tow of the cruise. After the CTD cast, the Warren team moved immediately to prep the IKMT. In an unfortunate failure of communication, the CTD water samples were drained before the Warren team got their samples.
Figure 21. LMG DAS meteorological data showing winds gusting near 60 kts during night of 13-14 Nov 2011.
15-Nov-2011 MOCNESS Acts Up The day started bright and sunny, with low winds (10 kts) and only a few white caps. The CTD case was completed about 0600. When the MOCNESS was prepped, the ET found that the cable coming out of the termination had broken inside the outer protective layer and needed to be re-spliced. After the deck check, the MOCNESS was readied for launch – but a genuine disaster resulted. A failure of communication between the deck MT and the winch operator resulted in
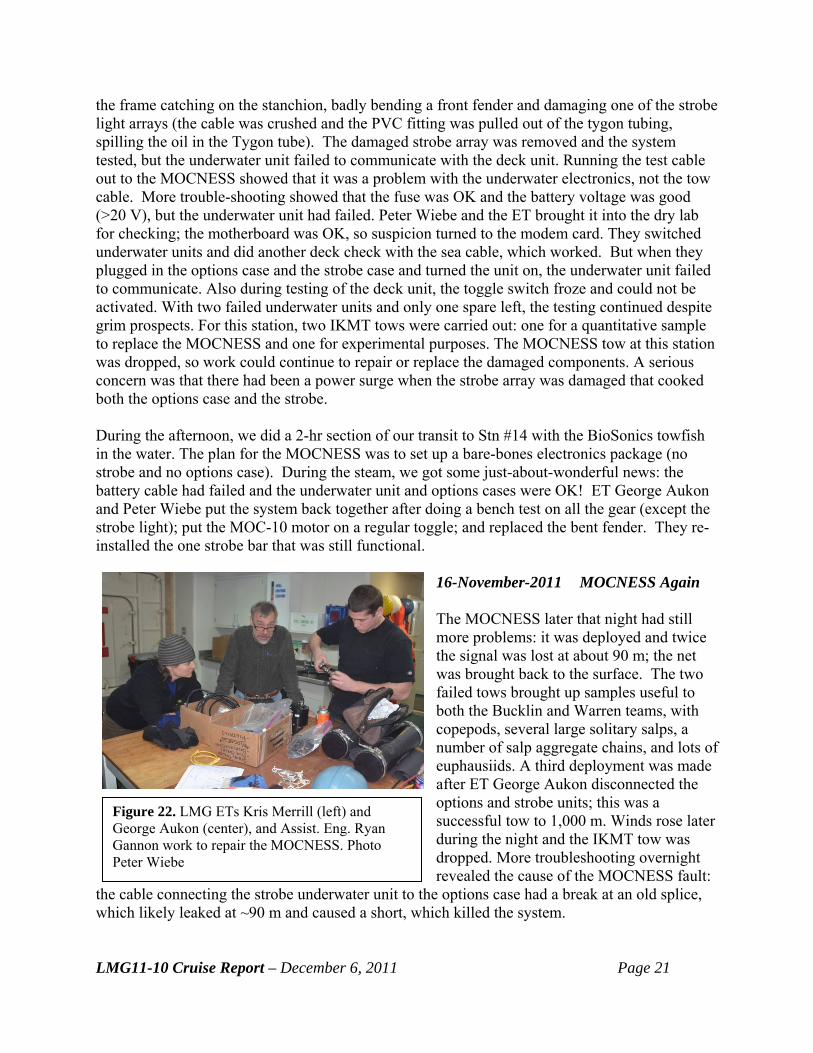
the frame catching on the stanchion, badly bending a front fender and damaging one of the strobe light arrays (the cable was crushed and the PVC fitting was pulled out of the tygon tubing, spilling the oil in the Tygon tube). The damaged strobe array was removed and the system tested, but the underwater unit failed to communicate with the deck unit. Running the test cable out to the MOCNESS showed that it was a problem with the underwater electronics, not the tow cable. More trouble-shooting showed that the fuse was OK and the battery voltage was good (>20 V), but the underwater unit had failed. Peter Wiebe and the ET brought it into the dry lab for checking; the motherboard was OK, so suspicion turned to the modem card. They switched underwater units and did another deck check with the sea cable, which worked. But when they plugged in the options case and the strobe case and turned the unit on, the underwater unit failed to communicate. Also during testing of the deck unit, the toggle switch froze and could not be activated. With two failed underwater units and only one spare left, the testing continued despite grim prospects. For this station, two IKMT tows were carried out: one for a quantitative sample to replace the MOCNESS and one for experimental purposes. The MOCNESS tow at this station was dropped, so work could continue to repair or replace the damaged components. A serious concern was that there had been a power surge when the strobe array was damaged that cooked both the options case and the strobe. During the afternoon, we did a 2-hr section of our transit to Stn #14 with the BioSonics towfish in the water. The plan for the MOCNESS was to set up a bare-bones electronics package (no strobe and no options case). During the steam, we got some just-about-wonderful news: the battery cable had failed and the underwater unit and options cases were OK! ET George Aukon and Peter Wiebe put the system back together after doing a bench test on all the gear (except the strobe light); put the MOC-10 motor on a regular toggle; and replaced the bent fender. They re-installed the one strobe bar that was still functional.
16-November-2011 MOCNESS Again
LMG11-10 Cruise Report – December 6, 2011 Page 21
The MOCNESS later that night had still more problems: it was deployed and twice the signal was lost at about 90 m; the net was brought back to the surface. The two failed tows brought up samples useful to both the Bucklin and Warren teams, with copepods, several large solitary salps, a number of salp aggregate chains, and lots of euphausiids. A third deployment was made after ET George Aukon disconnected the options and strobe units; this was a successful tow to 1,000 m. Winds rose later during the night and the IKMT tow was dropped. More troubleshooting overnight revealed the cause of the MOCNESS fault:
the cable connecting the strobe underwater unit to the options case had a break at an old splice, which likely leaked at ~90 m and caused a short, which killed the system.
Figure 22. LMG ETs Kris Merrill (left) and George Aukon (center), and Assist. Eng. Ryan Gannon work to repair the MOCNESS. Photo Peter Wiebe

About 1030, we arrived on Stn #15 and did a CTD cast.in rather rough seas and marginal wind conditions. The MOCNESS tow was delayed due to weather until the afternoon, when we repeated the difficulty of the previous night. Two tows failed when the system lost connection between the deck and underwater units at ~200 m depth. No fault could be found with the system on deck. After disconnecting the strobe and options cases, the third tow was successful. After an IKMT tow, which caught lots more krill and some salps, sample processing continued through the night as we steamed for Stn #16. 17-November-2011 Nice Day Work at Stn #16 started early with a CTD cast. The MOCNESS failed a deck check, and both ETs worked to discover that the difficulty was the connector on the end of the tow cable. The connector was replaced with a “wet pluggable” connector. The battery case end cap was also replaced with one that can accept the wet pluggable connector (see Fig. 22). After the repairs, a tow was done to 450 m, yielding a sparse catch as was typical for day-time tows. The IKMT tow
caught more animals, including some salps, which were shared between the science teams.
Figure 23. Small boat equipped for Joe Warren’s acoustic salp survey near Stn #16. Photo Peter Wiebe
Winds were amazingly below 5 kts, the barometer was its highest since the start of this cruise (1005.7 mb), and visibility was outstanding. Our location was stunning, surrounded by O’Brien, Eadie, Asdpland and Gibbs Islands, with Elephant Island just barely visible behind them (Fig. 23). A nice day for Joe Warren’s first small boat bioacoustics survey! The zodiac was lowered onto the deck and prepared for launch. The survey covered the same area as the MOCNESS tow.
The Biosonics towfish was deployed for the first 2 hrs of our steam toward Stn #17. We hoped to keep our good weather, avoid further gear malfunctions, and be able to complete work at Stn #17 during the night. 18-November-2011 Krill Catch Work at Stn #17 wrapped up in the midmorning, with a huge haul of krill (Euphausia superba) in Net #6, which fished from 100-50 m. The catch was so large that only ¼ of the sample was preserved. Clearly, the strobe-equipped MOCNESS was catching good numbers of krill when they were present. After successfully completing Stn #17, plans to work at Stn #18 were called off in the face of deteriorating weather. The decision was made to steam to Stn #19 and stand by there for the weather and sea conditions to improve. However, the barometer was dropping rapidly and improvements were not likely soon. We arrived at Stn #19 about 1500. Winds were steady at 30-40 kts out of the East for ~8 hr; the barometer had dropped to 982.9 mb and appeared to be bottoming out. A low pressure system was north of us and moving East. We were again waiting for workable weather.
LMG11-10 Cruise Report – December 6, 2011 Page 22

19-November-2011 Very Windy The winds blew at 40-50 kts for more than 24 hrs (Fig. 24), but then dropped rapidly during the early afternoon, decreasing to a sultry 15 kts. After a bit more waiting for the seas to subside, we went back to work about 1500, starting with a CTD cast. The MOCNESS went into the water around 1645. The samples were sparse, as was the shallow IKMT (50 m) sample to follow. We
are all distracted by the astonishing scenery, with the mountains of Livingston Island clearly visible. Station work continued until 2200, when the towfish was deployed for the start of the steam to Stn #20.
LMG11-10 Cruise Report – December 6, 2011 Page 23
20-November-2011 Another Krill Patch At 0000, we carried out a special IKMT (timed to sample during the short dark period) along the cruise track from Stns #19 to #20. The result was buckets and buckets of swarming krill, including adult, juvenile, and larval forms. The catch overflowed the cod-end, backed up the in net, and spilled over onto the deck. The animals were packed too hard in the net to be in the best condition, so a second shorter IKMT tow was
taken to catch living krill. Interestingly, two huge solitary salps were caught in the first tow, but none in the second, suggesting that salps were simply rare, and could be best caught by high-volume sampling.
Figure 24. Image of meterological data displayed on the LMG DAS system. True wind speed was 30-45 knots for a 24 hr period starting early on 18 Nov 2011.
The weather was lovely for Stn #20. The sky had a layer of high clouds hiding the blue sky and the sun. The CTD went into the water at 0800. The MOCNESS tow went smoothly; the IKMT again caught a huge sample full of krill. Work at Stn #20 wrapped up about 1500 and we headed for Stn #6, located at the shelf edge. We hoped for good weather to allow us to work at four offshore stations (#6, #5, #4, and #24). To save time, we moved Stns #24 and 23 northward (to the LTER-500 line from the -400 line) to shorten the steam and help us stay on schedule for the planned work. We arrived on Stn #6 about 0000, but conditions were marginal and station work was postponed. 21-November-2011 Working Hard Work at Stn #6 started at 0600 with the CTD cast. The winds had slacked to about 15 kts. The MOCNESS went in quickly after the CTD. Despite lots of water filtered, the catch was again sparse. The ETs spent more time repairing the MOCNESS and got the strobe light array working again. After an IKMT tow, the towfish was put over the side for 2 hrs; it was recovered about 1500 and we steamed for Stn #5, a deep-water station with a 2,500 m MOCNESS planned. Work at Stn #5 began well and the CTD cast was uneventful. About 2200, the MOCNESS was at 2,500 m and at the bottom of a long – very long, as it turned out – tow.

22-November-2011 Working Harder The 2,500 m MOCNESS tow at Stn #5 was problematical. On the uphaul, the bridge bumped a control and kicked the ship’s speed up to over 4 kts. The net system was coming up at over 40 m/min when the bridge was asked to slow the ship down. Another request to stop the winch apparently caused a problem with the wraps on the winch, but the problem was not discovered until the MOCNESS was at 300 m. Wire was payed out back to the trouble spot on the winch at 3,019 mwo. Net #5 was consequently open for about 3 hr and the tow took about 10 hr overall.
The tow yielded a good sample, but post-processing of the data revealed many outliers, suggesting a problem with the cable. The IKMT tow was done at the site of the MOCNESS recovery to make up time. By 0800, we were on our way to Stn #4.
LMG11-10 Cruise Report – December 6, 2011 Page 24
The weather was cooperating and we carried out a small-boat bioacoustical survey from 1600-1900 at Stn #4 (Fig. 23). Both from the ship and the Zodiac, we saw many penguins and humpback whales. We hoped for a good plankton haul here. The MOCNESS went in the water just after 2000. Mid-way in the downhaul, the system showed frequent drop-outs and the tow was shortened to 1,500 m. Wonder of wonders, the MOCNESS tow caught salps at
200-100 m and in the upper 50 m. Two IKMT tows were done back-to-back to catch more of them; the first tow was to 175 m; the second, shallower tow caught more. After the IKMTs, the towfish was deployed, finishing a successful station.
Figure 25. A small-boat bioacoustical survey sets off at Stn #4 to characterize small-scale patterns of backscattering. Photo Ann Bucklin
23-November-2011 Sampling Offshore The seas were flat and the winds were calm in the morning as we headed for our southernmost station (Stn #24), which was another off-shelf station with a deep MOCNESS tow planned. After the CTD cast, the MOCNESS went into the water about 1100 and was recovered about 1720. The system was working well, but the samples were again quite sparse. We speculated that whatever zooplankton were out there was very patchy and could be caught best by penguins and whales – not nets. An IKMT tow and towfish deployment completed the station work. During the afternoon, we completed work at Stn #23, a shallower site on the continental shelf. 24-November-2011 Wrapping up Offshore The weather forecast was not good and a large low-pressure system threatened from the West, but conditions held into the night. We arrived at Stn #3 just after 0000 and did two IKMT tows during the short darkness. The CTD cast followed. The MOCNESS tow went smoothly and sampled to 570 m (with water depth 613 m). The catch was light – something we were used to by this time. The towfish was deployed for 2 hrs as we headed to our next station.

25-November-2011 Small Boat Operations in Flandres Bay
LMG11-10 Cruise Report – December 6, 2011 Page 25
Figure 26. View with reflections in the calm waters of Flandres Bay, Western Antarctic Peninsula region. Photo Ann Bucklin
Figure 27. The LMG clearing a path in Flanders Bay for small boat operations for salp collecting and bioacoustics. Photo Ann Bucklin
During the night, we added two IKMT tows scheduled during darkness (added as Stn #27). We arrived at Stn #26 located in Flandres Bay, a protected fjord off Gerlache Strait, in the morning of Nov. 25th. The day was sunny and calm, offering a stunning landscape of snow-covered peaks and glaciers and their reflected images in the still waters (Fig. 26). The good weather allowed our planned deployment of two small boats: one for salp and krill collection and the other for a small-scale bioacoustic survey in an area that Joe Warren had studied last year and dubbed “Krill City”. In the afternoon, the Zodiacs followed the ship’s trail through the ice (Fig. 27) to get closer to our study area. As we navigated around bergy-bits and smaller ice, we were surrounded by penguins, who kept a watchful eye on us, but stood their ground (Fig 28).
Figure 28. Penguins were everywhere in Flandres Bay: they hung out on the ice and stood up to keep an eye on us. We also saw them porpoising through the water, including one who followed the zodiac for several minutes. Photos Ann Bucklin
The salp-and-krill collecting Zodiac found at least some of what we were looking for. In Krill City, we collected krill furcilia (larvae) that swarmed under the ice bits (Fig. 29). These floating nurseries likely contribute to krill populations of the Western Antarctic Peninsula region. The tiny krill feed on algae growing on the under-surface of the ice. We are particularly interested in

the genetic make-up of these krill (which may be E. superba or E. crystallorophias) for comparison with that of the juveniles and adults we collected in other regions during the cruise.
LMG11-10 Cruise Report – December 6, 2011 Page 26
Figure 29. Paola Batta-Lona collecting larval krill from a floating “krill nursery” under a bit of ice.
The day in Flandres Bay was both thoroughly enjoyable and scientifically successful; for many of us, it was our favorite day of the cruise. It was also the last day of work for us. Later that night, we finished up our Salp Survey with a complete series of CTD cast, MOCNESS tow, and IKMT tow at Stn #28 at the mouth of Flandres Bay. Then the technical team started breaking down our sampling gear and we steamed for our second port call at Palmer Station. 26-November-2011 Palmer Station Port Call We arrived at Palmer for an early-morning docking. Our second port call at Palmer Station was under much better conditions. Cargo operations were completed as planned. The science teams started to unwind from the station work and pack up their laboratory and work spaces, and
enjoyed a dinner hosted by the Palmer Station residents. 27-November-2011 Palmer Station Farewll We pushed off from the dock at Palmer Station as scheduled at 1000, with the traditional display – dives or jumps into the frigid Antarctic water – for the departing Palmer Station residents (Fig. 30). We steamed away leaving the Neumayer Channel behind in a last look (Fig. 31) and headed North for the NOAA field camp, Copacabana, on King George Island.
Figure 30. The traditional farewell to departing Palmer Station residents. Photo Peter Wiebe

LMG11-10 Cruise Report – December 6, 2011 Page 27
Figure 31. Panoramic view of Neumayer Channel seen from the LMG as we steamed from Palmer Station and headed North toward the field camp at Copa. Photos and photomerge by Peter Wiebe.
28-November-2011 Pick-up at Copacabana The pick-up at Copa, the NOAA field camp, was aided by good weather. Many of the scientists got a chance to go ashore and see the dense penguin colonies, with all three species (Gentoos, Adelies, and Chinstraps) apparently co-existing. Once the trash and propane tanks from the field
camp, the LMG visitors, and our new passenger were aboard, the Zodiacs were recovered. The LMG got underway for Punta Arenas about 1200. 29-November-2011 Drake Again For a short while, we thought the Drake Passage would lie down for our transit. By the afternoon of Nov 20th, it was clear that we were in for a
usual crossing. Winds gusted over 50 kts and we pitched and rolled our way into the wind and through 5 m swells (Fig. 32). By morning, we reached the Straits of Maire (Isla de Estados), where we were more protected from the winds and waves, and conditions improved.
Figure 32. Wind speed gusted over 50 kts (left) and wave heights were over 5 m (right) during our crossing of Drake Passage on 29-30 November 2011.
Figure 33. Everyone turned out for the LMG11-10 post-cruise dinner, which was also a birthday party for Captain Joe Abshire. Photos Peter Wiebe.

LMG11-10 Cruise Report – December 6, 2011 Page 28
01-December-2011 Punta Arenas We pulled up to the dock in Punta Areanas about 1000 on Dec. 1st. After the ship was cleared through Chilean customs, we were free to disembark. The science teams were allowed to stay onboard the LMG for the night, but some of us had reservations for nearby hotels. A post-cruise dinner the LMG11-10 was held that evening at Las Marmitas Restaurant (Fig. 33). Our dinner concluded the cruise activities, which were judged overall to be both successful and enjoyable. The next day or soon thereafter, most of the scientists headed for home.

IV. Cruise Operations and Scientific Protocols
Figure 34. Station locations and cruise track for LMG11-10. Sampling and gear deployments at each station are explained in the text. Bad weather during the first half of the cruise was accommodated by changes in the cruise track and order of stations from the original cruise plan. Stns #26 – 29 were added during the cruise.
Our field work was carried out during November 10-25, 2011. Weather proved to be challenging for much of our cruise – although pretty much as expected for the time of year in the Western Antarctic Peninsula region. We worked to our original cruise plan and station locations, and accommodated to weather shut-downs by rearranging the order of stations and standing by at stations to wait for workable conditions. In all, we completed work at 21 full stations (Fig. 34), with IKMT net tows at several additional sites, and carried out 20 CTD casts, 20 MOCNESS tows, and 27 IKMT tows. Following are descriptions of observations, gear deployments, and data and samples collected: 1) XBT Transect The Drake Passage transect of 78 XBT and 13 XCTD casts was completed successfully and as planned. These data will be added to a time-series that the LMG has been collecting every 6 weeks for the last 5-6 years. See Appendix I (LMG11-10 Event Log) for locations and times of casts. 2) Meteorological Data (Joe Warren, Stony Brook University) Given the strong winds and rough seas we encountered during our cruise, we analyzed the shipboard wind data from when we left the dock through the midpoint of our passage back through the Drake Passage (yearday 307-332). Wind velocities were averaged between the port and starboard sensors and over 1 min intervals; actual wind velocities (instantaneously) were higher than what we report here.
LMG11-10 Cruise Report – December 6, 2011 Page 29

Figure 35. Wind velocity (1-min averaged) during cruise LMG11-10 for yearday 307-332.
For the first 10 days of our cruise, the median wind velocity was 26 kts (Figs. 35, 36), which explains why we were limited so much in our sampling and offloading personnel at Cape Shirreff. For the entire cruise (yearday 307-332), our wind velocity (1 min average) was greater than 25 kts 32% of the cruise and higher than 30 kts 19% of the time. This was a remarkable stretch of bad weather and low pressure systems that definitely affected our ability to sample the area north of the South Shetland Islands.
Figure 36. Histogram of wind velocity (1 min. average) for LMG11-10 for yearday 307 - 332.
LMG11-10 Cruise Report – December 6, 2011 Page 30

3) Underway Seawater Sampling (Joe Warren, Stony Brook University) We examined and mapped the data from the ship's flow-through seawater system over our cruise track through yearday 332 (Figs. 37, 38, 39, 40, 41).
Figure 37. Spatial map of sea surface temperature during LMG 11-10. Data at or near Palmer Station may be erroneous; the flow-through system is shut down during entry to / exit from the Station.
Figure 38. Spatial map of sea surface salinity during LMG 11-10. Data at or near Palmer Station may be erroneous as the flow-through system is shut down during entry to / exit from the Station.
. LMG11-10 Cruise Report – December 6, 2011 Page 31

Figure 39. Spatial map of sea surface sigma (density, 1000 kg/m3) during LMG 11-10. Data at or near Palmer Station may be erroneous as the flow-through system is shut down during entry to and exit from the Station.
Figure 40. Spatial map of sea surface chlorophyll (fluorescence) during LMG 11-10. Data at or near Palmer Station may be erroneous as the flow-through system is shut down during entry to and exit from the Station.
LMG11-10 Cruise Report – December 6, 2011 Page 32

Figure 41. Time series of sea surface fluorescence and PAR as measured by the LMG during the cruise.
4) MOCNESS Operation (Peter Wiebe, Woods Hole Oceanographic Institution) The Multiple Opening/Closing Net and Environmental Sensing System (MOCNESS) was provided by Raytheon and it was equipped with nine 335-um mesh nets. In addition to the standard temperature and conductivity probes, it was also equipped with a beta-type strobe unit provided by BESS Co. and a Benthos 200 kHz altimeter. The underwater unit used throughout the cruise was #156. The MOCNESS was deployed from the stern A-frame and towed with 0.68" conducting cable on a DUSH-11 oceanographic winch. Between casts, the MOCNESS was supported at a 45o angle by a galvanized steel stanchion and tied down with ratchet straps. For deployment, the stern gates between the A-frame struts were kept closed. The MOCNESS frame was lifted off the stanchion by outboard movement of the A-frame and then picked up by hauling in on the winch wire while still moving the A-frame outboard. Once the frame was above the gates, the MOCNESS was lowered down into the sea as the A-frame continued to move to its outboard position. Control of the frame was maintained by two slip-lines looped through U-bolts on both ends of the bottom I-beam. For recovery, snap-hooks with lines attached were used to hook into U-bolts on both ends of the top I-beam while the frame was still outboard of the stern. The lines helped maintain control of the frame as it was hauled up over the stern gates and back onto a position on the deck where the frame when leaned forward landed properly on the stanchion. Each net was washed down over the back side of the gates before the cod-end buckets were pulled over the rail and placed in cod-end holders for transport to the aquarium room for splitting and preservation. The MOCNESS tows were to variable depths depending upon the location offshore of the continental shelf or within the WAP shelf region surveyed and varied from 2500 m to as little as 350 m (Fig. 42; Table 3). Tows to 1000m were common and generally sampled depths of 1000-
LMG11-10 Cruise Report – December 6, 2011 Page 33

LMG11-10 Cruise Report – December 6, 2011 Page 34
800, 800-600, 600-400, 400-200, 200-100, 100-50, 50-25, 25-0m. The downcast started with the winch paying out at 15 to 20 m/min then at ca. 50 to 100 m the rate was increased to 25 to 30 m/min. Depending upon towing conditions, the rate below 100m was often raised to 35 m/min. The hauling rate for the upcast was also variable, depending on the vertical velocity of the MOCNESS and how much wire was paid out, but was generally 20 to 25 m/min below 100m and then 10 m/min or less in the upper 100m to ensure enough water was filtered in the shallow nets. Data acquisition was done on a HP laptop computer running Windows XP using the latest version of the MOCNESS software, which has controls for turning the strobe light on and off and adjusting its settings. The software code was modified to accommodate the Benthos altimeter, which was plugged into the slot normally used for a fluorometer, and the data were output on a 0 to 100 m scale. There were 22 deployments of the MOCNESS of which 18 were successful. At two stations (Stns #14 and #15), tow cable communication failures caused a pair of tows to be aborted during the initial shooting of the net to depth due to broken wiring in the cable termination or in the MOCNESS cables. On three deployments in shallow water regions, the altimeter provided essential data about how far the MOCNESS was off the bottom. It generally began working when the net was within 50 to 80 m. In situ flowmeter calibration for the MOCNESS: Steps for this procedure are as follows: 1) Deploy the MOCNESS with one net open down to a depth of about 50 m (depth not too
important as long as it is below the ship's prop wash). 2) With the ship moving at about 2 kts, have the bridge give a mark for the start of a measured
distance (0.5 to 1.0 nm) using GPS positioning system. Keep track of the flowcounts from the start until the bridge gives a second mark at the end of the measured mile. Write down the total number of flow counts for that run.
3) Have the ship turn 180 degrees and run the same course in reverse, again giving start and end
marks for same distance. By running the same trackline in opposite directions, the effects of any currents should be removed.
4) Divide the flowcounts for the first run into the distance traveled on that run to give
meters/flowcount. Do the same for the return run. Average the two values of meters per flow count to determine the flowmeter calibration value to be entered in the MOCNESS acquisition program. Note that a nautical mile is equal to 1852 meters.
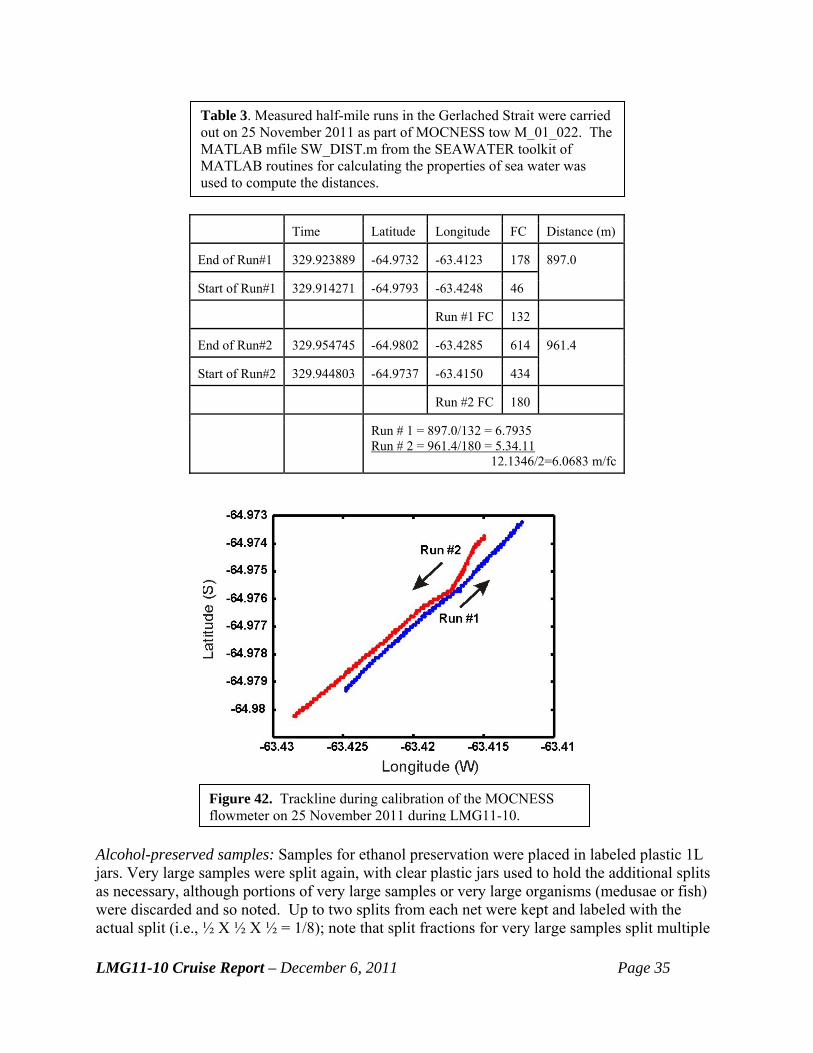
The data and results for the MOCNESS flowmeter calibration on the LMG1110 cruise are shown in Table 3. The new calibration value was 6.07 meters per flow count. MOCNESS sample handling protocols: All MOC-1 samples (including the Net #0 downhaul and Nets #1 – 8 stratified uphaul) weresplit into halves, with ½ split preserved in buffered formalin; the other ½ split in 95% non-denatured ethanol. Net sample splits were done in the LMG aquarium room. Each team assumed responsibility for their respective split: Bucklin for alcohol and Warren for formalin.
LMG11-10 Cruise Report – December 6, 2011 Page 35
Time Latitude Longitude FC Distance (m)
End of Run#1 329.923889 -64.9732 -63.4123 178
Start of Run#1 329.914271 -64.9793 -63.4248 46
897.0
Run #1 FC 132
End of Run#2 329.954745 -64.9802 -63.4285 614
Start of Run#2 329.944803 -64.9737 -63.4150 434
961.4
Run #2 FC 180
Run # 1 = 897.0/132 = 6.7935 Run # 2 = 961.4/180 = 5.34.11 12.1346/2=6.0683 m/fc
Table 3. Measured half-mile runs in the Gerlached Strait were carried out on 25 November 2011 as part of MOCNESS tow M_01_022. The MATLAB mfile SW_DIST.m from the SEAWATER toolkit of MATLAB routines for calculating the properties of sea water was used to compute the distances.
Figure 42. Trackline during calibration of the MOCNESS flowmeter on 25 November 2011 during LMG11-10.
Alcohol-preserved samples: Samples for ethanol preservation were placed in labeled plastic 1L jars. Very large samples were split again, with clear plastic jars used to hold the additional splits as necessary, although portions of very large samples or very large organisms (medusae or fish) were discarded and so noted. Up to two splits from each net were kept and labeled with the actual split (i.e., ½ X ½ X ½ = 1/8); note that split fractions for very large samples split multiple

times did not add up to 1.0. The left-over splits were combined and diluted in a bucket and left alive in the aquarium for identification and flash-freezing of live animals. Alcohol preservation: Net samples were sieved to remove excess seawater, with plankton placed in pre-labled jars, which were filled immediately with 95% undenatured ethyl alcohol (EtOH). Each jar had both an inside and an outside label with the same information (cruise, station, tow, date and time of collection). The labels were pre-printed and specific information was added in pencil – not pen. Outside labels were placed on the jar top with clear packing tape, with a perimeter of black electrician’s tape. Formalin preservation: The split was sieved (330 micron mesh) and placed in either a 100, 500, or 1000 ml sample jar (depending on sample size). An initial biovolume estimate was made for each sample based on the gradations on the side of the sample jar. Additional information on the primary taxa in the sample was often noted on the MOCNESS data sheet (photocopied for use in the aquarium room). These biovolume estimates should be considered very rough; in many cases they probably overestimate the biovolume of the sample, due to the presence of seawater along with the zooplankton. If large animals (jellyfish, fish) were present, they were placed in additional separate jars and preserved; some nets have multiple jars preserved (Fig. 43). Jars were labeled (internal cotton rag label, sticky label with clear packing tape on side of jar, and sharpie-annotated on the sample jar lid) and filled part-way with seawater. Buffered formalin and seawater were added to the jars for a resultant concentration of 3.7% buffered formalin solution.
Figure 43. Examples of individual animals removed from the sample before splitting: (left to right) amphipod, jellyfish, and fish. Photos Melissa Patrician.
Jars were left at room temperature to equilibrate; lids were then taped closed with electrical tape and jars were placed in cardboard boxes in the hold. These samples will be shipped back to Stony Brook University where the contents will be enumerated and identified to taxa (when possible). Removal of living zooplankton for flash-freezing in liquid nitrogen: For any MOC-1 net sample, living specimens were removed from the alcohol split immediately, with removals from splits preserved recorded on the available log sheets. These specimens were placed in beakers with seawater and kept alive in the aquarium room. They were usually preserved in individual vials or jars in alcohol or formalin.
LMG11-10 Cruise Report – December 6, 2011 Page 36

LMG11-10 Cruise Report – December 6, 2011 Page 37
Any salps were preserved in liquid nitrogen after dissection to remove the stomach; individual salp zooids were placed in a cryovial without any excess water or seawater. Alternatively, salps were bisected (avoiding the gut) and placed who in scintillation vials with alcohol added. Vials were labeled sequentially and recorded on a spreadsheet with all collection information. Any removed organisms were also recorded on MOC-1 record sheets. Other living zooplankton (especially copepods and euphausiids) of special interest were removed from the alcohol portion prior to preservation; removals were recorded on a log sheet. For individuals to be flash-frozen, a single individual was placed in a cryovial. Multiple individuals of the same species and from the same net were placed in the same vial for alcohol preservation. Vials were labeled sequentially, with full and complete removal records for any net sample split that was preserved. Comments on MOCNESS samples: MOC #19 / Net 5 had a very large red jellyfish; approximate biovolume was 8-10 L. A sample of the jellyfish was preserved in alcohol by the Bucklin group; the remaining portion of the jellyfish was returned to the sea. The MOCNESS tows that followed this one tended to have lots of jelly remnants in the Net #5 cod end and sample, most likely remnants of this same jelly. MOC #19 had several other large jellies and fish that were removed before the initial Bucklin/Warren sample split. These were preserved in the Warren formalin samples, but need to be notated properly when the net contents are enumerated back on shore. 3) Isaac Kidd Midwater Trawl (Joe Warren, Stony Brook University) A 2.3 m2 Isaacs-Kidd Midwater Trawl was deployed 27 times at 21 unique stations (Fig. 44) in all sampling areas of the cruise. The net has a pentagonal mouth opening measuring 54” (top), 62” (left and right sides), and 32” (two lower panels). The purpose of these tows was not to collect quantitative samples, but instead to collect live specimens for shipboard experiments for both the Bucklin and Warren groups. Therefore the tow profile varied from station to station and was based in part on the contents of the MOCNESS tow, as well as the backscatter observed on the ADCP (or occasionally the Biosonics Towfish or small boat echsounders). Because of personnel needs for processing the MOCNESS tow, we had the ship loop back (taking about 40 minutes) to return to the MOC trackline before deploying the IKMT to try and ensure that the IKMT would be sampling (roughly) similar water as the upper nets of the MOCNESS tow. The RPSC MTs handled deployment and retrieval of the IKMT nets, with some assistance from the science team members. Two datasheets were used to record information for each tow: the tow, count and “cool organism removal” datasheet. Following retrieval of the net, team members removed organisms for experiments. The sample was kept onboard until the MOCNESS was recovered successfully. IKMT tows were generally 30-40 minutes in length. Two standard profiles were commonly used (deep oblique, shallow hold) although tow profiles varied often. A deep oblique tow was lowered at roughly 20 m/min (wire out speed) to a depth of 175 m, then raised to the surface at a wire-in speed of 10-15 m/min (Fig. 45). The wire speed readout on the DUSH-4 winch used for the IKMT was not working, so we calculated wire out/in rates on the fly and often gave commands such as “bit faster”, etc. The shallow hold tow was deployed (typically) to a depth of 50 m

Figure 44. Station locations where IKMT tows were made during LMG11-10.
(often the bottom of the acoustic scattering layer) at a wire out speed of ~ 5 m/min (command given to winch operator was “slow as possible”), and then raised back to the surface at the same rate. On these tows, the net would be held at a particular depth (usually where the max scatter was) for 5-10 minutes, or occasionally held at two different depths, then brought back on board. The IKMT cod end was brought into the aquarium room where the contents were placed in 5 gallon buckets half-full of seawater. The buckets were then split and/or diluted to ensure that animals were not overcrowded. If not enough animals were collected (or not the right kind – i.e. no salps) additional tows were conducted. Animals were then picked by hand/forcep by the
Figure 45. The IKMT net just before entering the water (left) and after being deployed (right). Photos Joe Warren
LMG11-10 Cruise Report – December 6, 2011 Page 38

Bucklin and Warren groups for their individual project experiments. If a large quantity (several hundred milliliters) of monospecific biovolume were collected, then the Warren group would use some of these animals to collect soundspeed measurements.
Unsuccessful MOCNESS tow: If the MOCNESS tow was unsuccessful, an additional IKMT tow was done and treated as our quantitative tow. Sample were split into two equal parts and divided between the two science groups using a box-splitter.
Figure 46. Deployment of the CTD rosette from the LMG Baltic Room.
4) Hand Net Tows Collection of ciliates: Ciliates were collected for Luciana Santoferrara (postdoc of George McManus, UConn Marine Sciences) using the following sampling and preservation protocols:
1) Short gentle tows were done with a ¼ meter ring net with 20 µm mesh net. The tows were done from a small boat towing the net in surface waters or by vertically hauling the net from ca. 30 m depth to the surface.
2) The seawater in the jar was transferred to a sieve, and
concentrated to ~50 ml.
3) The concentrate was placed in a tube with Lugols, while moving the sieve gently to ensure that cells were in the water (and not in the mesh).
4) The sample was homogenized gently and stored and
shipped under refrigeration.
Collection of plankton: Tows using a ¼-m ring net with 505 um mesh were done duirng the small boat deployments in Flandres Bay (Stn #26). Surface, oblique, and vertical tows were done to collect living zooplankton. Krill from these tows were flash frozen and preserved in alcohol. 5) CTD Cast Data Prior to launching, the CTD was cocked by an ET. The CTD was deployed and recovered by an MT from the Baltic room and run by an ET and a winch operator from the upper Baltic room (Fig. 46). The start time and coordinates were recorded as the CTD was lowered into the water. The CTD was lowered to a maximum depth, dependent on the depth of the water at that location. Water parameter data were collected at seven depths: 10m, 750m, 1000m, max depth, and three depths chosen based on the following parameters: Chl-a start; maximum scattering, and Chl-a
LMG11-10 Cruise Report – December 6, 2011 Page 39
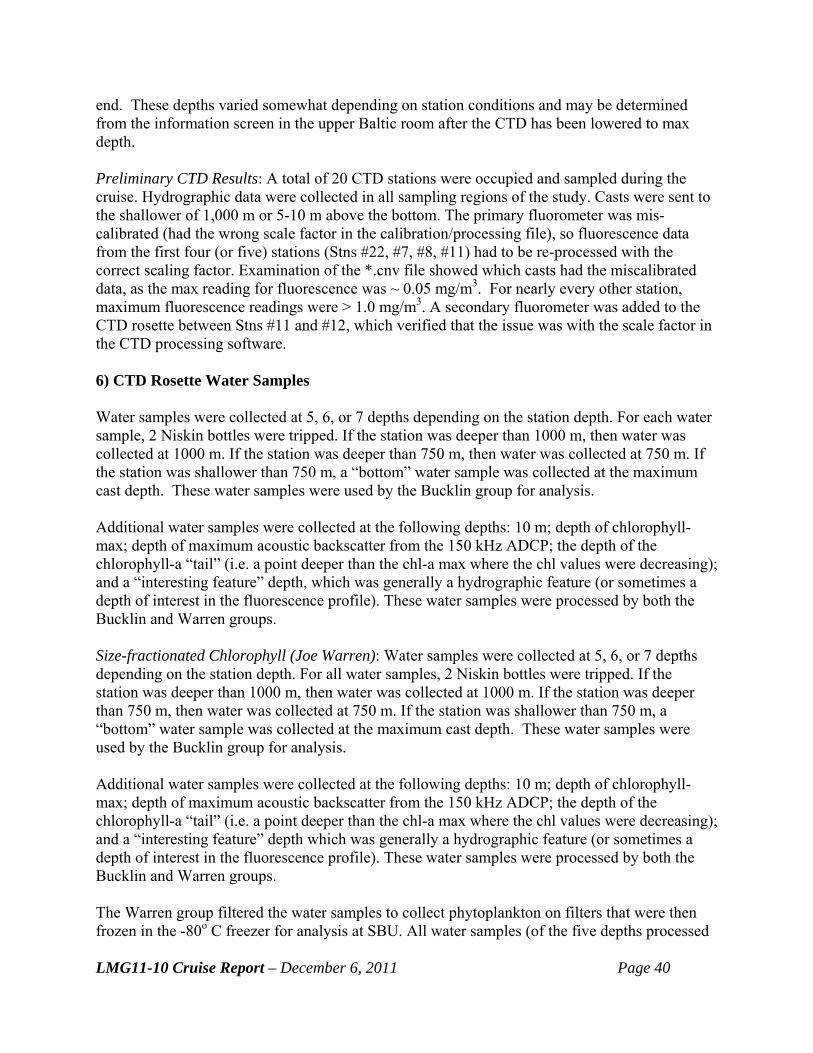
LMG11-10 Cruise Report – December 6, 2011 Page 40
end. These depths varied somewhat depending on station conditions and may be determined from the information screen in the upper Baltic room after the CTD has been lowered to max depth. Preliminary CTD Results: A total of 20 CTD stations were occupied and sampled during the cruise. Hydrographic data were collected in all sampling regions of the study. Casts were sent to the shallower of 1,000 m or 5-10 m above the bottom. The primary fluorometer was mis-calibrated (had the wrong scale factor in the calibration/processing file), so fluorescence data from the first four (or five) stations (Stns #22, #7, #8, #11) had to be re-processed with the correct scaling factor. Examination of the *.cnv file showed which casts had the miscalibrated data, as the max reading for fluorescence was ~ 0.05 mg/m3. For nearly every other station, maximum fluorescence readings were > 1.0 mg/m3. A secondary fluorometer was added to the CTD rosette between Stns #11 and #12, which verified that the issue was with the scale factor in the CTD processing software. 6) CTD Rosette Water Samples Water samples were collected at 5, 6, or 7 depths depending on the station depth. For each water sample, 2 Niskin bottles were tripped. If the station was deeper than 1000 m, then water was collected at 1000 m. If the station was deeper than 750 m, then water was collected at 750 m. If the station was shallower than 750 m, a “bottom” water sample was collected at the maximum cast depth. These water samples were used by the Bucklin group for analysis. Additional water samples were collected at the following depths: 10 m; depth of chlorophyll-max; depth of maximum acoustic backscatter from the 150 kHz ADCP; the depth of the chlorophyll-a “tail” (i.e. a point deeper than the chl-a max where the chl values were decreasing); and a “interesting feature” depth, which was generally a hydrographic feature (or sometimes a depth of interest in the fluorescence profile). These water samples were processed by both the Bucklin and Warren groups. Size-fractionated Chlorophyll (Joe Warren): Water samples were collected at 5, 6, or 7 depths depending on the station depth. For all water samples, 2 Niskin bottles were tripped. If the station was deeper than 1000 m, then water was collected at 1000 m. If the station was deeper than 750 m, then water was collected at 750 m. If the station was shallower than 750 m, a “bottom” water sample was collected at the maximum cast depth. These water samples were used by the Bucklin group for analysis. Additional water samples were collected at the following depths: 10 m; depth of chlorophyll-max; depth of maximum acoustic backscatter from the 150 kHz ADCP; the depth of the chlorophyll-a “tail” (i.e. a point deeper than the chl-a max where the chl values were decreasing); and a “interesting feature” depth which was generally a hydrographic feature (or sometimes a depth of interest in the fluorescence profile). These water samples were processed by both the Bucklin and Warren groups. The Warren group filtered the water samples to collect phytoplankton on filters that were then frozen in the -80o C freezer for analysis at SBU. All water samples (of the five depths processed

LMG11-10 Cruise Report – December 6, 2011 Page 41
by the Warren group) were filtered on 2 um poresize filters. Water samples from the chl-a max and the maximum acoustic backscatter depths were also filtered on 5 and 20 um filters. For a few stations, all five depths sampled by the Warren group were filtered at all 3 filter sizes (2, 5, and 20 um). Triplicate samples were done for all depths/filters. In total, 558 filters were collected for post-cruise analysis. Nutrients (Paola Batta-Lona, University of Connecticut): A specific objective at cruise LMG11-10 was to relate nutrient concentrations and other environmental parameters with the presence or absence of the Southern Ocean salp, Salpa thompsoni. The primary nutrients necessary for photosynthesis (phosphate, nitrate and silicate) were sent to UConn for quantification using water samples obtained from the CTD rosette. In contrast to most other oceanic regions, in the Southern Ocean these nutrients are generally abundant in the surface layer because of presence of additional limiting factors, such as iron. Water samples to measure nutrients were collected from each bottle of the CTD rosette. Usually, bottles were tripped at 7 depths: Warren’s planned sampling (3-5 depths) plus 750m and 1,000m, when the CTD cast was extended to 1,000 m to match the depth of the MOC-1 tow. A filtering capsule with a 0.2μm was used to filter water for nutrients. Water was run through the capsule for a minute. Three scintillation vials were filled with 10ml. The scintillation vials were filled only half way and closed loosely to avoid damage after freezing. The samples were frozen immediately at -20°C. The samples were shipped frozen for processing at UConn Marine Sciences. Particulate Organic Matter (Paola Batta-Lona, University of Connecticut): Our goal was to characterize the particulate distribution in the water column and relate it to the presence or absence of Salpa thompsoni. Salps are indiscriminate filter feeders, so they are assumed to ingest all particulate matter (both living and detrital) small enough to fit through their mouth and large enough to be trapped by the mucus net. This may include particles as small as 1‐2 μm. During LMG11-10, 1,000ml of water were collected from 7 bottles of the CTD rosette for particulate analysis. The water was filtered through pre-weighed and pre-combusted Whatman GFF filters. After filtration, the filters were placed immediately in a -80°C freezer. The deep-frozen filters were shipped to UConn Marine Sciences for analysis. In the laboratory, filters were oven-dried for 48 hr at 60° C and weighed again. To measure total organics (TO), filters were ashed at 500° C for 24 hr in a muffle furnace. C:H:N ratios (Paola Batta-Lona, University of Connecticut): For C:H:N analysis, 500 ml was filtered through each of two different filtration funnels. For both particulates and C:H:N, the filters were folded in half, wrapped in aluminum foil, and frozen immediately at -80o C. Filters were shipped deep-frozen (-80o C) to UConn Marine Sciences for analysis.

V. Individual Project Reports LMG11-10 included two projects, one led by Ann Bucklin (B-285-L) and one led by Joe Warren (B-285-L), which were both focused on the Southern Ocean salp, Salpa thompsoni. 1) Project B-285-L (Ann Bucklin) Salp Collection and Flash-Freezing (Paola G. Batta-Lona, University of Connecticut) The Southern Ocean Salpa thompsoni is subject to severe environmental (temperature) and biological conditions (food availability, energetic constraints, timing of reproduction), as well as marked seasonal variability and long-term climate change. There is an urgent need to understand
the potential for salps to adapt to climate change, yet few molecular resources are available for this species or its close relatives.
LMG11-10 Cruise Report – December 6, 2011 Page 42
The goals of this effort are to analyze the S. thompsoni transcriptome by whole-genome RNA sequencing and to characterize gene expression profiles in relation to life history processes and environmental conditions. Specimens of S. thompsoni were identified from samples collected from different Southern Ocean locations and flash-frozen for molecular analysis. Environmental data and water samples were collected at the stations sampled and will be used to examine correlation among gene expression patterns and biological and physical environmental conditions at the time of collection. During LMG 11-10 cruise, 206 samples collected by IKMT and MOCNESS from 8 different
stations (Fig. 47) were examined for S. thompsoni. In order to ensure proper preservation of specimens and tissue for analysis of DNA and RNA, samples were examined immediately after collection and all salps were removed for identification of species while still living.
Figure 47. LMG11-10 station locations (in red circles) at which salps were collected from either a MOCNESS or IKMT tow.
Figure 48. Numbers of S. thompsoni of different life forms collected from LMG11-10 stations.

LMG11-10 Cruise Report – December 6, 2011 Page 43
Quantification of species of salps was done by counting colonies and zooids. Specimens of S. thomsponi were identified under a dissecting microscope and the stomachs were removed by dissection to avoid contamination of DNA from prey. The remaining tissue was flash frozen in liquid nitrogen and stored at -80 degrees C. The frozen specimens will be returned to the University of Connecticut for molecular analysis at the University’s Center for Applied Genetic Technologies. The samples collected during this expedition are well-suited for the planned transcriptomic analysis, and will also be useful for population genetic studies of Salpa thompsoni. The samples were collected across much of the cruise sampling domain, including both shelf and offshore waters (Fig. 47), and the preserved specimens reflect a variety of life stages and different life forms (Fig. 48). The scientific experiments and analyses to be carried out using the specimens collected during this cruise will be a critical component of Ms. Batta-Lona’s PhD dissertation research in Marine Sciences at the University of Connecticut. Flash-Freezing of Krill (Ann Bucklin, University of Connecticut) Krill that were alive and swimming actively were removed from IKMT and MOCNESS samples, identified visually (but not microscopically) to discriminate Euphausia spp. from other euphausiids, e.g., Thysanoessa macrura. For krill <40 mm in length (rostrum to telson), a section of tail including the telson was excised and placed in alcohol in shell vials that were labeled with sequential numbers. The remainder of the specimen was placed in an individual cryovial with a matching numerical label. Cryovials were immediately flash-frozen in liquid nitrogen, transferred briefly to a -80o C freezer and then into a dry (vapor) LN2 shipper for transfer to UConn for analysis. A total of ~500 individual krill of a wide range of sizes and life stages were collected at a number of stations throughout the cruise (Appendix III).

2) Project B-393-L (Joe Warren) Acoustic backscatter data were recorded by three different systems throughout this cruise. The ship-board Acoustic Doppler Current Profiler (38kHz and 150 kHz), the Biosonics towfish system (38 kHz and 120 kHz splitbeam systems with 7.5o and 10o beamwidths respectively), and a SIMRAD ES60 echosounder deployed from a zodiac (38 and 200 kHz single-beam system). The two echosounders (biosonics towfish, small boat) were calibrated before or during the cruise using a standard target. ADCP: The ADCP is not designed to be used as a quantitative echosounder for the assessment of zooplankton or nekton assemblages; however it can provide very useful data. A MATLAB program was used to access the real-time data from both the 38 kHz and 150 kHz ADCP's on the LMG. Uncalibrated “echograms” were displayed on a laptop computer located in the wet lab. These images/data were used to qualitatively evaluate the location and amount of scatterers in the water column. This information was then used to determine the depth of one water sample on the CTD and for targeted IKMT net tows. Further analysis of ADCP data will occur post cruise. Biosonics Towfish: The USAP/RPSC supplied Biosonics two-frequency towfish was deployed on 8 occasions during the cruise. Sea state, winds, and/or ice limited when the towfish could be safely deployed, towed, and recovered. The towfish was deployed at the end of a station and was towed at a speed of ~3 kts for a period of 2 hrs as we transited to the next station (Fig. 49). The MTs were responsible for rigging of the towfish (although Peter Wiebe provided an excellent suggestion of using a carabiner above the headache ball to keep the data cable out of the water). One MT remained on deck watching the towfish during the deployments.
Figure 49. Locations of the deployments of the Biosonics Towfish during LMG11-10.
LMG11-10 Cruise Report – December 6, 2011 Page 44

Figure 50. Calibration of Biosonics Towfish at the dock at Palmer Station (left) and towfish being towed from the LMG during a survey transect (right). Photos Joe Warren
The towfish was calibrated at the dock at Palmer station on 08 November in extremely adverse/windy/snowy conditions (Fig. 50). The dock location is not ideal as the water depth is extremely shallow, but given the logistical difficulties of trying to calibrate the towfish in open water, this was deemed the most prudent spot to do so. The towfish is limited in that it will only record to depths of 250 m on both frequencies (at least that was a limit that I could not overcome no matter what I did within the settings). The towfish was typically towed at a depth in the water of between 1-2 m depending on sea state and swell. Towfish data are recorded on a LMG-supplied Toughbook laptop computer and subsequently were transferred to a portable hard drive for post-cruise analysis. Small-boat Acoustic Surveys: A zodiac was equipped for small-scale acoustic surveys with a
weather dodger, pelican case (containing a battery, Simrad ES 60 GPT, laptop computer, GPS receiver puck, and externally located waterproof keyboard and mouse), and a transom-mounted 38 and 200 kHz transducer (Fig. 51). The small boat was deployed on three different occasions during the cruise (Fig. 52). The first site was in between King George and Elephant Island on 17 November at 1644 GMT. The second site was offshore (in 3 km of water) on 22 November at 1905 GMT. The final deployment was in Flandres Bay on 25 November at 1159 GMT. At the beginning of the third deployment, the system was calibrated using a 38.1 mm Tungsten carbide sphere.
Figure 51. Equipment for small-scale acoustic surveys: pelican case with an echosounder and data acquisition laptop. Photo Joe Warren
LMG11-10 Cruise Report – December 6, 2011 Page 45

Figure 52. Location of small-boat acoustic survey deployments during LMG11-10.
Survey tracks for each day were dependent on the size and direction of the dominant sea state. In Flandres Bay, the dominant feature affecting survey trackline was the presence of ice floes and pieces in various sizes and configurations. The first two deployments lasted ~ 3 hrs each with typical survey speeds of 3-4 kts. The final deployment in Flandres Bay lasted ~ 9 hrs.
Density Measurements: In order to properly parameterize acoustic scattering models for different types of zooplankton, information on the animal's material properties (size, shape, density and soundspeed contrast with the surrounding seawater) are needed. We collected these measurements on live animals collected from the IKMT net tows. Additionally, an experiment in which adult krill from one net tow were maintained in shipboard aquaria in low-food conditions was conducted. Individual animals were maintained in shipboard aquaria either in the aquarium room or in the cold van. Issues occurred with temperatures in the cold van being too cold such that the seawater in the aquaria in there would ice over. Additionally, the presence of people (and the incandesent lights) would raise the air temp in the cold van from 0o C to nearly 10o C in 60-90 min. Density contrast measurements were made on individual zooplankton that were anesthetized in a sodium bicarbonate saturated solution. Animals were placed in beakers containing either sea water (from the flow-through system in the aquarium room) or a mixture of 50% seawater and 50% glycerin (Fig. 53).
Figure 53. Density contrast measurement apparatus in cold van. Photo Joe Warren
LMG11-10 Cruise Report – December 6, 2011 Page 46

If animals floated, then the lighter solution (seawater) was added until the animal was neutrally buoyant. If the animal sank, then the heavier solution (50-50 mix) was added until the animal was neutrally buoyant. The volume of each fluid at this point was recorded along with the time, temperature of the solution. Measurements of individual animal biovolume were made using the displacement method when they were large enough (minimum biovolume size ~ 0.05 ml). In total, we measured the density contrast of 912 individual zooplankton representing 17 different taxanomic categories (adult and juvenile euphausiids (primarily E. superba and T. macrura), salps, amphipods, two types of gastropods (clione and limacina), larval fish and fish eggs, chaetognaths, polychaetes, gelatinous zooplankton including ctenophores, jellyfish parts, siphonophore bracts, copepod and sipunculid, as well as the experimental starved krill measurements.
Figure 54. Preliminary data of individual zooplankton density contrast value
Preliminary data show that krill and other crustacean have density contrasts much higher than the gelatinous zooplankton, larval animals, or shell-less pteropods (Fig. 54). Krill density contrast varied from animal to animal although there do appear to be some differences seen between adult and juvenile animals and between E. superba and T. macrura (although those may also be the result of environmental differences; Fig. 55). Some of these measurements are the first of their kind for some of the aforementioned species.
LMG11-10 Cruise Report – December 6, 2011 Page 47

Figure 55. Preliminary histograms of krill (adult and juvenile E. superba, T. macrura, and starved E. superba) density contrast (g).
Animal Morphology Measurements: Groups of animals were photographed with a scale bar (transparent ruler) in the frame such that post-cruise analysis can measure animal length and body shape (Fig. 56). For most animals, two photographs were taken: a side-view (animal laying on its right side) and a dorsal (top-down) view. For some animals, additional measurements were made of body wall thickness (i.e. salps) or other parameters. Additionally, we believe that the photographs may allow us to quantify the relative feeding state of the animals as many krill (for example) had very bright stomachs containing large quantities of phytoplankton.
LMG11-10 Cruise Report – December 6, 2011 Page 48
Figure 56. Example photographs of animals (E. superba; side-view left, dorsal-view middle and S. thompsoni; right) which will allow measurement of each animal’s 3-dimensional shape post-cruise.
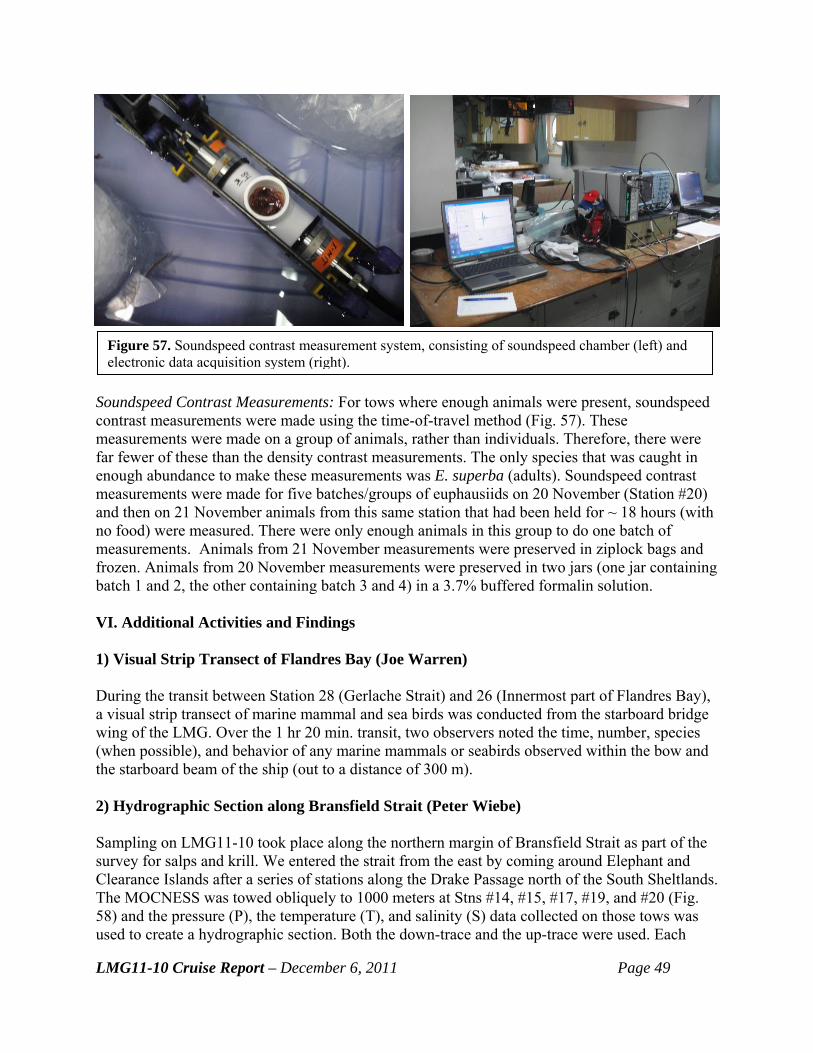
Figure 57. Soundspeed contrast measurement system, consisting of soundspeed chamber (left) and electronic data acquisition system (right).
Soundspeed Contrast Measurements: For tows where enough animals were present, soundspeed contrast measurements were made using the time-of-travel method (Fig. 57). These measurements were made on a group of animals, rather than individuals. Therefore, there were far fewer of these than the density contrast measurements. The only species that was caught in enough abundance to make these measurements was E. superba (adults). Soundspeed contrast measurements were made for five batches/groups of euphausiids on 20 November (Station #20) and then on 21 November animals from this same station that had been held for ~ 18 hours (with no food) were measured. There were only enough animals in this group to do one batch of measurements. Animals from 21 November measurements were preserved in ziplock bags and frozen. Animals from 20 November measurements were preserved in two jars (one jar containing batch 1 and 2, the other containing batch 3 and 4) in a 3.7% buffered formalin solution. VI. Additional Activities and Findings 1) Visual Strip Transect of Flandres Bay (Joe Warren) During the transit between Station 28 (Gerlache Strait) and 26 (Innermost part of Flandres Bay), a visual strip transect of marine mammal and sea birds was conducted from the starboard bridge wing of the LMG. Over the 1 hr 20 min. transit, two observers noted the time, number, species (when possible), and behavior of any marine mammals or seabirds observed within the bow and the starboard beam of the ship (out to a distance of 300 m). 2) Hydrographic Section along Bransfield Strait (Peter Wiebe) Sampling on LMG11-10 took place along the northern margin of Bransfield Strait as part of the survey for salps and krill. We entered the strait from the east by coming around Elephant and Clearance Islands after a series of stations along the Drake Passage north of the South Sheltlands. The MOCNESS was towed obliquely to 1000 meters at Stns #14, #15, #17, #19, and #20 (Fig. 58) and the pressure (P), the temperature (T), and salinity (S) data collected on those tows was used to create a hydrographic section. Both the down-trace and the up-trace were used. Each
LMG11-10 Cruise Report – December 6, 2011 Page 49

pressure, temperature, and salinity values on a tow had an accompanying latitude and longitude value, so it was possible to compute the distance of each point from the origin, which was the start of the tow at station 14. These distances were used as the x-axis on the sections. The white vertical lines in the section plots (Fig. 59) are the track of each net two as it went from the surface to 1000 m and back to the surface.
LMG11-10 Cruise Report – December 6, 2011 Page 50
The data from those profiles were used to create and interpolated (kriged) view of temperature and salinity values. The GLOBEC Kriging Software Package – EasyKrig3.0 (see ftp://globec.whoi.edu/pub/software/kriging/easy_krig) was used to compute the interpolated fields. Although the number of profiles is small and the spacing wide, the T and S sections provide a basis for comparison with previous hydrographic work in the Bransfield strait. Stern and Heywood (1994) summarized the physical oceanography of the strait. Relatively warm deep water (WDW - above 0 C) from the offshore Antarctic Circumpolar Current enters the southern portion of the Bransfield strait through a channel between the Islands of Snow and Smith on the outer margin of the shelf, flows past Low Island and into the strait between Deception and Trinity Islands. This water is identified by being warmer than 0 C and with a salinity of about 34.5 PSU. Such water is evident at station 20, which was situated between Low, Trinity, and Deception Islands (see Fig. 59). According to Stern and Heywood (1994, p. 15): “Deep Basins within the strait contain only Bottom Water, which
is colder and more saline than the Antarctic Bottom water of the Drake Passage and the Scotia Sea, and which is formed in situ during the seasonal freeze of Surface Water.” This water,
Figure 58. LMG11-10 stations in Bransfield Strait from which the temperature and salinity data were mapped. Stations are indicated by number; islands are indicated by letter and named at right.
Figure 59. A) Temperature and B) salinity sections for Bransfield Strait. Distance from Stn #14 is shown on the x-axis; tracks of the MOCNESS are shown as white vertical lines.
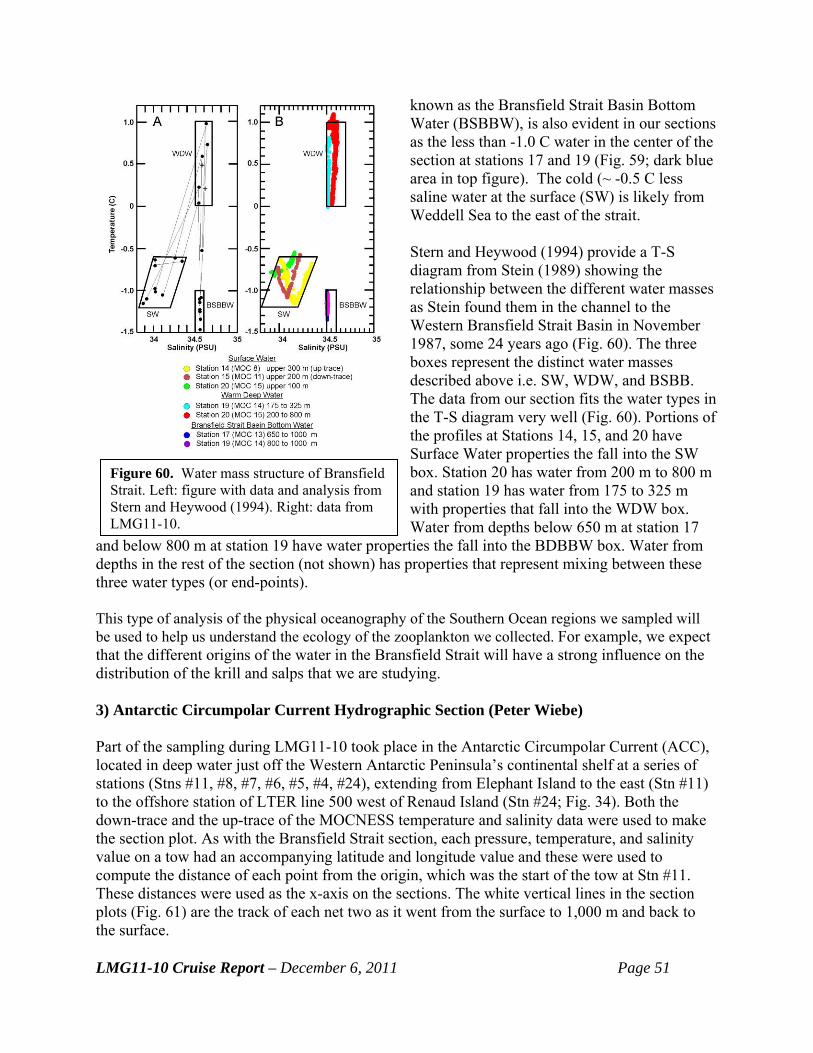
known as the Bransfield Strait Basin Bottom Water (BSBBW), is also evident in our sections as the less than -1.0 C water in the center of the section at stations 17 and 19 (Fig. 59; dark blue area in top figure). The cold (~ -0.5 C less saline water at the surface (SW) is likely from Weddell Sea to the east of the strait.
LMG11-10 Cruise Report – December 6, 2011 Page 51
Stern and Heywood (1994) provide a T-S diagram from Stein (1989) showing the relationship between the different water masses as Stein found them in the channel to the Western Bransfield Strait Basin in November 1987, some 24 years ago (Fig. 60). The three boxes represent the distinct water masses described above i.e. SW, WDW, and BSBB. The data from our section fits the water types in the T-S diagram very well (Fig. 60). Portions of the profiles at Stations 14, 15, and 20 have Surface Water properties the fall into the SW box. Station 20 has water from 200 m to 800 m and station 19 has water from 175 to 325 m with properties that fall into the WDW box. Water from depths below 650 m at station 17
and below 800 m at station 19 have water properties the fall into the BDBBW box. Water from depths in the rest of the section (not shown) has properties that represent mixing between these three water types (or end-points).
Figure 60. Water mass structure of Bransfield Strait. Left: figure with data and analysis from Stern and Heywood (1994). Right: data from LMG11-10.
This type of analysis of the physical oceanography of the Southern Ocean regions we sampled will be used to help us understand the ecology of the zooplankton we collected. For example, we expect that the different origins of the water in the Bransfield Strait will have a strong influence on the distribution of the krill and salps that we are studying. 3) Antarctic Circumpolar Current Hydrographic Section (Peter Wiebe) Part of the sampling during LMG11-10 took place in the Antarctic Circumpolar Current (ACC), located in deep water just off the Western Antarctic Peninsula’s continental shelf at a series of stations (Stns #11, #8, #7, #6, #5, #4, #24), extending from Elephant Island to the east (Stn #11) to the offshore station of LTER line 500 west of Renaud Island (Stn #24; Fig. 34). Both the down-trace and the up-trace of the MOCNESS temperature and salinity data were used to make the section plot. As with the Bransfield Strait section, each pressure, temperature, and salinity value on a tow had an accompanying latitude and longitude value and these were used to compute the distance of each point from the origin, which was the start of the tow at Stn #11. These distances were used as the x-axis on the sections. The white vertical lines in the section plots (Fig. 61) are the track of each net two as it went from the surface to 1,000 m and back to the surface.
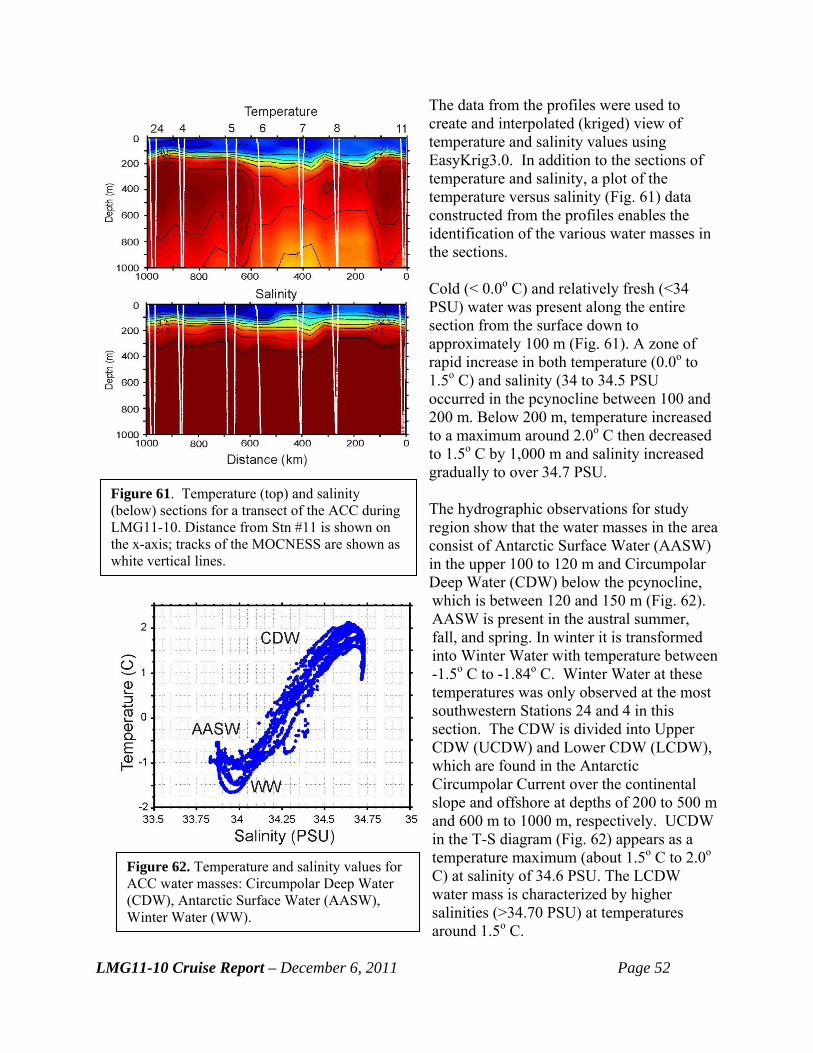
The data from the profiles were used to create and interpolated (kriged) view of temperature and salinity values using EasyKrig3.0. In addition to the sections of temperature and salinity, a plot of the temperature versus salinity (Fig. 61) data constructed from the profiles enables the identification of the various water masses in the sections.
Figure 61. Temperature (top) and salinity (below) sections for a transect of the ACC during LMG11-10. Distance from Stn #11 is shown on the x-axis; tracks of the MOCNESS are shown as white vertical lines.
Figure 62. Temperature and salinity values for ACC water masses: Circumpolar Deep Water (CDW), Antarctic Surface Water (AASW), Winter Water (WW).
Cold (< 0.0o C) and relatively fresh (<34 PSU) water was present along the entire section from the surface down to approximately 100 m (Fig. 61). A zone of rapid increase in both temperature (0.0o to 1.5o C) and salinity (34 to 34.5 PSU occurred in the pcynocline between 100 and 200 m. Below 200 m, temperature increased to a maximum around 2.0o C then decreased to 1.5o C by 1,000 m and salinity increased gradually to over 34.7 PSU. The hydrographic observations for study region show that the water masses in the area consist of Antarctic Surface Water (AASW) in the upper 100 to 120 m and Circumpolar Deep Water (CDW) below the pcynocline, which is between 120 and 150 m (Fig. 62). AASW is present in the austral summer, fall, and spring. In winter it is transformed into Winter Water with temperature between -1.5o C to -1.84o C. Winter Water at these temperatures was only observed at the most southwestern Stations 24 and 4 in this section. The CDW is divided into Upper CDW (UCDW) and Lower CDW (LCDW), which are found in the Antarctic Circumpolar Current over the continental slope and offshore at depths of 200 to 500 m and 600 m to 1000 m, respectively. UCDW in the T-S diagram (Fig. 62) appears as a temperature maximum (about 1.5o C to 2.0o C) at salinity of 34.6 PSU. The LCDW water mass is characterized by higher salinities (>34.70 PSU) at temperatures around 1.5o C.
LMG11-10 Cruise Report – December 6, 2011 Page 52

LMG11-10 Cruise Report – December 6, 2011 Page 53
Literature Cited Stern, M., and R.B. Heywood (1994) Antarctic environment - physical oceanography: the Antarctic Peninsula and Southwest Atlantic region of the Southern Ocean. In Southern Ocean Ecololgy: The BIOMASS Perspective, S. Z. El-Sayed [Ed], Cambridge University Press, New York. Pages 11-24.

LMG11-10 Cruise Report – December 6, 2011 Page 54
VII. LMG11-10 participants: Edison Chouest Offshore (15 persons) Joseph C. Abshire, Captain Scott Davis, Chief Mate Peter Kaple, 2nd Mate Andrew Merget, 3rd Mate Mike Brett, Chief Engineer Fernando Avila, 1st Asst. Engineer Ryan Gannon, 2nd Asst. Engineer Noli Tamayo, 2nd Oiler Lloyd Aguirre, Oiler Roberto Cortez, AB Bosun Arnulfo Aaron, AB Samuel Guillermo, AB Rameses Farrow, Chief Steward Romeo Agonias, Cook Patricio DelCampo, Galley Hand Raytheon Polar Services Marine Staff (8 persons) Jullie Jackson, Marine Project Coordinator George Aukon, Electronics Technician Kris Merrill, Electronics Technician Melissa Paddock, Marine Science Technician Krista Tyburski, Marine Technician Kari Anderson, Marine Technician Kelley Watson, Marine Technician Alan Shaw, Marine Technician Science Personnel on the cruise (8 persons) Project B-285-L Ann Bucklin, PI Peter Wiebe Paola Batta Lona Chelsea Stanley Project B-393-L Joe Warren, PI Katharine Wurtzell Melissa Patrician Melissa Mazzocco Southbound Personnel disembarking at Cape Shirreff (5 persons) Mike Goebel PI/Team Leader Kevin Pietrzak McKenzie Mudge

LMG11-10 Cruise Report – December 6, 2011 Page 55
Nicole (Ashley) Cook Jay Wright Southbound Personnel disembarking at Palmer Station (2 persons) Shawn Farry (Project B-013-P) Jennifer Blum (Project B-013-P) Round-trip Passenger disembarking at Palmer, then re-embarking Charles (Mike) Epperson, RPSC Fire Technician Northbound Passengers Embarking at Palmer Station (6 persons) Science Deneb Karentz (Project B-466-P) Austin Gajewski (Project B-466-P) Bethany Goodrich (Project B-466-P) Iva Neveux (Project B-466-P) RPSC Bede McCormick (Satcom Engineer) Bamma Mellott (Cargo person) Northbound Passenger Embarking at Copa (Admiralty Bay, King George Island) Susan Trivelpiece

LMG11-10 Cruise Report – December 6, 2011 Page 56
Appendix I. LM Gould Cruise LMG11-10 Event Log
Local Time
Univ. Coor. Time (UCT)
Cast Scientific
eventno
Instr
cast#
Consec. Station#
Standard Station #
Mth Day hhmm
Event s/e Mth Day hhmm
Latitude (°S) Deg. Min.
Longitude (°W) Deg. Min.
Water Depth Depth Invest. Comments
lmg30611.001 dock 11 2 1130 s 11 2 1430 53 10.17 70 54.4 leave PA
lmg30711.001 xbt 1 11 3 1538 s/e 11 3 1838 54 48 nd? SALT/TCO2
lmg30711.002 xbt 2 11 3 1546 s/e 11 3 18:46 54 54.03 64 57.83
lmg30711.003 xbt 3 11 3 1619 s/e 11 3 19:19 55 0 64 57.8 SALT/TCO2
lmg30711.004 xbt 4 11 3 1653 s/e 11 3 19:53 55 6.02 64 54.91 1676 950
lmg30711.005 xbt 5 11 3 1727 s/e 11 3 20:27 55 12.09 64 51.88
lmg30711.006 xbt 6 11 3 1802 s/e 11 3 21:02 55 18.16 64 48.71
lmg30711.007 xbt 7 11 3 1835 s/e 11 3 21:35 55 24.05 64 45.82
lmg30711.008 xbt 8 11 3 1909 s/e 11 3 22:09 55 30.02 64 42.75
lmg30711.009 xbt 9 11 3 1944 s/e 11 3 22:44 55 36.02 64 39.75
lmg30711.010 xbt 10 11 3 2019 s/e 11 3 23:19 55 42.02 64 36.6
lmg30711.011 xbt 11 11 3 2055 s/e 11 3 23:55 55 48.06 64 33.65
lmg30811.001 xbt 12 11 3 2130 s/e 11 4 00:30 55 54 64 30.54
lmg30811.002 xbt 13 11 3 2206 s/e 11 4 01:06 56 0.03 64 27.35 SALT/TCO2
lmg30811.003 xctd 2 11 3 2211 s/e 11 4 01:11:41 56 0.8501 64 26.902 3694 1100 serial number 06069013
lmg30811.004 xbt 14 11 3 2241 s/e 11 4 01:41 56 5.99 64 24.27
lmg30811.005 xbt 15 11 3 2315 s/e 11 4 02:15 56 12.08 64 21.13
lmg30811.006 xbt 16 11 3 2348 s/e 11 4 02:48 56 18.01 64 17.97
lmg30811.007 xbt 17 11 4 0019 s/e 11 4 03:19 56 24.08 64 14.66
lmg30811.008 xbt 18 11 4 0050 s/e 11 4 03:50 56 30.02 64 11.76 SALT/TCO2
lmg30811.009 xctd 3 11 4 0051 s/e 11 4 03:51:10 56 30.212 64 11.654 3179 1043 serial number 09075189
lmg30811.010 xbt 19 11 4 0121 s/e 11 4 04:21 56 36.1 64 8.57
lmg30811.011 xbt 20 11 4 0152 s/e 11 4 04:52 56 42.02 64 5.52
lmg30811.012 xbt 21 11 4 0223 s/e 11 4 05:23 56 48.04 64 2.33
lmg30811.013 xbt 22 11 4 0256 s/e 11 4 05:56 56 54 64 58 22 failed
lmg30811.014 xbt 23 11 4 0257 s/e 11 4 05:57 56 54.26 63 58.97

LMG11-10 Cruise Report – December 6, 2011 Page 57
Local Time
Univ. Coor. Time (UCT)
Cast Scientific
eventno
Instr
cast#
Consec. Station#
Standard Station #
Mth Day hhmm
Event s/e Mth Day hhmm
Latitude (°S) Deg. Min.
Longitude (°W) Deg. Min.
Water Depth Depth Invest. Comments
lmg30811.015 xctd 4 11 4 0329 s/e 11 4 06:29:45 57 0.111 63 55.938 3951 the data sheet says xctd only
lmg30811.016 xbt 24 11 4 0404 s/e 11 4 07:04 57 6.15 63 53.04
lmg30811.017 xbt 25 11 4 0437 s/e 11 4 07:37 57 12 nd bad probe
lmg30811.018 xbt 26 11 4 0442 s/e 11 4 07:42 57 12.75 63 49.22 25 went to 452m - bad , 26 ok at 07:42
lmg30811.019 xctd 5 11 4 0514 s/e 11 4 08:14:56 57 18.217 63 46.318 4136 serial number 06069014
lmg30811.020 xbt 27 11 4 0548 s/e 11 4 08:48 57 23.99 63 43.17
lmg30811.021 xbt 28 11 4 0624 s/e 11 4 09:24 57 30.33 63 39.7 SALT/TCO2
lmg30811.022 xctd 6 11 4 0628 s/e 11 4 09:28:23 57 31.030 63 39.314 4103 serial number 06016368
lmg30811.023 xbt 29 11 4 0654 s/e 11 4 09:54 57 35.96 63 36.63
weird data joe convinced us to do another one
lmg30811.024 xbt 30 11 4 0657 s/e 11 4 09:57 57 36.52 63 36.34
lmg30811.025 xbt 31 11 4 0727 s/e 11 4 10:27 57 42.04 63 33.28
lmg30811.026 xbt 32 11 4 0759 s/e 11 4 10:59 57 47.87 63 30
lmg30811.027 xctd 7 11 4 0802 s/e 11 4 11:02:52 57 48.530 63 29.655 3927 serial number 06016371
lmg30811.028 xbt 33 11 4 0832 s/e 11 4 11:32 57 53.98 63 26.94 failed
lmg30811.029 xbt 34 11 4 0834 s/e 11 4 11:34 57 54.43 63 26.74
lmg30811.030 xbt 35 11 4 0905 s/e 11 4 12:05 58 0.12 63 23.81 SALT/TCO2
lmg30811.031 xctd 8 11 4 0909 s/e 11 4 1209 58 0.696 63 23.494 nd serial number 09075186
lmg30811.032 xbt 36 11 4 0941 s/e 11 4 1241 58 06 nd failed
lmg30811.033 xbt 37 11 4 0941 s/e 11 4 1241 58 06 nd failed
lmg30811.034 xbt 38 11 4 0945 s/e 11 4 12:45 58 7.4 63 19.69
lmg30811.035 xbt 39 11 4 1010 s/e 11 4 13:10 58 12.09 63 17.17
lmg30811.036 xbt 40 11 4 1043 s/e 11 4 13:43 58 18.03 63 13.89
lmg30811.037 xbt 41 11 4 1116 s/e 11 4 14:16 58 24.06 63 10.56
lmg30811.038 xbt 42 11 4 1148 s/e 11 4 14:48 58 30.03 63 7.18 SALT/TCO2 1141965
lmg30811.039 xctd 9 11 4 1151 s/e 11 4 14:51:27 58 30.547 63 6.918 3473 6016364
lmg30811.040 xbt 43 11 4 1222 s/e 11 4 15:22 58 36.1 63 4.14
lmg30811.041 xbt 44 11 4 1256 s/e 11 4 15:56 58 42.01 63 0.53

LMG11-10 Cruise Report – December 6, 2011 Page 58
Local Time
Univ. Coor. Time (UCT)
Cast Scientific
eventno
Instr
cast#
Consec. Station#
Standard Station #
Mth Day hhmm
Event s/e Mth Day hhmm
Latitude (°S) Deg. Min.
Longitude (°W) Deg. Min.
Water Depth Depth Invest. Comments
lmg30811.042 xbt 45 11 4 1330 s/e 11 4 16:30 58 48.01 62 57.17
lmg30811.043 xbt 46 11 4 1404 s/e 11 4 1704 58 54 nd failed
lmg30811.044 xbt 47 11 4 1407 s/e 11 4 17:07 58 54.62 62 53.69
lmg30811.045 xbt 48 11 4 1438 s/e 11 4 1738 59 00 nd failed
lmg30811.046 xbt 49 11 4 1438 s/e 11 4 17:38 59 0.18 62 50.31 SALT/TCO2
lmg30811.047 xctd 10 11 4 1438 s/e 11 4 17:38:14 59 0.061 62 50.462 4036 6016374
lmg30811.048 xbt 50 11 4 1537 s/e 11 4 18:37 59 6.29 62 47.3
lmg30811.049 xbt 51 11 4 1611 s/e 11 4 19:11 59 12.27 62 43.89
lmg30811.050 xbt 52 11 4 1642 s/e 11 4 19:42 59 18 62 40.58
lmg30811.051 xbt 53 11 4 1715 s/e 11 4 20:15 59 24 62 37.16
lmg30811.052 xbt 54 11 4 1750 s/e 11 4 20:50 59 30.09 62 33.62 SALT/TCO2
lmg30811.053 xctd 11 11 4 1754 s/e 11 4 20:54:13 59 30.800 62 33.209 3938 6016363
lmg30811.054 xbt 55 11 4 1824 s/e 11 4 21:24 59 36.07 62 30.35
lmg30811.055 xbt 56 11 4 1859 s/e 11 4 21:59 59 42.26 62 26.73
lmg30811.056 xbt 57 11 4 1944 s/e 11 4 22:44 59 50.22 62 22.13 58,59 Bad??? No record
lmg30811.057 xbt 60 11 4 2048 s/e 11 4 23:48 60 1 62 15.92 SALT/TCO2 DRIFTER
lmg30811.058 xctd 12 11 4 2053 s/e 11 4 23:53:18 60 1.834 62 15.434 1178 6016367
lmg30911.001 xbt 61 11 4 2129 s/e 11 5 00:29 60 08.0 62 11.89
lmg30911.002 xbt 62 11 4 2216 s/e 11 5 01:16 60 15.98 62 7.2
lmg30911.003 xbt 63 11 4 2301 s/e 11 5 02:01 60 23.94 62 2.48
lmg30911.004 xbt 64 11 4 2335 s/e 11 5 02:35 60 30 61 59.12 XCTD (not recorded) SALT/TCO2
lmg30911.005 xctd 13 11 4 2339 s/e 11 5 02:39 60 30.765 61 58.614 3724
NOW Recorded by PHW 9Dec2011 (serial # 06016366)
lmg30911.006 xbt 65 11 5 0011 s/e 11 5 03:11 60 36.36 61 55.07
lmg30911.007 xbt 66 11 5 0043 s/e 11 5 03:43 60 41.97 61 51.99
lmg30911.008 xbt 67 11 5 0117 s/e 11 5 04:17 60 48 nd No record on Data CD. Apparently failed PHW
lmg30911.009 xbt 68 11 5 0151 s/e 11 5 04:51 60 53.97 61 45
lmg30911.010 xbt 69 11 5 0225 s/e 11 5 05:25 60 59.97 61 41.38 SALT/TCO2
lmg30911.011 xbt 70 11 5 0301 s/e 11 5 06:01 61 6.15 61 37.66

LMG11-10 Cruise Report – December 6, 2011 Page 59
Local Time
Univ. Coor. Time (UCT)
Cast Scientific
eventno
Instr
cast#
Consec. Station#
Standard Station #
Mth Day hhmm
Event s/e Mth Day hhmm
Latitude (°S) Deg. Min.
Longitude (°W) Deg. Min.
Water Depth Depth Invest. Comments
lmg30911.012 xbt 71 11 5 0335 s/e 11 5 06:35 61 12.24 61 34.02
lmg30911.013 xbt 72 11 5 0407 s/e 11 5 07:07 61 17.74 61 30.67
lmg30911.014 xbt 73 11 5 0441 s/e 11 5 07:41 61 23.77 61 27.11
lmg30911.015 xbt 74 11 5 0515 s/e 11 5 08:15 61 29.75 61 23.49
lmg30911.016 xbt 75 11 5 0550 s/e 11 5 08:50 61 35.89 61 19.82
lmg30911.017 xbt 76 11 5 0624 s/e 11 5 09:24 61 41.9 61 16.19
lmg30911.018 xbt 77 11 5 0648 s/e 11 5 09:48 61 46.17 61 13.57
lmg30911.019 xbt 78 11 5 0708 s/e 11 5 10:08 61 49.74 61 11.32 SALT/TCO2
lmg30911.020 cape Shirreff 11 5 1104 s 11 5 14:04 62 28.05 60 43.87 Arrived at Cape Shirreff for camp setup
lmg31011.001 cape Shirreff 11 6 1727 e 11 6 20:27 62 28.05 60 43.87 Left without being able to set up the camp
lmg31111.001 Palmer station 11 7 1635 s 11 7 19:35 64 46.31 64 3.48 Arrived and now starting to try to dock
lmg31111.002 Palmer station 11 7 1930 s 11 7 22:30 64 46.31 64 3.48 Tied up at the dock
lmg31211.001 Towfish 11 8 1453 s 11 8 17:53 64 46.31 64 3.48
BioSonics Towfish Calibration 38 and 120 kHz
lmg31211.002 Towfish 11 8 1711 e 11 8 20:11 64 46.31 64 3.48 End Towfish calibration
lmg31311.001 Palmer station 11 9 647 e 11 9 9:47 64 46.31 64 3.48 Left Palmer Station
lmg31311.002 CTD 1&2 1 22 11 9 1519 s 11 9 18:19 64 02.30 61 41.56 1032.3 1027 Warren cast 1 does not exist due to data log problem
lmg31311.003 CTD 1&2 1 22 11 9 1628 e 11 9 19:28 64 02.28 61 41.52 1032.3 1027 Warren
lmg31311.004 IKMT 1 1 22 11 9 1650 s 11 9 19:50 64 02.32 61 41.65 1062 175 Warren
lmg31311.005 IKMT 1 1 22 11 9 1733 e 11 9 2033 64 01.11 61 41.99 1062 175 Warren
lmg31311.006 MOC1 1 1 22 11 9 1922 s 11 9 2222 64 02.26 61 41.55 1218 1000 Wiebe
lmg31411.001 MOC1 1 1 22 11 9 2157 e 11 10 0057 63 57.83 61 39.47 1218 1000 Wiebe very nice first tow
lmg31411.002 cape Shirreff 11 10 1000 s 11 10 1300 62 27.96 60 43.31
Arrived at Cape Shirreff for camp setup again
lmg31411.003 cape Shirreff 11 10 1950 e 11 10 2250 62 27.96 60 43.31 Departed Cape Shirreff for Stn 7
lmg31511.001 CTD 3 2 7 11 10 2311 s 11 11 0211 62 01.688 60 48.157 1390 1000 Warren
lmg31511.002 CTD 3 2 7 11 11 0027 e 11 11 0327 62 01.731 60 48.022 1390 1000 Warren
lmg31511.003 MOC1 2 2 7 11 11 0301 s 11 11 0601 62 01.58 60 48.76 1388 1000 Wiebe

LMG11-10 Cruise Report – December 6, 2011 Page 60
Local Time
Univ. Coor. Time (UCT)
Cast Scientific
eventno
Instr
cast#
Consec. Station#
Standard Station #
Mth Day hhmm
Event s/e Mth Day hhmm
Latitude (°S) Deg. Min.
Longitude (°W) Deg. Min.
Water Depth Depth Invest. Comments
lmg31511.004 MOC1 2 2 7 11 11 0553 e 11 11 0853 62 0.389 60 59.890 1388 1000 Wiebe
net 8 cod-end was caught in net 0 therefore it was empty at the surface.
lmg31511.005 IKMT 2 2 7 11 11 0435 s 11 11 0735 62 00.240 60 57.218 1683 50 Warren
lmg31511.006 IKMT 2 2 7 11 11 0450 e 11 11 0750 62 00.086 60 58.616 1683 50 Warren
lmg31511.007 CTD 4&5 3 8 11 11 1442 s 11 11 1742 61 33.848 58 55.898 1701 1000 Warren
lmg31511.008 CTD 4&5 3 8 11 11 1609 e 11 11 1909 61 33.837 58 55.754 1701 1000 Warren
lmg31511.009 MOC1 3 3 8 11 11 1653 s 11 11 1953 61 33.5 58 56.07 1709 1000 Wiebe Nice tow
lmg31511.010 MOC1 3 3 8 11 11 1959 e 11 11 2259 61 28.34 59 01.58 1709 1000 Wiebe
lmg31611.001 IKMT 3 3 8 11 11 2238 s 11 12 0138 61 29.342 59 00.571 2232 38 Warren
lmg31611.002 IKMT 3 3 8 11 11 2304 e 11 12 0204 61 28.824 59 01.043 2232 38 Warren
lmg31711.001 CTD 6 4 11 11 13 0719 s 11 13 1019 60 44.105 54 56.021 3245 1000 Warren
lmg31711.002 CTD 6 4 11 11 13 0838 e 11 13 1138 60 44.119 54 56.067 3245 1000 Warren
lmg31711.003 MOC1 4 4 11 11 13 0634 s 11 13 0934 60 43.61 54 56.51 3248 2500 Wiebe
lmg31711.004 MOC1 4 4 11 11 13 1133 e 11 13 1433 60 35.049 55 0.449 3248 2500 Wiebe
lmg31711.005 IKMT 4 4 11 11 13 1314 s 11 13 1614 60 37.116 54 59.802 3307 30 Warren
lmg31711.006 IKMT 4 4 11 11 13 1338 e 11 13 1638 60 36.323 55 00.024 3307 30 Warren
lmg31811.001 MOC1 5 5 12 11 14 1950 s 11 14 2250 60 53.966 53 44.785 800 750 Wiebe
lmg31911.001 MOC1 5 5 12 11 14 2210 e 11 15 110 60 50.729 53 53.46 800 750 Wiebe
lmg31911.002 CTD 7 5 12 11 14 2242 s 11 15 0142 60 50.251 53 53.803 870 839 Warren
lmg31911.003 CTD 7 5 12 11 14 2353 e 11 15 253 60 50.268 53 53.917 870 839 Warren
lmg31911.004 IKMT 5 5 12 11 15 0045 s 11 15 0345 60 50.120 53 54.159 870 84.8 Warren
lmg31911.005 IKMT 5 5 12 11 15 0101 e 11 15 0401 60 49.927 53 55.104 870 84.8 Warren
lmg31911.006 CTD 8 6 13 11 15 0520 s 11 15 0820 61 23.213 53 33.877 752 729.7 Warren
lmg31911.007 CTD 8 6 13 11 15 0614 e 11 15 0914 61 23.214 53 33.812 752 729.7 Warren
lmg31911.008 IKMT 6 6 13 11 15 1120 s 11 15 14:20 61 21.684 53 33.304 675 175 Warren Used as quantitative sample
lmg31911.009 IKMT 6 6 13 11 15 1151 e 11 15 1451 61 21.107 53 33.992 672 175 Warren
lmg31911.010 IKMT 7 6 13 11 15 1220 s 11 15 1520 61 20.667 53 34.154 699 53.1 Warren
lmg31911.011 IKMT 7 6 13 11 15 1238 e 11 15 1538 61 20.256 53 34.390 699 53.1 Warren
lmg31911.012 Towfish 1 6 13 11 15 1344 s 11 15 1644 61 19.9 53 34.7 699 Warren
lmg31911.013 Towfish 1 6 13 11 15 1620 e 11 15 1920 61 24.2 53 46.9 699 Warren

LMG11-10 Cruise Report – December 6, 2011 Page 61
Local Time
Univ. Coor. Time (UCT)
Cast Scientific
eventno
Instr
cast#
Consec. Station#
Standard Station #
Mth Day hhmm
Event s/e Mth Day hhmm
Latitude (°S) Deg. Min.
Longitude (°W) Deg. Min.
Water Depth Depth Invest. Comments
lmg32011.001 CTD 9 7 14 11 15 2124 s 11 16 0024 61 44.819 55 08.170 2124 1000.7 Warren
lmg32011.002 CTD 9 7 14 11 15 2233 e 11 16 0133 61 44.976 55 08.061 2124 1000.7 Warren
lmg32011.003 MOC1 6 7 14 11 15 2326 s 11 16 0226 61 45.11 55 08.09 2116 91 Wiebe Cast aborted; sample was taken from Net 0
lmg32011.004 MOC1 6 7 14 11 15 2354 e 11 16 0254 61 44.53 55 08.05 2116 91 Wiebe
lmg32011.005 MOC1 7 7 14 11 16 0200 s 11 16 0500 61 44.66 55 08.39 2116 Wiebe Cast aborted; sample was taken from Net 0
lmg32011.006 MOC1 7 7 14 11 16 0222 e 11 16 0522 61 44.09 55 11.10 2116 Wiebe
lmg32011.007 MOC1 8 7 14 11 16 0258 s 11 16 0558 61 43.778 55 12.839 2116 Wiebe
lmg32011.008 MOC1 8 7 14 11 16 0613 e 11 16 0913 61 44.515 55 22.863 2116 Wiebe
lmg32011.009 CTD 10 8 15 11 16 1033 s 11 16 1333 61 54.970 56 15.872 1911 1000 Warren
lmg32011.010 CTD 10 8 15 11 16 1201 e 11 16 1501 61 55.034 56 15.471 1911 1000 Warren
lmg32011.011 MOC1 9 8 15 11 16 1511 s 11 16 1811 61 58.79 56 9.54 2419 Wiebe
Cast aborted; sample was taken from Net 0 and Net 1
lmg32011.012 MOC1 9 8 15 11 16 1606 e 11 16 1906 62 00.30 56 07.2 2419 Wiebe
lmg32011.013 MOC1 10 8 15 11 16 1717 s 11 16 2017 62 02.2 56 03.5 2078 Wiebe
Cast aborted - system died Net 0 sample used for experiments
lmg32011.014 MOC1 10 8 15 11 16 1813 e 11 16 2113 62 03.5 55 59.5 2078 Wiebe
lmg32011.015 MOC1 11 8 15 11 16 1924 s 11 16 2224 61 59.348 56 08. 861 2421 1000 Wiebe
lmg32111.001 MOC1 11 8 15 11 16 2238 e 11 17 0138 62 04.419 55 59.675 2421 1000 Wiebe
lmg32111.002 IKMT 8 8 15 11 16 2309 s 11 17 0209 62 05.117 55 58.104 1417 175.7 Warren
lmg32111.003 IKMT 8 8 15 11 17 0023 e 11 17 0323 62 06.520 55 55.754 1417 175.7 Warren
lmg32111.004 CTD 11 9 16 11 17 0440 s 11 17 0740 61 39.082 56 34.787 566 530.6 Warren
lmg32111.005 CTD 11 9 16 11 17 0531 e 11 17 0831 61 39.108 56 34.972 566 530.6 Warren
lmg32111.006 MOC1 12 9 16 11 17 0901 s 11 17 1201 61 39.103 56 33.654 571 450 Wiebe
lmg32111.007 MOC1 12 9 16 11 17 1052 e 11 17 1352 61 39.498 56 25.986 571 450 Wiebe
lmg32111.008 IKMT 9 9 16 11 17 1148 s 11 17 1448 61 39.558 56 28.926 579 50 Warren
lmg32111.009 IKMT 9 9 16 11 17 1206 e 11 17 1506 61 39.579 56 28.035 570 50 Warren
lmg32111.010 zodiac acous 1 9 16 11 17 1328 s 11 17 1628 61 39.2 56 34.0 570 Warren
lmg32111.011 zodiac acous 1 9 16 11 17 1726 e 11 17 2026 61 40.5 56 36.5 570 Warren
lmg32111.012 Towfish 2 9 16 11 17 1800 s 11 17 2100 61 40.5 56 36.5 570 Warren
lmg32111.013 Towfish 2 9 16 11 17 2012 e 11 17 2312 61 44.7 56 44.9 570 Warren

LMG11-10 Cruise Report – December 6, 2011 Page 62
Local Time
Univ. Coor. Time (UCT)
Cast Scientific
eventno
Instr
cast#
Consec. Station#
Standard Station #
Mth Day hhmm
Event s/e Mth Day hhmm
Latitude (°S) Deg. Min.
Longitude (°W) Deg. Min.
Water Depth Depth Invest. Comments
lmg32211.001 CTD 12 10 17 11 18 0045 s 11 18 0345 62 18.922 57 41.921 1997 999.5 Warren
lmg32211.002 CTD 12 10 17 11 18 0155 e 11 18 0455 62 18.910 57 41.773 1997 999.5 Warren
lmg32211.003 MOC1 13 10 17 11 18 0230 s 11 18 0530 62 18.691 57 41.301 1997 1000 Wiebe
lmg32211.004 MOC1 13 10 17 11 18 0558 e 11 18 0858 62 15 57 29 1997 1000 Wiebe
lmg32211.005 IKMT 10 10 17 11 18 705 s 11 18 1005 63 18.217 57 39.3677 1997 1000 Warren
lmg32211.006 IKMT 10 10 17 11 18 734 e 11 18 1034 62 17.840 57 37.476 1997 1000 Warren
lmg32311.001 CTD 13 11 19 11 19 1442 s 11 19 1742 62 46.106 59 24.265 1485 1000 Warren
lmg32311.002 CTD 13 11 19 11 19 1614 e 11 19 1914 62 46.106 59 34.265 1485 1000 Warren
lmg32311.003 MOC1 14 11 19 11 19 1654 s 11 19 1954 62 42.268 59 28.542 1147 1000 Wiebe
lmg32311.004 MOC1 14 11 19 11 19 2000 e 11 19 2300 62 47.396 59 29.795 1147 1000 Wiebe
lmg32311.005 IKMT 11 11 19 11 19 2051 s 11 19 2351 62 44.679 59 43.412 1447 53.1 Warren
lmg32411.001 IKMT 11 11 19 11 19 2105 e 11 20 0005 62 44.938 59 44.960 1447 53.1 Warren
lmg32411.002 Towfish 3 11 19 11 19 2145 s 11 20 0045 62 46.5 59 36.2 1447 Warren
lmg32411.003 Towfish 3 11 19 11 19 2350 e 11 20 0250 62 50.0 59 47.3 1447 Warren
lmg32411.004 IKMT 12 12 25 11 20 137 s 11 20 437 62 54.569 60 00.893 1070 51.4 Warren
lmg32411.005 IKMT 12 12 25 11 20 212 e 11 20 512 62 54.581 59 58.654 1070 51.4 Warren
lmg32411.006 IKMT 13 12 25 11 20 229 s 11 20 529 62 54.501 59 57.477 1039 26.3 Warren
lmg32411.007 IKMT 13 12 25 11 20 245 e 11 20 545 62 54.467 59 56.247 1039 26.3 Warren
lmg32411.008 CTD 14 13 20 11 20 0806 s 11 20 1106 63 19.172 63 19.166 1224 1000 Warren
lmg32411.009 CTD 14 13 20 11 20 0917 e 11 20 1217 61 29.217 61 29.574 1224 1000 Warren
lmg32411.010 MOC1 15 13 20 11 20 1300 s 11 20 1000 63 21.229 61 37.429 1058 985 Wiebe
lmg32411.011 MOC1 15 13 20 11 20 1248 e 11 20 1548 63 18.563 61 25.532 1058 Wiebe
lmg32411.012 IKMT 14 13 20 11 20 1347 s 11 20 1647 63 18.869 61 25.177 1077 52.2 Warren
lmg32411.013 IKMT 14 13 20 11 20 1417 e 11 20 1717 63 18.374 61 23.116 1077 52.3 Warren
lmg32511.001 CTD 15 14 6 11 21 0556 s 11 21 0856 62 44.756 63 17.490 2193 1000 Warren
lmg32511.002 CTD 15 14 6 11 21 0724 e 11 21 1024 62 44.773 63 17.429 2193 1000 Warren
lmg32511.003 MOC1 16 14 6 11 21 0741 s 11 21 1041 62 44.79 63 16.49 2102 1000 Wiebe
lmg32511.004 MOC1 16 14 6 11 21 1055 e 11 21 1355 62 44.995 63 01.575 2102 1000 Wiebe
lmg32511.005 IKMT 15 14 6 11 21 1159 s 11 21 1449 62 45.149 63 03.888 1744 51 Warren
lmg32511.006 IKMT 15 14 6 11 21 1210 e 11 21 1510 62 45.228 63 02.886 1744 51 Warren
lmg32511.007 Towfish 4 14 6 11 21 1248 s 11 21 1548 62 45.176 63 4.442 2193 Warren

LMG11-10 Cruise Report – December 6, 2011 Page 63
Local Time
Univ. Coor. Time (UCT)
Cast Scientific
eventno
Instr
cast#
Consec. Station#
Standard Station #
Mth Day hhmm
Event s/e Mth Day hhmm
Latitude (°S) Deg. Min.
Longitude (°W) Deg. Min.
Water Depth Depth Invest. Comments
lmg32511.008 Towfish 4 14 6 11 21 1505 e 11 21 1805 62 44.511 63 18.575 2193 Warren
lmg32511.009 CTD 16 15 5 11 21 1900 s 11 21 2200 62 31.544 64 27.559 2433 1001.5 Warren
lmg32511.010 CTD 16 15 5 11 21 2012 e 11 21 2312 62 31.364 64 25.785 2433 1001.5 Warren
lmg32511.011 MOC1 17 15 5 11 21 2033 s 11 21 2333 62 31.509 64 27.195 2647 2500 Wiebe
lmg32611.001 MOC1 17 15 5 11 21 0620 e 11 22 0920 62 45.505 64 56.813 2647 2500 Wiebe
lmg32611.002 IKMT 16 15 5 11 22 0642 s 11 22 0942 62 46.083 64 57.887 3237 100 Warren
lmg32611.003 IKMT 16 15 5 11 22 0720 e 11 22 1020 62 46.849 64 58.994 3237 100 Warren
lmg32611.004 zodiac acous 2 16 4 11 22 1600 s 11 22 1900 63 50.9 67 09.2 3143
lmg32611.005 CTD 17 16 4 11 22 1615 s 11 22 1915 63 51.009 67 09.058 3143 1000 Warren
lmg32611.006 CTD 17 16 4 11 22 1730 e 11 22 2030 63 50.689 67 08.164 3143 1000 Warren
lmg32611.007 zodiac acous 2 16 4 11 22 1926 e 11 22 2226 63 50.6 67 05.9 3143 Warren
lmg32611.008 MOC1 18 16 4 11 22 2007 s 11 22 2307 63 48.143 67 09.524 3255 1500 Wiebe
lmg32711.001 MOC1 18 16 4 11 23 0109 e 11 23 0409 63 56.178 67 13.857 3255 1500 Wiebe
lmg32711.002 IKMT 17 16 4 11 23 0133 s 11 23 0433 63 56.139 67 25.058 3061 176.5 Warren
lmg32711.003 IKMT 17 16 4 11 23 0220 e 11 23 0520 63 57.526 67 26.758 3061 176.5 Warren
lmg32711.004 IKMT 18 16 4 11 23 0233 s 11 23 0533 63 57.773 67 27.328 3044 175 Warren
lmg32711.005 IKMT 18 16 4 11 23 0319 e 11 23 0619 63 58.552 67 29.194 3044 175 Warren
lmg32711.006 Towfish 5 16 4 11 23 0355 s 11 23 0655 63 59.0 67 31.1 3044 Warren
lmg32711.007 Towfish 5 16 4 11 23 0558 e 11 23 0858 64 01.1 67 42.9 3044 Warren
lmg32711.008 CTD 18 17 24 11 23 0936 s 11 23 1236 64 20.937 68 50.104 3131 1000.8 Warren
lmg32711.009 CTD 18 17 24 11 23 1049 e 11 23 1349 64 21.059 68 49.963 3131 1000.8 Warren
lmg32711.010 MOC1 19 17 24 11 23 1105 s 11 23 1405 64 21.287 68 50.787 3161 Wiebe
lmg32711.011 MOC1 19 17 24 11 23 1722 e 11 23 2022 64 27.408 69 17.433 3161 Wiebe
lmg32711.012 IKMT 19 17 24 11 23 1815 s 11 23 2115 64 28.358 69 20.978 3071 175.3 Warren
lmg32711.013 IKMT 19 17 24 11 23 1857 e 11 23 2157 64 28.862 69 22.603 3071 175.3 Warren
lmg32711.014 Towfish 6 17 24 11 23 1907 s 11 23 2207 64 29.092 69 22.412 3057 Warren
lmg32811.001 Towfish 6 17 24 11 23 2119 e 11 24 0019 64 31.8 69 12.5 3057 Warren
lmg32811.002 IKMT 20 18 27 11 24 0113 s 11 24 0413 64 52.991 67 43.747 350 175 Warren
lmg32811.003 IKMT 20 18 27 11 24 0148 e 11 24 0458 64 53.125 67 46.140 350 175 Warren
lmg32811.004 IKMT 21 18 27 11 24 0208 s 11 24 0508 64 53.169 67 46.675 350 101.2 Warren
lmg32811.005 IKMT 21 18 27 11 24 0252 e 11 24 0552 64 52.913 67 48.822 350 101.2 Warren

LMG11-10 Cruise Report – December 6, 2011 Page 64
Local Time
Univ. Coor. Time (UCT)
Cast Scientific
eventno
Instr
cast#
Consec. Station#
Standard Station #
Mth Day hhmm
Event s/e Mth Day hhmm
Latitude (°S) Deg. Min.
Longitude (°W) Deg. Min.
Water Depth Depth Invest. Comments
lmg32811.006 IKMT 22 19 23 11 24 0441 s 11 24 0741 64 58.781 67 24.462 373 175.6 Warren
lmg32811.007 IKMT 22 19 23 11 24 0525 e 11 24 0825 64 58.100 67 26.548 373 175.6 Warren
lmg32811.008 CTD 19 19 23 11 24 0603 s 11 24 0903 64 59.113 67 23.625 370 357 Warren
lmg32811.009 CTD 19 19 23 11 24 0640 e 11 24 0940 64 59.178 67 23.671 370 357 Warren
lmg32811.010 MOC1 20 19 23 11 24 0656 s 11 24 0956 64 58.853 67 23.047 373 320 Wiebe
lmg32811.011 MOC1 20 19 23 11 24 0819 e 11 24 1119 64 56.563 67 19.142 373 320 Wiebe
lmg32811.012 CTD 20 20 3 11 24 1326 s 11 24 1626 64 35.464 65 20.889 606 582 Warren
lmg32811.013 CTD 20 20 3 11 24 1412 e 11 24 1712 62 35.496 65 20.861 606 582 Warren
lmg32811.014 MOC1 21 20 3 11 24 1433 s 11 24 1733 64 35.184 65 20.120 613 570 Wiebe
lmg32811.015 MOC1 21 20 3 11 24 1639 e 11 24 1939 64 32.516 65 12.811 613 570 Wiebe
lmg32811.016 IKMT 23 20 3 11 24 1724 s 11 24 2024 64 31.848 65 09.702 535 52 Warren
lmg32811.017 IKMT 23 20 3 11 24 1751 e 11 24 2051 64 31.552 65 08.617 535 52 Warren
lmg32811.018 IKMT 24 20 3 11 24 1758 s 11 24 2058 64 31.475 65 08.340 557 50.9 Warren
lmg32811.019 IKMT 24 20 3 11 24 1824 e 11 24 2124 64 31.190 65 07.292 557 50.9 Warren
lmg32811.020 Towfish 7 20 3 11 24 1856 s 11 24 2156 64 31.2 65 06.9 557
lmg32811.021 Towfish 7 20 3 11 24 2044 e 11 24 2344 64 39.7 64 59.9 557
lmg32911.001 IKMT 25 21 29 11 25 0109 s 11 25 0409 64 52.549 64 12.827 728 100 Warren
lmg32911.002 IKMT 25 21 29 11 25 0146 e 11 25 0446 64 52.101 64 10.971 728 100 Warren
lmg32911.003 IKMT 26 21 29 11 25 0154 s 11 25 0454 64 51.962 64 10.567 535 175.1 Warren
lmg32911.004 IKMT 26 21 29 11 25 0240 e 11 25 0540 64 51.112 64 08.709 535 175.1 Warren
lmg32911.005 CTD 21 22 26 11 25 749 s 11 25 1049 65 04.907 63 08.067 267 256.8 Warren
lmg32911.006 CTD 21 22 26 11 25 0816 e 11 25 1116 65 04.901 63 08.081 267 256.8 Warren
lmg32911.007 zodiac acous 3 22 26 11 25 0846 s 11 25 1146 65 04.903 63 08.080 277 Warren
lmg32911.008 zodiac 2 1 22 26 11 25 0859 s 11 25 1159 65 04.903 63 08.080 277 Wiebe
lmg32911.009 0.2um net 1 22 26 11 25 0930 s 11 25 1230 65 04.903 63 08.080 277 0.5 Batta-Lona
oblique tow to collect ciliates
lmg32911.010 0.2um net 1 22 26 11 25 0932 e 11 25 1230 65 04.903 63 08.080 277 0.5
lmg32911.011 0.2um net 2 22 26 11 25 0935 s 11 25 1235 65 04.903 63 08.080 277 8 Batta-Lona
vertical tow to collect ciliates
lmg32911.012 0.2um net 2 22 26 11 25 0940 e 11 25 1240 65 04.903 63 08.080 277 8
lmg32911.013 0.2um net 3 22 26 11 25 0944 s 11 25 1244 65 04.903 63 08.080 277 8 Batta-Lona
vertical tow to collect ciliates
lmg32911.014 0.2um net 3 22 26 11 25 0947 e 11 25 1247 65 04.903 63 08.080 277 8

LMG11-10 Cruise Report – December 6, 2011 Page 65
Local Time
Univ. Coor. Time (UCT)
Cast Scientific
eventno
Instr
cast#
Consec. Station#
Standard Station #
Mth Day hhmm
Event s/e Mth Day hhmm
Latitude (°S) Deg. Min.
Longitude (°W) Deg. Min.
Water Depth Depth Invest. Comments
lmg32911.015 plankton net (500um) 1 22 26 11 25 1005 s 11 25 1305 65 04.903 63 08.080 277 2
Batta-Lona
dropped net vertically then started boat to do an oblique tow
lmg32911.016 plankton net (500um) 1 22 26 11 25 1010 e 11 25 1310 65 04.903 63 08.080 277 2
lmg32911.017 plankton net (500um) 2 22 26 11 25 1034 s 11 25 1334 65 04.903 63 08.080 277 2
Batta-Lona
dropped net vertically then started boat to do an oblique tow
lmg32911.018 plankton net (500um) 2 22 26 11 25 1041 e 11 25 1341 65 04.903 63 08.080 277 2
lmg32911.019 plankton net (500um) 3 22 26 11 25 1052 s 11 25 1352 65 04.903 63 08.080 277 2
Batta-Lona
dropped net vertically then started boat to do an oblique tow
lmg32911.020 plankton net (500um) 3 22 26 11 25 1057 e 11 25 1357 65 04.903 63 08.080 277 2
lmg32911.021 plankton net (500um) 4 22 26 11 25 1109 s 11 25 1409 65 04.903 63 08.080 277 0.5
Batta-Lona surface vertical tow
lmg32911.022 plankton net (500um) 4 22 26 11 25 1110 e 11 25 1410 65 04.903 63 08.080 277 0.5
lmg32911.023 0.2um net 4 22 26 11 25 1135 s 11 25 1435 65 04.903 63 08.080 277 8 Batta-Lona
vertical tow to collect ciliates
lmg32911.024 0.2um net 4 22 26 11 25 1139 e 11 25 1439 65 04.903 63 08.080 277 8
lmg32911.025 zodiac 2 1 22 26 11 25 1234 e 11 25 1534 65 04.903 63 08.080 277 Wiebe
lmg32911.026 zodiac 2 2 22 26 11 25 1249 s 11 25 1549 65 04.903 63 08.080 277 Wiebe
lmg32911.027 zodiac acous 3 22 26 11 25 1252 e 11 25 1552 65 04.903 63 08.080 277 Warren
lmg32911.028 zodiac acous 4 22 26 11 25 1258 s 11 25 1558 65 04.903 63 08.080 277 Warren
lmg32911.029 0.2um net 5 22 26 11 25 1411 s 11 25 1711 64 58.934 63 25.925 277 8 Batta-Lona
vertical tow to collect ciliates
lmg32911.030 0.2um net 5 22 26 11 25 1414 e 11 25 1714 64 58.934 63 25.925 277 8
lmg32911.031 plankton net (500um) 5 22 26 11 25 1425 s 11 25 1725 64 58.934 63 25.925 277 8
Batta-Lona plankton vertical tow
lmg32911.032 plankton net (500um) 5 22 26 11 25 1428 e 11 25 1728 64 58.934 63 25.925 277 8
lmg32911.033 plankton net (500um) 6 22 26 11 25 1441 s 11 25 1741 64 58.934 63 25.925 277 2
Batta-Lona
dropped net vertically then started boat to do an oblique tow
lmg32911.034 plankton net (500um) 6 22 26 11 25 1452 e 11 25 1752 64 58.934 63 25.925 277 2
lmg32911.035 plankton net (500um) 7 22 26 11 25 1528 s 11 25 1828 64 58.934 63 25.925 277 2
Batta-Lona
dropped net vertically then started boat to do an oblique tow
lmg32911.036 plankton net 7 22 26 11 25 1536 e 11 25 1836 64 58.934 63 25.925 277 2

LMG11-10 Cruise Report – December 6, 2011 Page 66
Local Time
Univ. Coor. Time (UCT)
Cast Scientific
eventno
Instr
cast#
Consec. Station#
Standard Station #
Mth Day hhmm
Event s/e Mth Day hhmm
Latitude (°S) Deg. Min.
Longitude (°W) Deg. Min.
Water Depth Depth Invest. Comments
(500um)
lmg32911.037 bucket samples 1 22 26 11 25 1541 s/e 11 25 1841 64 58.934 63 25.925 277
lmg32911.038 plankton net (500um) 8 22 26 11 25 1542 s 11 25 1842 64 58.934 63 25.925 277 0.5
Batta-Lona surface vertical tow
lmg32911.039 plankton net (500um) 8 22 26 11 25 1546 e 11 25 1846 64 58.934 63 25.925 277 0.5
lmg32911.040 zodiac 2 2 22 26 11 25 1649 e 11 25 1649 64 58.934 63 25.925 277 617 Wiebe
lmg32911.041 zodiac acous 4 22 26 11 25 1717 e 11 25 2017 64 58.813 63 26.637 277 617 Warren
lmg32911.042 CTD 22 23 28 11 25 1739 s 11 25 2039 64 58.915 53 26.579 560 547 Warren
lmg32911.043 CTD 22 23 28 11 25 1817 e 11 25 2117 64 58.930 63 26.538 560 547 Warren
lmg32911.044 MOC1 22 23 28 11 25 1652 s 11 25 2152 64 58.899 63 25.753 ~600 ~600 Wiebe Includes MOC calibration
lmg33011.001 MOC1 22 23 28 11 25 2157 e 11 26 0057 64 55.674 63 21.103 ~600 ~600 Wiebe
lmg33011.002 IKMT 27 23 28 11 25 2253 s 11 26 0153 64 56.805 63 22.654 456 75 Warren
lmg33011.003 IKMT 27 23 28 11 25 2331 e 11 26 0231 64 56.006 63 21.679 456 75 Warren That's it. We are DONE!
lmg33011.004 Palmer station 11 26 0800 s 11 26 1100 64 46.31 64 3.48 Arrived for short unload/loading
lmg33111.001 Palmer station 11 27 1000 e 11 27 1300 64 46.31 64 3.48
lmg33211.001 Copacabana 11 28 0815 s 11 28 1115 62 10.309 58 25.566 326 Arrived for short unloading
lmg33211.002 Copacabana 11 28 1018 e 11 28 1318 62 10.309 58 25.566 Admiralty Bay, King George Island
lmg33311.001 Air_Sample 11 29 0837 s/e 11 28 1137 59 00.087 62 00.363 4053 Air sample event - Drake Passage
lmg33512.001 Punta Arenas 12 1 1030 e 12 1 1330 53 10.17 70 54.4 Arrive in PA - End of cruise

LMG11-10 Cruise Report – December 6, 2011 Page 67
Appendix II. Summary of MOCNESS Tow Data. Standard Station Tow
Month local
Day local
Time Start end (Yearday .time)
Lat. (N) start end
Long.(W) start end
Net: depth_open-depth_closed
Volume filtered
22 1 11 9 313.93 -64.0377 -61.6926 net 0: 0 – 821 3700 314.04 -63.9641 -61.6581 net 1: 822 – 600 1923CTD 2 net 2: 600 – 400 1840 net 3: 400 – 200 1285 net 4: 200 - 100 922 net 5: 100 – 75 316 net 6: 75 – 50 359 net 7: 50 – 25 235 net 8: 25 – 0 236
7 2 11 11 315.83 -62.0267 -60.8116 net 0: 0 – 1010 2448 315.96 -62.0007 -60.9975 net 1: 1010 – 800 1468CTD 3 net 2: 800- 600 1655 net 3: 600 - 400 1263 net 4: 400 – 200 1374 net 5: 200 - 100 1165 net 6: 100 - 50 554 net 7: 50 - 25 337 net 8: 25 - 0 360
8 3 11 11 315.25 -61.5584 -58.9352 net 0: 0 - 1000 3167 315.37 -61.4725 -59.0261 net 1: 1000 - 800 1974CTD 5 net 2: 800 – 600 1445 net 3: 600 - 400 1478 net 4: 400 - 200 1782 net 5: 200 - 100 879 net 6: 100 – 50 472 net 7: 50 - 25 430 net 8: 25 - 0 278
11 4* 11 13 317.40 -60.7269 -54.9419 net 0: 0 – 2500 1675* 317.61 -60.5842 -55.0075 net 1: 2500 – 2000 1804CTD 6 net 2: 2000 – 1500 1362 net 3: 1500 – 1000 1021 net 4: 1000 – 500 1319 net 5: 500 - 195 1240 net 6: 195 – 100 605 net 7: 100 – 37 311 net 8: 37 - 0 262

LMG11-10 Cruise Report – December 6, 2011 Page 68
Standard Station Tow
Month local
Day local
Time Start end (Yearday .time)
Lat. (N) start end
Long.(W) start end
Net: depth_open-depth_closed
Volume filtered
12 5 11 14 318.95 -60.8949 -53.7512 net 0: 0–740-600 1772
319.05 -60.8460 -53.8894 net 1: 600 - 400 1567CTD 7 net 2: 400 - 200 1543 net 3: 200 - 100 867 net 4: 100 – 75 417 net 5: 75 – 50 412 net 6: 50 – 25 392 net 7: 25 – 0 502 net 8: did not fish --
14 6 11 15 320.10 -61.7519 -55.1350 net 0: 0 – ~100 No
volume 320.11 -61.7422 -55.1342 Signal cable failed
14 7 11 16 320.21 -61.7442 -55.1395 net 0: 0 - ~100 No
volume 320.21 -61.7345 -55.1850 Signal Cable Failed
14 8 11 16 320.25 -61.7294 -55.2176 net 0: 0 – 1000 1178 320.38 -61.7416 -55.3814 net 1: 1000 – 800 1440CTD 9 net 2: 800 - 600 2248 net 3: 600 - 400 1825 net 4: 400 - 200 2222 net 5: 200 - 100 888 net 6: 100 - 50 607 net 7: 50 – 25 438 net 8: 25 - 0 631
15 9 11 16 320.76 -61.9753 -56.1651 net 0: 0 - ~200 No
volume 320.80 -62.0005 -56.1200 Signal Cable Failed
15 10 11 16 320.84 -62.0331 -56.0659 net 0: 0 - ~200 No
volume 320.88 -62.0583 -55.9917 Signal Cable Failed
15 11 11 16 320.93 -61.9903 -56.1457 net 0: 0 – 1000 1680
321.07 -62.0735 -55.9949 net 1: 1000 - 800 1779
CTD 10 net 2: 800 – 600 1193 net 3: 600 - 400 2455

LMG11-10 Cruise Report – December 6, 2011 Page 69
Standard Station Tow
Month local
Day local
Time Start end (Yearday .time)
Lat. (N) start end
Long.(W) start end
Net: depth_open-depth_closed
Volume filtered
net 4: 400 - 200 1863 net 5: 200 - 100 788 net 6: 100 - 50 521 net 7: 50 – 25 523 net 8: 25 - 0 543
16 12 11 17 321.50 -61.6517 -56.5606 net 0: 0 – 425 2326 321.58 -61.6583 -56.4339 net 1: 450 – 300 1510CTD 11 net 2: 300 – 200 896 net 3: 200 - 100 1018 net 4: 100 – 65 403 net 5: 65 - 50 407 net 6: 50 – 25 417 net 7: 25-0-25 543 net 8: 25 - 0 773
17 13 11 18 322.23 -62.3114 -57.6882 net 0: 0 – 1000 3802 322.37 -62.2550 -57.4806 net 1: 1000 - 800 2484CTD 12 net 2: 800 – 600 1565 net 3: 600 - 400 1520 net 4: 400 - 200 1625 net 5: 200 - 100 962 net 6: 100 - 50 411 net 7: 50 – 25 465 net 8: 25 - 0 588
19 14 11 19 323.83 -62.7077 -59.6427 net 0: 0 - 1000 2686 323.96 -62.7897 -59.4971 net 1: 1000 - 800 1287CTD 13 net 2: 800 - 600 1225 net 3: 600 - 400 2152 net 4: 405 - 200 1928 net 5: 200 - 100 1467 net 6: 100- 50 451 net 7: 50 - 25 421 net 8: 25 - 0 576
20 15 11 20 324.54 -63.3517 -61.6154 net 0: 0 – 985 1940 324.66 -63.3099 -61.4271 net 1: 985 – 785 1143CTD 14 net 2: 785 - 600 1345 net 3: 600 - 400 2048 net 4: 405 - 200 1565

LMG11-10 Cruise Report – December 6, 2011 Page 70
Standard Station Tow
Month local
Day local
Time Start end (Yearday .time)
Lat. (N) start end
Long.(W) start end
Net: depth_open-depth_closed
Volume filtered
net 5: 200 - 102 1060 net 6: 102 - 50 686 net 7: 50 - 25 580 net 8: 25 - 0 746
6 16 11 21 325.45 -62.7463 -62.7463 net 0: 0 - 1000 2365 325.58 -62.7499 -63.0274 net 1: 1000 - 800 1638CTD 15 net 2: 800 – 600 1464 net 3: 600 - 400 2557 net 4: 400 – 200 1813 net 5: 200 – 100 1019 net 6: 100 - 50 754 net 7: 50 - 25 612 net 8: 25 - 0 688
5 17 11 21 325.98 -62.5252 -64.4534 net 0: 0 – 2500 5486 326.38 -62.7556 -64.9406 net 1: 2513- 2000 3011CTD 16 net 2: 2000 – 1485 2216 net 3: 1485 - 1000 5220 net 4: 1000 - 500 3935
net 5: 500-1359-300
16349
net 6: 300 – 200 1195 net 7: 200 – 100 1661 net 8: 100 - 0 1631
4 18 11 22 326.96 -63.8025 -67.1589 net 0: 0 – 1500 6894 327.17 -63.9362 -67.3974 net 1: 1500 – 1000 5680CTD 17 net 2: 1000 - 800 1637 net 3: 800 - 600 1758 net 4: 600 - 400 1890 net 5: 400 – 200 2298 net 6: 200 – 100 1349 net 7: 100 – 50 1031 net 8: 50 – 0 1324
24 19 11 23 327.59 -64.3864 -68.9766 net 0: 0 – 2500 4862 327.85 -64.4565 -69.2893 net 1: 2500 – 2000 3336CTD 18 net 2: 2000 - 1500 4294 net 3: 1500 - 1000 4329 net 4: 1000 - 500 3947

LMG11-10 Cruise Report – December 6, 2011 Page 71
Standard Station Tow
Month local
Day local
Time Start end (Yearday .time)
Lat. (N) start end
Long.(W) start end
Net: depth_open-depth_closed
Volume filtered
net 5: 500 – 300 2376 net 6: 200 – 100 997 net 7: 100 – 50 868 net 8: 50 – 0 1187
23 20 11 24 328.41 -64.9809 -67.3842 net 0: 0 – 320 1031 328.47 -64.9430 -67.3195 net 1: 320- 250 597 net 2: 250 - 200 570CTD 19 net 3: 200 - 150 724 net 4: 150 - 100 844 net 5: 100 - 75 465 net 6: 75 - 50 555 net 7: 50 - 25 528 net 8: 25 - 0 573
3 21 11 24 328.73 -64.5866 -65.3361 net 0: 0 – 570 1251 328.82 -64.5422 -65.2144 net 1: 570 - 400 1452CTD 20 net 2: 400 - 300 1029 net 3: 300 - 200 900 net 4: 200 - 100 1197 net 5: 100 – 75 590 net 6: 75 - 50 509 net 7: 50 - 25 510 net 8: 25 - 0 650
28 22 11 25 329.91 -64.9815 -63.4290 net 0: 0 – 471 1691 330.04 -64.9282 -63.3523 net 1: 467 – 400 1438CTD 22 net 2: 400 – 300 788 net 3: 300- 262 299 net 4: 262 – 100 1253 net 5: 100 - 75 553 net 6: 75 - 50 612 net 7: 50 - 25 458 net 8: 25 - 0 613* MOC#4 - Flowmeter failed; Volume estimated based on average net angle and GPS distance.
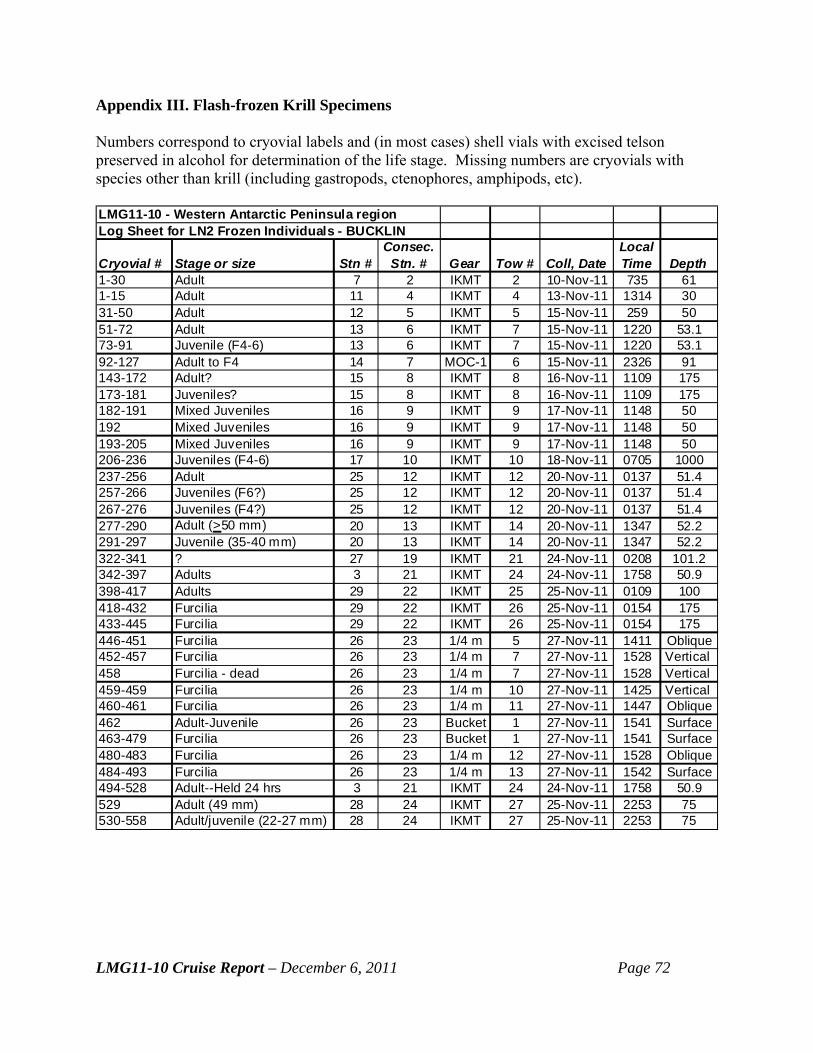
Appendix III. Flash-frozen Krill Specimens Numbers correspond to cryovial labels and (in most cases) shell vials with excised telson preserved in alcohol for determination of the life stage. Missing numbers are cryovials with species other than krill (including gastropods, ctenophores, amphipods, etc). LMG11-10 - Western Antarctic Peninsula regionLog Sheet for LN2 Frozen Individuals - BUCKLIN
Cryovial # Stage or size Stn #Consec.
Stn. # Gear Tow # Coll, DateLocal Time Depth
1-30 Adult 7 2 IKMT 2 10-Nov-11 735 611-15 Adult 11 4 IKMT 4 13-Nov-11 1314 3031-50 Adult 12 5 IKMT 5 15-Nov-11 259 5051-72 Adult 13 6 IKMT 7 15-Nov-11 1220 53.173-91 Juvenile (F4-6) 13 6 IKMT 7 15-Nov-11 1220 53.192-127 Adult to F4 14 7 MOC-1 6 15-Nov-11 2326 91143-172 Adult? 15 8 IKMT 8 16-Nov-11 1109 175173-181 Juveniles? 15 8 IKMT 8 16-Nov-11 1109 175182-191 Mixed Juveniles 16 9 IKMT 9 17-Nov-11 1148 50192 Mixed Juveniles 16 9 IKMT 9 17-Nov-11 1148 50193-205 Mixed Juveniles 16 9 IKMT 9 17-Nov-11 1148 50206-236 Juveniles (F4-6) 17 10 IKMT 10 18-Nov-11 0705 1000237-256 Adult 25 12 IKMT 12 20-Nov-11 0137 51.4257-266 Juveniles (F6?) 25 12 IKMT 12 20-Nov-11 0137 51.4267-276 Juveniles (F4?) 25 12 IKMT 12 20-Nov-11 0137 51.4277-290 Adult (>50 mm) 20 13 IKMT 14 20-Nov-11 1347 52.2291-297 Juvenile (35-40 mm) 20 13 IKMT 14 20-Nov-11 1347 52.2322-341 ? 27 19 IKMT 21 24-Nov-11 0208 101.2342-397 Adults 3 21 IKMT 24 24-Nov-11 1758 50.9398-417 Adults 29 22 IKMT 25 25-Nov-11 0109 100418-432 Furcilia 29 22 IKMT 26 25-Nov-11 0154 175433-445 Furcilia 29 22 IKMT 26 25-Nov-11 0154 175446-451 Furcilia 26 23 1/4 m 5 27-Nov-11 1411 Oblique452-457 Furcilia 26 23 1/4 m 7 27-Nov-11 1528 Vertical 458 Furcilia - dead 26 23 1/4 m 7 27-Nov-11 1528 Vertical 459-459 Furcilia 26 23 1/4 m 10 27-Nov-11 1425 Vertical 460-461 Furcilia 26 23 1/4 m 11 27-Nov-11 1447 Oblique462 Adult-Juvenile 26 23 Bucket 1 27-Nov-11 1541 Surface463-479 Furcilia 26 23 Bucket 1 27-Nov-11 1541 Surface480-483 Furcilia 26 23 1/4 m 12 27-Nov-11 1528 Oblique484-493 Furcilia 26 23 1/4 m 13 27-Nov-11 1542 Surface494-528 Adult--Held 24 hrs 3 21 IKMT 24 24-Nov-11 1758 50.9529 Adult (49 mm) 28 24 IKMT 27 25-Nov-11 2253 75530-558 Adult/juvenile (22-27 mm) 28 24 IKMT 27 25-Nov-11 2253 75
LMG11-10 Cruise Report – December 6, 2011 Page 72

LMG11-10 Cruise Report – December 6, 2011 Page 73
Appendix IV. CTD Cast Summary.
Consec. Standard Local Time Event
Univ. Coor. Time (UCT)
Latitude (°S)
Longitude (°W) Water Cast Scientific
eventno Instr cast# Station# Station # Mth Day hhmm s/e Mth Day hhmm Deg. Min. Deg. Min. Depth Depth Invest. lmg31311.002 CTD 1&2* 1 22 11 9 1519 s 11 9 1819 64 02.30 61 41.56 1032.3 1027 Warren
lmg31311.003 CTD 1&2 1 22 11 9 1628 e 11 9 1928 64 02.28 61 41.52 1032.3 1027 Warren
lmg31511.001 CTD 3 2 7 11 10 2311 s 11 11 0211 62 01.688 60 48.157 1390 1000 Warren
lmg31511.002 CTD 3 2 7 11 11 0027 e 11 11 0327 62 01.731 60 48.022 1390 1000 Warren
lmg31511.007 CTD 4&5* 3 8 11 11 1442 s 11 11 1742 61 33.848 58 55.898 1701 1000 Warren
lmg31511.008 CTD 4&5 3 8 11 11 1609 e 11 11 1909 61 33.837 58 55.754 1701 1000 Warren
lmg31711.001 CTD 6 4 11 11 13 0719 s 11 13 1019 60 44.105 54 56.021 3245 1000 Warren
lmg31711.002 CTD 6 4 11 11 13 0838 e 11 13 1138 60 44.119 54 56.067 3245 1000 Warren
lmg31911.002 CTD 7 5 12 11 14 2242 s 11 15 0142 60 50.251 53 53.803 870 839 Warren
lmg31911.003 CTD 7 5 12 11 14 2353 e 11 15 253 60 50.268 53 53.917 870 839 Warren
lmg31911.006 CTD 8 6 13 11 15 0520 s 11 15 0820 61 23.213 53 33.877 752 729.7 Warren
lmg31911.007 CTD 8 6 13 11 15 0614 e 11 15 0914 61 23.214 53 33.812 752 729.7 Warren
lmg32011.001 CTD 9 7 14 11 15 2124 s 11 16 0024 61 44.819 55 08.170 2124 1000.7 Warren
lmg32011.002 CTD 9 7 14 11 15 2233 e 11 16 0133 61 44.976 55 08.061 2124 1000.7 Warren
lmg32011.009 CTD 10 8 15 11 16 1033 s 11 16 1333 61 54.970 56 15.872 1911 1000 Warren
lmg32011.010 CTD 10 8 15 11 16 1201 e 11 16 1501 61 55.034 56 15.471 1911 1000 Warren
lmg32111.004 CTD 11 9 16 11 17 0440 s 11 17 0740 61 39.082 56 34.787 566 530.6 Warren
lmg32111.005 CTD 11 9 16 11 17 0531 e 11 17 0831 61 39.108 56 34.972 566 530.6 Warren
lmg32211.001 CTD 12 10 17 11 18 0045 s 11 18 0345 62 18.922 57 41.921 1997 999.5 Warren
lmg32211.002 CTD 12 10 17 11 18 0155 e 11 18 0455 62 18.910 57 41.773 1997 999.5 Warren
lmg32311.001 CTD 13 11 19 11 19 1442 s 11 19 1742 62 46.106 59 24.265 1485 1000 Warren
lmg32311.002 CTD 13 11 19 11 19 1614 e 11 19 1914 62 46.106 59 34.265 1485 1000 Warren
lmg32411.008 CTD 14 13 20 11 20 0806 s 11 20 1106 63 19.172 63 19.166 1224 1000 Warren
lmg32411.009 CTD 14 13 20 11 20 0917 e 11 20 1217 61 29.217 61 29.574 1224 1000 Warren
lmg32511.001 CTD 15 14 6 11 21 0556 s 11 21 0856 62 44.756 63 17.490 2193 1000 Warren
lmg32511.002 CTD 15 14 6 11 21 0724 e 11 21 1024 62 44.773 63 17.429 2193 1000 Warren
lmg32511.009 CTD 16 15 5 11 21 1900 s 11 21 2200 62 31.544 64 27.559 2433 1001.5 Warren
lmg32511.010 CTD 16 15 5 11 21 2012 e 11 21 2312 62 31.364 64 25.785 2433 1001.5 Warren
lmg32611.005 CTD 17 16 4 11 22 1615 s 11 22 1915 63 51.009 67 09.058 3143 1000 Warren
lmg32611.006 CTD 17 16 4 11 22 1730 e 11 22 2030 63 50.689 67 08.164 3143 1000 Warren

LMG11-10 Cruise Report – December 6, 2011 Page 74
Consec. Standard Local Time Event
Univ. Coor. Time (UCT)
Latitude (°S)
Longitude (°W) Water Cast Scientific
eventno Instr cast# Station# Station # Mth Day hhmm s/e Mth Day hhmm Deg. Min. Deg. Min. Depth Depth Invest. lmg32711.008 CTD 18 17 24 11 23 0936 s 11 23 1236 64 20.937 68 50.104 3131 1000.8 Warren
lmg32711.009 CTD 18 17 24 11 23 1049 e 11 23 1349 64 21.059 68 49.963 3131 1000.8 Warren
lmg32811.008 CTD 19 19 23 11 24 0603 s 11 24 0903 64 59.113 67 23.625 370 357 Warren
lmg32811.009 CTD 19 19 23 11 24 0640 e 11 24 0940 64 59.178 67 23.671 370 357 Warren
lmg32811.012 CTD 20 20 3 11 24 1326 s 11 24 1626 64 35.464 65 20.889 606 582 Warren
lmg32811.013 CTD 20 20 3 11 24 1412 e 11 24 1712 62 35.496 65 20.861 606 582 Warren
lmg32911.015 CTD 22 23 28 11 25 1739 s 11 25 2039 64 58.915 53 26.579 560 547 Warren
lmg32911.016 CTD 22 23 28 11 25 1817 e 11 25 2117 64 58.930 63 26.538 560 547 Warren * Note that casts 1 and 4 were aborted; no data were collected. The CTD was left in the water to change the setup and start logging data.