Embed Size (px)
Citation preview

1
Please note that this is an author-produced PDF of an article accepted for publication following peer review. The definitive publisher-authenticated version is available on the publisher Web site.
Journal of Asian Earth Sciences May 2016, Volume 121, Pages 139-152 http://dx.doi.org/10.1016/j.jseaes.2016.03.003 http://archimer.ifremer.fr/doc/00317/42858/ © 2016 Elsevier Ltd. All rights reserved.
Achimer http://archimer.ifremer.fr
Crustal structure across the post-spreading magmatic ridge of the East Sub-basin in the South China Sea: Tectonic
significance
He Enyuan 1, 3
, Zhao Minghui 1, *
, Qiu Xuelin 1, Sibuet Jean-Claude
2, Wang Jian
1, 3, Zhang Jiazheng
1
1 Key Laboratory of Marginal Sea Geology, South China Sea Institute of Oceanology, Chinese Academy
of Sciences, Guangzhou 510301, China 2 Ifremer Centre de Brest, 29280 Plouzané, France and 44 rue du Cloitre, 29280 Plouzané, France
3 University of Chinese Academy of Sciences, Beijing 100049, China
* Corresponding author : Minghui Zhao, email address : [email protected]
Abstract : The 140-km wide last phase of opening of the South China Sea (SCS) corresponds to a N145° direction of spreading with rift features identified on swath bathymetric data trending N055° (Sibuet et al., 2016). These N055° seafloor spreading features of the East Sub-basin are cut across by a post-spreading volcanic ridge oriented approximately E-W in its western part (Zhenbei-Huangyan seamounts chain). The knowledge of the deep crustal structure beneath this volcanic ridge is essential to elucidate not only the formation and tectonic evolution of the SCS, but also the mechanism of emplacement of the post-spreading magmatism. We use air-gun shots recorded by ocean bottom seismometers to image the deep crustal structure along the N-S oriented G8G0 seismic profile, which is perpendicular to the Zhenbei-Huangyan seamounts chain but located in between the Zhenbei and Huangyan seamounts, where topographic changes are minimum. The velocity structure presents obvious lateral variations. The crust north and south of the Zhenbei-Huangyan seamounts chain is ca. 4-6 km in thickness and velocities are largely comparable with those of normal oceanic crust of Atlantic type. To the south, the Jixiang seamount with a 7.2-km thick crust, seems to be a tiny post-spreading volcanic seamount intruded along the former extinct spreading ridge axis. In the central part, a 1.5-km thick low velocity zone (3.3-3.7 km/s) in the uppermost crust is explained by the presence of extrusive rocks intercalated with thin sedimentary layers as those drilled at IODP Site U1431. Both the Jixiang seamount and the Zhenbei-Huangyan seamounts chain started to form by the intrusion of decompressive melt resulting from the N-S post-spreading phase of extension and intruded through the already formed oceanic crust. The Jixiang seamount probably formed before the emplacement of the E-W post-spreading seamounts chain.
2
Please note that this is an author-produced PDF of an article accepted for publication following peer review. The definitive publisher-authenticated version is available on the publisher Web site.
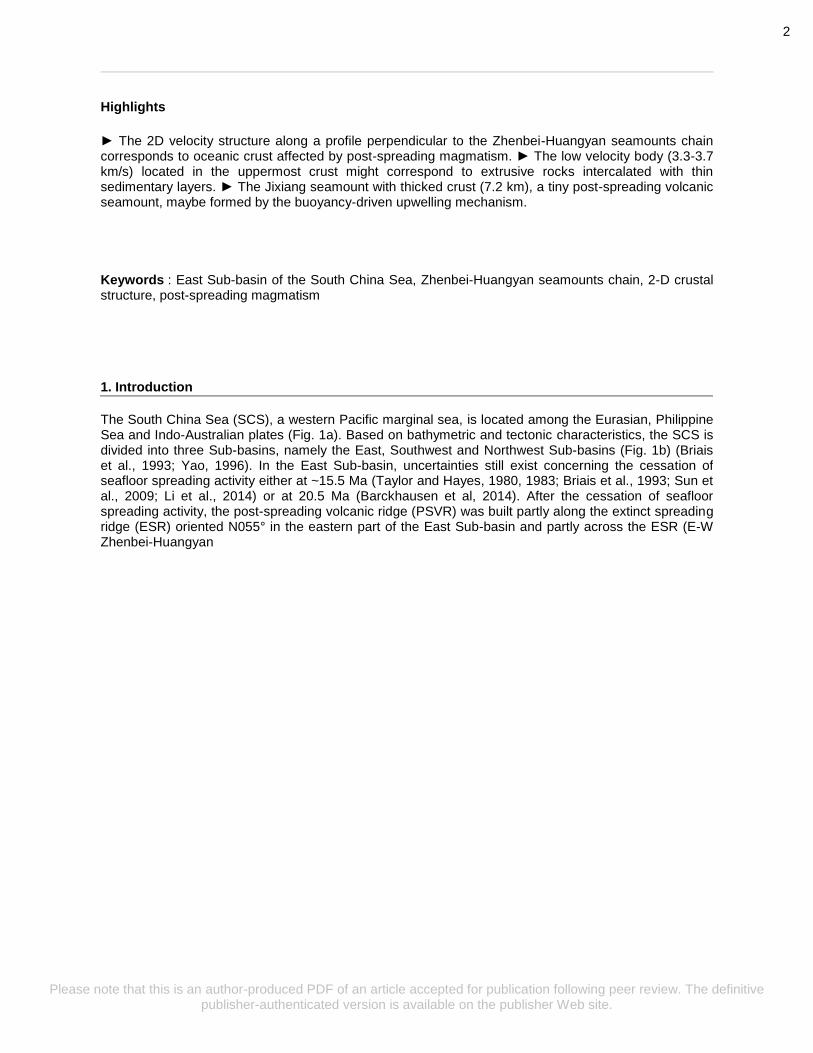
Highlights
► The 2D velocity structure along a profile perpendicular to the Zhenbei-Huangyan seamounts chain corresponds to oceanic crust affected by post-spreading magmatism. ► The low velocity body (3.3-3.7 km/s) located in the uppermost crust might correspond to extrusive rocks intercalated with thin sedimentary layers. ► The Jixiang seamount with thicked crust (7.2 km), a tiny post-spreading volcanic seamount, maybe formed by the buoyancy-driven upwelling mechanism.
Keywords : East Sub-basin of the South China Sea, Zhenbei-Huangyan seamounts chain, 2-D crustal structure, post-spreading magmatism 1. Introduction
The South China Sea (SCS), a western Pacific marginal sea, is located among the Eurasian, Philippine Sea and Indo-Australian plates (Fig. 1a). Based on bathymetric and tectonic characteristics, the SCS is divided into three Sub-basins, namely the East, Southwest and Northwest Sub-basins (Fig. 1b) (Briais et al., 1993; Yao, 1996). In the East Sub-basin, uncertainties still exist concerning the cessation of seafloor spreading activity either at ~15.5 Ma (Taylor and Hayes, 1980, 1983; Briais et al., 1993; Sun et al., 2009; Li et al., 2014) or at 20.5 Ma (Barckhausen et al, 2014). After the cessation of seafloor spreading activity, the post-spreading volcanic ridge (PSVR) was built partly along the extinct spreading ridge (ESR) oriented N055° in the eastern part of the East Sub-basin and partly across the ESR (E-W Zhenbei-Huangyan

4
seamounts chain) in the western part of the East Sub-basin (Wang et al., 1984; Tu et al., 1992;
Briais et al., 1993; Wang et al., 2009; Sibuet et al., 2016). Compared with the Hawaiian-Emperor
seamounts chain produced by mantle plume activities (Morgan, 1972), the Zhenbei-Huangyan
seamounts chain does not show obviously along-trend variation with age. Therefore, these
seamounts chains are likely to have different mechanisms of formation, particularly in terms of
their magma sources. Where do the magma source derived from to build the seamounts in the SCS
and how do the magmatic activities affect the pre-existing oceanic crust?
Due to the geographic remoteness and large bathymetric depth of the East Sub-basin, the
origin of the PSVR is largely unknown. A three-dimensional (3D) ocean bottom seismometer
(OBS) seismic survey was carried out along a small E-W portion of the PVSR, in the area of the
Zhenbei and Huangyan seamounts in May 2011 (Zhang et al., 2013). The 3D seismic structure is
already published (Wang et al., 2016). In this paper, we focus on the N-S G8G0 profile, which is
almost perpendicular to the PVSR and located between the two Zhenbei and Huangyan seamounts,
where the topography is reduced. The obtained velocity and density structures will be used to
unravel the mechanism of the post-spreading magmatic emplacement.
2. Tectonic setting
The SCS marginal sea is located at the confluence of three major plates (Eurasian, Philippine
Sea and Indian-Australian plates) (Fig. 1a). The East Sub-basin, the largest basin among the three
SCS Sub-basins, is the major constituent of the SCS. The abyssal plain in the East Sub-basin lies
in between 4300 and 4500 m deep. East of the Zhongnan faults zone, which separates the East and
Southwest Sub-basins, the Zhenbei-Huangyan seamounts chain is trending E-W over a distance of
240 km and consists of five major seamounts, which stand nearly 4000 m above the seafloor (Yao,
1996) (Figs. 1b and 2). Its width is ~40 km. Further east, this chain changes direction to NE-SW
over 100 km and disappears near the Manila trench.
Based on the original magnetic anomalies interpretation (Taylor and Hayes, 1980; Briais et
al., 1993; Li et al., 2011), Li et al. (2014) re-identified and relocated the magnetic anomalies by
using recent deep-tow magnetic surveys and IODP Expedition 349 results. They pointed out that
the SCS seafloor spreading formed from Oligocene to Early Miocene (33-15 Ma) (chrons

5
C12-C5B) and the history of seafloor spreading was divided into two stages (Fig. 1b) (Li et al.,
2014). The first stage (33-26 Ma) corresponds to chrons C12 to C8 and is associated with a
NNW-SSE seafloor spreading direction with ~E-W and ENE-WSW trending magnetic lineations
developed in the East and Northwest Sub-basins. The second stage (26-15 Ma) corresponds to
chrons C8 to C5B and continues along a NNW-SSE seafloor spreading direction until chron C6Cr
(~23.6 Ma), where the ridge jumped ~20 km southward and then rapidly propagated to the
southwest. Subsequently, the Southwest Sub-basin opened and the ridge orientation of the East
Sub-basin varies from ENE-WSW to NE-SW. The terminal age of seafloor spreading is about 15
Ma in the East Sub-basin and 16 Ma in the Southwest Sub-basin, corresponding to anomalies C5B
for Li et al. (2014) and post-C5c for Briais et al. (1993), respectively.
However, Barckhausen et al. (2014), using a series of magnetic profiles where careful
magnetic corrections were applied, modeled magnetic lineations by maintaining spreading rates
constant over long periods of time and found that seafloor spreading ended at the same time
(chron C6a1, 20.5 Ma) in the East and Southwest Sub-basins. The main divergent point between
the three modelings is the age of the youngest identified magnetic lineations (younger than C5c
(Briais et al., 1993), C5B (Li et al., 2014) and C6a1 (Barckhausen et al., 2014)). One of the
reasons of this large discrepancy is the presence of a strong post-spreading volcanism (ca. 8-13
Ma) (Expedition 349 Scientists, 2014), which hides the previous spreading fabric in particular in
the region of the extinct spreading axis and thus complicates the identification of magnetic
lineations.
In the past, two sets of basement faults were recognized in the East Sub-basin, including
NE-SW and a NW-SE trending sets (Pautot et al., 1986, 1990; Briais et al., 1993; Li et al., 2002,
2011). The NE-SW features, acting as magma conduits, were considered as due to a significant
and long-lasting control on the orientation of the post-spreading seamounts chain, mostly west of
the Manila trench (Pautot et al., 1986, 1990; Li et al., 2011). The NE-SW trending features,
symmetrically distributed on both sides of the ESR, are almost parallel to the direction of
magnetic anomalies, and were considered as seafloor spreading features with a significant
control on the regional tectonics (Pautot et al., 1986, 1990; Li et al., 2002, 2011). However,
NW-SE trending features, with a dominant strike oriented N137° (Li et al., 2002), were
considered as transform faults not re-used during the post-spreading magmatic activity.

6
After the cessation of seafloor spreading, magmatic activities continued and the East
Sub-basin axial area was overprinted by the Zhenbei and Huangyan seamounts, which are dated
7.7 and 9.9 Ma from dredged volcanic samples (Wang et al., 1984; Wang et al., 2009). The
volcano-clastic breccias and sandstone at IODP Site U1431 are dated at 13-8 Ma, indicating that
extensive seamount volcanic activity restarted ~2 Myr or ~7.5 Myr after the cessation of seafloor
spreading (Expedition 349 Scientists, 2014, Barckhausen et al., 2014 respectively) and lasted for
at least 5 Myr.
Fig. 1 shows the location of the ESR slightly modified from Sibuet et al. (2016), who
delimited oceanic domains based on swath bathymetric data and magnetic lineations. East of
118°15’E, the PSVR follows the N055° trends of the last phase of opening of the East Sub-basin
bounded by the two red dashed lines in Fig. 1. West of 118°15’E, the PSVR departs from the
N055° trending direction and is approximately E-W oriented, though minor post-spreading
volcanoes might be N055° trending (e. g. Jixiang seamount and the unnamed seamount east of it
in Fig. 2). A possible interpretation is that the ~N-S post-spreading extension resulting in the
emplacement of the western part of the PSVR (Sibuet et al., 2016) first followed the previously
formed N055° seafloor spreading lineations and then shifted to an E-W trend perpendicular to the
extensional direction of the post-spreading phase of extension, cutting obliquely the already
formed N055° seafloor spreading features. This means that the E-W portion of the PSVR is not the
location of the ESR as assumed by Briais et al. (1993), Barckhausen et al. (2014) and Li et al.
(2014).
3. Seismic data acquisition and processing
In May 2011, the R/V Shiyan 2 (South China Sea Institute of Oceanology, Zhang et al., 2013)
ran a deep seismic survey in the East Sub-basin. Nine broad band (0.01-50 Hz) OBSs built in
China (Hao and You, 2011) were deployed along a 110-km-long N-S profile (G8G0), located in
between the Zhenbei and Huangyan seamounts and cutting across the ESR of East Sub-basin in
the southern part of the profile (Fig. 2). The sampling rate was set up at 125 Hz during the survey.
The seismic source consisted of a four-air-gun array with a total volume of 6000 in3 towed at a
10-m depth below sea level. The shooting interval was 120 s and the nominal speed of the ship

7
was 5 knots. 448 shots were fired along the G8G0 profile from south to north (Fig. 2). Even if it is
of low quality, a single channel reflection seismic profile was simultaneously acquired. Detailed
shooting and deploying parameters appear in Zhang et al. (2013).
The processing of OBS data takes into account the OBS time drift and includes the correction
of shot and OBS positions. Firstly, we adjusted the shot positions using the Global Positioning
System (GPS) of the ship moved to the center of the air-gun array (Ao et al., 2010). Secondly, the
OBSs clocks offset were checked before and after deployments, and a linear drift was assumed
during the launching period. The recorded OBS data were then converted into the standard format
of the Society of Exploration Geophysicist (SEGY) and stored in common receiver gathers.
Thirdly, the OBS instruments were relocated on the seafloor by inverting the direct water-wave
travel times (Monte Carlo and least square methods (Ao et al., 2010; Zhang et al., 2011). Globally,
OBS data are of good quality with seismic signals recorded down to the Moho interface. Seismic
record sections were plotted for each OBS with a reduced velocity of 6.0 km/s and with a 3-12 Hz
band-pass filter (Figs. 3a to 6a and Figs. A.1b to 5b).
4. Seismic velocity structure
4.1. Characteristics of seismic phases
Most of the OBS data acquired along the profile G8G0 are of high quality, with numerous
seismic phases traced at large offsets (Figs. 3b to 6b and Figs. A.1b to 5b). Seismic phases Pw,
Pg1, Pg2, PmP and Pn are identified according to their kinematic and dynamic characteristics. The
direct water-wave phase Pw (red) is used to relocate the OBSs positions (Zhang et al., 2013).
Seismic phases Pg1 (green) and Pg2 (blue) are refracted from oceanic layers 2 and 3, respectively.
They can be traced continuously within offset ranges from 5 to 30 km. The hyperbolic PmP phases
(yellow), reflected from the crust-mantle interface, are usually recorded at short offsets due to the
possible scattering caused by the rough seafloor relief or to crustal velocity gradients. Pn phases
(pink) refracted from the upper mantle are clear and usually displayed at long offsets. Four OBS
records are taken as examples and analyzed in detail.
OBS02 is located in the northern part of the profile at a depth of 4280 m (Fig. 2). On the
seismic record section (Fig. 3a), Pg phases (green and blue) are clearly seen within the -30 to 20
8
km offset. The PmP phase (yellow) appears within the -24 to -19 km offset and 15 to 20 km offset
on both sides of receiver OBS02, respectively. The short PmP offsets imply that the crust is thin.
Pn phases (pink) are observed at the offset of -88 to -34 km with an apparent velocity of 8.0 km/s.
The upward shape at the offset of -78 to -68 km is due to the presence of the Jixiang seamount
(Fig. 3).
OBS05 and OBS06 are located at depths of 4070 and 4270 m, between the Zhenbei and
Huangyan seamounts (Fig. 2). A set of seismic phases Pg, PmP and Pn, is clearly visible on both
branches of OBS05 (Fig. 4a). The Pg phases (green and blue) appear within the -24 to 24 km
offset. The Pn phases (pink) can be followed continuously on both sides of OBS05 within the -24
to -56 km offset and the 24 to 50 km offset. The PmP phase (yellow), clearly followed beneath the
Pg arrivals with obviously hyperbolic curves, is crucial for determining the Moho interface below
the seamounts chain. PmP arrivals appear from -20 to -9 km offset on the left half branch and 17
to 25 km offset on the right half branch. The characters of seismic phases of OBS06 (Fig. 5a) are
similar to those of OBS05 (Fig. 4a). As on the OBS02 record, the Pn (pink) phases at the offset of
-45 to -36 km on OBS05 (Fig. 4) and at the offset of -34 to -25 km on OBS06 (Fig. 5) are also
affected by the presence of the Jixiang seamount (Fig. 3).
OBS09, at a water depth of 4280 m, is the southernmost OBS of Profile G8G0 (Fig. 2). The
Jixiang seamount is located near OBS09. The Pg1 phase (green) has upward shape in the range of
4 to 12 km offset (Fig. 6a), which could be due to lateral velocity heterogeneities linked to
volcanic activities. The most noticeable phase Pn (pink) can be traced continuously from 22 to 98
km offset. At offset of 75 to 98 km, the Pn phase (pink) appears with a ‘stair-step’ shape. This
pattern is also observed on other records, such as the 5 to 20 km offset for OBS02 (Fig. 3a), at 30
to 54 km offset for OBS05 (Fig. 4a), and at 15 to 30 km offset for OBS03 (Fig. A.3a). Considering
the flat seafloor relief given by the swath-bathymetric data (Fig. 2), these stepwise travel times
(Figs. 3a to 6a and Figs. A.3a) may have been caused by the basement change located at a distance
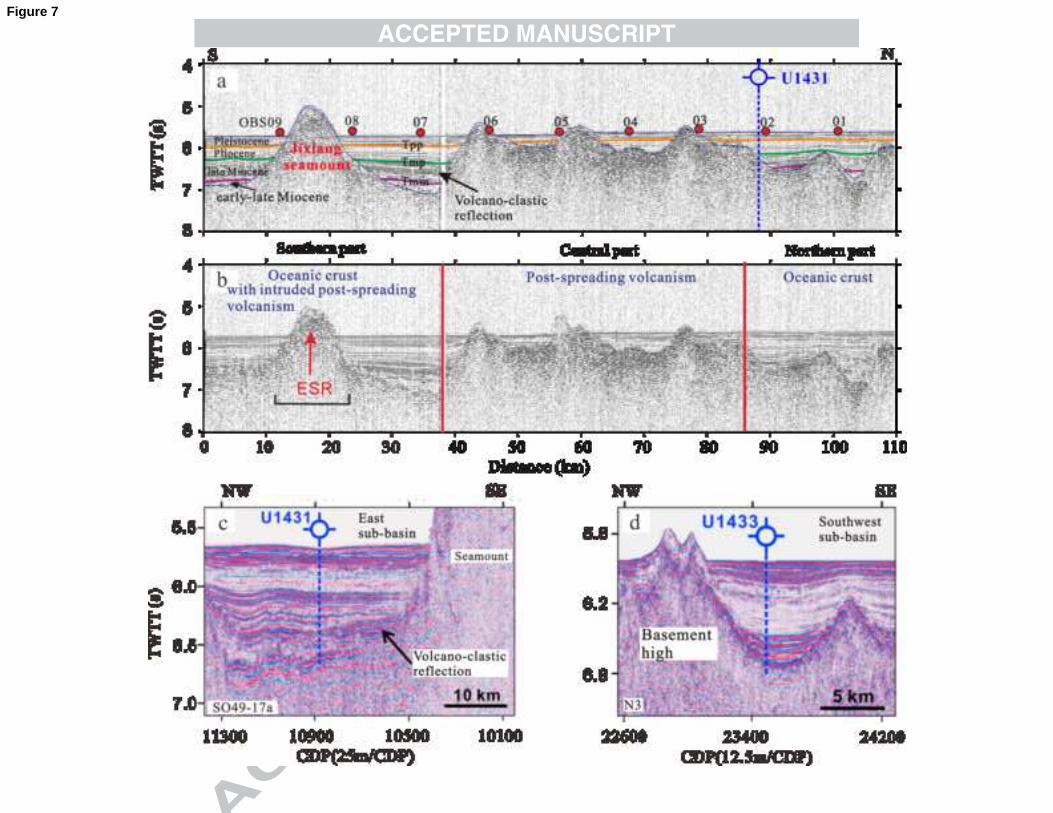
of 95 to 110 km on the single channel seismic reflection (Fig. 7a).
4.2. Modeling approach and reliability analysis
The 2-D velocity-depth models (Fig. 8) are obtained by using the 2-D forward ray-tracing
RayInvr software (Zelt and Smith, 1992) and then the TOMO2D joint refraction and reflection

9
travel time inversion code of Korenaga et al. (2000).
Firstly, we establish the initial model for RayInvr based on the single channel seismic profile
(Fig. 7a), the seismic phases of the nine OBSs, located along the profile G8G0, and regional
geological and geophysical data (Yao and Wang, 1983; Liu, 2000; Li et al., 2015). The model
consists of five layers: seawater, sediments, upper crust (oceanic layer 2), lower crust (oceanic
layer 3) and upper mantle, corresponding to velocities of 1.5 km/s, 1.7 to 2.6 km/s, 4.5 to 6.4 km/s,
6.4 to 7.0 km/s and 8.0 to 8.2 km/s, respectively.
Seismic sequence boundaries for the sediment layer were mapped on the G8G0 single
channel seismic profile, according to stratigraphic correlations between MCS profiles 973SCSIO1
and SO49-17 (located in Fig. 1b) and coring/logging data from IODP Site U1431 (Fig. 7a) (Li et
al., 2015). Tmm, Tmp and Tpp are middle Miocene/late Miocene, Miocene/Pliocene, and
Pliocene/Pleistocene boundaries, respectively (Li et al., 2015). The seismic facies and sequence
boundaries are easily traced because of their distinct seismic characteristics. For example, the
Pliocene sedimentary layer displays a weak seismic reflectivity, compared to the strong seismic
reflectivities of the Pleistocene sequence above and the Miocene sequence below. The intensity
grades of seismic facies show the different lithologies, which are confirmed by the coring/logging
data at Site U1431 (Li et al., 2014; 2015). The velocity and thickness of the sediments are based
on the quadratic time-depth conversion function z in meters where z = 0.000188295 t2 + 0.695896
t with t in ms is the two-way travel time (TWTT) (Li et al., 2015). The 6.4 km/s velocity contour
generally coincides with the boundary between layer 2 and 3 (Harding et al., 1993).
For the forward modeling (Fig. 8a), the initial model was continuously adjusted to fit the
observed and theoretical travel times by using the trial and error method (Zelt and Smith, 1992).
The inverted velocity model (Fig. 8a) and the sediment layer are a priori information used each
time in the next inversion step. Travel times of Pg1, Pg2, PmP and Pn phases are used to obtain
the crustal velocity distribution and the Moho geometry. The travel time residuals numbers of
picks and normalized χ2 values for each seismic phase are summarized in Table 1. Travel time
uncertainties are estimated at 50 ms, 70 ms and 90 ms for Pg, PmP and Pn arrivals, respectively,
depending on the quality of travel time picks. The total root-mean-square (RMS) travel time
residuals is 0.076 s for the final velocity model, and normalized χ2 is 1.262 (Table 1), which is
close to the optimal value of 1. In general, the coverage of ray paths is more than 10 to 20 hits,

10
reaching 30 to 40 hits amongst OBSs, even over 60 hits in some areas (Fig. 8b), which indicates a
high reliability for the final model. The uncertainties in velocity and Moho depth were defined by
using the F-test referenced by Zelt (1999) and Niu et al., (2015). The result (Table A.1) indicates
that the uncertainties in crustal velocity are less than 0.4 km/s and the uncertainty in Moho depth
is ±0.36 km.
Secondly, we use the TOMO2D joint refraction and reflection travel time inversion code
(Korenaga et al., 2000) for modeling. The Korenaga tomographic approach provides a smooth
velocity model mostly constrained by the refracted phases. Compared to the Zelt and Smith (1992)
approach, this technique requires much less a priori information and prevents from
over-interpretating the data. It is actually a joint refraction and reflection travel time tomography
method. Refracted phases (first arrivals) and reflections at the base of the crust (PmP) are inverted
simultaneously to provide a one-layer, continuously varying velocity model and a floating
reflector representing the base of the crust. Note that the reflector at the base of the crust is not
correlated to any velocity jump: it is not stricto sensu the Moho interface. A starting velocity
model is required by the tomographic approach. The shallower part of this model is built using the
geometry and velocity of the sedimentary layers inferred from the seismic reflection profile (Fig.
7a). Below the basement, the velocity is uniformly set up at 4.5 km/s and 8.2 km/s from the top to
the bottom and a vertical gradient is added. The starting floating Moho reflector is introduced at a
constant depth of 11 km.
We tried to get a solution with the least amount of required structure that fits the observed
travel times adequately (low RMS and 2 ideally close to 1) in the least number of iterations. Both
the refraction and reflection travel times constrain the velocities. Our grid spacing is Δx=250 m
and Δz=125 m immediately below the seafloor to 16 km at the bottom of the model, and the
smoothing correlation lengths are 2.0-4.0 km and 0.2- m2.0 km from top to bottom in the
horizontal and vertical directions, respectively. After 10 iterations, we gained the final model (Fig.
9a) with a RMS residual of 80 ms and a normalized χ2 value of 1.63. The uncertainties of
velocities and Moho discontinuities (Fig. 9b) were calculated by Monte Carlo analysis (Korenaga
et al., 2000). Thus, the uncertainties in crustal and upper mantle velocities are less than 0.1 and 0.3
km/s (Fig. 9b), respectively. The uncertainty of the Moho depth is about 0.35 km beneath OBS02
and OBS03 and up to 0.9 km beneath OBS09. The derivative weight sum (DWS) is the
11
column-sum vector of the velocity kernel and measures the ray coverage, which estimates ray
density with a hit count that weights each ray by its distance to the model parameter. The DWS of
the final velocity model is shown in Fig. 9c. White areas correspond to poorly constrained regions
(DWS<1.0).
The two velocity structures of forward and tomographic modelings (Figs 8a and 9a) are very
similar: same shape tendency of the 6.4 km/s contour, same low velocity anomaly in the upper
crust in the central part and same Moho uplift located between OBS06 and OBS07. However, the
tomographic modeling suggests a significant Moho rise beneath the Jixiang seamount located
between OBS08 and OBS09.
5. Discussion
5.1 Modeling results and nature of crust
The velocity model shows significant lateral variations along the G8G0 profile (Figs. 8a and
9a). According to the velocity structure, the model is divided into three parts: the southern part (0
to 38 km) consists of oceanic crust possibly intruded by the post-spreading Jixiang seamount
emplaced along the ESR, the central part (38 to 86 km) is characterized by post-spreading
volcanism emplaced through the previously formed oceanic crust, and the northern part (86 to 110
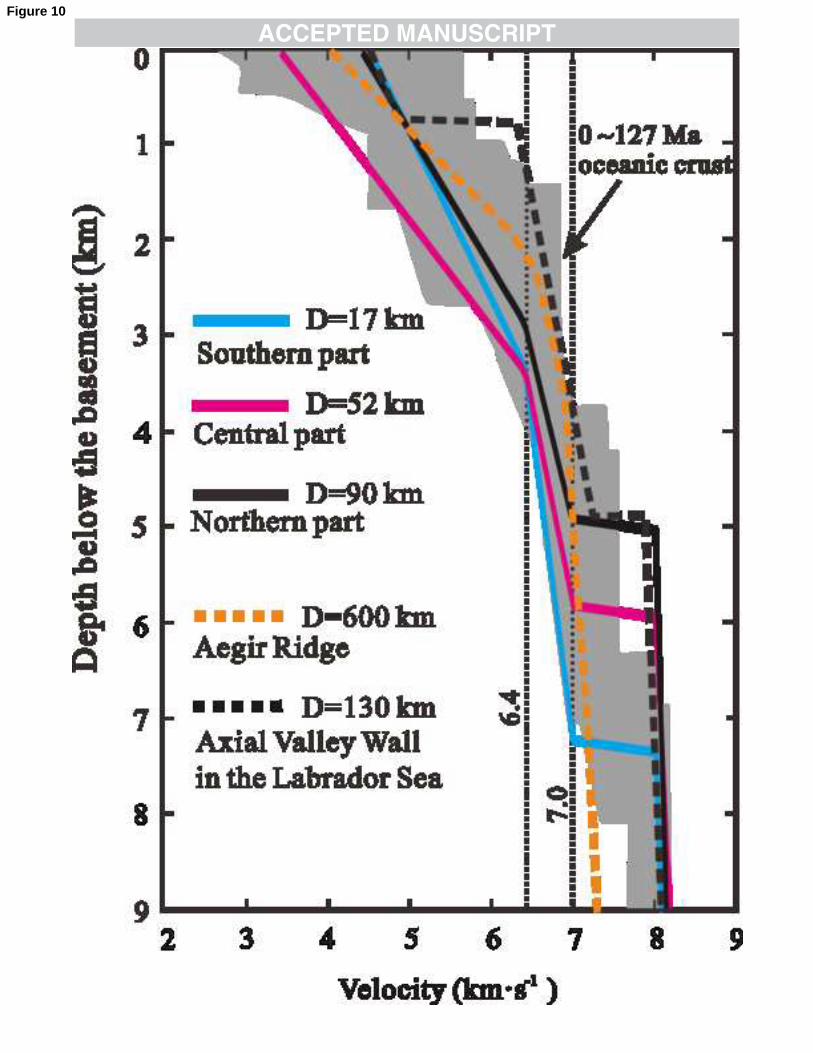
km) consists of oceanic crust. When compared with the 0-127 Ma oceanic crust velocity bounds
(White et al., 1992), 1-D velocity-depth curves extracted from the 2-D velocity model (Fig. 8a) at
D = 17 km, 52 km and 90 km along the G8G0 profile show that the crust is globally representative
of oceanic crust though its thickness varies from 4 to 7.2 km (Fig. 10).
The northern part of the profile (86 to 110 km in Figs. 8a and 9a) shows a typical oceanic
crust with a relatively constant thickness of 5 km (White et al., 1992). The velocity rises from 4.3
to 4.5 km/s at the top to 6.9 to 7.0 km/s at the bottom of the crust. Here, the 1-D curve at D = 90
km (Fig. 10) is similar to the 1-D model of the Labrador Sea (Delescluse et al., 2015), a marginal
sea with a clearly recognized extinct spreading ridge; and it is also alike to the 1-D models of the
Aegir ridge (Brandsdóttir et al., 2015) with a 4-5 km thickness, which is slightly less than the
5.5-6.5 km observed by Grevemeyer et al. (1997). All these 1-D models represent normal oceanic
crust not affected by post-spreading magmatism. In the southern part (0 to 38 km in Figs. 8a and
9a), the crust beneath the Jixiang seamount is ~7.2 km thick, with a velocity varying from 4.5
12
km/s at the top of igneous rocks to 7.0 km/s at the bottom of gabbros. The rising basement and
Moho beneath the Jinxiang seamount, where travel time curves rise steeply at their corresponding
offsets in Figs. 3 to 5, could be induced by a post-spreading magmatic intrusion. The crust
thickens to 7.2 km (at D = 17 km in Fig. 10) and near OBS07, the thickness of the crust is similar
to what was found in the northern part of the profile and is consequently of oceanic nature.
However, south of the Jixiang seamount, the profile is not long enough to characterize the nature
of the crust.
In the central part of the profile (38 to 86 km in Figs. 8a and 9a), a low velocity body (3.3 to
3.7 km/s) is observed in the uppermost crust and velocities are lower than those of the typical
adjacent oceanic crusts (Figs. 8a, 9a and 10). On OBS seismic record sections, seismic phases are
faint and blurred (Figs. 3a to 6a). This could be due to the presence of a series of small basement
relieves evidenced on the single-channel seismic reflection profile (Fig. 7a). All these observations
might indicate that, even if the post-spreading volcanic seamounts are globally E-W oriented, the
weak zones of the former oceanic crust (rift or fracture zone trends) have been only used very
locally during the emplacement of the post-spreading magmatic features within the central part of
the profile. This is suggested by the morphology of the Zhenbei and Huangyan seamounts where
both NE-SW and NW-SE trends are clearly expressed (Fig. 2) and it has been shown by the shape
of the 3-D seismic tomography below the Zhenbei-Huangyan seamounts chain (Wang et al.,
2016).
5.2. Low velocity zone in the uppermost crust
If the northern part of the profile is unaffected by post-spreading magmatism, however, in the
central part, where is located the PSVR, the uppermost velocity is about 3.3-3.7 km/s. These
values are much lower than those of the oceanic crust identified north and south of the central part
(Figs 8a and 9a), in the surrounding oceanic regions (Table 2) and of the P-wave velocity of
basaltic rocks sampled at IODP Site U1431 (~5.0 km/s) (Li et al., 2015).
Defining the 4.5 km/s as the normal velocity in the uppermost mature oceanic crust
(Grevemeyer and Weigel, 1996), this low velocity zone is about 30 km wide and 1.5 km thick.
Plausible causes for this anomalously low velocity values are: (1) A 9-m thick hemipelagic
claystone was found between the two basaltic units at Site U1431 located near OBS3 when
13
projected on the profile G8G0 along the N055° direction (Expedition 349 Scientists, 2014).
Several sills separated by such sedimentary layers might exist above the true oceanic crust (Sibuet
et al., 2016), suggesting that the claystone occurrences may have reduced the mean velocities in
the uppermost crust; (2) Both the rugged basement documented by the single-channel seismic
reflection profile (Fig. 7) and the scatter seismic phases indicate that fractures may have
developed in the vicinity of the PSVR (Figs. 4 to 7) contributing to the formation of the low
velocity zone. We tend to favor the first hypothesis.
5.3. Jixiang seamount
The thickened crust (7.2 km) of the Jixiang seamount is markedly different of the typical
oceanic crust (Figs. 8a, 9a and 10), which indicates the crust beneath the Jixiang seamount had
been probably modified by the post-spreading magmatism. In the SCS, the post-spreading
magmatism presents similar characteristics and similar tectonic environment with the ones of the
Davidson seamount located above the fossil spreading center in the eastern Pacific (Castillo et al.,
2010): (1) There is no evidence for the existence of a mantle plume or hot spot; (2) The seamounts
share a common, heterogeneous mantle source (Tu et al., 1992; Wang et al., 2009; Perez et al.,
2013); (3) The younger magma is characterized by a greater enrichment in incompatible trace
elements (REE, LILE, HFSE) and radiogenic isotopes (Yan et al., 2008). Castillo et al. (2010)
suggested that the post-spreading mechanism of formation of the Davidson seamount may be
explained by the buoyancy-driven upwelling model, which may be applied to the case of the SCS
East Sub-basin. The interpretation of the 3-D seismic tomography of the Zhenbei-Huangyan
seamounts chain (Wang et al., 2016) also suggests a seamount formation mechanism similar to the
one of the Davidson seamount. The residual melt trapped in the heterogeneous mantle after the
cessation of seafloor spreading ascended upwards due to the buoyancy-driven decompression
melting. Note that the formation mechanism of post-spreading seamounts in the East Sub-basin
(Lin et al., 2013) is probably the same for the seamounts of the Southwest Sub-basin (Meng and
Zhang, 2014) where high heat-flow values were recorded (Shi et al., 2003).
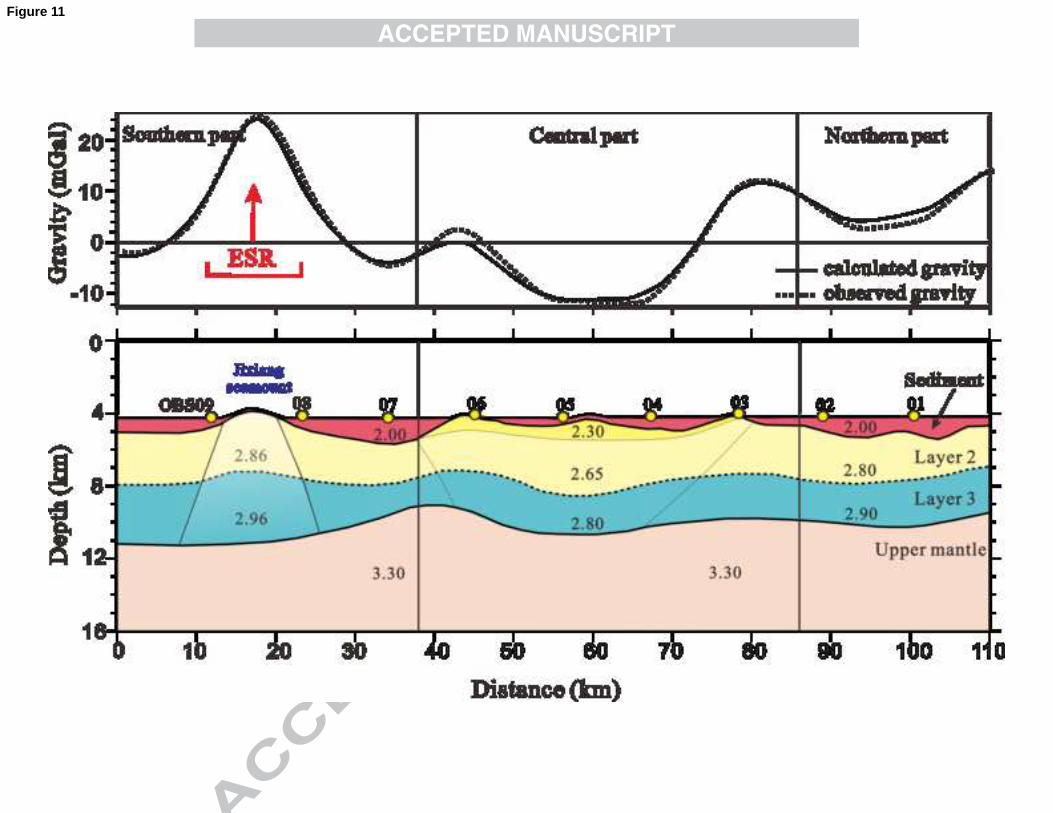
5.4. Gravity model
In order to obtain additional constraints and strengthen the reliability of the velocity structure

14
(Fig. 8a), we have synthesized a forward density model by converting velocities to densities, and
by comparing calculated and observed free-air gravity anomalies. Gravity data along the G8G0
profile (Fig. 11a) was extracted from the global 1’× 1’ gravity grid (Sandwell et al., 2014). The
seismic velocities (V) were converted to the density model (ρ) using the empirical relationships ρ
= 1.75 + 0.16V for sediments (Nafe and Drake, 1963); ρ = 3.81 - 6.0/V for layer 2 (Carlson and
Herrick, 1990) and ρ = 0.375 + 0.375V for layer 3 (Birch, 1960). The seawater and upper mantle
were initially assumed to have a constant density of 1.03 g/cm3 and 3.3 g/cm3, respectively. We
divided the model into several blocks, and then calculated the gravity anomaly value for each
block before summarizing the values of all the blocks (Yao et al., 2003). The boundary effect was
removed by extending the model domain 50 km outward on both sides of it. The fit between
observed and calculated gravity values is reasonable (RMS = 0.86 mGal).
14 different density blocks were used in the density model (Fig. 11b). The central part (38 to
70 km) with low gravity values (-10 mGal), displays low density crustal bodies (2.30, 2.65 and
2.80 g/cm3) compared with the external parts (2.80 and 2.90 g/cm3). The low density body (2.30
g/cm3) corresponding to the low upper crustal velocities of 3.3-3.7 km/s, might correspond to
highly porous clastic material, high-porosity pillow lavas or extrusive rocks with interstratified
sedimentary layers as suggested by the above velocity analysis. In the southern part of the profile,
the high gravity value (20 mGal) associated with high-density bodies beneath the Jixiang
seamount indicates that the nature of this seamount is different from the nature of seamounts
located in the central part of the profile. This high-density body might correspond to a
high-velocity intrusion.
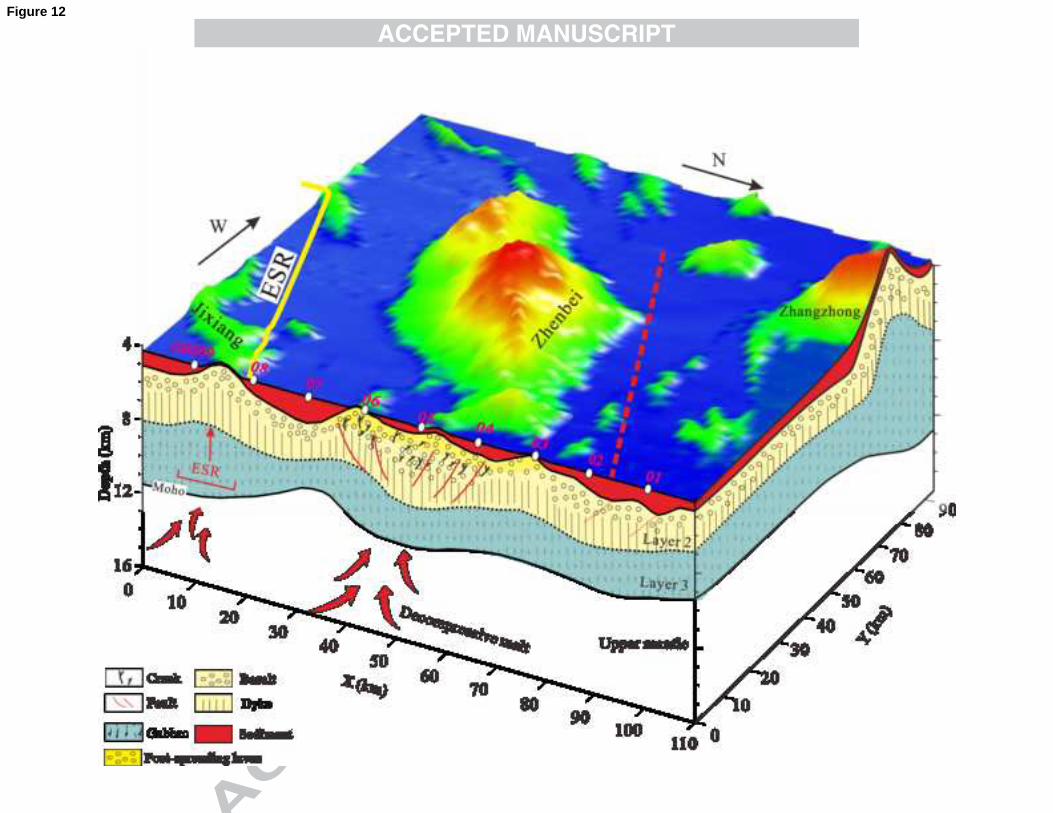
5.5 Geological model
Combined with the interpretation of swath bathymetric data (Fig. 2), the wide-angle seismic
reflection and refraction results obtained along the G8G0 profile allow to image not only the
seafloor spreading fabric and the post-spreading magmatism of the East Sub-basin but also the
deep structure of the underlying oceanic crust intruded by post-spreading magmatism. The
proposed geological model (Fig. 12) is built along the G8G0 profile, perpendicularly to the E-W
Zhenbei-Huangyan seamounts chain, and obliquely to the general trend of the Jixiang seamount.
The red dashed line is the northern boundary of the spreading fabric of the central domain and the
15
yellow line is the N055° ESR (Sibuet et al., 2016). Note that the Zhenbei seamount is emplaced
along the N055° direction of spreading lineaments as also attested by the 3-D seismic tomography
of the Zhenbei-Huangyan seamounts chain (Wang et al., 2016), even if the chain is E-W oriented.
The red arrows show the upward motion of the residual melt due to the buoyancy-driven
decompression melting after the cessation of seafloor spreading and resulting in the formation of
both the Jixiang seamount and the PSVR. The Jixiang seamount, characterized by the intrusion of
a high-density body (Fig. 11), possibly occurred during the early stage of the post-spreading
magmatism, along a zone of weakness corresponding to the recently extinct spreading ridge (Fig.
2), which could be the result of an intrusion through a set of N055° and conjugate N145°
directions. Then, the Zhenbei-Huangyan seamounts chain was globally emplaced in an E-W
direction but locally each seamount seemed to be emplaced along the N055° and N145° conjugate
directions as shown by the swath-bathymetric data of Fig. 2 and the 3-D seismic tomography
(Wang et al., 2016). Our study shows that Layer 2 is thick beneath the PSVR and displays a
1.5-km thick low velocity upper crustal layer, which may consist of extrusive basalts with
intercalated sedimentary layers. Thus, it seems that, even if the early phase of emplacement of
both the Jixiang seamount and the Zhenbei-Huangyan seamounts chain started with the same
geodynamic processes, which consists to the rise of decompressive melt due to the N-S
post-seafloor spreading extension, the Zhenbei-Huangyan seamounts chain with a E-W trend is in
a more mature stage of emplacement with the later emplacement of extrusives intercalated with
sedimentary layers.
6. Conclusions
The N-S oriented G8G0 wide-angle seismic reflection and refraction profile was shot
perpendicularly to the post-spreading Zhenbei-Huangyan seamounts chain in between the Zhenbei
and Huangyan seamounts, where the topographic variations are the weakest. The main results of
this study are:
- The crust north and south of the Zhenbei-Huangyan seamounts chain is about 4-6 km thick
and velocities are largely comparable with those of normal oceanic crust of Atlantic type.
- In the central part of the profile, the post-spreading volcanic ridge is characterized by a 6-km
16
thick crust with a velocity structure similar to the one of the adjacent oceanic crust. A 1.5-km
thick low velocity zone (3.3-3.7 km/s) located in the uppermost crust is explained by the
presence of extrusive rocks intercalated with thin sedimentary layers as drilled at IODP Site
U1431.
- The Jixiang seamount, located south of the Zhenbei-Huangyan seamounts chain, seems to be
a tiny post-spreading volcanic seamount intruded along the former seafloor spreading zones
of weaknesses, probably before the emplacement of the E-W post-spreading
Zhenbei-Huangyan seamounts chain. Both the Jixiang seamount and the Zhenbei-Huangyan
seamounts chain initially formed by the intrusion of decompressive melt through the already
existed oceanic crust resulting from the N-S post-spreading phase of extension.
Acknowledgments
We are grateful to the crew of the R/V Shiyan 2 and scientists who took part in the scientific
cruise. Insightful comments by Hongfeng Yang, Jian Lin and Yongjian Yao are kindly
acknowledged. The GMT software (Wessel and Smith, 1995) was used in this study. This work is
supported by the Chinese National Natural Science Foundation (contracts 91028002, 91428204,
41176053). The manuscript was improved by constructive reviews of Frauke Klingelhoefer and
Xiongwei Niu.
References
Ao, W., Zhao, M.H., Qiu, X.L., Li, J.B., Chen, Y.S., Ruan, A.G., Li, S.J., Zhang, J.Z., Wu, Z.L.,
Niu, X.W., 2010. The correction of shot and OBS position in the 3D seismic experiment of
the SW Indian Ocean Ridge. Chinese Journal of Geophys. 53, 2982-2991.
Ao, W., Zhao, M.H., Qiu, X.L., Ruan, A.G., Li, J.B., 2012. Crustal structure of the Northwest
Sub-basin of the South China Sea and its tectonic implication. Earth Science-Journal of
China University of Geosciences. 37, 779-790. doi: 10.3799/dqkx.2012.087. (in Chinese with
English abstract).
Barckhausen, U., Engels, M., Franke, D., Ladage, S., Pubellier, M., 2014. Evolution of the South
China Sea: Revised ages for breakup and seafloor spreading. Marine and Petroleum Geology.
http://dx.doi.org/10.1016/j.marpetgeo.2014.02.022.

17
Birch, F., 1960. The velocity of compressional waves in rocks to 10 kilobars: 1. Journal of
Geophysical Research. 65, 1083-1102.
Briais, A., Patriat, P., Tapponnier, P., 1993. Updated interpretation of magnetic anomalies and
seafloor spreading stages in the South China Sea: Implications for the Tertiary tectonics of
Southeast Asia. Journal of Geophysical Research. 98, 6299-6328.
Brandsdóttir, B., Hooft, E.E., Mjelde, R., Murai, Y., 2015. Origin and evolution of the Kolbeinsey
Ridge and Iceland Plateau, N-Atlantic. Geochemistry, Geophysics, Geosystems. 16, 612-634.
Carlson, R.L., 1998. Seismic velocities in the uppermost oceanic crust: Age dependence and the
fate of layer 2A. Journal of Geophysical Research. 103, 7069-7077.
Carlson, R.L., Herrick, C.N., 1990. Densities and porosities in the oceanic crust and their
variations with depth and age. Journal of Geophysical Research. 95, 9153-9170.
Castillo, P.R., Clague, D.A., Davis, A.S., Lonsdale, P.F., 2010. Petrogenesis of Davidson
Seamount lavas and its implications for fossil spreading center and intraplate magmatism in
the eastern Pacific. Geochemistry, Geophysics, Geosystems. 11,
Q02005,doi:10.1029/2009GC002992.
Delescluse, M., Funck, T., Dehler, S.A., Louden, K.E., Watremez, L., 2015. The oceanic crustal
structure at the extinct, slow to ultraslow Labrador Sea spreading center. Journal of
Geophysical Research. 120, 5249-5272.
Expedition 349 Scientists. 2014. South China Sea tectonics: Opening of the South China Sea and
its implications for southeast Asian tectonics, climates, and deep mantle process since the late
Mesozoic. International Ocean Discovery Program Preliminary Report, 349
http://dx.doi.org/10.14379/iodp.pr.349.2014.
Grevemeyer, I., Weigel, W., 1996. Seismic velocities of the uppermost igneous crust versus age.
Geophysical Journal International. 124, 631-635.
Grevemeyer, I., Weigel, W., Dehghani, G.A., Whitmarsh, R.B., Avedik, F., 1997. The Aegir Rift:
Crustal structure of an extinct spreading axis. Marine Geophysical Researches. 19, 1-23.
Harding, A.J., Kent, G.M., Orcutt, J., 1993. A multichannel seismic investigation of upper crustal
structure at 9°N on the East Pacific Rise: Implications for crustal accretion. Journal of
Geophysical Research. 98, 13925-13944.
Korenaga, J., Holbrook, W.S., Kent, G.M., Kelemen, P.B., Detrick, R.S., Larsen, H.C., Hopper,

18
J.R., Jensen, T.D., 2000. Crustal structure of the southeast Greenland margin from joint
refraction and reflection seismic tomography, Journal of Geophysical Research, 105,
21591-21614.
Li, C.F., Li, J.B., Ding, W.W., Franke, D., Yao, Y.J., Shi, H.S., Pang, X., Cao, Y., Lin, J., Kulhanek,
D.K., Walliams, T., Bao, R., Briais, A., Brown, E.A., Chen, Y.F., Clift, P.D., Colwell, F.S.,
Dadd, K.A., Hernández‐Almeida, I., Huang, X.L., Hyun, S.M., Jiang, T., Koppers, A.A.P.,
Li, Q.Y., Liu, C.L., Liu, Q.S., Liu, Z.F., Nagai, R.H., Peleo‐Alampay, A., Su, X., Sun, Z.,
Tejada, M.L.G., Trinh, H.S., Yeh, Y.C., Zhang, C.L., Zhang, F., Zhang, G.L., Zhao, X.X.,
2015. Seismic stratigraphy of the central South China Sea basin and implications for
neotectonics. Journal of Geophysical Research, 120, 1377-1399. doi:
10.1002/2014JB011686.
Li, C.F., Xu, X., Lin, J., Sun, Z., Zhu, J., Yao, Y.J., Zhao, X.X., Liu, Q.S., Kulhanek, D.K., Wang,
J., Song, T.R., Zhao, J.F., Qiu, N., Guan, Y.X., Zhou, Z.Y., Williams, T., Bao, R., Briais, A.,
Brown, E.A., Chen, Y.F., Clift, P.D., Colwell, F.S., Dadd, K.A., Ding, W.W., Almeida, I.H.,
Huang, X.L., Hyun, S.M., Jiang, T., Koppers, A.A.P., Li, Q.Y., Liu, C.L., Liu, Z.F., Nagai,
R.H., Peleo‐Alampay, A., Su, X., Tejada, M.L.G., Trinh, H.S., Yeh, Y.C., Zhang, C.L.,
Zhang, F., Zhang, G.L., 2014. Ages and magnetic structures of the South China Sea
constrained by deep tow magnetic surveys and IODP Expedition 349. Geochemistry,
Geophysics, Geosystems. 15, 4958-4983. doi:10.1002/2014GC005567.
Li, J.B., Ding, W.W., Gao, J.Y., Wu, Z.Y., Zhang, J., 2011. Cenozoic evolution model of the
sea-floor spreading in South China Sea: New constraints from high resolution geophysical
data. Chinese Journal of Geophys. 54, 3004-3015. doi:10.3969/j.issn.0001-5733. Li, J.B., Jin, X.L., Gao, J.Y., 2002. Morpho-tectonic study on late-stage spreading of the Eastern
Subbasin of South China Sea. Science in China (Series D). 32, 239-248.
Lin, W., Zhang, J., Li J.B., 2013. The thermal simulation of magma activities of the seamount
chain after the spreading period. Marine Sciences. 37, 81-87. (in Chinese with English
abstract).
Liu, J. H., 2000. The characteristics of seismic reflection waves in the middle area of the South
China Sea and their significance. Acta Oceanologica Sinica. 22, 73-80 (in Chinese with
English abstract).

19
Meng, L., Zhang, J., 2014. The magmatic activity mechanism of the fossil spreading center in the
Southwest sub-basin, South China Sea. Science in China, Series D: Earth Science. 44,
239-249.
Morgan, W.J., 1972. Plate motions and deep mantle convection. Geological Society of America
Memoirs. 132, 7-22.
Nafe, J. E., Drake, C.L., 1963. Physical properties of marine sediments. In Hill, M. N. (Ed.), The
Sea. Wiley-Interscience, New York. 94-815.
Niu, X.W., Ruan, A.G., Li, J.B., Minshull, T.A., Sauter, D., Wu, Z.L., Qiu, X.L., Zhao, M.H.,
Chen, Y.J., Singh, S., 2015. Along axis variation in crustal thickness at the ultraslow
spreading Southwest Indian Ridge (50°E) from a wide-angle seismic experiment. Geochem.
Geophys. Geosyst,. 16, 468-485. doi:10.1002/2014GC005645.
Osler, J.C., Louden, K.E., 1995. Extinct spreading center in the Labrador Sea: Crustal structure
from a two-dimensional seismic refraction velocity model. Journal of Geophysical Research.
100, 2261-2278.
Pautot, G., Rangin, C., Briais, A, Tapponnier, P., Beuzart, P., Lericolais, G., Mathieu, X., Wu, J.,
Han, S., Li, H., Lu, Y., Zhao, J., 1986. Spreading direction in the central South China Sea.
Nature. 321(8), 150-154.
Pautot, G., Rangin, C., Briais, A., Wu, J., Han, S., Li, H., Lu, Y., Zhao, J., 1990. The axial ridge of
the South China Sea - A seabeam and geophysical survey. Oceanologica Acta. 13, 129-143.
Perez, A.D.C., Faustino-Eslava, D.V., Yumul Jr, G.P., Dimalanta, C.B., Tamayo Jr, R.A., Yang, T.F.,
Zhou, M.F., 2013. Enriched and depleted characters of the Amnay Ophiolite upper crustal
section and the regionally heterogeneous nature of the South China Sea mantle. Journal of
Asian Earth Sciences. 65, 107-117.
Qiu, X.L., Zhao, M.H., Ao, W., Lǚ, C.C., Hao, T.Y., 2011. OBS survey and crustal structure of the
Southwest Sub-basin and Nansha Block, South China Sea. Chinese Journal of Geophys. 54,
3117-3128. doi: 10.3969/j. issn. 0001-5733.
Ruan, A.G., Niu, X.W., Qiu, X.L., Li, J.B., Wu, M.Q., 2011. A wide angle Ocean Bottom
Seismometer profile across Liyue Bank, the southern margin of South China Sea. Chinese
Journal of Geophysics. 54, 3139-3149. doi: 10.3969/j. issn. 0001-5733
Sandwell, D.T., Müller, R.D., Smith, W.H.F., Garcia, E., Francis, R., 2014. New global marine
20
gravity model from CryoSat-2 and Jason-1 reveals buried tectonic structure. Science, 346,
65-67. doi: 10.1126/science.1258213.
Sibuet J.-C., Yeh Y.C., Lee C.S., 2016. Geodynamics of the South China Sea. Tectonophysics. In
press.
Shi, X.B., Qiu, X.L., Xia, K.Y., Zhou, D. 2003. Characteristics of surface heat flow in the South
China Sea. Journal of Asian Earth Sciences. 22, 265-277. doi:
10.1016/S1367-9120(03)00059-2.
Sun, Z., Zhong, Z.H., Keep, M., Zhou, D., Cai, D.S., Li, X.S., Wu, S., Jiang, J.Q., 2009. 3D
analogue modeling of the South China Sea: A discussion on breakup pattern. Journal of Asian
Earth Sciences. 34, 544-556.
Taylor, B., Hayes, D.E., 1980. The tectonic evolution of the South China Basin. In: Hayes, D.E.
(Ed.), The Tectonic and Geologic Evolution of Southeast Asian Seas and Islands: Part 1.
Geophysical Monograph Series, AGU, Washington, DC. 23, pp. 89-104. Taylor, B., Hayes, D.E., 1983. Origin and history of the South China Sea basin. In: Hayes, D.E.
(Ed.), The Tectonic and Geologic Evolution of Southeast Asian Seas and Islands: Part 2.
Geophysical Monograph Series, AGU, Washington, DC. 27, pp. 23-56.
Tu, K., Flower, M.F., Carlson, R.W., Xie, G., Chen, C.Y., Zhang, M., 1992. Magmatism in the
South China Basin: 1. Isotopic and trace-element evidence for an endogenous Dupal mantle
component. Chemical Geology. 97, 47-63.
Wang, J., Zhao, M.H., Qiu, X.L., Sibuet, J.-C., He, E.Y., Zhang, J.Z, Tao, C.H., 2016. 3D seismic
structure of the Zhenbei-Huangyan seamounts chain in the East sub-basin of the South China
Sea and its mechanism of formation. Geological Journal. doi:10.1002/gj.2781
Wang, X.J., Wu, M.Q., Liang, D.H., 1984. Some geochemical characteristics of basalts from the
South China Sea. Geochemica 4, 332-340 (in Chinese with English abstract).
Wang, Y.J., Han, X.Q., Luo, Z.H., Qiu, Y.Z., Ding, W.W., Li, J.B., Gao, S.T., Chen, R.H., 2009.
Late Miocene magmatism and evolution of Zhenbei-Huangyan Seamount in the South China
Sea: Evidence from petrochemistry and chronology. Acta Oceanologica Sinica. 93-102 (in
Chinese with English abstract).
Wessel, P., Smith, W.H., 1995. New version of Generic Mapping Tools released. Eos, Trans. Am.
Geophys. Union 76(33), 329.

21
White, R.S., Mckenzie, D., O'Nions, R.K., 1992. Oceanic crustal thickness from seismic
measurements and rare earth element inversions. Journal of Geophysical Research. 97,
19683-19715.
Yan, Q.S., Shi, X.F., Wang, K.S., Bu, W.R., Xiao, L., 2008. Major element, trace element, Sr, Nd,
Pb isotopic studies of Cenozoic basalts from the South China Sea. Science in China Series D:
Earth Science. 51, 550-566.
Yao, B.C., 1996. Tectonic evolution of the South China Sea in Cenozoic. Marine Geology &
Quaternary Geology. 16, 1-13 (in Chinese with English abstract).
Yao, B.C., Wang, G.Y., 1983. Crustal structure of the South China Sea Basin. Science in China
Series B. 26, 649-661 (in Chinese with English abstract).
Yao, C.L., Hao, T.Y., Guang, Z.N., Zhang, L.W., 2003. High-speed computation and efficient
storage in 3-D gravity and magnetic inversion based on genetic algorithms. Chinese Journal
of Geophysics. 46, 252-258.
Zelt, C.A., 1999. Modelling strategies and model assessment for wide angel seismic travel-time.
Geophysical Journal International. 139, 183-204.
Zelt, C.A., Smith, R.B., 1992. Seismic traveltime inversion for 2-D crustal velocity structure.
Geophysical Journal International. 108, 16-34.
Zhang, L., Zhao, M.H., Wang, J., He, E.Y., 2013. Correction of OBS position and recent advances
of 3D seismic exploration in the central sub-basin of South China Sea. Earth Science Journal
of China University of Geosciences. 38, 33-42 (in Chinese with English abstract).
22
Fig. 1. (a) Bathymetric map of the South China Sea with 200, 1000 and 3000-m
isobaths. NWSB, ESB, SWSB are the Northwest, East and Southwest Sub-basins,
respectively. (b) Shaded-relief image of the portion of South China Sea identified as a
red box in a). The red broken lines are the boundaries of the oceanic domain formed
during the last spreading phase characterized by N055o rift trends, the solid yellow
line represents the potential location of the extinct spreading ridge (ESR), the dashed
yellow lines represent the transform fault located in the Zhongnan faults zone,
between the ESB and SWSB (Sibuet et al., 2016). A ridge jump (Li et al. 2014) is
underlined by the black arrow between the orange dashed and solid lines. The
magnetic anomalies (white thin lines), the deep-tow magnetic survey profile da13
(thin red line) and multichannel seismic profiles SO49-17, 973SCSIO1 and N3 (thin
yellow lines) are from Li et al. (2014; 2015). Orange line with triangles indicates the
Manila Trench and the yellow star marks the location of Huangyan Island. Red dots
indicate Sites U1431, U1433, U1434 drilled during the IODP 349 expedition
(Expedition 349 Scientists, 2014).
Fig. 2. Location of Profile G8G0 in the East Sub-basin. Positions of the nine OBSs
and the air gun shooting track with 448 shots are shown with OBS numbers and a
yellow line, respectively. The black arrow is the direction of shooting. The pink star is
the location of IODP hole U1431. The pink solid line marks the location of the
deep-tow magnetic survey profile da13 (Li et al., 2014). Red dots show the locations
of dredged samples (Wang et al., 1984; Wang et al., 2009). White narrow lines mark
the C5Cr and C5B magnetic lineations (Li et al., 2014). The ESR (thick yellow line)
and the northern boundary of the N055° rift trends (thick red dashed line) are from
Sibuet et al. (2016).
Fig. 3. Ray tracing and travel times simulation for OBS02 along Profile G8G0. (a)
Seismic record section with the reduced velocity of 6.0 km/s. (b) Observed travel time
(broken color lines) with associated uncertainties shown as vertical bars, and
calculated travel time curves (black thin lines) from the final model. (c) Calculated
23
final model and ray-tracing simulation. The different ray colors correspond to the
different travel time colors in (b).
Fig. 4. Ray tracing and travel times simulation for OBS05 along Profile G8G0. Other
legends are the same as in Fig. 3.
Fig. 5. Ray tracing and travel times simulation for OBS06 along Profile G8G0. Other
legends are the same as in Fig. 3.
Fig. 6. Ray tracing and travel times simulation for OBS09 along Profile G8G0. Le
Other legends are the same as in Fig. 3.
Fig. 7. (a) Single-channel seismic profile G8G0. Thin blue lines underline the seafloor
and the basement. Purple, green, orange thick lines show the seismic sequence
boundaries of middle Miocene/late Miocene (Tmm), late Miocene/Pliocene (Tmp),
and Pliocene/Pleistocene (Tpp), respectively (Li et al., 2015). (b) Raw single-channel
seismic section G8G0. (c) Volcano-clastic sediments result from the erosion of the
adjacent seamount formed during the post-spreading phase (Profile SO49-17) (Li et
al., 2015). (d) Volcano-clastic sediments resulting from the erosion of the adjacent
seamounts formed during the post-spreading phase (Profile N3 located in the
Southwest Sub-basin) (Li et al., 2015). TWTT = two way travel time, CDP = common
depth point.
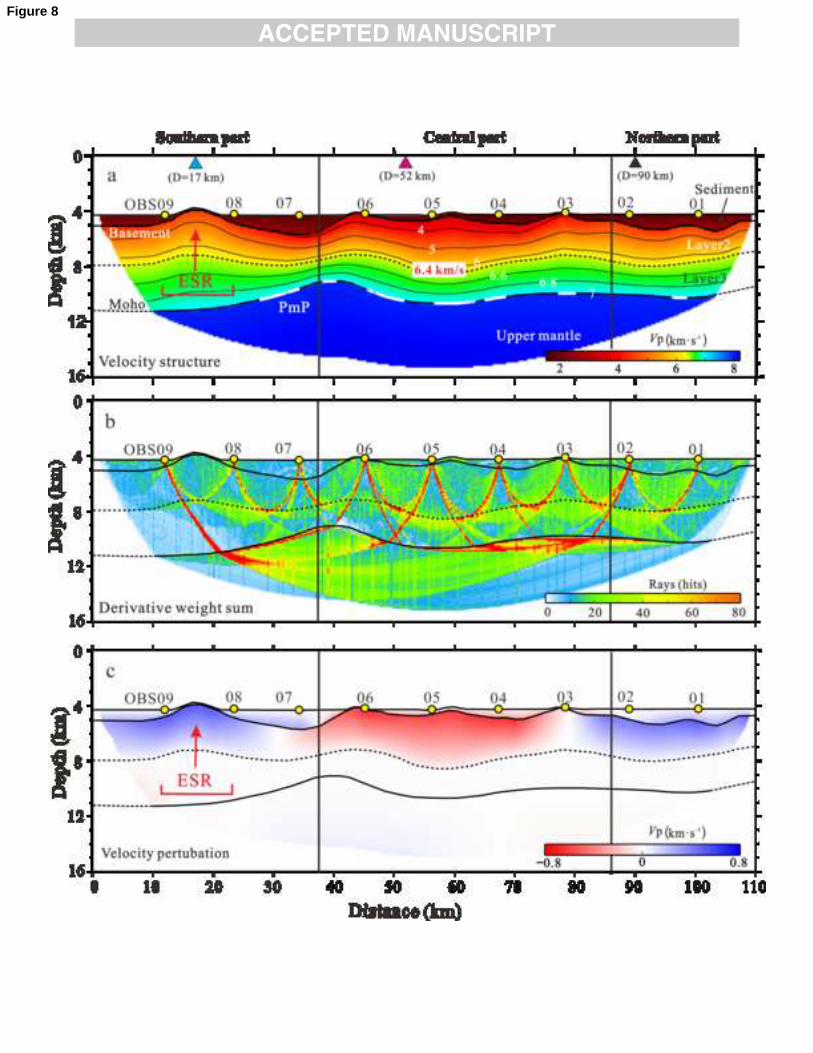
Fig. 8. (a) Final P-wave crustal structure with ray coverage obtained with the RayInvr
software (Zelt, 1992). Yellow circles are OBSs locations along the G8G0 profile. ESR,
extinct spreading ridge. The three triangles with different colors in (a) correspond to
the three 1-D velocity-depth profiles in Fig. 10. The thick white segments indicate
where the Moho interface is constrained by PmP arrivals. (b) Distribution of ray
densities on a 0.25 km × 0.125 km grid corresponding to the velocity model in (a). (c)
Velocity perturbation model derived by subtracting the average 1-D velocity model

24
from the final model (a).
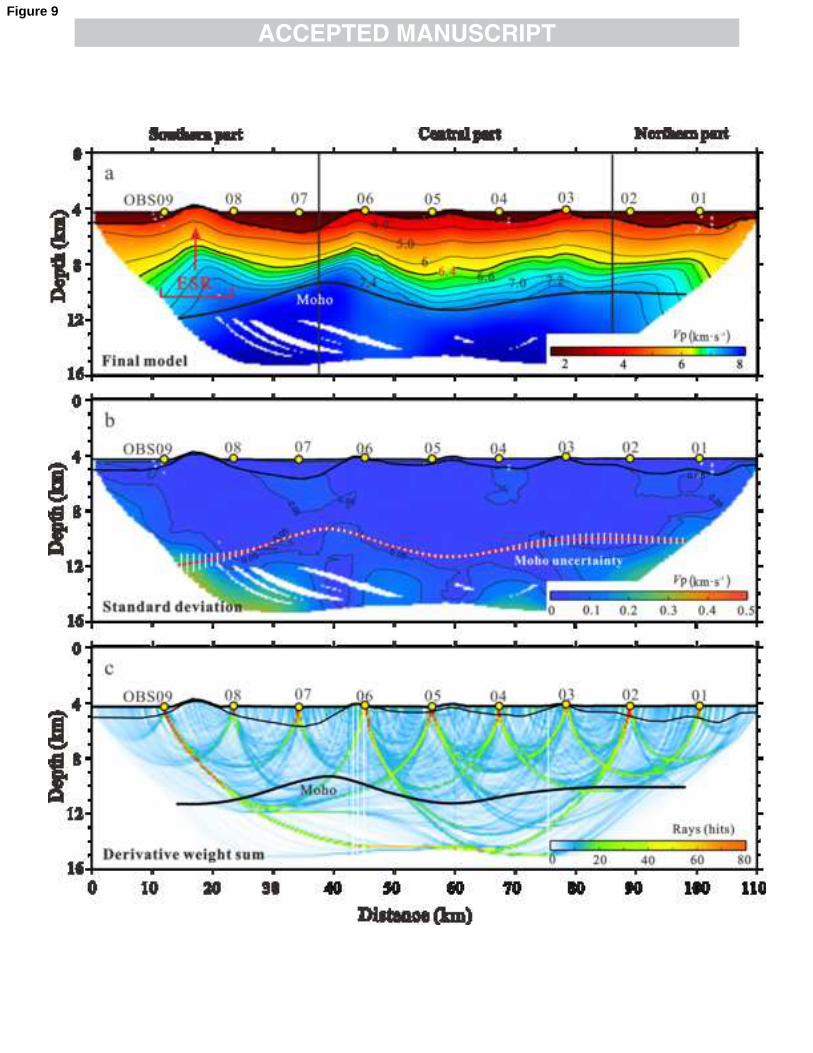
Fig. 9. (a) Final velocity model derived from TOMO2D software (Korenaga et al.;
2000) with a floating Moho interface. (b) Standard deviation stands for velocities
uncertainty and Moho uncertainty. (c) Derivative weight sum for the final velocity
model. Other legends are the same as in Fig. 8.
Fig. 10. 1-D velocity-depth profiles extracted from the final velocity model at
distances of 17, 52 and 90 km corresponding to the different color triangles in Fig. 8a.
The gray area shows the range of typical velocities for the Atlantic oceanic crust
(0-127 Ma) after White et al. (1992). 1-D velocity profiles from the Labrador Sea
(Delescluse et al., 2015) and from Aegir rift (Brandsdóttir et al., 2015) for
comparison.
Fig. 11. Free-air gravity forward modeling along the G8G0 profile. Best-fitting
density model with densities in g/cm3. Other legends are the same as in Fig. 8.
Fig. 12. Geological model. The x-axis is based on the velocity model of the G8G0
profile, and the y-axis is inferred from the bathymetric data. Thick yellow line is the
ESR and the red dashed line is the northern boundary of N055° seafloor spreading
lineaments in the East Sub-basin. The second profile just makes up 3D images for
reference.

25
Table 1. Ray-tracing and travel time simulation results of the final model
Phases Number of picks RMS(s) Normalized χ2
Pg1 500 0.071 2.023
Pg2 713 0.055 1.204
PmP 251 0.066 0.890
Pn 1039 0.091 1.029
Total 2503 0.076 1.262
Table 2. Seismic velocities of the uppermost oceanic crust derived from deep seismic wide-angle reflection and
refraction profiles in the SCS
Line number Location Magnetic
anomalies
Age of oceanic
crust (Ma)
Uppermost velocity
(km/s) References
OBS973-1 SWSB C5e -C5c 19-16 4.5-5.5 Qiu et al., 2011
OBS2006-1 NWSB C11-C10 30-28.7 5.4 Wu et al., 2012
OBS2006-2 NWSB C11- C10 30-28.7 5.5-6.0 Ao et al., 2012
OBS2006-1 CSB C7-C6b 25.5-23.5 6.3 Wu et al., 2012
OBS973-2 CSB C11- C8 30-25.5 5.9 Ruan et al., 2011