Embed Size (px)
Citation preview
“Cryopreservation of human oocytes with
ESHRE Campus Symposium
Cryobiology and cryopreservation of human gametes and embryos
Athens, Greece 25-26 September 2009
Giovanni Coticchio
“Cryopreservation of human oocytes with slow freezing techniques ”
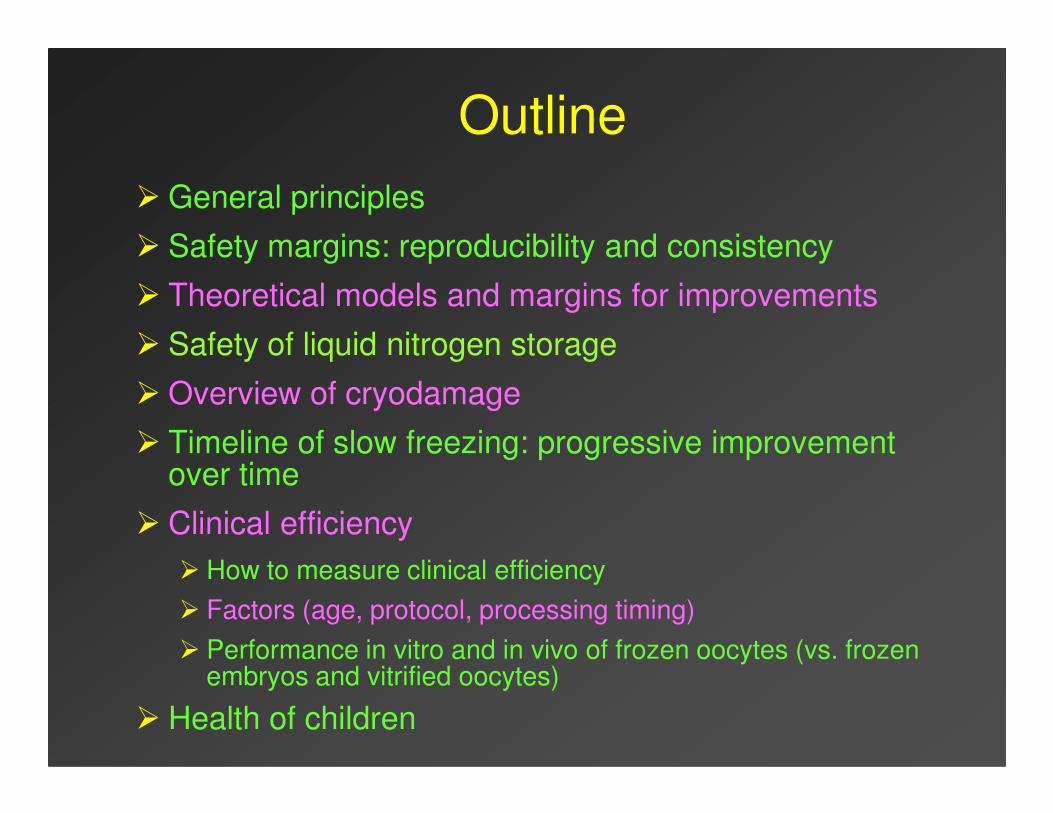
Outline
� General principles
� Safety margins: reproducibility and consistency
� Theoretical models and margins for improvements
� Safety of liquid nitrogen storage
� Overview of cryodamage� Overview of cryodamage
� Timeline of slow freezing: progressive improvement over time
� Clinical efficiency
� How to measure clinical efficiency
� Factors (age, protocol, processing timing)
� Performance in vitro and in vivo of frozen oocytes (vs. frozen embryos and vitrified oocytes)
� Health of children
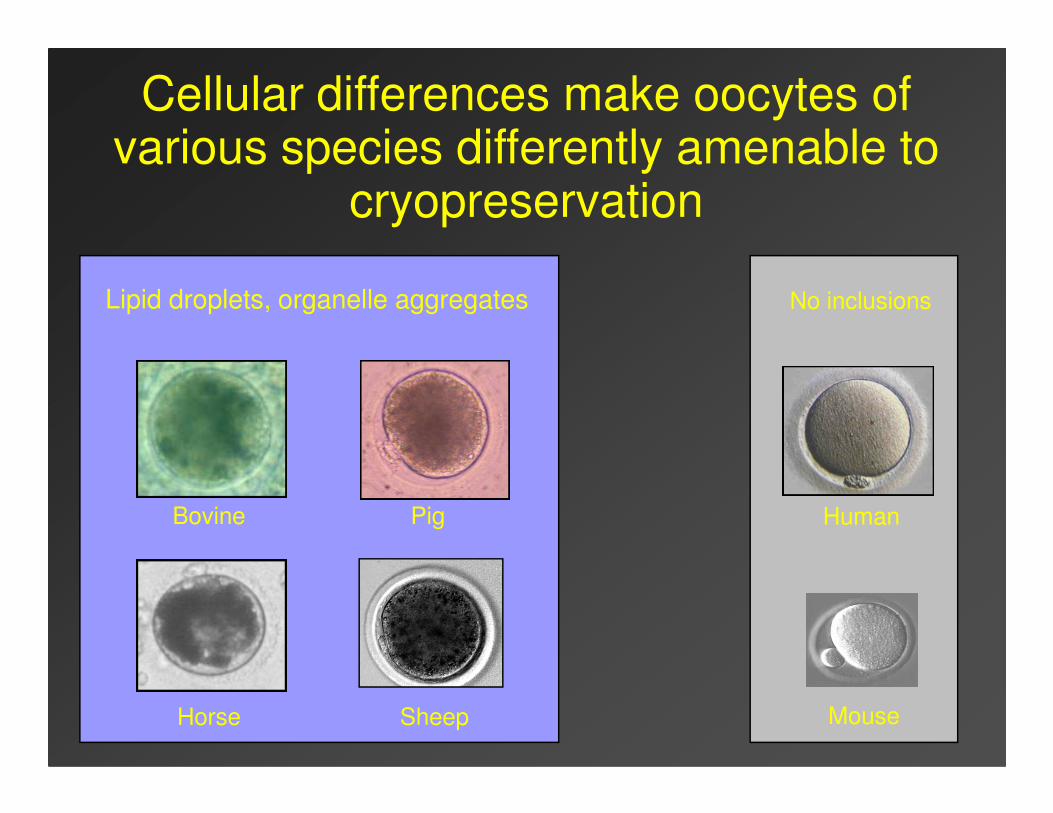
Cellular differences make oocytes of various species differently amenable to
cryopreservation
Lipid droplets, organelle aggregates No inclusions
Horse Mouse
HumanBovine Pig
Sheep
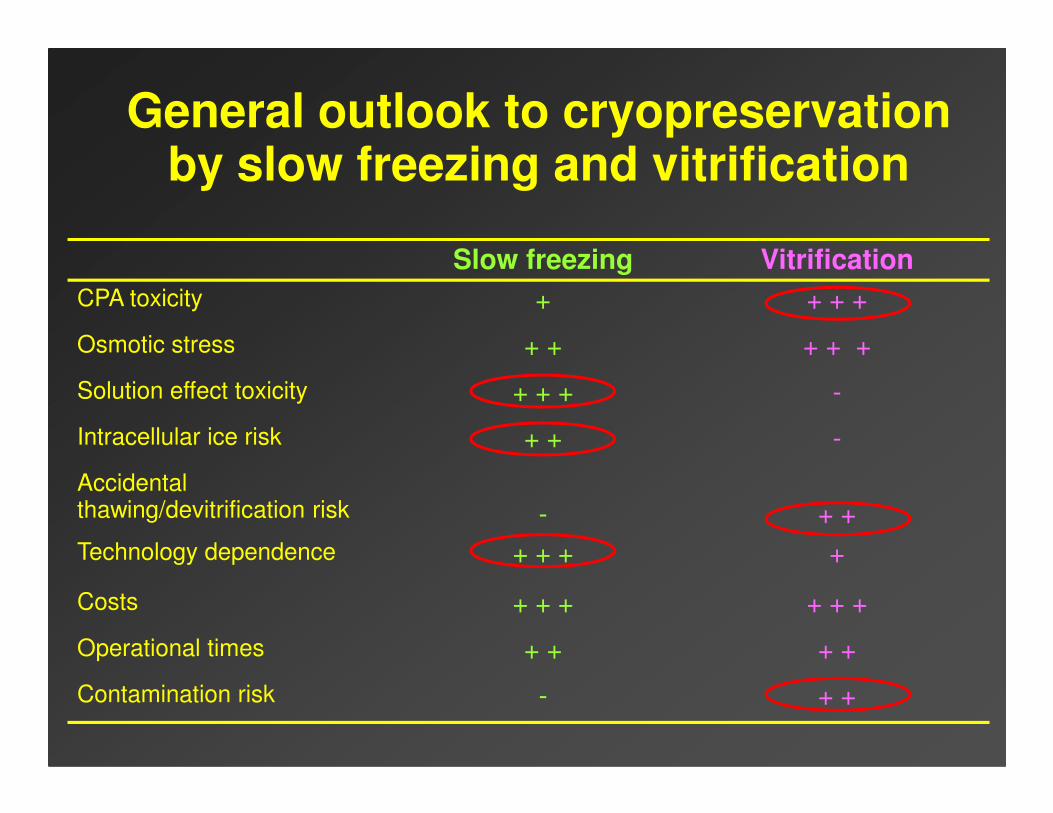
Slow freezing Vitrification
CPA toxicity + + + +
Osmotic stress + + + + +
Solution effect toxicity + + + -
General outlook to cryopreservation by slow freezing and vitrification
Intracellular ice risk + + -
Accidental thawing/devitrification risk - + +
Technology dependence + + + +
Costs + + + + + +
Operational times + + + +
Contamination risk - + +
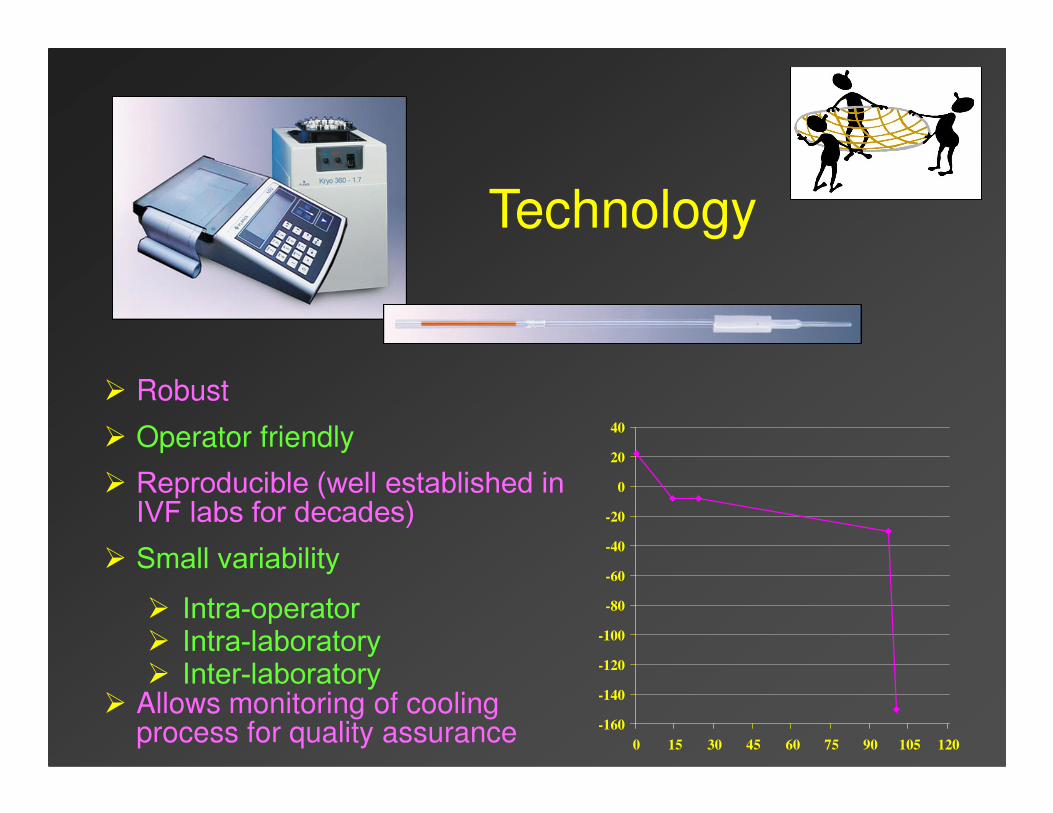
Technology
� Robust
� Operator friendly
� Reproducible (well established in IVF labs for decades)
� Small variability� Intra-operator� Intra-laboratory� Inter-laboratory
� Allows monitoring of cooling process for quality assurance -160
-140
-120
-100
-80
-60
-40
-20
0
20
40
0 15 30 45 60 75 90 105 120
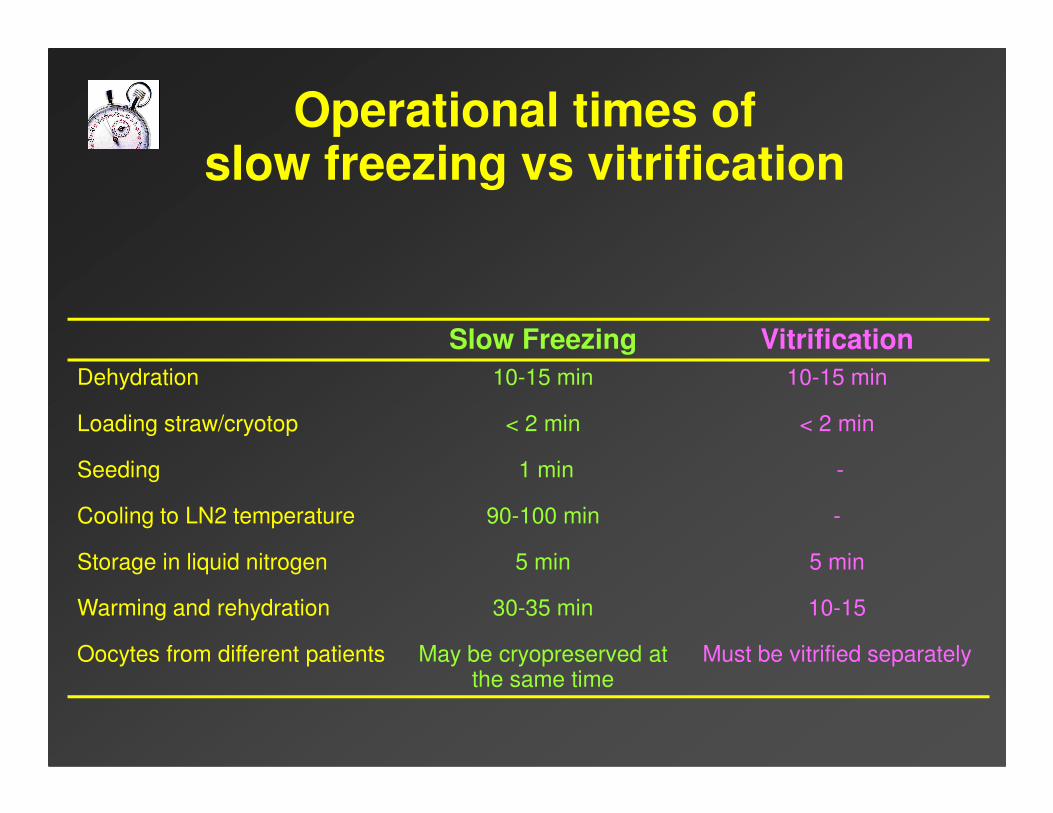
Operational times of slow freezing vs vitrification
Slow Freezing Vitrification
Dehydration 10-15 min 10-15 min
Loading straw/cryotop < 2 min < 2 min
Seeding 1 min -
Cooling to LN2 temperature 90-100 min -
Storage in liquid nitrogen 5 min 5 min
Warming and rehydration 30-35 min 10-15
Oocytes from different patients May be cryopreserved at the same time
Must be vitrified separately
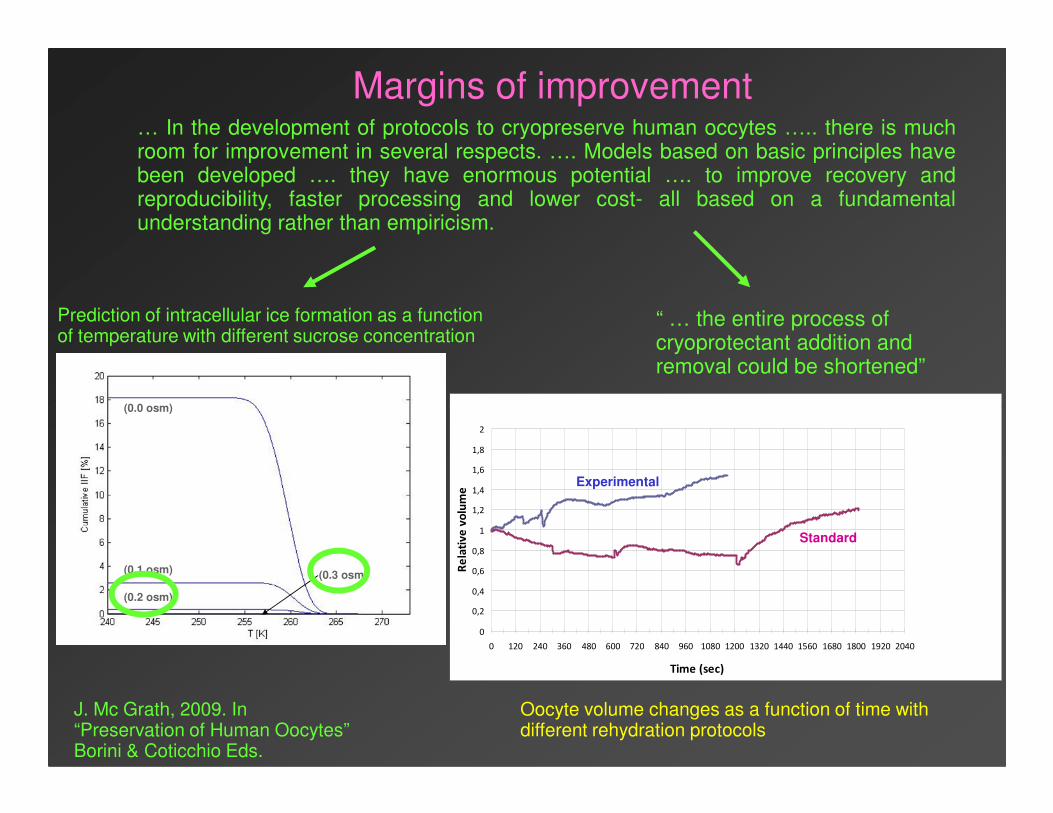
… In the development of protocols to cryopreserve human occytes ….. there is muchroom for improvement in several respects. …. Models based on basic principles havebeen developed …. they have enormous potential …. to improve recovery andreproducibility, faster processing and lower cost- all based on a fundamentalunderstanding rather than empiricism.
(0.0 osm)(0.0 osm)
Prediction of intracellular ice formation as a function of temperature with different sucrose concentration
“ … the entire process of cryoprotectant addition and removal could be shortened”
Margins of improvement
J. Mc Grath, 2009. In“Preservation of Human Oocytes”Borini & Coticchio Eds.
(0.0 osm)
(0.1 osm)
(0.2 osm)
(0.3 osm)
(0.0 osm)
(0.1 osm)
(0.2 osm)
(0.3 osm)
Oocyte volume changes as a function of time with different rehydration protocols
0
0,2
0,4
0,6
0,8
1
1,2
1,4
1,6
1,8
2
0 120 240 360 480 600 720 840 960 1080 1200 1320 1440 1560 1680 1800 1920 2040
Time (sec)
Re
lati
ve
vo
lum
e
Standard
Experimental
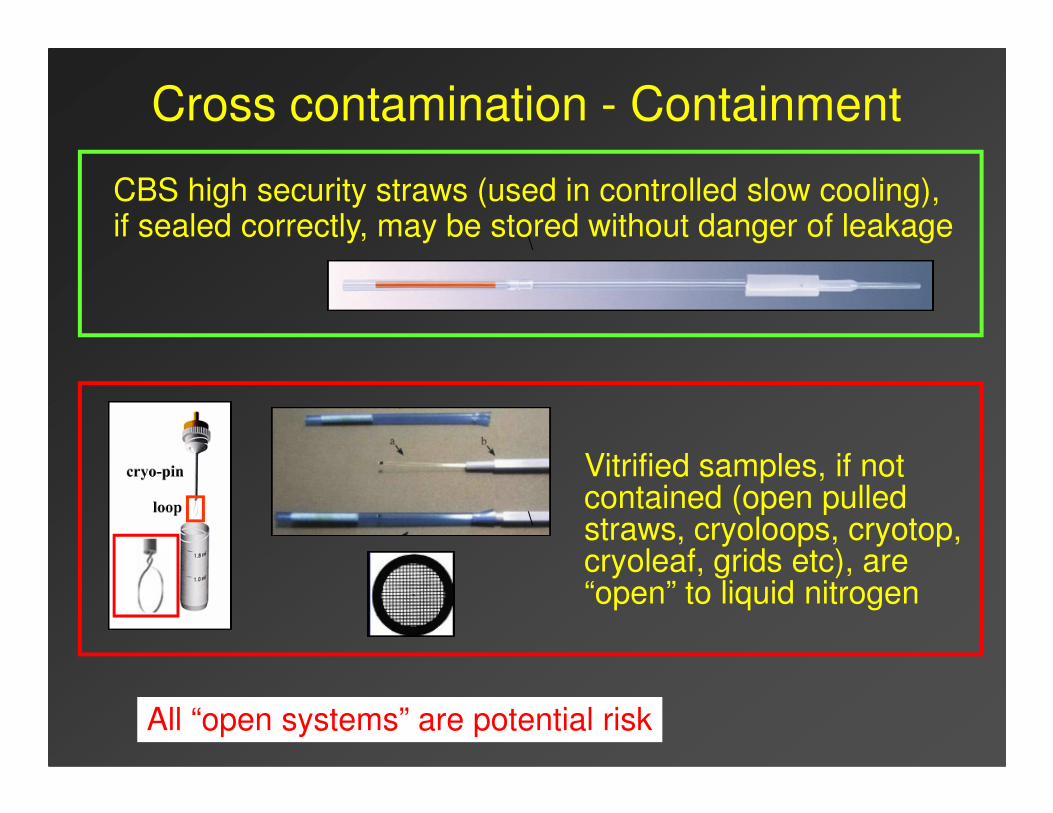
Cross contamination - Containment
CBS high security straws (used in controlled slow cooling), if sealed correctly, may be stored without danger of leakage
\
All “open systems” are potential risk
Vitrified samples, if not contained (open pulled straws, cryoloops, cryotop, cryoleaf, grids etc), are “open” to liquid nitrogen
\
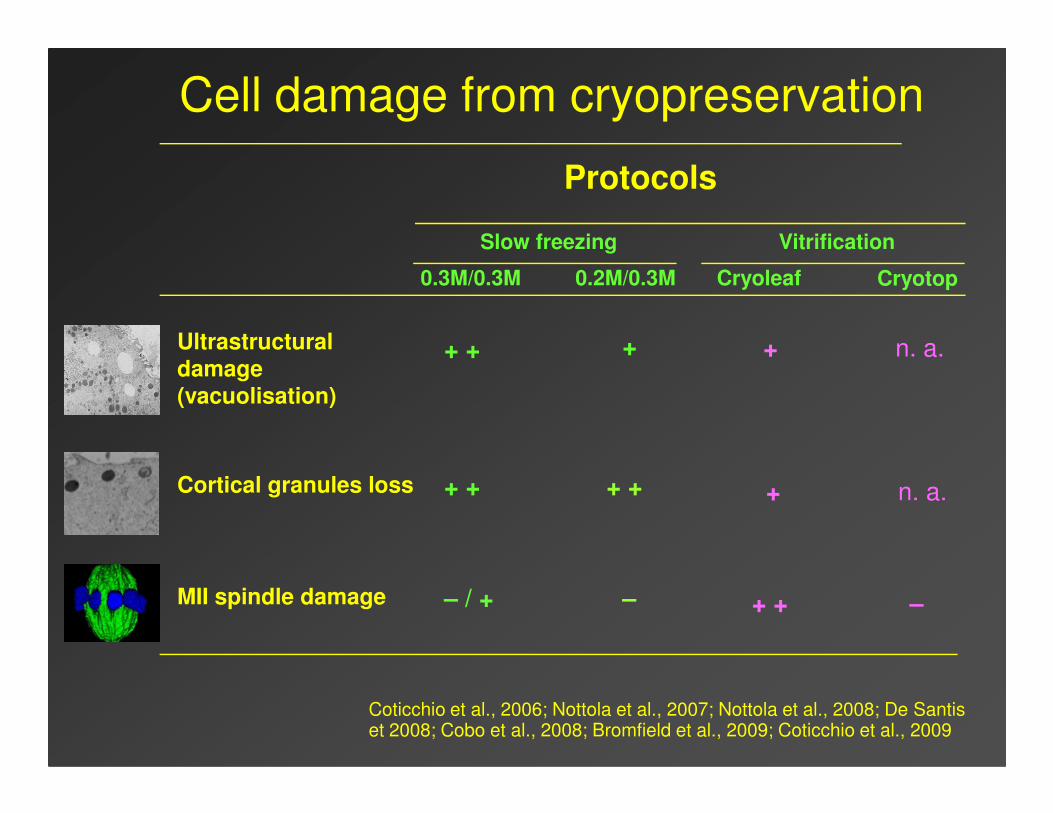
++ +Ultrastructural damage (vacuolisation)
0.2M/0.3M0.3M/0.3M
Protocols
+
Slow freezing
Cell damage from cryopreservation
CryotopCryoleaf
Vitrification
n. a.
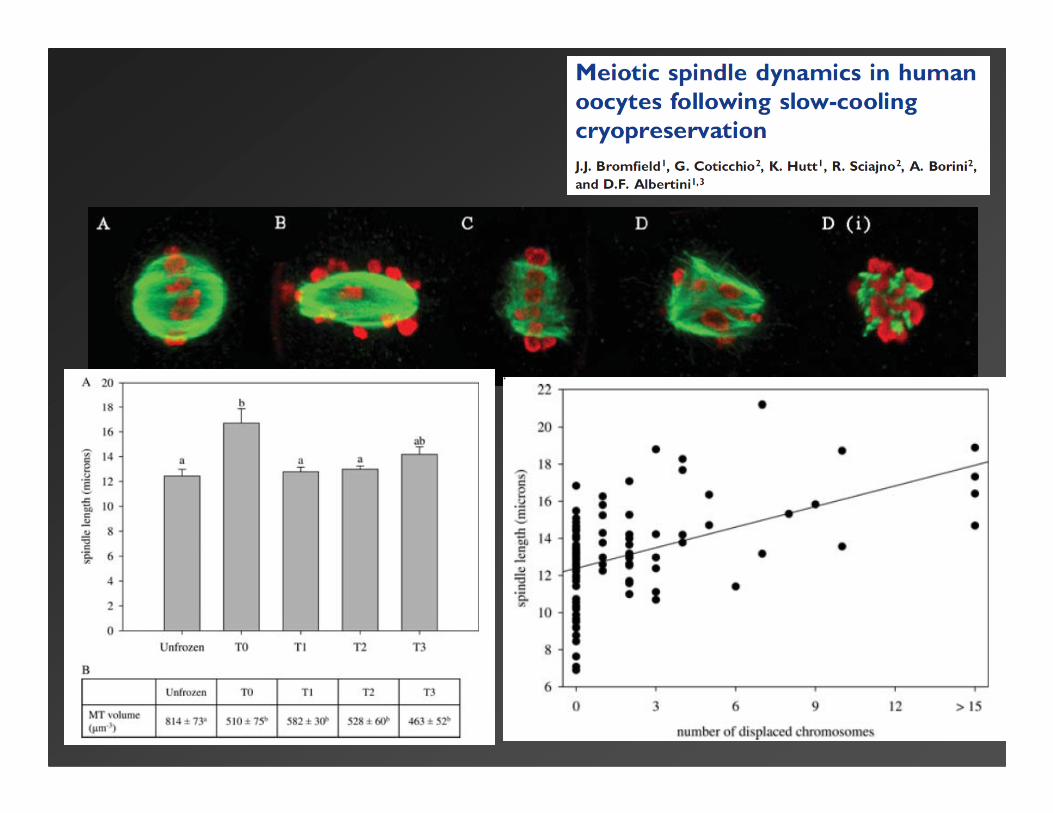
–– / +MII spindle damage
+ ++ +Cortical granules loss
(vacuolisation)
+ +
+
–
n. a.
Coticchio et al., 2006; Nottola et al., 2007; Nottola et al., 2008; De Santis et 2008; Cobo et al., 2008; Bromfield et al., 2009; Coticchio et al., 2009
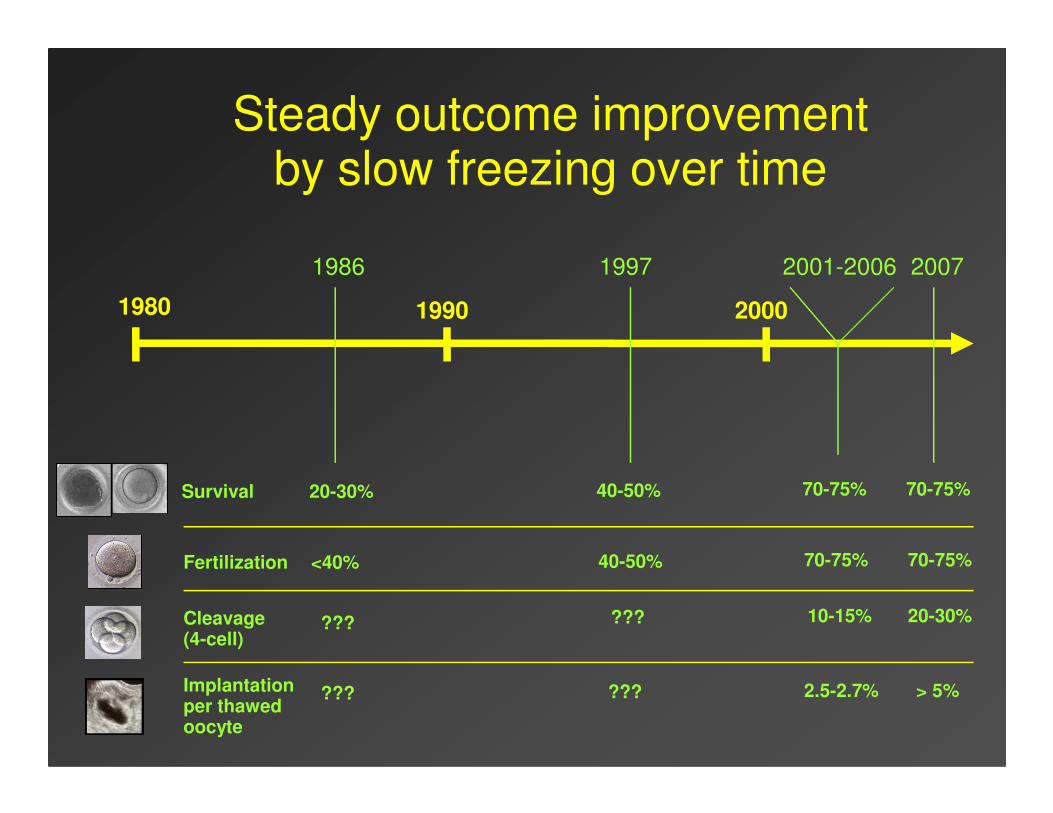
1980 1990 2000
200719971986
Steady outcome improvement by slow freezing over time
2001-2006
Survival 20-30% 40-50% 70-75% 70-75%
Fertilization <40% 40-50% 70-75% 70-75%
Cleavage (4-cell)
??? ??? 10-15% 20-30%
Implantationper thawed oocyte
??? ??? 2.5-2.7% > 5%
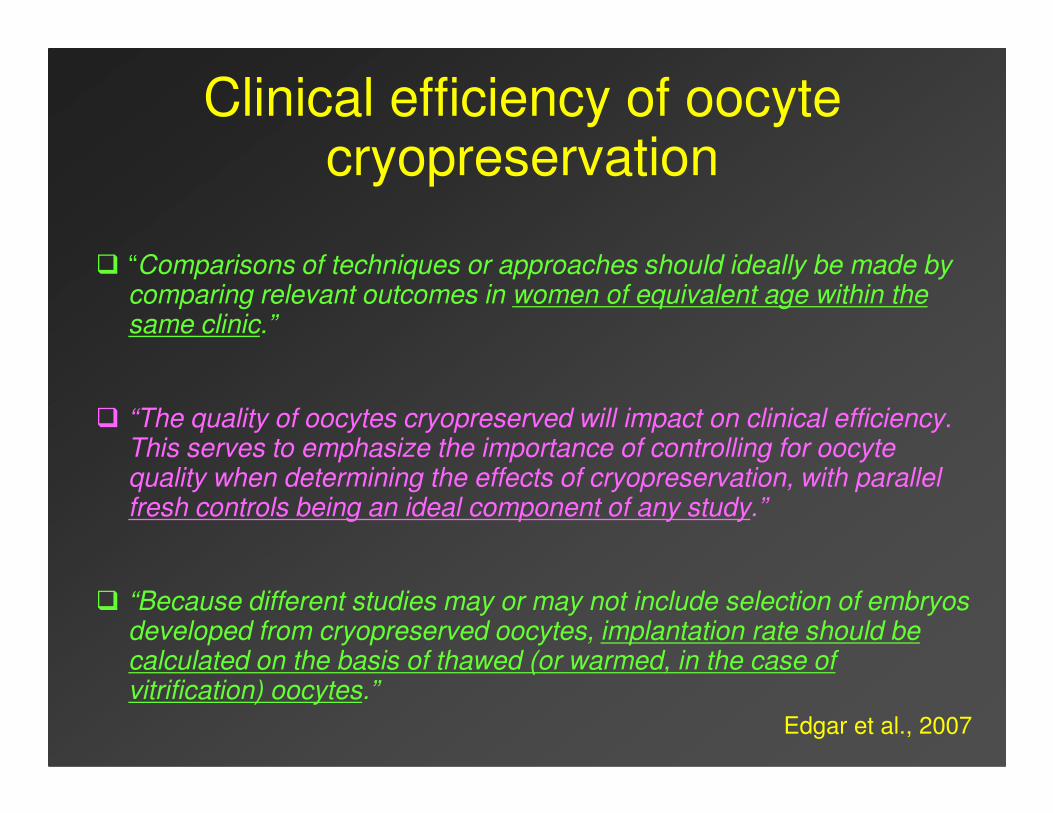
Clinical efficiency of oocyte cryopreservation
� “Comparisons of techniques or approaches should ideally be made by comparing relevant outcomes in women of equivalent age within the same clinic.”
� “The quality of oocytes cryopreserved will impact on clinical efficiency. � “The quality of oocytes cryopreserved will impact on clinical efficiency. This serves to emphasize the importance of controlling for oocyte quality when determining the effects of cryopreservation, with parallel fresh controls being an ideal component of any study.”
� “Because different studies may or may not include selection of embryos developed from cryopreserved oocytes, implantation rate should be calculated on the basis of thawed (or warmed, in the case of vitrification) oocytes.”
Edgar et al., 2007
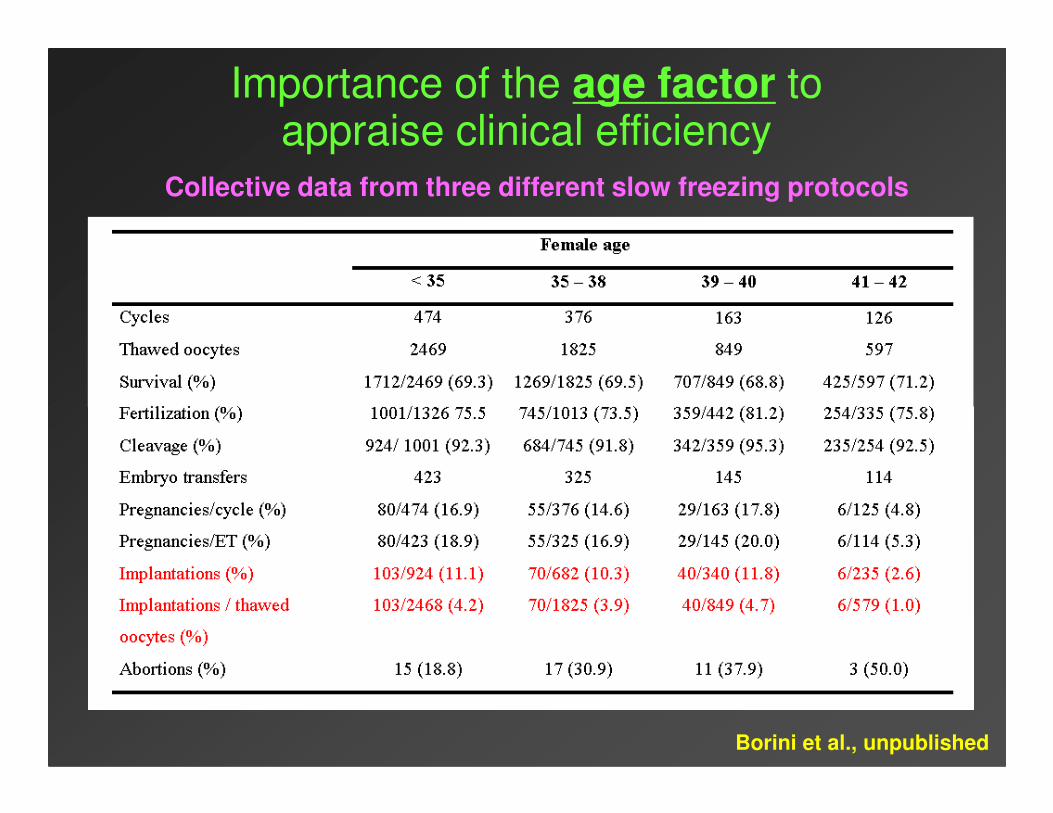
Importance of the age factor to appraise clinical efficiency
Collective data from three different slow freezing protocols
Borini et al., unpublished
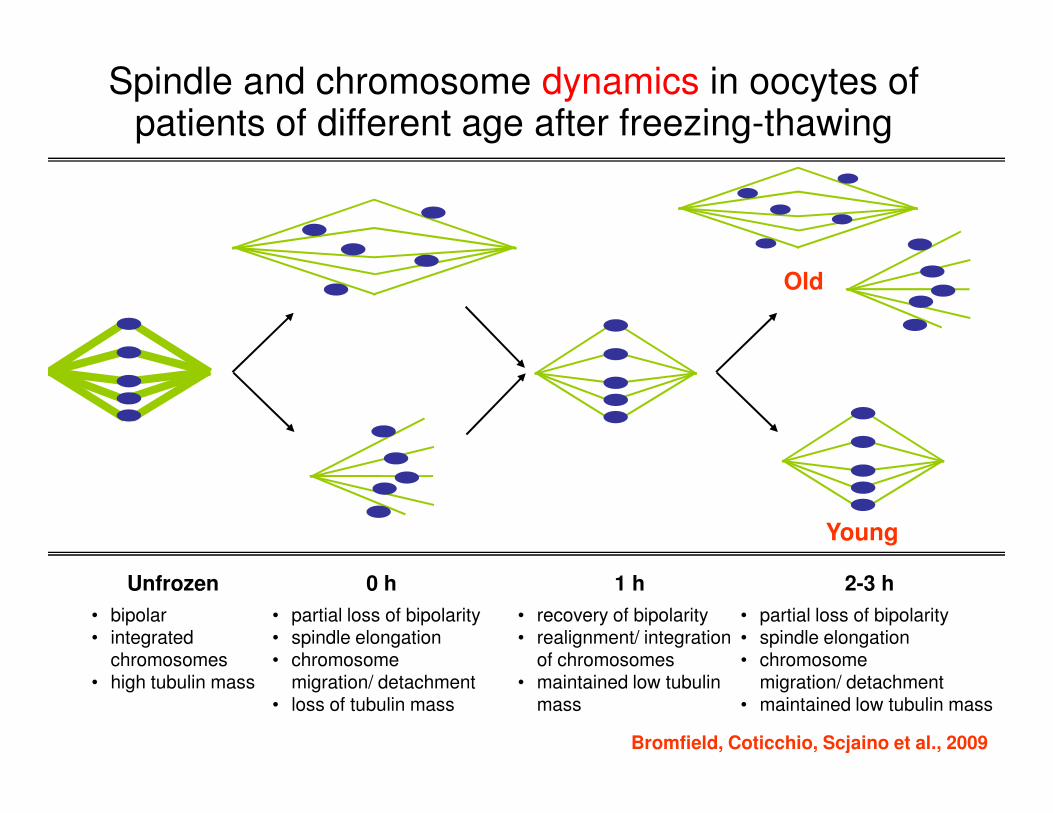
Spindle and chromosome dynamics in oocytes of patients of different age after freezing-thawing
Old
• bipolar• integrated
chromosomes• high tubulin mass
• partial loss of bipolarity • spindle elongation• chromosome
migration/ detachment• loss of tubulin mass
• recovery of bipolarity• realignment/ integration
of chromosomes• maintained low tubulin
mass
• partial loss of bipolarity • spindle elongation• chromosome
migration/ detachment• maintained low tubulin mass
Unfrozen 0 h 1 h 2-3 h
Bromfield, Coticchio, Scjaino et al., 2009
Young
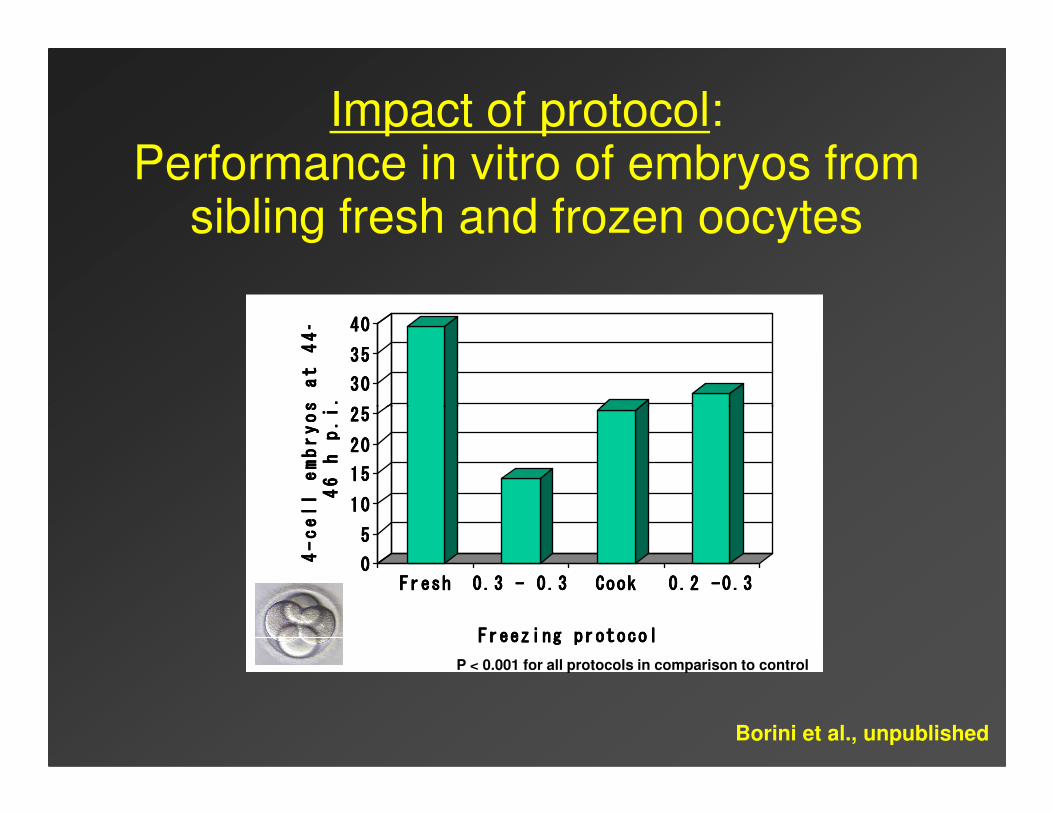
Impact of protocol: Performance in vitro of embryos from
sibling fresh and frozen oocytes
25252525
30303030
35353535
40404040
4-cell embryos at 44-
4-cell embryos at 44-
4-cell embryos at 44-
4-cell embryos at 44-
46 h p.i.
46 h p.i.
46 h p.i.
46 h p.i.
0000
5555
10101010
15151515
20202020
25252525
4-cell embryos at 44-
4-cell embryos at 44-
4-cell embryos at 44-
4-cell embryos at 44-
46 h p.i.
46 h p.i.
46 h p.i.
46 h p.i.
FreshFreshFreshFresh 0.3 - 0.3 0.3 - 0.3 0.3 - 0.3 0.3 - 0.3 CookCookCookCook 0.2 -0.30.2 -0.30.2 -0.30.2 -0.3
Freezing protocolFreezing protocolFreezing protocolFreezing protocol
P < 0.001 for all protocols in comparison to control
Borini et al., unpublished
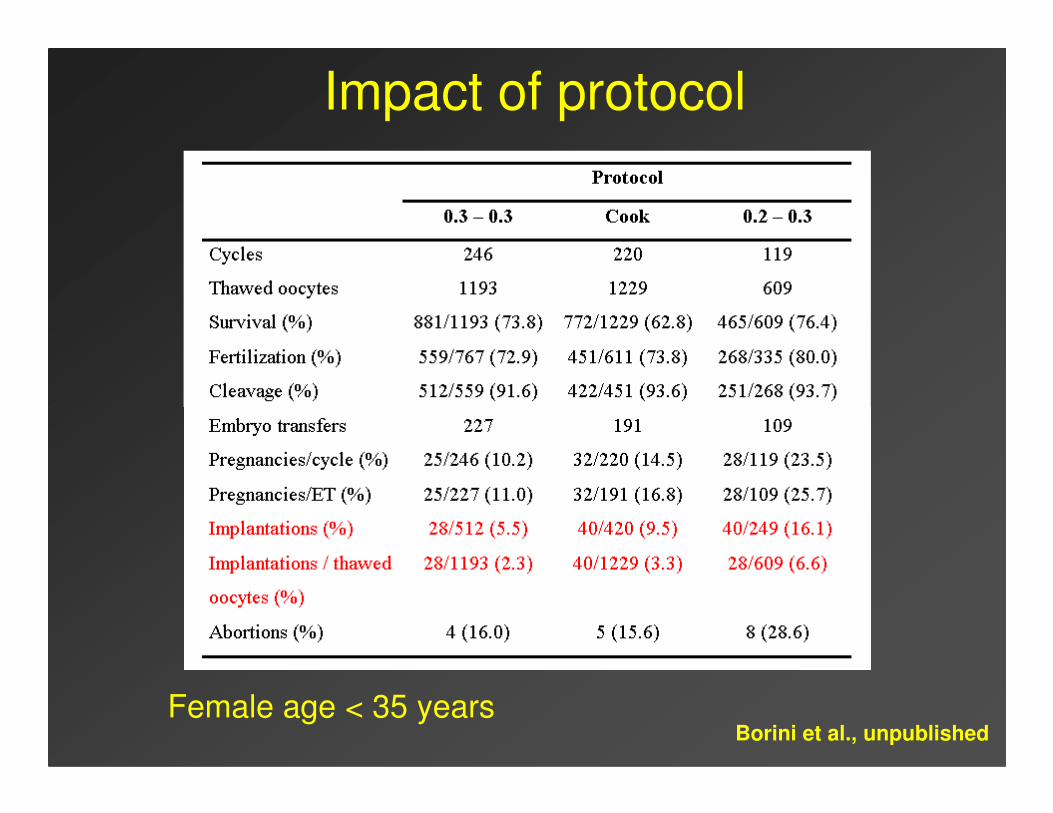
Impact of protocol
Female age < 35 yearsBorini et al., unpublished
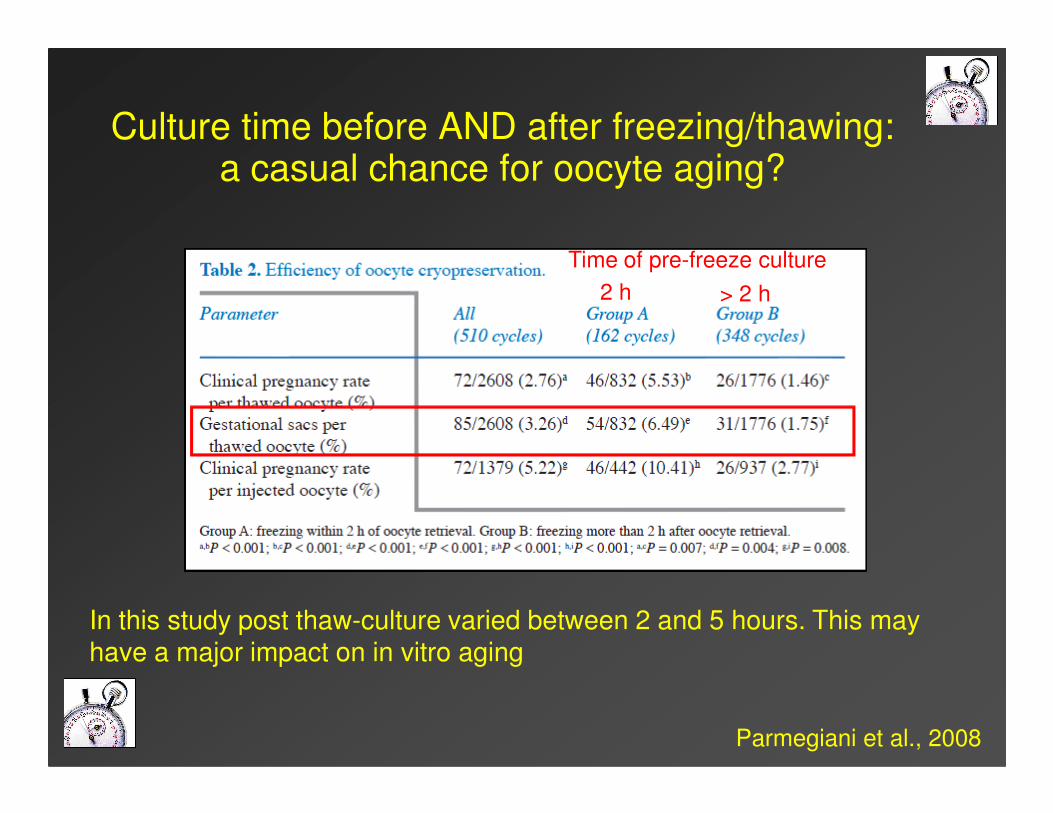
2 h > 2 h
Time of pre-freeze culture
Culture time before AND after freezing/thawing: a casual chance for oocyte aging?
Parmegiani et al., 2008
In this study post thaw-culture varied between 2 and 5 hours. This may have a major impact on in vitro aging
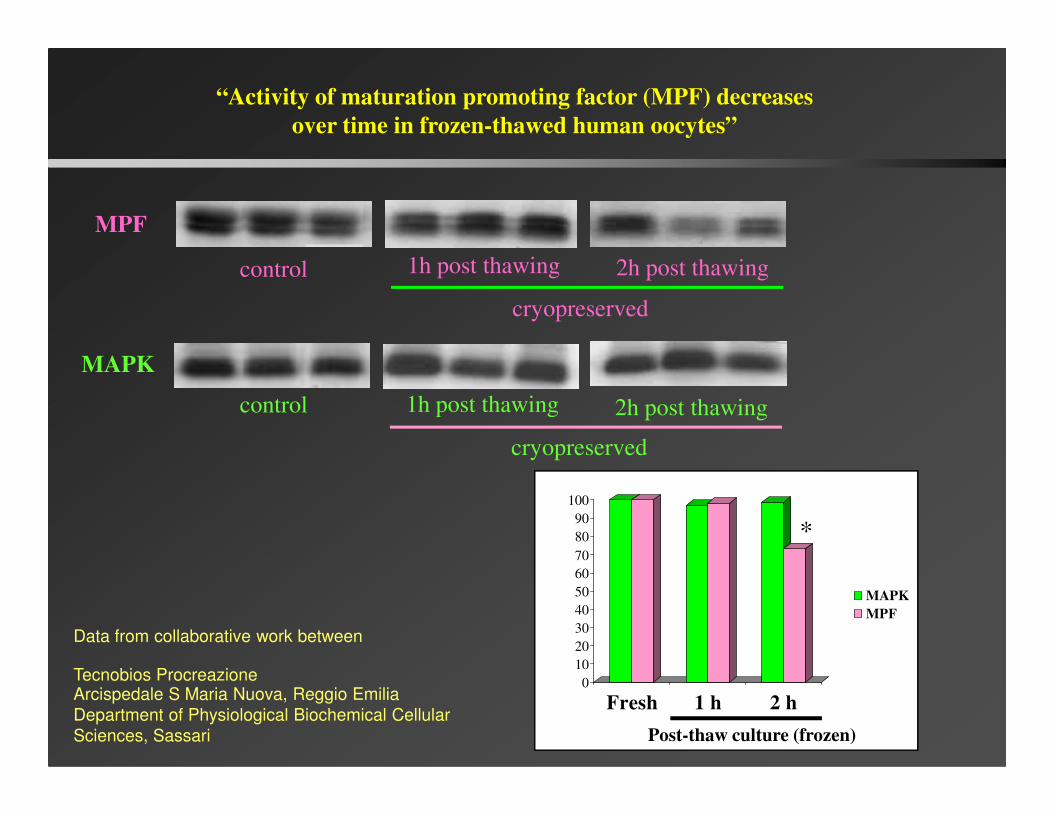
MPF
MAPK
control
control
1h post thawing 2h post thawing
cryopreserved
1h post thawing 2h post thawing
“Activity of maturation promoting factor (MPF) decreases
over time in frozen-thawed human oocytes”
control 1h post thawing 2h post thawing
cryopreserved
0
10
20
30
40
50
60
70
80
90
100
Fresh 1 h 2 h
MAPK
MPF
*
Post-thaw culture (frozen)
Data from collaborative work between
Tecnobios ProcreazioneArcispedale S Maria Nuova, Reggio Emilia
Department of Physiological Biochemical Cellular
Sciences, Sassari
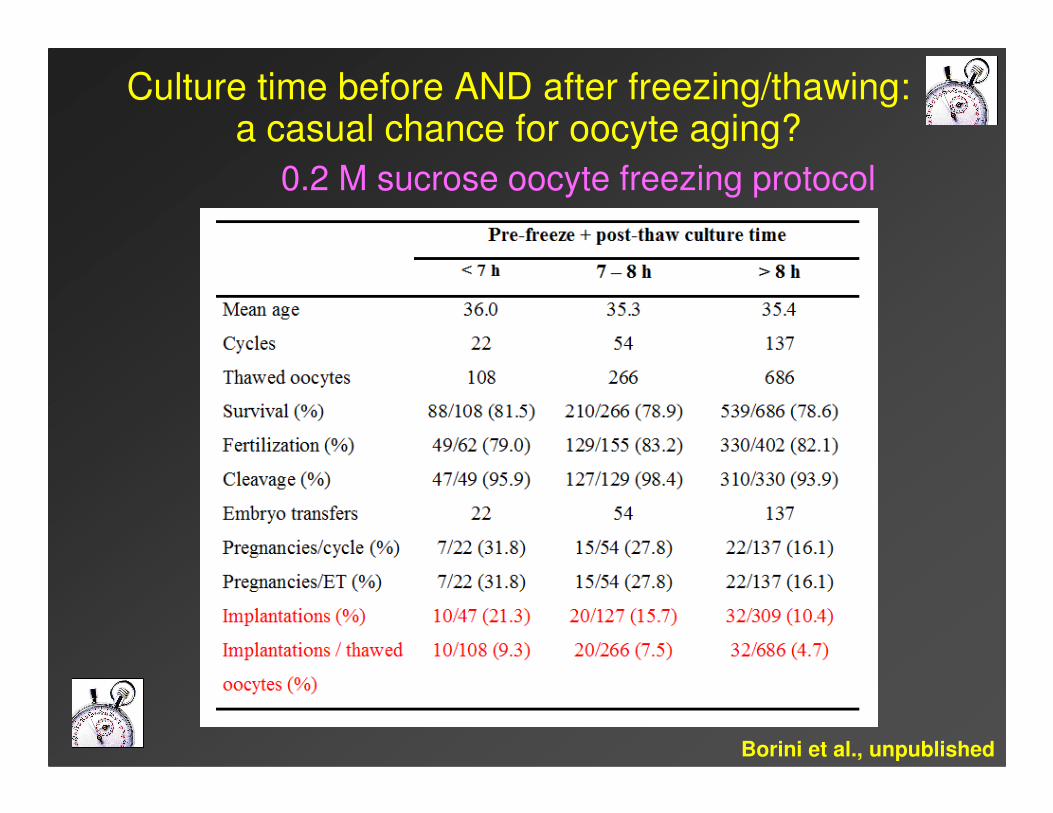
Culture time before AND after freezing/thawing: a casual chance for oocyte aging?
0.2 M sucrose oocyte freezing protocol
Borini et al., unpublished
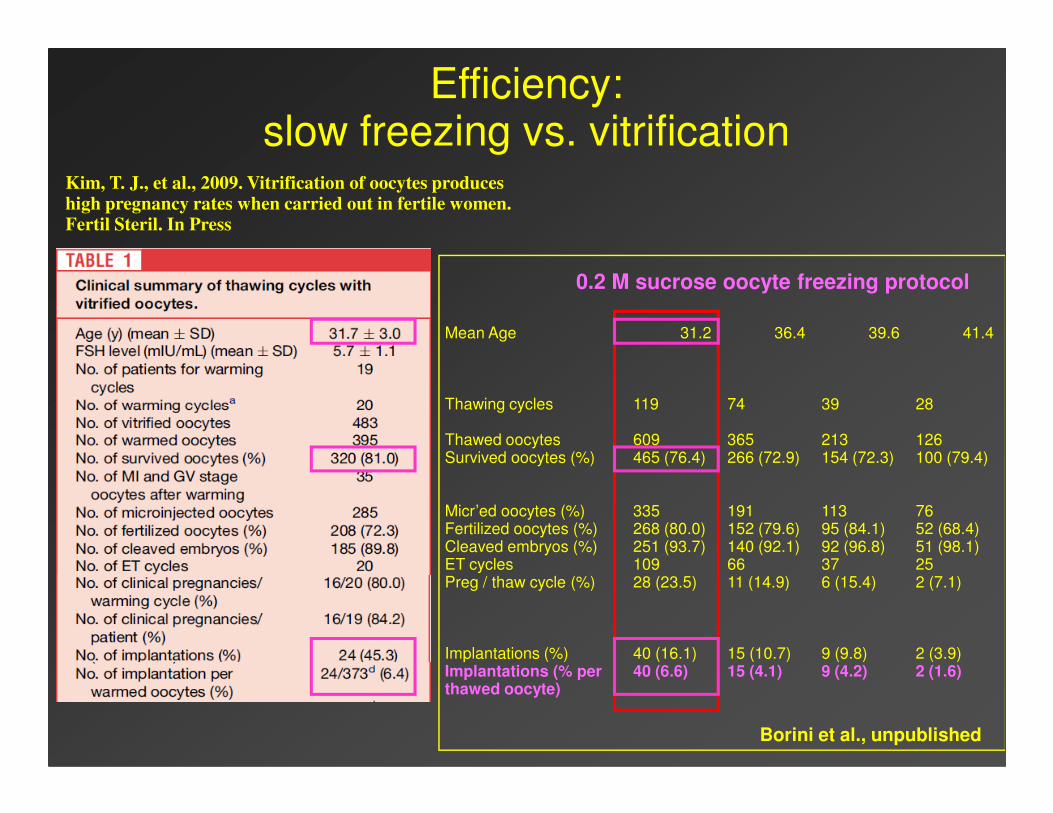
Kim, T. J., et al., 2009. Vitrification of oocytes produces high pregnancy rates when carried out in fertile women. Fertil Steril. In Press
Mean Age 31.2 36.4 39.6 41.4
Thawing cycles 119 74 39 28
0.2 M sucrose oocyte freezing protocol
Efficiency: slow freezing vs. vitrification
Thawing cycles 119 74 39 28
Thawed oocytes 609 365 213 126Survived oocytes (%) 465 (76.4) 266 (72.9) 154 (72.3) 100 (79.4)
Micr’ed oocytes (%) 335 191 113 76Fertilized oocytes (%) 268 (80.0) 152 (79.6) 95 (84.1) 52 (68.4)Cleaved embryos (%) 251 (93.7) 140 (92.1) 92 (96.8) 51 (98.1)ET cycles 109 66 37 25Preg / thaw cycle (%) 28 (23.5) 11 (14.9) 6 (15.4) 2 (7.1)
Implantations (%) 40 (16.1) 15 (10.7) 9 (9.8) 2 (3.9)Implantations (% per 40 (6.6) 15 (4.1) 9 (4.2) 2 (1.6)thawed oocyte)
Borini et al., unpublished
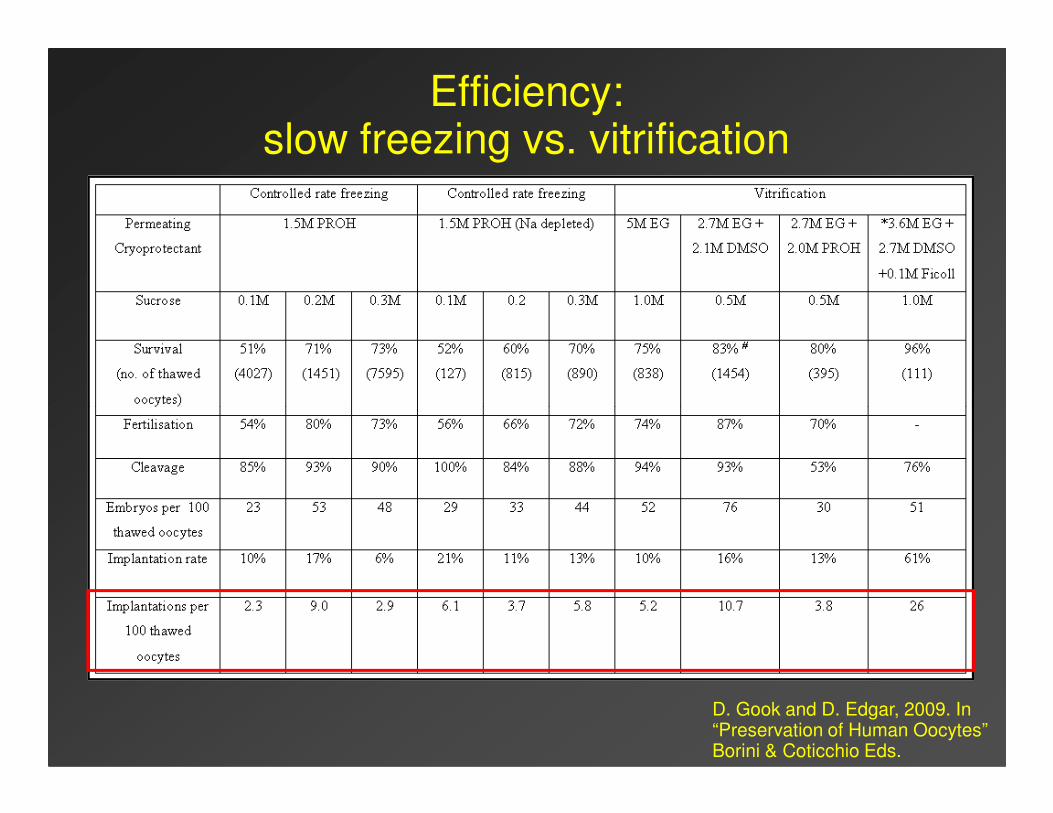
Efficiency: slow freezing vs. vitrification
D. Gook and D. Edgar, 2009. In“Preservation of Human Oocytes”Borini & Coticchio Eds.
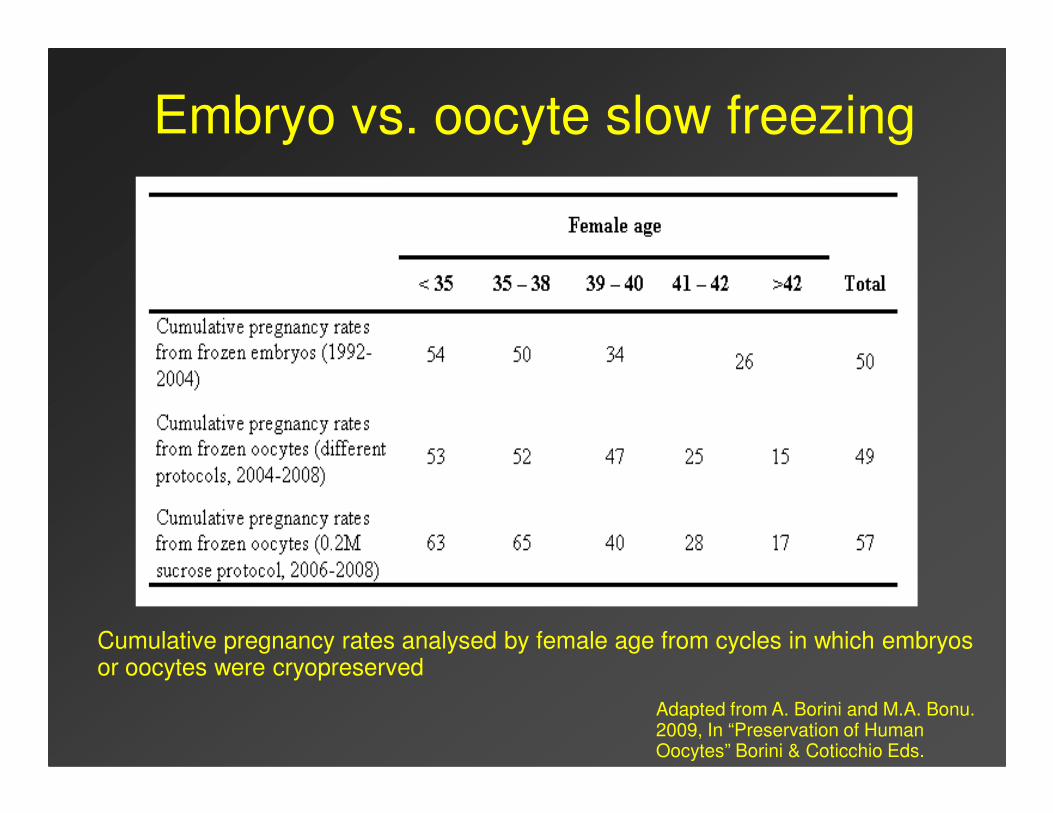
Embryo vs. oocyte slow freezing
Cumulative pregnancy rates analysed by female age from cycles in which embryos or oocytes were cryopreserved
Adapted from A. Borini and M.A. Bonu. 2009, In “Preservation of Human Oocytes” Borini & Coticchio Eds.
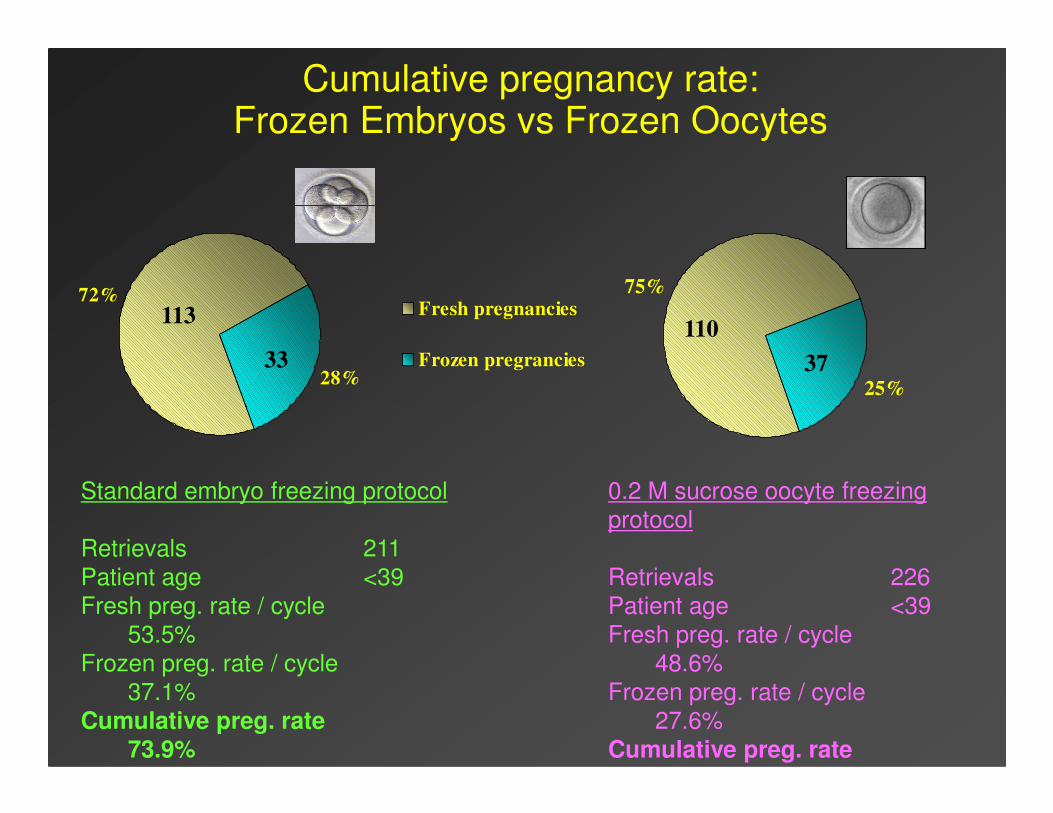
Cumulative pregnancy rate:Frozen Embryos vs Frozen Oocytes
72%
28%
Fresh pregnancies
Frozen pregrancies
75%
25%
113
33 37
110
Standard embryo freezing protocol
Retrievals 211
Patient age <39
Fresh preg. rate / cycle
53.5%
Frozen preg. rate / cycle
37.1%
Cumulative preg. rate73.9%
0.2 M sucrose oocyte freezing
protocol
Retrievals 226
Patient age <39
Fresh preg. rate / cycle
48.6%
Frozen preg. rate / cycle
27.6%
Cumulative preg. rate65.0%
Conclusions: Controlled rate slow freezing of oocytes
� “Application of fundamental cryobiological principles is leading to agradual but consistent improvement in outcomes, and promisesfurther advances if the scientific focus is maintained (Fuller,2009)”
� Highly reliable, highly reproducible, more quality assurancefriendlyfriendly
� No risk of contamination during storage in liquid nitrogen
� Efficiency (implantations per used oocytes) comparable to the one of frozen embryos
� The contest still open:
�The best slow freezing and vitrification results are similar
�No large/rigorous prospective trials have been conducted so far
� No increase in congenital abnormalities after the birth ofapproximately 600 babies

](https://img.pdfslide.net/doc/110x75/5ed7600ea5b1445fe467ceb5/ovarian-tissue-cryopreservation-and-transplantation-cases-due-to-a-reduced-ovarian.jpg)