Embed Size (px)
Citation preview
Cryospheric and Hydrologic ContributionsCryospheric and Hydrologic Contributionsto Global Sea Level Changeto Global Sea Level Change
M. TamisieaProudman Oceanographic Laboratory
R. Steven NeremUniversity of Colorado
AGU Meeting of the Americas, August 8-11, 2010
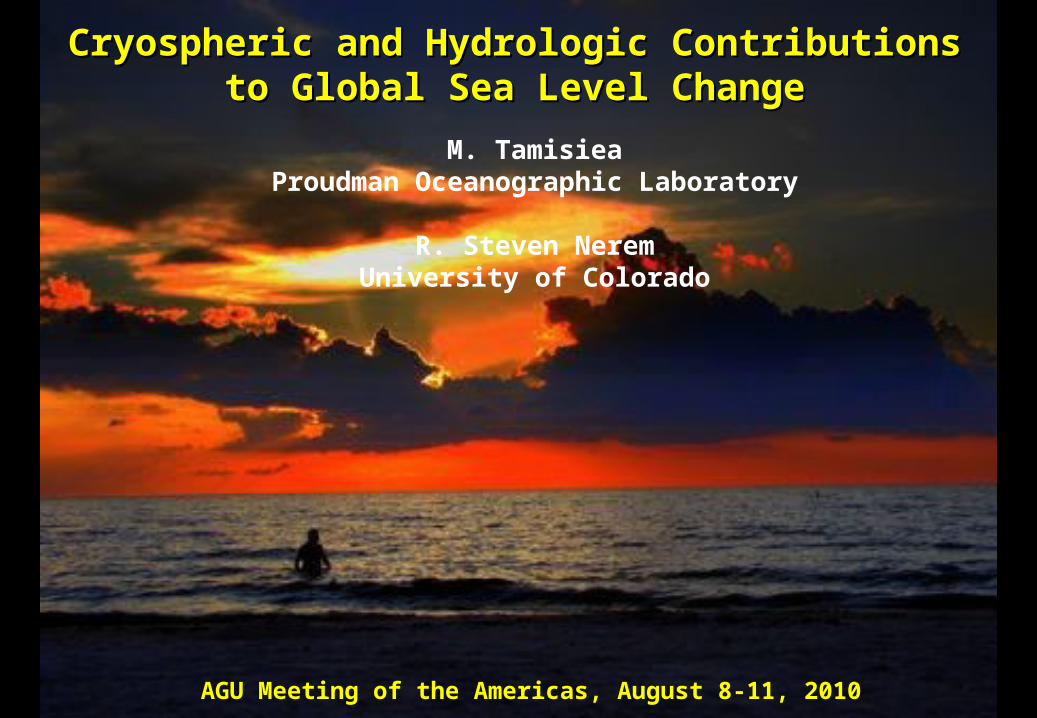
GRAVITY
Measurements of Sea Level ChangeMeasurements of Sea Level Change
0
10
20
30
40
50
60
1994 1996 1998 2000 2002 2004 2006 2008 2010
10
20
0
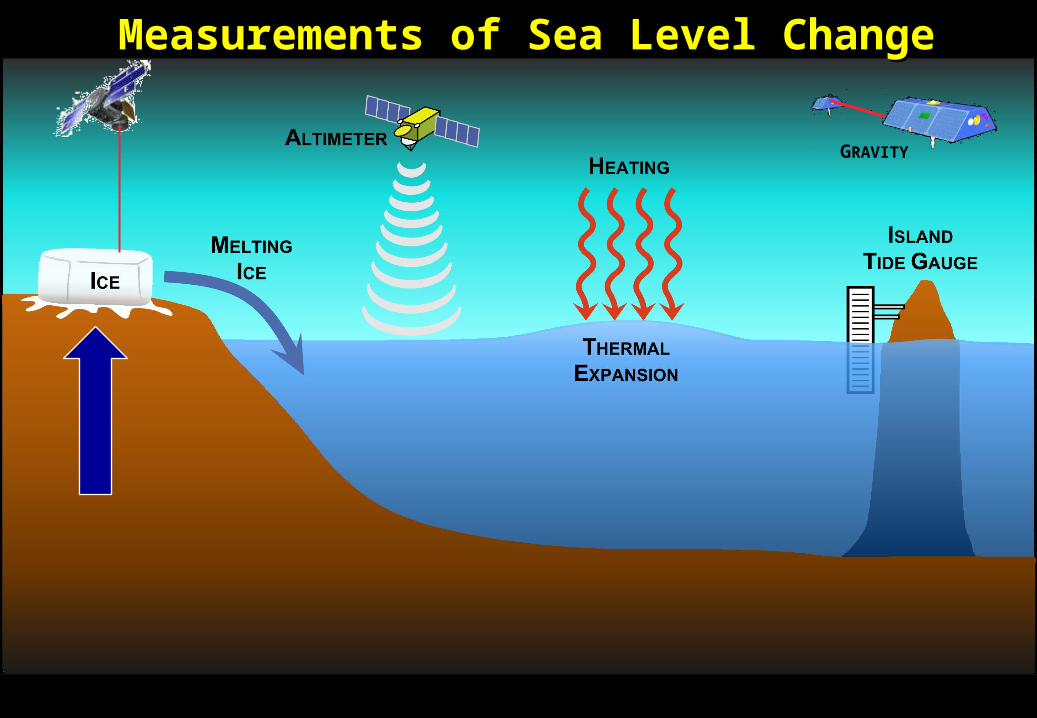
TOPEX/Poseidon
Jason-1 & 2
Trend = 3.3 mm/year
Global Mean Sea LevelGlobal Mean Sea Level
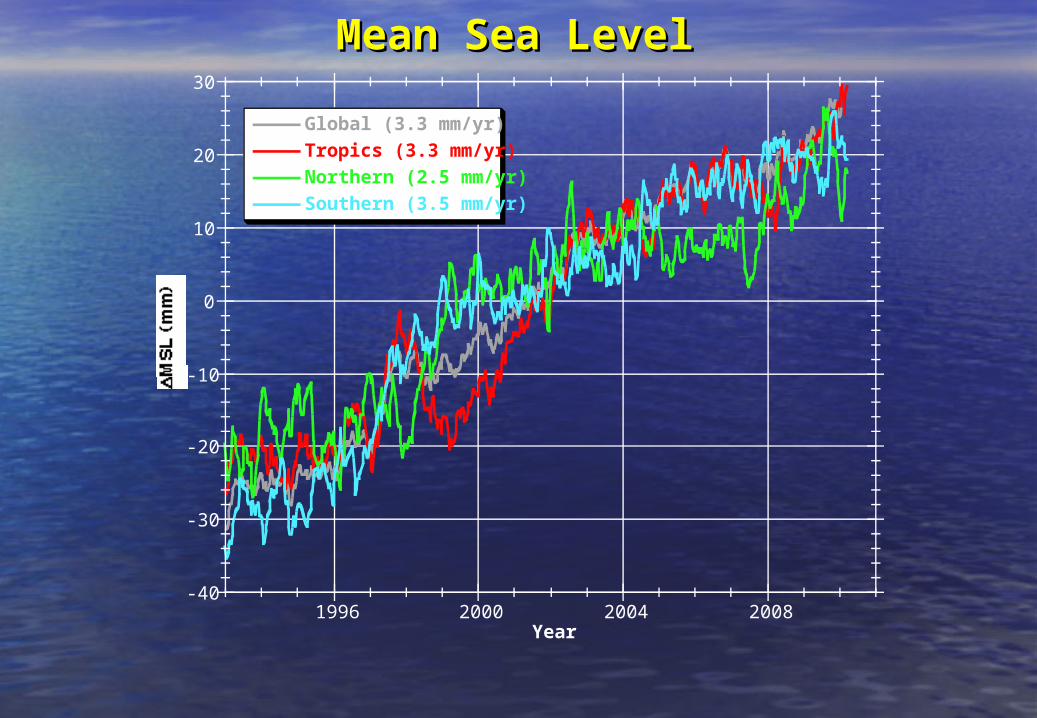
Mean Sea LevelMean Sea Level
-40
-30
-20
-10
0
10
20
30
1996 2000 2004 2008
Global (3.3 mm/yr)
Tropics (3.3 mm/yr)
Northern (2.5 mm/yr)
Southern (3.5 mm/yr)
Year
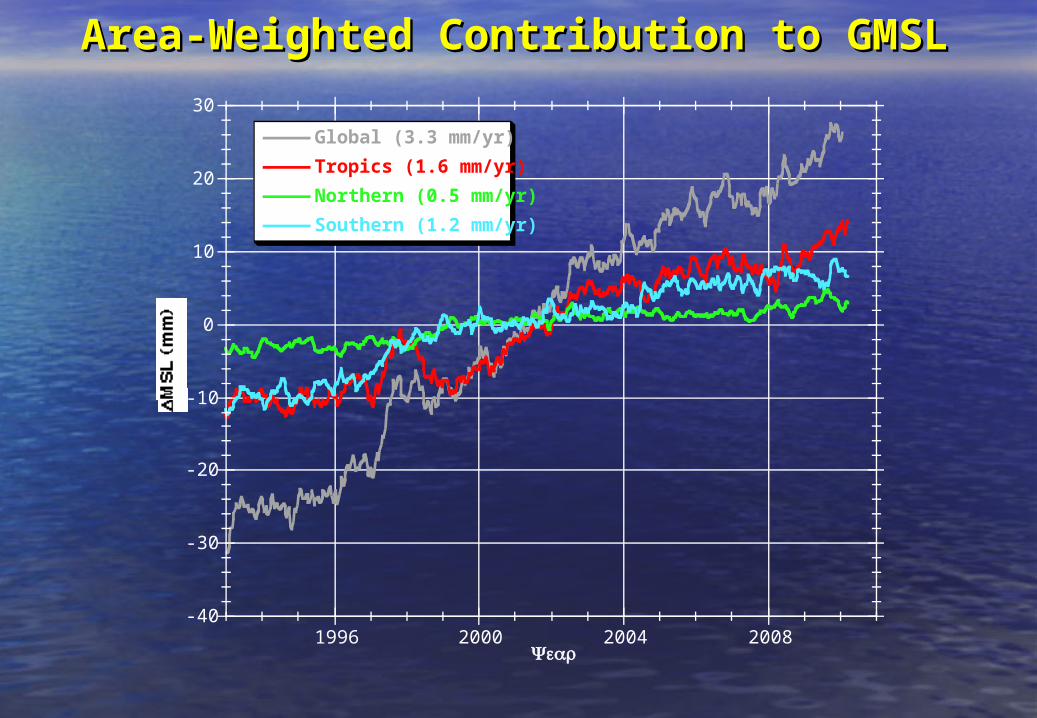
Area-Weighted Contribution to GMSLArea-Weighted Contribution to GMSL
-40
-30
-20
-10
0
10
20
30
1996 2000 2004 2008
Global (3.3 mm/yr)
Tropics (1.6 mm/yr)
Northern (0.5 mm/yr)
Southern (1.2 mm/yr)
Year
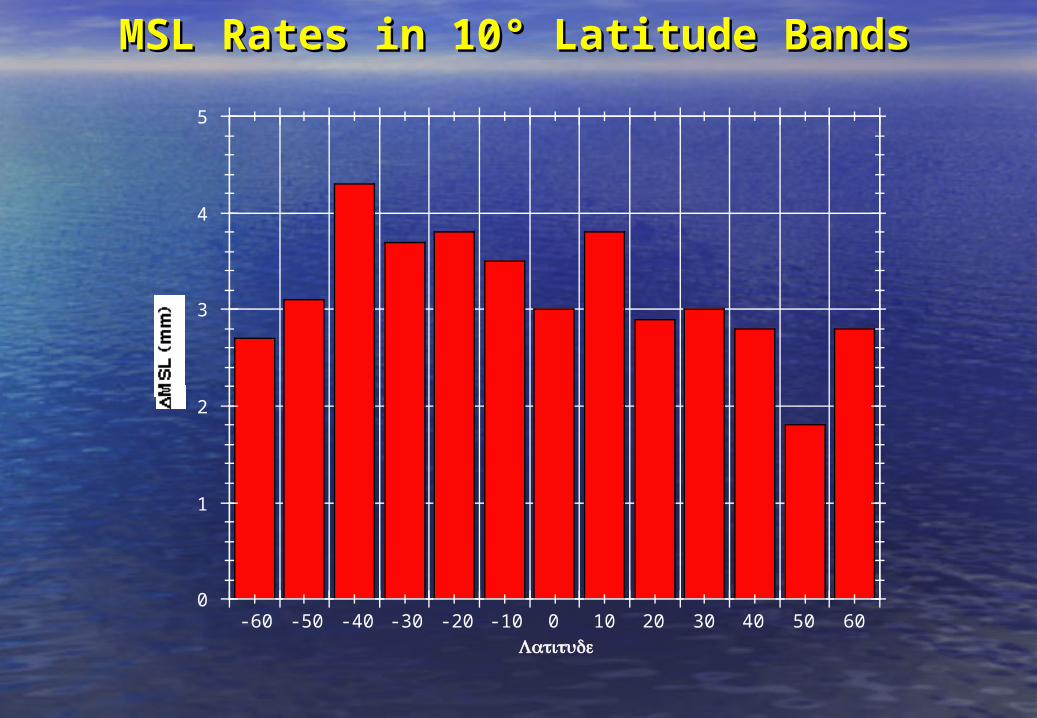
MSL Rates in 10° Latitude BandsMSL Rates in 10° Latitude Bands
0
1
2
3
4
5
-60 -50 -40 -30 -20 -10 0 10 20 30 40 50 60Latitude
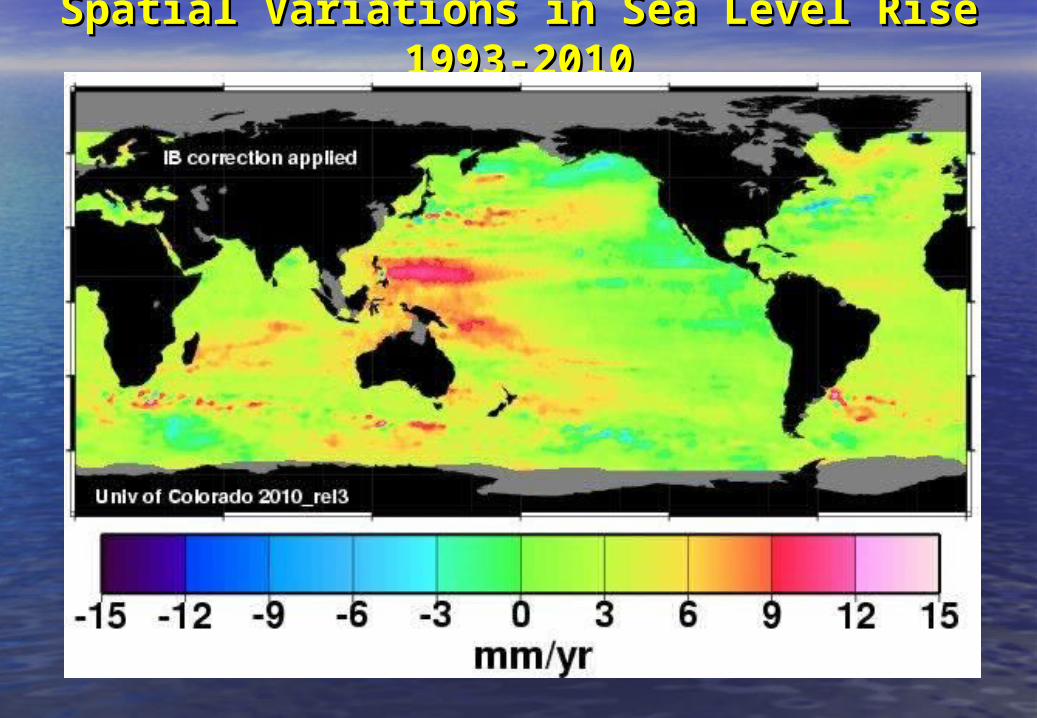
Spatial Variations in Sea Level Rise 1993-Spatial Variations in Sea Level Rise 1993-20102010
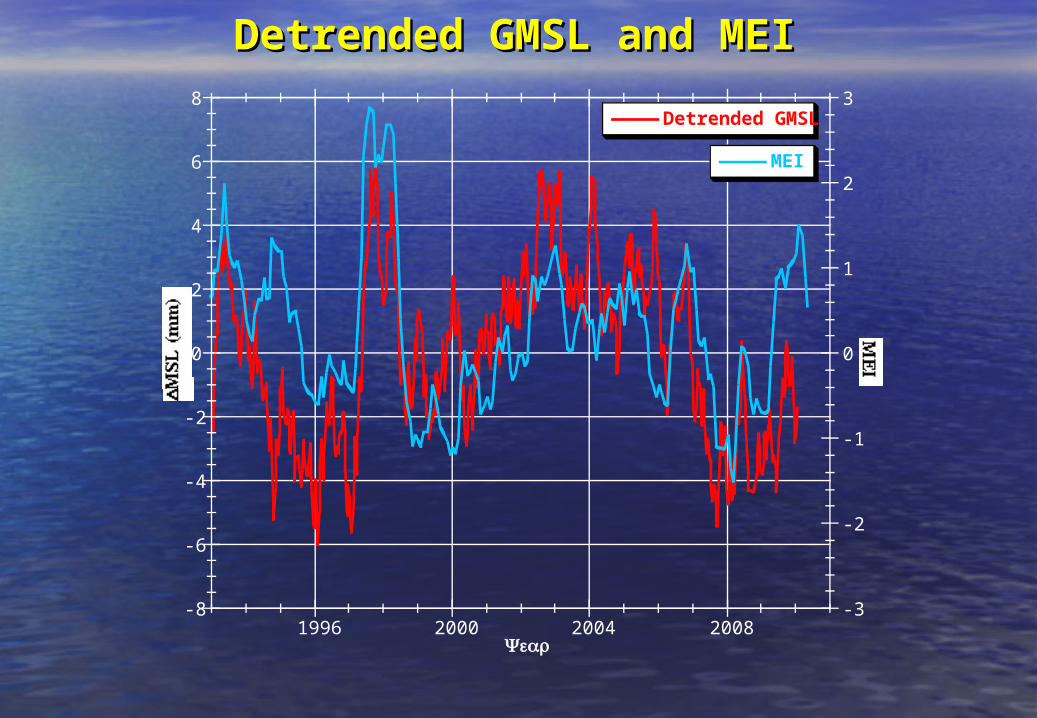
Detrended GMSL and MEIDetrended GMSL and MEI
-8
-6
-4
-2
0
2
4
6
8
-3
-2
-1
0
1
2
3
1996 2000 2004 2008
Detrended GMSL
MEI
Year
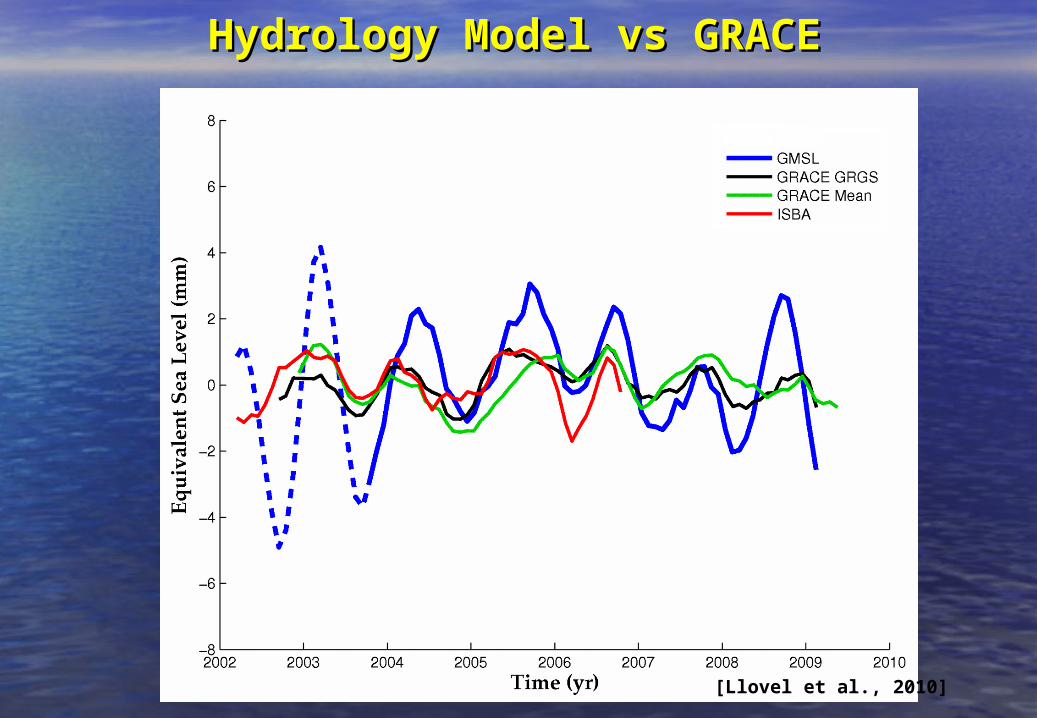
Hydrology Model vs GRACEHydrology Model vs GRACE
[Llovel et al., 2010]
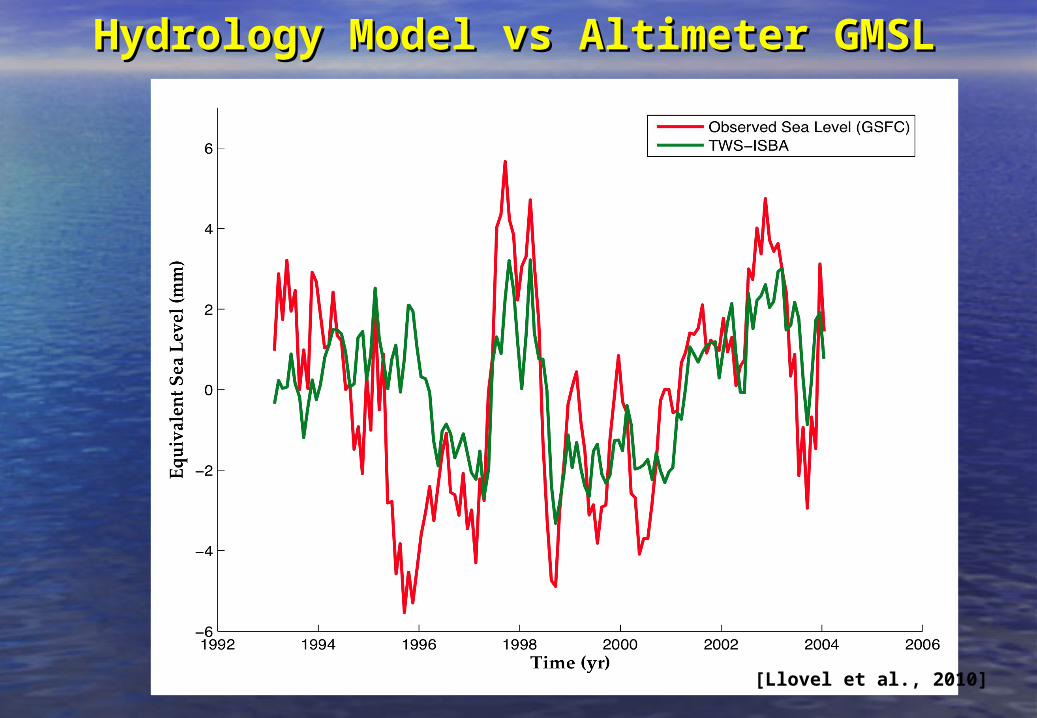
Hydrology Model vs Altimeter GMSLHydrology Model vs Altimeter GMSL
[Llovel et al., 2010]
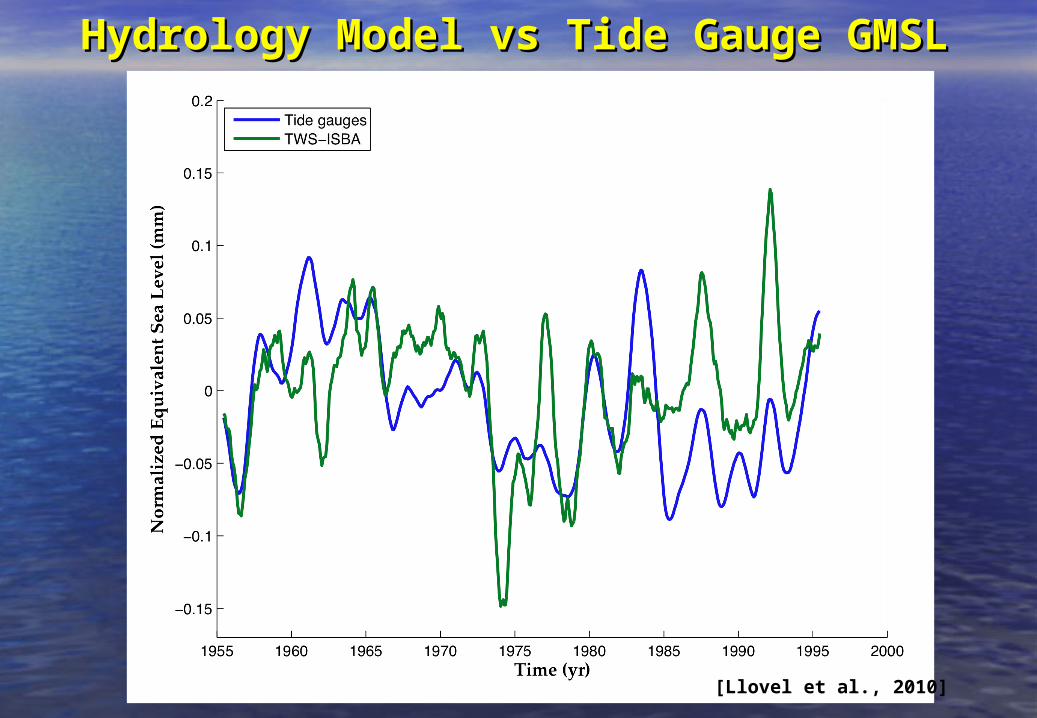
Hydrology Model vs Tide Gauge GMSLHydrology Model vs Tide Gauge GMSL
[Llovel et al., 2010]
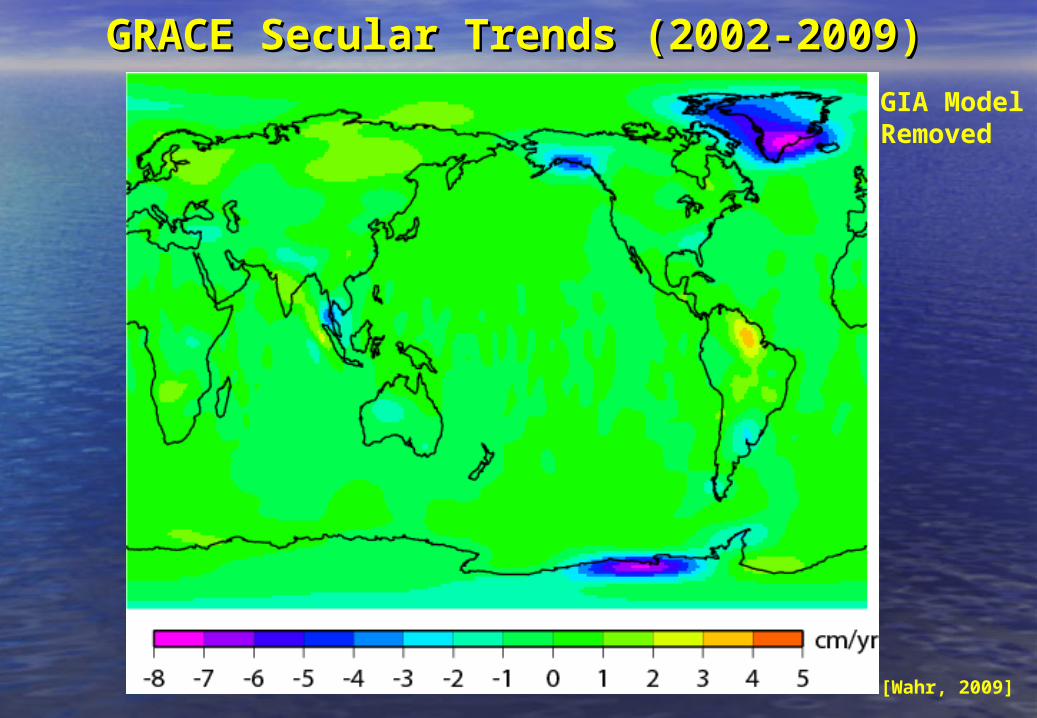
GRACE Secular Trends (2002-2009)GRACE Secular Trends (2002-2009)
[Wahr, 2009]
GIA ModelRemoved
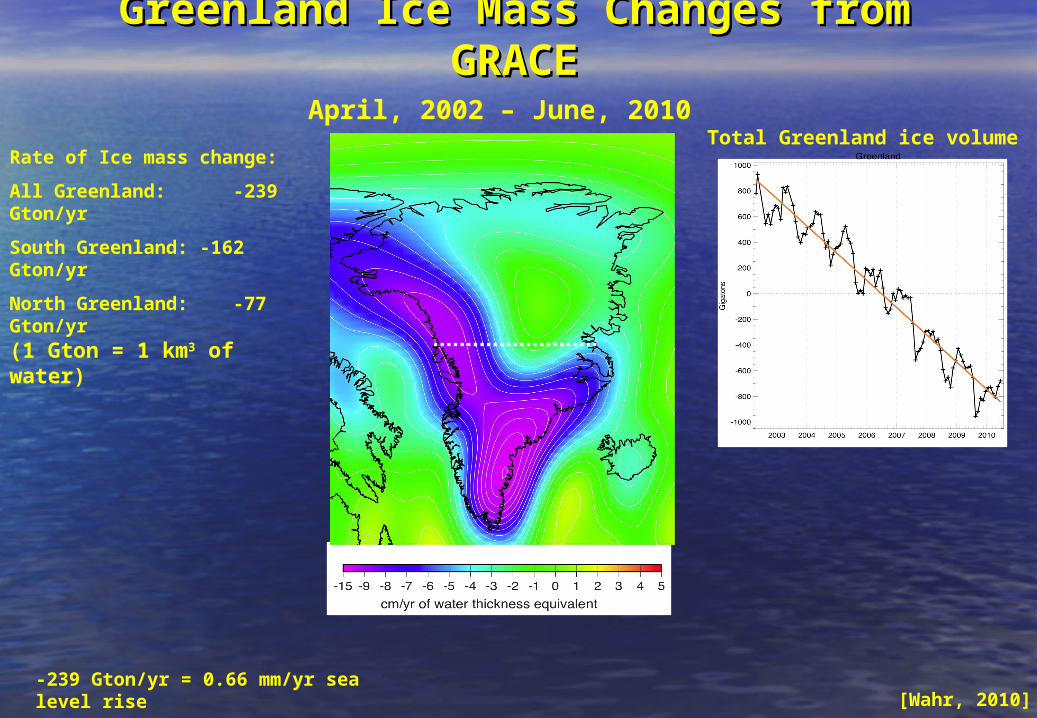
Rate of Ice mass change:
All Greenland: -239 Gton/yr
South Greenland: -162 Gton/yr
North Greenland: -77 Gton/yr
Total Greenland ice volumeApril, 2002 – June, 2010
-239 Gton/yr = 0.66 mm/yr sea level rise
(1 Gton = 1 km3 of water)
Greenland Ice Mass Changes from Greenland Ice Mass Changes from GRACEGRACE
[Wahr, 2010]
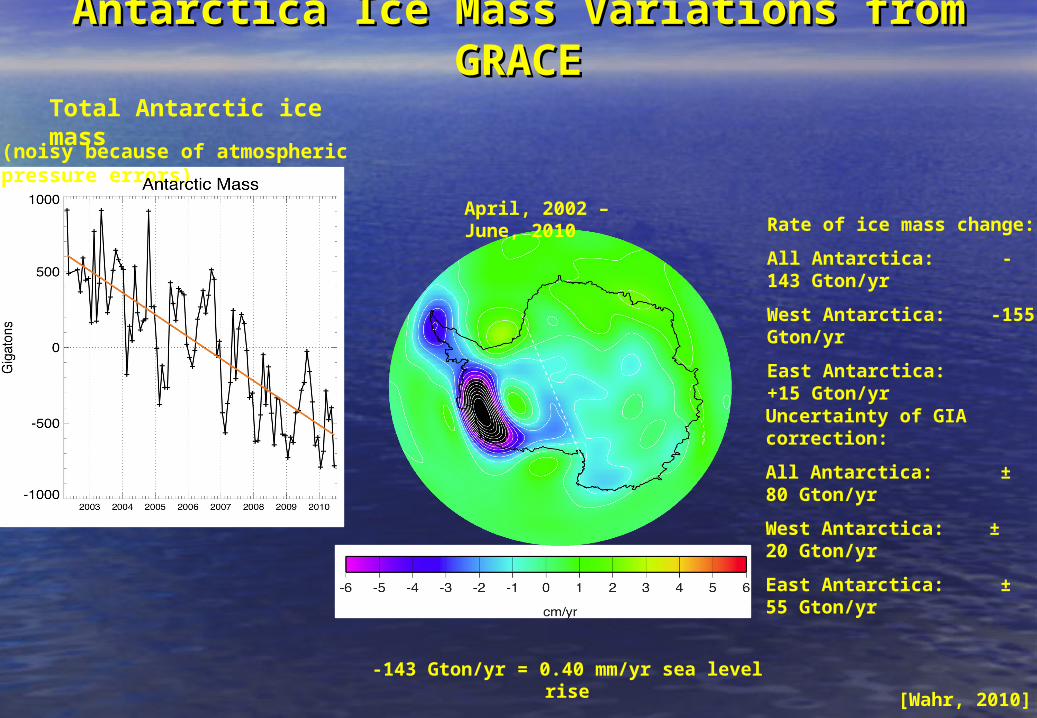
Rate of ice mass change:
All Antarctica: -143 Gton/yr
West Antarctica: -155 Gton/yr
East Antarctica: +15 Gton/yr
Uncertainty of GIA correction:
All Antarctica: ± 80 Gton/yr
West Antarctica: ± 20 Gton/yr
East Antarctica: ± 55 Gton/yr
-143 Gton/yr = 0.40 mm/yr sea level rise
Total Antarctic ice mass
April, 2002 – June, 2010
(noisy because of atmospheric pressure errors)
Antarctica Ice Mass Variations from Antarctica Ice Mass Variations from GRACEGRACE
[Wahr, 2010]
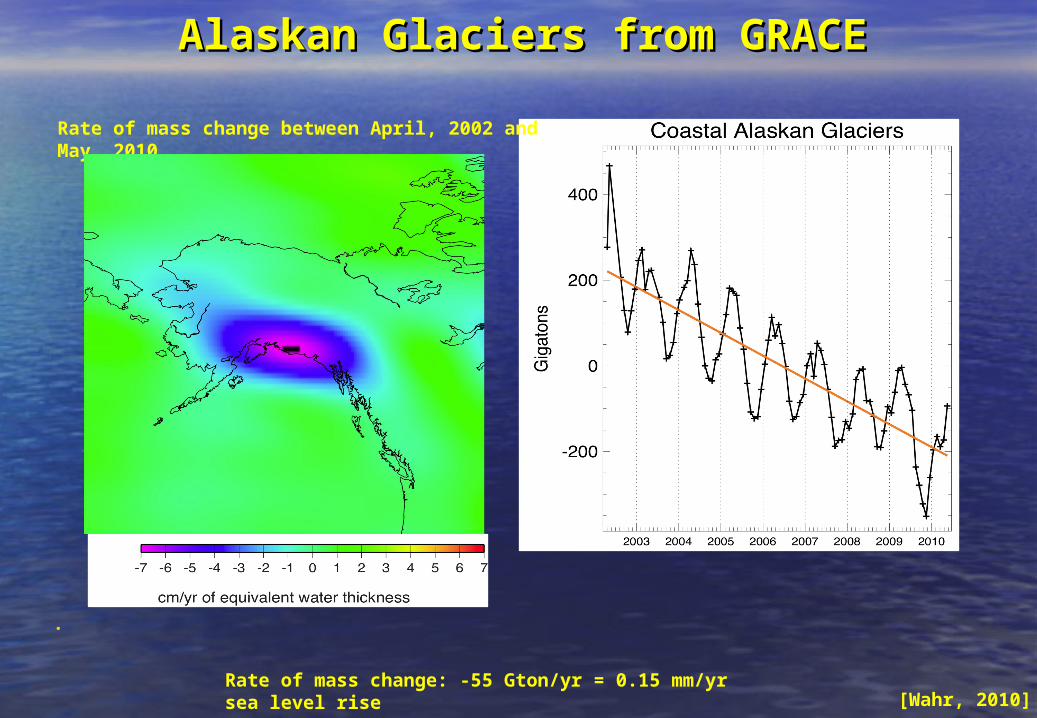
Rate of mass change between April, 2002 and May, 2010
Rate of mass change: -55 Gton/yr = 0.15 mm/yr sea level rise
.
Alaskan Glaciers from GRACEAlaskan Glaciers from GRACE
[Wahr, 2010]
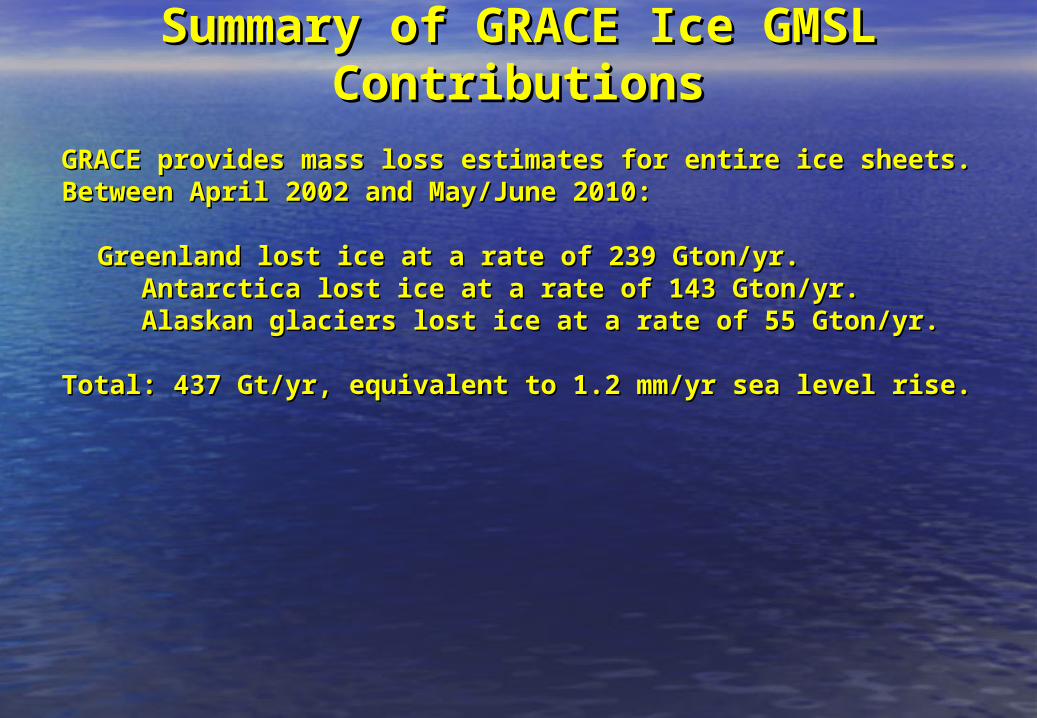
Summary of GRACE Ice GMSL Summary of GRACE Ice GMSL ContributionsContributions
GRACE provides mass loss estimates for entire ice sheets.GRACE provides mass loss estimates for entire ice sheets.Between April 2002 and May/June 2010:Between April 2002 and May/June 2010:
Greenland lost ice at a rate of 239 Gton/yr.Greenland lost ice at a rate of 239 Gton/yr. Antarctica lost ice at a rate of 143 Gton/yr.Antarctica lost ice at a rate of 143 Gton/yr. Alaskan glaciers lost ice at a rate of 55 Gton/yr.Alaskan glaciers lost ice at a rate of 55 Gton/yr.
Total: 437 Gt/yr, equivalent to 1.2 mm/yr sea level rise.Total: 437 Gt/yr, equivalent to 1.2 mm/yr sea level rise.
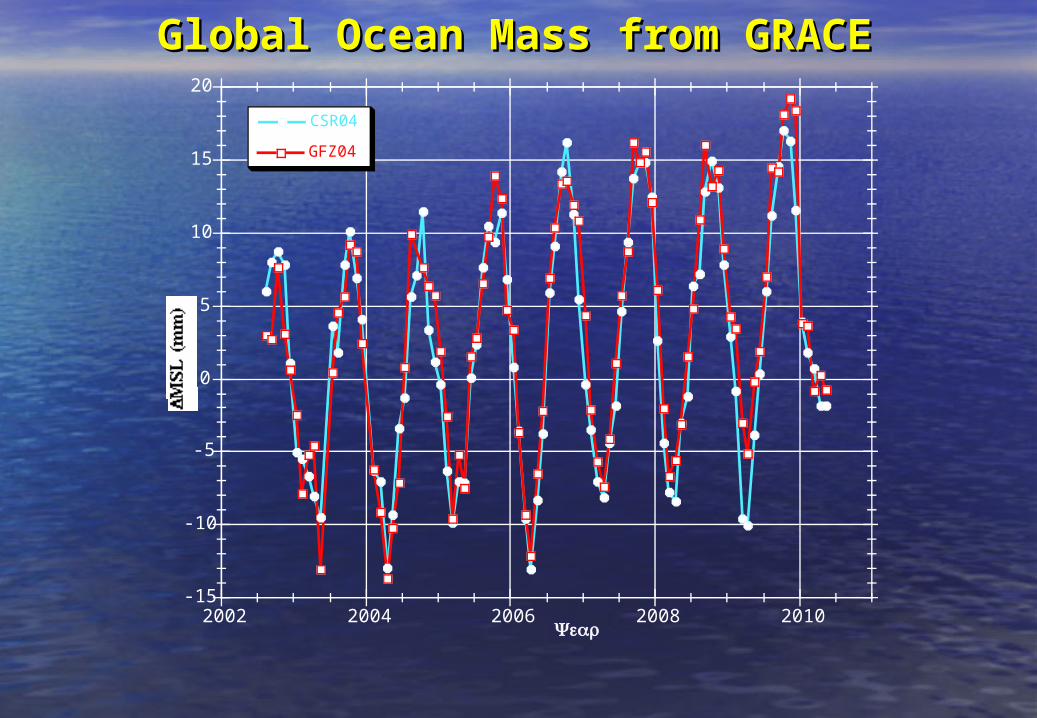
Global Ocean Mass from GRACEGlobal Ocean Mass from GRACE
-15
-10
-5
0
5
10
15
20
2002 2004 2006 2008 2010
CSR04
GFZ04
Year
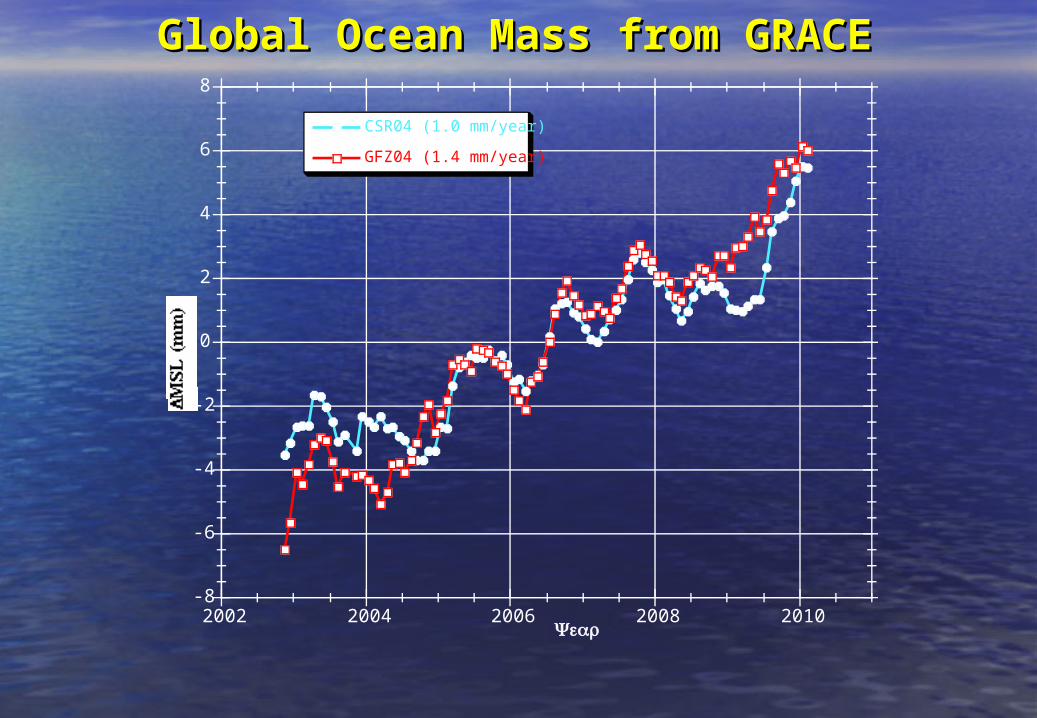
Global Ocean Mass from GRACEGlobal Ocean Mass from GRACE
-8
-6
-4
-2
0
2
4
6
8
2002 2004 2006 2008 2010
CSR04 (1.0 mm/year)
GFZ04 (1.4 mm/year)
Year
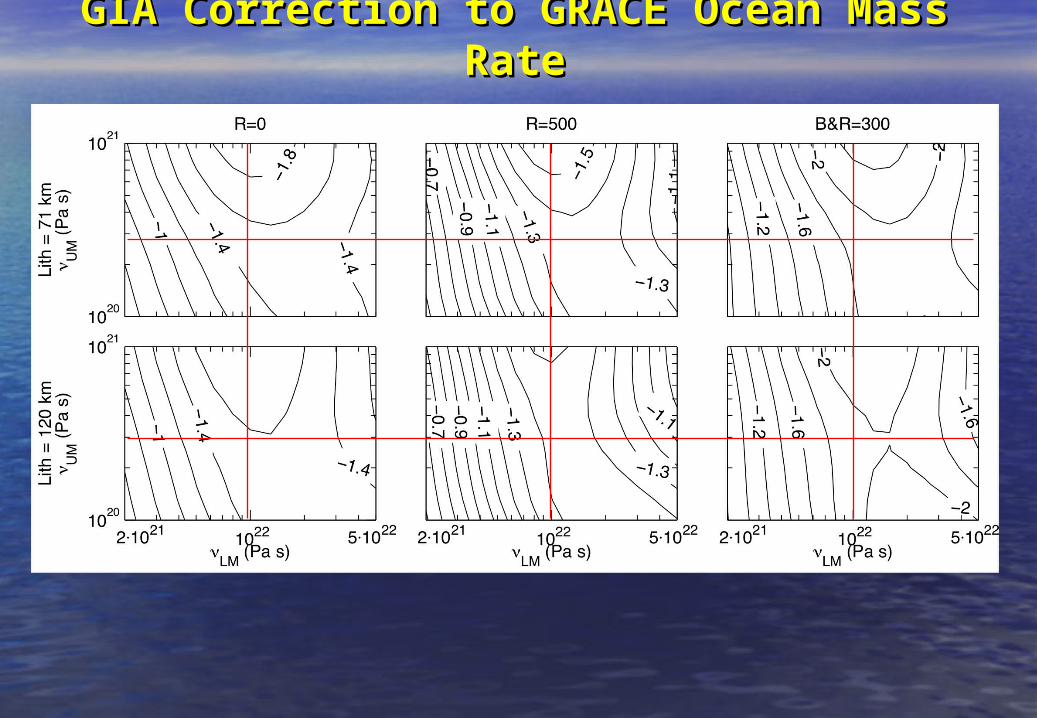
GIA Correction to GRACE Ocean Mass GIA Correction to GRACE Ocean Mass RateRate
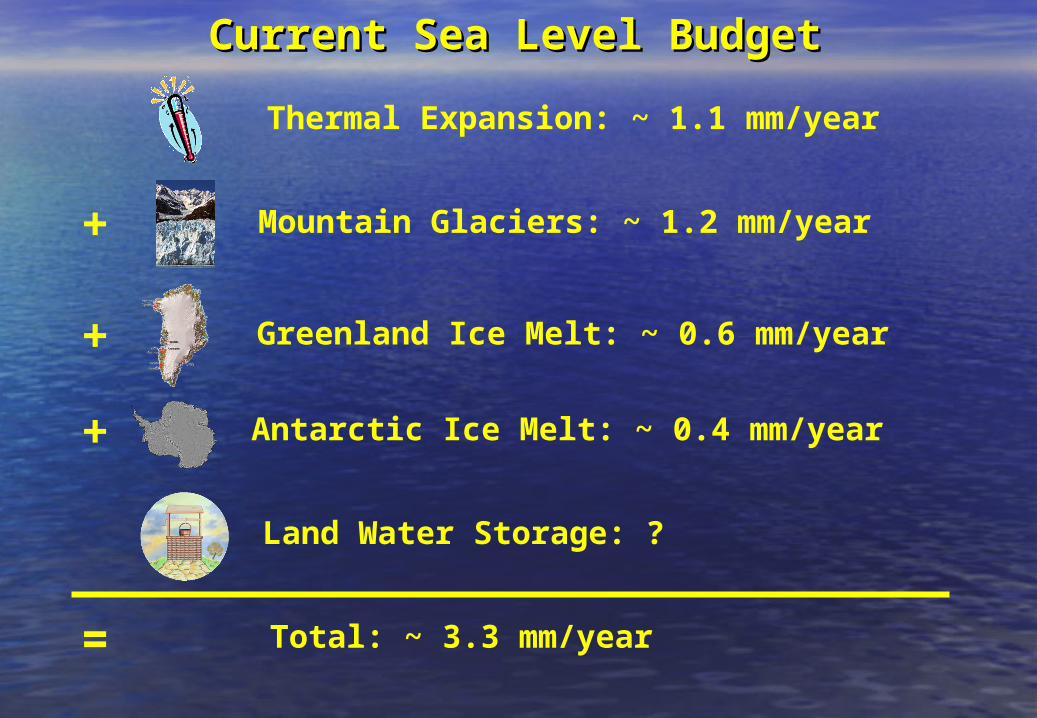
Current Sea Level BudgetCurrent Sea Level Budget
Thermal Expansion: ~ 1.1 mm/year
Mountain Glaciers: ~ 1.2 mm/year
Greenland Ice Melt: ~ 0.6 mm/year
Antarctic Ice Melt: ~ 0.4 mm/year
Land Water Storage: ?
Total: ~ 3.3 mm/year
+
+
+
=