Embed Size (px)
Citation preview

S1
Crystal engineering studies on the salts of trans-4,4'-stilbenedicarboxylic acid in the context of solid state [2+2] cycloaddition reaction
Goutam Kumar Kole and Jagadese J. Vittal*
Department of Chemistry, National University of Singapore, 3 Science Drive 3, Singapore-117543. E-mail: [email protected]; Fax: +65 6779 1691; Tel: +65 6516 2975
Supporting Information
Scheme S1: The pKa values of all the reactants, calculated using SPARC program (http://ibmlc2.chem.uga.edu/sparc/), are listed
S2
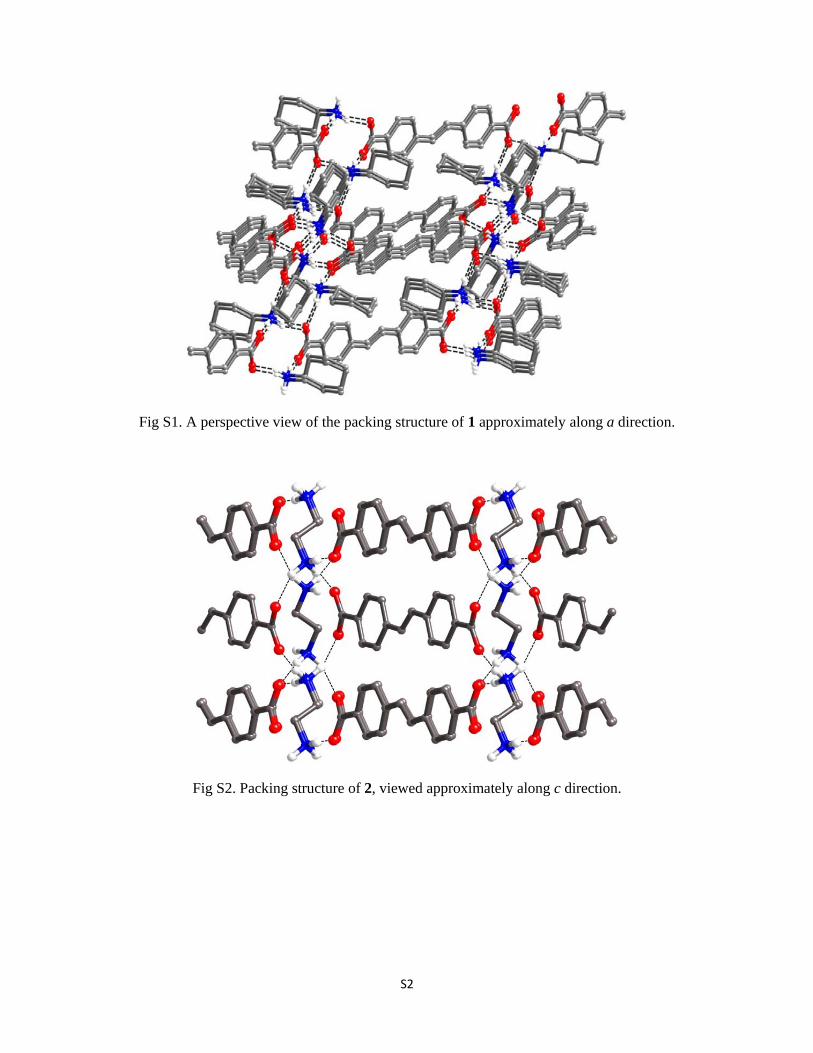
Fig S1. A perspective view of the packing structure of 1 approximately along a direction.
Fig S2. Packing structure of 2, viewed approximately along c direction.

S3
Fig S3. The graph set notation of hydrogen bonded ring present in 2.
Fig S4. A view of packing along b-axis shows that the components are packed in zigzag
manner in 3.
Fig S5. The graph set notation of the hydrogen bonded motifs in 3.

S4
Fig S6. 1H NMR spectrum (300 MHz, D2O) of 3 before UV irradiation.
Fig S7. 1H NMR spectrum (300 MHz, D2O) of 3 after 30 h of irradiation showing quantitative dimerization.

S5
Fig S8. Thermogravimetric analysis for the salt 3. 5.2% wt. loss above 100 ˚C shows strong hydrogen bonding interactions present in the lattice.
Fig S9. A perspective view of the packing structure of 4.
S6
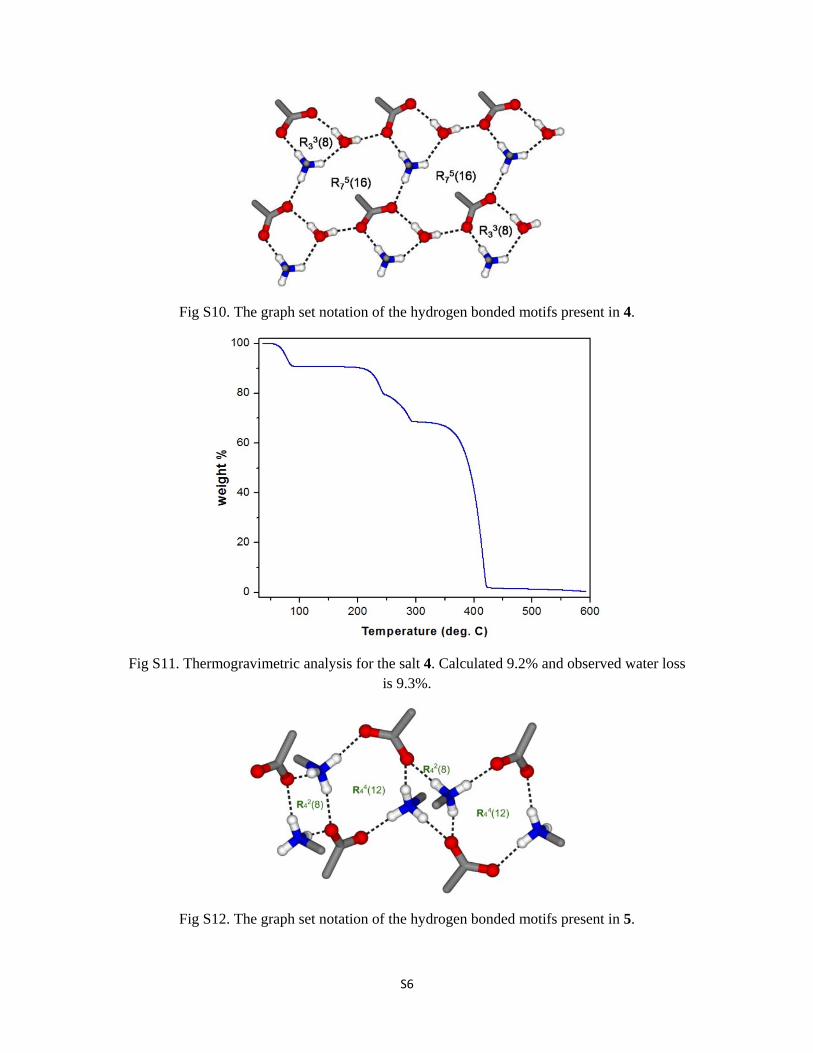
Fig S10. The graph set notation of the hydrogen bonded motifs present in 4.
Fig S11. Thermogravimetric analysis for the salt 4. Calculated 9.2% and observed water loss is 9.3%.
Fig S12. The graph set notation of the hydrogen bonded motifs present in 5.

S7
Fig S13. The packing structure of the salt 6 that shows various kinds of hydrogen bonding interactions played by the cations, anions and water molecules.
Fig S14. A perspective view of packing diagram along ‘c’ direction in 6. Water cluster is shown in pink circle.
Fig S15. The graph set notation of the motifs in 6.

S8
Fig S16. TGA of the salt 6: both the observed and calculated water losses are 15.7%.
Fig S17. The packed crystal diagram of the salt 7 that shows various kinds of hydrogen bonding interactions played by the cations, anions and water molecules.
Fig S18. The graph set H-bonded motifs present in the crystal structure of 7.

S9
Fig S19. TGA for the salt 7: the observed water loss is 7.15%, where the calculated water loss is 7.31%.
Fig S20. 1H NMR spectrum of the salt 9 after UV irradiation for 40 h that shows 62% photodimerization.

S10
Fig S21. 1H NMR spectrum of the diammonium salt of SDC, 10 after UV irradiation for 50 h that shows 80% photodimerization.
Fig S22. TGA of the salt 9. Calculated weight loss for the composition C60H70N6O12·8H2O is 11.88% and found water loss is 12.1%. Hence it supports the elemental analysis to determine
the correct composition.
S11
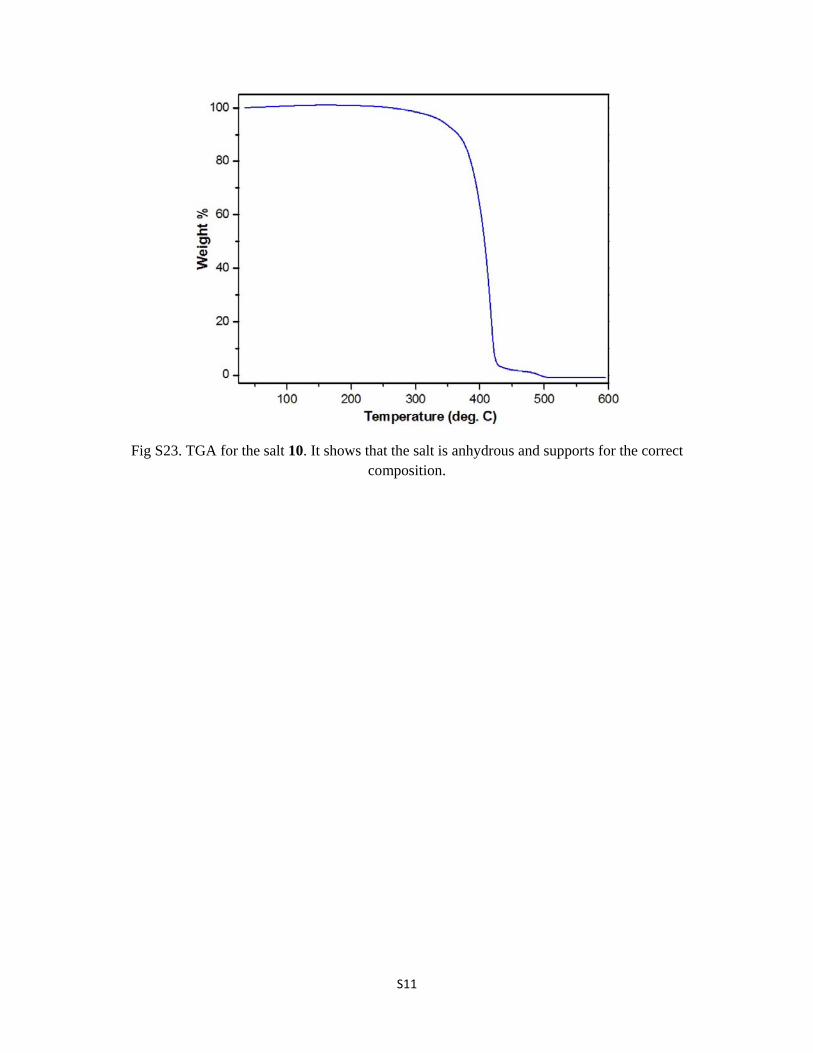
Fig S23. TGA for the salt 10. It shows that the salt is anhydrous and supports for the correct composition.