Embed Size (px)
Citation preview
Chapter 8
Crystallization: From the Conformer to the Crystal
J.S. Redinha, A.J. Lopes Jesus, A.A.C.C. Pais andJ. A. S. Almeida
Additional information is available at the end of the chapter
http://dx.doi.org/10.5772/54447
1. Introduction
Crystallization, commonly defined as a process of formation of a crystalline solid froma supersaturated solution, melt or vapor phase, is an old technique widely used inlaboratory and in industrial processes to separate and purify substances. In variousmodern industries, crystalline forms with a certain habit, size and structure, constitutethe basic materials for the production of highly sophisticated materials [1, 2]. Integrat‐ed circuits as well as piezoelectric and optical materials are just a few examples of de‐vices whose properties are dependent on the crystal structure. Also, in organicchemistry, molecular crystals with determined characteristics are now-a-days of utmostimportance for the production of pharmaceuticals, dyestuffs, pigments, foodstuffs,chemicals, cosmetics, etc. For all these reasons, crystal growth has become an impor‐tant and attractive research field.
Crystallization from solution is one of the preferred methods to obtain a crystal since it canbe carried out under different experimental conditions and provides a wide variety of prod‐ucts. In fact, it can occur by lowering the temperature of a supersaturated solution, partialevaporation of the solvent, precipitation by adding an anti-solvent or vapor diffusion of agas into the solution. Furthermore, solvents with different properties can be used. Such a di‐versity of experimental conditions has great influence in the output, i.e., in the type of crys‐talline phase that can be obtained. Therefore, any aprioristic selection of the conditionsleading to a desired final product is a fundamental challenge but it is also an almost unfeasi‐ble task [3-5]. On respect to the harvest, crystallization is, in a certain extension, a trial-and-error operation.
The various steps of crystallization from solvents are summarized in the following scheme:
© 2013 Redinha et al.; licensee InTech. This is an open access article distributed under the terms of theCreative Commons Attribution License (http://creativecommons.org/licenses/by/3.0), which permitsunrestricted use, distribution, and reproduction in any medium, provided the original work is properly cited.
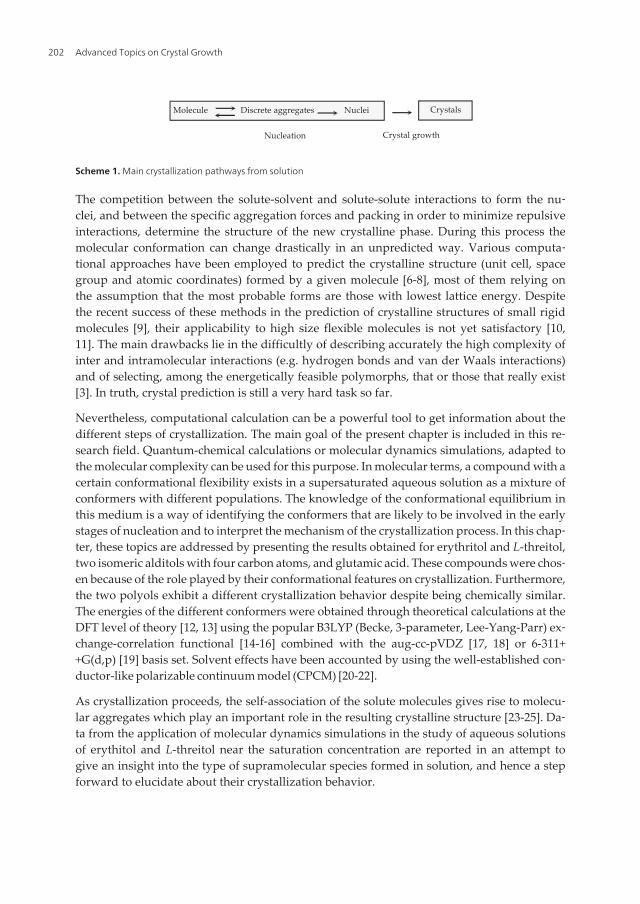
Molecule Discrete aggregates Nuclei Crystals
Nucleation Crystal growth
Scheme 1. Main crystallization pathways from solution
The competition between the solute-solvent and solute-solute interactions to form the nu‐clei, and between the specific aggregation forces and packing in order to minimize repulsiveinteractions, determine the structure of the new crystalline phase. During this process themolecular conformation can change drastically in an unpredicted way. Various computa‐tional approaches have been employed to predict the crystalline structure (unit cell, spacegroup and atomic coordinates) formed by a given molecule [6-8], most of them relying onthe assumption that the most probable forms are those with lowest lattice energy. Despitethe recent success of these methods in the prediction of crystalline structures of small rigidmolecules [9], their applicability to high size flexible molecules is not yet satisfactory [10,11]. The main drawbacks lie in the difficultly of describing accurately the high complexity ofinter and intramolecular interactions (e.g. hydrogen bonds and van der Waals interactions)and of selecting, among the energetically feasible polymorphs, that or those that really exist[3]. In truth, crystal prediction is still a very hard task so far.
Nevertheless, computational calculation can be a powerful tool to get information about thedifferent steps of crystallization. The main goal of the present chapter is included in this re‐search field. Quantum-chemical calculations or molecular dynamics simulations, adapted tothe molecular complexity can be used for this purpose. In molecular terms, a compound with acertain conformational flexibility exists in a supersaturated aqueous solution as a mixture ofconformers with different populations. The knowledge of the conformational equilibrium inthis medium is a way of identifying the conformers that are likely to be involved in the earlystages of nucleation and to interpret the mechanism of the crystallization process. In this chap‐ter, these topics are addressed by presenting the results obtained for erythritol and L-threitol,two isomeric alditols with four carbon atoms, and glutamic acid. These compounds were chos‐en because of the role played by their conformational features on crystallization. Furthermore,the two polyols exhibit a different crystallization behavior despite being chemically similar.The energies of the different conformers were obtained through theoretical calculations at theDFT level of theory [12, 13] using the popular B3LYP (Becke, 3-parameter, Lee-Yang-Parr) ex‐change-correlation functional [14-16] combined with the aug-cc-pVDZ [17, 18] or 6-311++G(d,p) [19] basis set. Solvent effects have been accounted by using the well-established con‐ductor-like polarizable continuum model (CPCM) [20-22].
As crystallization proceeds, the self-association of the solute molecules gives rise to molecu‐lar aggregates which play an important role in the resulting crystalline structure [23-25]. Da‐ta from the application of molecular dynamics simulations in the study of aqueous solutionsof erythitol and L-threitol near the saturation concentration are reported in an attempt togive an insight into the type of supramolecular species formed in solution, and hence a stepforward to elucidate about their crystallization behavior.
Advanced Topics on Crystal Growth202
As stated before, depending on the experimental conditions and intrinsic molecular featuresof the molecules, different crystalline phases or polymorphs can be obtained by crystalliza‐tion. The polymorphs differ from one another in the arrangement (packing) and/or confor‐mation of the molecules in the crystal lattice [26-29]. They are commonly called packingpolymorphs in the first case and conformational polymorphs in the second one. Polymor‐phism has significant implications in a wide range of areas and for this reason it has beenmatter of extensive investigation. Some typical examples are here reported with the objec‐tive of pointing out the diversity of structures that can obtained by crystallization.
2. Nucleation and crystal growth
Fluctuations of the order of a solution, for example density, are accompanied by the forma‐tion of solute molecular clusters. The driving force to bring the molecules close together isgiven by the following chemical potential difference:
*ln CkTC
m m*- = (1)
In this equation, μ and μ* are the chemical potentials of the solute at the actual (C) and satu‐ration (C*) concentrations, respectively. The Gibbs energy change per molecule (Δg) corre‐sponding to the formation of a spherical cluster of radius r is [30-32]
324 / 3 4rg r
vp m p sD = D + (2)
where v is the molecular volume and σ the interfacial energy per surface. The first term ofthe right hand equation gives the work produced by the intermolecular attractive forces(Δgb) while the second one corresponds to the work required to increase the surface area in1cm2 (Δgs). Owing to the meaning of both terms, equation (2) can be rewritten as
b sg g gD = D + D (3)
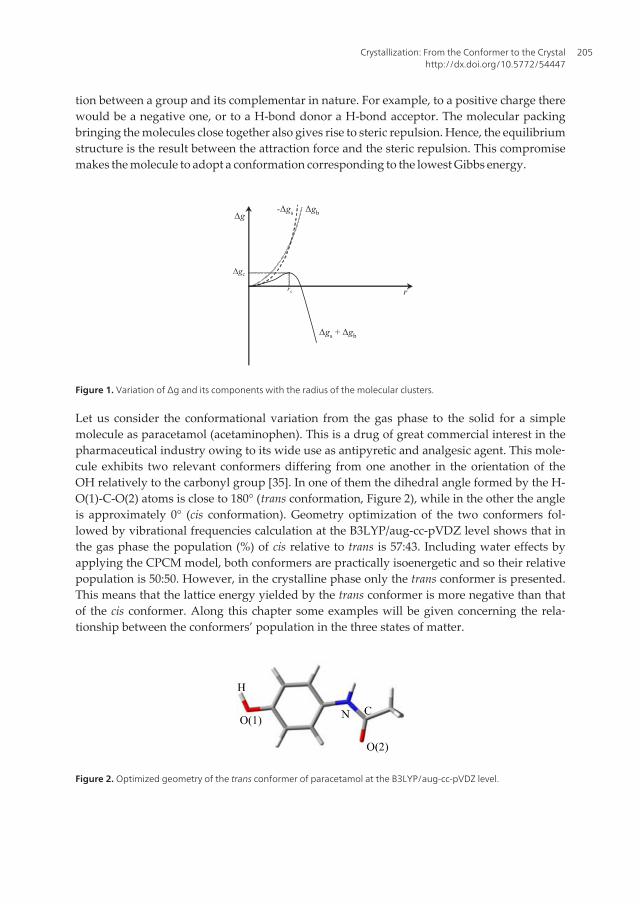
With the increase of concentration, the amplitude of the fluctuations also increase and so dothe size of the clusters. For smaller size clusters, Δgs is the dominant contribution and Δg/dr> 0, i.e., the clusters are unstable. Conversely, for larger size clusters, Δgb is dominant andΔg/dr < 0, meaning that the clusters are stable solid particles. The curve representing the var‐iation of Δg with the radius, shown in Figure 1, passes through a maximum at r = rc (dΔg/dr= 0), with rc representing the limiting size for stable clusters. A cluster of this size is the em‐bryo of the solid form nucleus. The following relationships involving rc can be established:
Crystallization: From the Conformer to the Crystalhttp://dx.doi.org/10.5772/54447
203
c
c
2
c
2 a
2 b
4c
3
b
c
vr
rg
rg
sms
p s
= -D
= -D
D =
(4)
where Δgc corresponds to the value of Δg at rc. The supersaturation concentration (S) can berelated with the clusters size by the Gibbs-Thomson equation:
*c
2ln lnC vSkTrCs
= = (5)
Combining (4c) and (5), the following expression is obtained for Δgc as function of the super‐saturation:
3 2
c 2163 ln
vgkT Sps
D = (6)
Δgc represents the energy barrier for the nucleation process and the rate of nucleation (J) willbe given by:
cgkTJ Ae
æ -D öç ÷ç ÷è ø=
(7)
This equation shows that the rate of nucleation is strongly dependent on the supersaturationand tends to a finite value for a given supersaturation.
Organic crystals are supramolecules, i.e, an ensemble of molecules, bonded by non-covalentforces involving ions, polar or non-polar groups. Such interactions, whatever their strength,do not change the molecular individuality. Hydrogen bonding occupies a special placeamong the intermolecular interactions occurring in molecular crystals. Its energy rangesfrom 160 kJ mol-1 (strongly covalent) down to 16 kJ mol-1 (mostly electrostatic) [33] and it ishighly dependent on the orientation of the hydrogen donor group (D–H) relative to the ac‐ceptor atom (A). The maximum strength occurs when the D–H‧‧‧A angle is approximately180°, though values greater than 110° are acceptable for a hydrogen bond [34].
It is obvious that a crystal packing in which the specific interactions between the functionalgroups (molecular recognition) are more favorable is, in principle, that leading to the lowestenergy. Thus, the lowest energy crystalline structure would correspond to the stronger interac‐
Advanced Topics on Crystal Growth204
tion between a group and its complementar in nature. For example, to a positive charge therewould be a negative one, or to a H-bond donor a H-bond acceptor. The molecular packingbringing the molecules close together also gives rise to steric repulsion. Hence, the equilibriumstructure is the result between the attraction force and the steric repulsion. This compromisemakes the molecule to adopt a conformation corresponding to the lowest Gibbs energy.
Dg
Δgc
rc r
-Δgs Δgb
Δgs + Δgb
Figure 1. Variation of ∆g and its components with the radius of the molecular clusters.
Let us consider the conformational variation from the gas phase to the solid for a simplemolecule as paracetamol (acetaminophen). This is a drug of great commercial interest in thepharmaceutical industry owing to its wide use as antipyretic and analgesic agent. This mole‐cule exhibits two relevant conformers differing from one another in the orientation of theOH relatively to the carbonyl group [35]. In one of them the dihedral angle formed by the H-O(1)-C-O(2) atoms is close to 180° (trans conformation, Figure 2), while in the other the angleis approximately 0° (cis conformation). Geometry optimization of the two conformers fol‐lowed by vibrational frequencies calculation at the B3LYP/aug-cc-pVDZ level shows that inthe gas phase the population (%) of cis relative to trans is 57:43. Including water effects byapplying the CPCM model, both conformers are practically isoenergetic and so their relativepopulation is 50:50. However, in the crystalline phase only the trans conformer is presented.This means that the lattice energy yielded by the trans conformer is more negative than thatof the cis conformer. Along this chapter some examples will be given concerning the rela‐tionship between the conformers’ population in the three states of matter.
Figure 2. Optimized geometry of the trans conformer of paracetamol at the B3LYP/aug-cc-pVDZ level.
Crystallization: From the Conformer to the Crystalhttp://dx.doi.org/10.5772/54447
205
3. Polymorphism
According to McCrone [36], polymorphism of a compound corresponds to its ability to crys‐tallize into more than one crystalline structure. From the thermodynamic point of view, onlythe lowest Gibbs energy form exists. However, higher energy polymorphs can remain asmetastable forms for a period of time long enough to be used for practical purposes, provid‐ing the height of the energy barrier separating these polymorphs and the most stable one issufficiently high [28]. Since different solid-state modifications exhibit distinct physicochemi‐cal properties, such for example the melting point, solubility, dissolution rate and density,polymorphism has a great impact in the pharmaceutical, food and dyes technologies, amongothers. For example, in the pharmaceutical industry, the desired polymorph for a given ac‐tive pharmaceutical ingredient (API) would be the one with highest bioavailability andstructural stability during shelf life [37].
A typical example of a drug exhibiting polymorphism is paracetamol. Three polymorphs, labeled as I, II and III, have been
identified for this compound [38-40]. The first (form I) is the thermodynamically stable form while the second (form II) is
metastable but exists long enough to be experimentally studied. It is usually prepared from cooled melt [41]. Form III is very
unstable [41] and thus it is not possible to investigate its structure and properties. Form I crystallizes in the monoclinic system
(space group P21/a) [42, 43]. As shown in Figure 3, the molecules in the crystalline structure are linked through O–H···O=C and N–
H···O–H hydrogen bonds forming chains which in turn give rise to pleated layers [frames (a) and (a’)]. Regarding form II, it
crystallizes in the orthorhombic system (space group Pcab) [44, 45]. The H-bonding system is identical to that existing in form I but
the layers are plane interconnected by van der waals forces [frames (b) and (b’)].
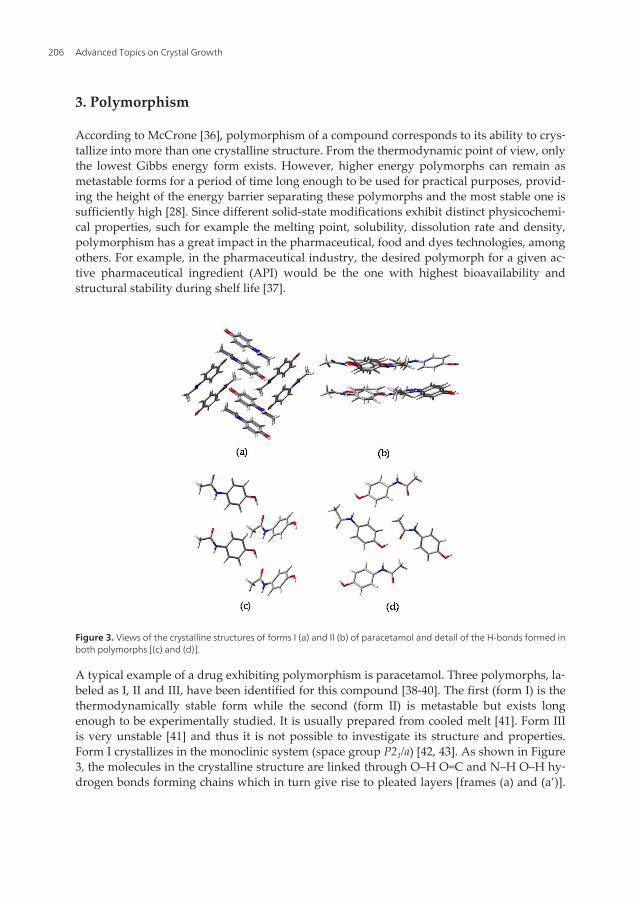
Figure 3. Views of the crystalline structures of forms I (a) and II (b) of paracetamol and detail of the H-bonds formed in both polymorphs [(a’) and
(b’)].
The geometric parameters of the H-bonds in forms I and II are summarized in Table 1. In both forms the O–H···O=C hydrogen
bond is stronger than the N–H···O–H one. In addition, the hydrogen bonds in the stable polymorph are stronger than in the
metastable one.
The two polymorphs were also characterized by infrared spectroscopy [46, 47]. The values of the stretching vibration frequencies
for the groups involved in hydrogen bonds are given in Table 2. To work as reference, the frequencies of the “free” groups,
obtained from a spectrum of paracetamol in a CDCl3 solution were also included in the Table. From the frequency shift (Δν) of the
NH and OH groups one can estimate the enthalpy involved in the two hydrogen bonds by applying the empirical relationship
proposed by Iogansen: ΔH2 = 1.92(Δν – 40) [48]. The value of ΔH estimated for the N–H···O–H H-bond was found to be 12 kJ mol-1
for both polymorphs, while that estimated for the O–H···O=C one was found to be 28 kJ mol-1 for form I and 19 kJ mol-1 for form II.
Form O–H···O=C N–H···O–H
H···O/Å O···O/Å O–H···O/º H···O/Å N···O/Å N–H···O/º I 1.719 2.653 167.5 2.032 2.904 161.6
II 1.838 2.709 170.6 2.069 2.943 163.8
Table 1. Distances and angles of the hydrogen bonds in the paracetamol polymorphs.a
a Values taken from ref. [43, 45]
νNH νOH νCO form I 3324 3160 1656
form II 3326 3205 1666 ; 1656
CDCl3 solution 3438 3600 1683
Table 2. Vibrational frequencies (ν/cm-1) corresponding to the NH, OH and CO stretching vibrations of paracetamol in the two crystalline phases
and in a CDCl3 solution. a
a Values taken from ref. [46, 47]
Figure 3. Views of the crystalline structures of forms I (a) and II (b) of paracetamol and detail of the H-bonds formed inboth polymorphs [(c) and (d)].
A typical example of a drug exhibiting polymorphism is paracetamol. Three polymorphs, la‐beled as I, II and III, have been identified for this compound [38-40]. The first (form I) is thethermodynamically stable form while the second (form II) is metastable but exists longenough to be experimentally studied. It is usually prepared from cooled melt [41]. Form IIIis very unstable [41] and thus it is not possible to investigate its structure and properties.Form I crystallizes in the monoclinic system (space group P21/a) [42, 43]. As shown in Figure3, the molecules in the crystalline structure are linked through O–H O=C and N–H O–H hy‐drogen bonds forming chains which in turn give rise to pleated layers [frames (a) and (a’)].
Advanced Topics on Crystal Growth206
Regarding form II, it crystallizes in the orthorhombic system (space group Pcab) [44, 45]. TheH-bonding system is identical to that existing in form I but the layers are plane interconnect‐ed by van der waals forces [frames (b) and (b’)].
The geometric parameters of the H-bonds in forms I and II are summarized in Table 1. Inboth forms the O–H‧‧‧O=C hydrogen bond is stronger than the N–H‧‧‧O–H one. In addition,the hydrogen bonds in the stable polymorph are stronger than in the metastable one.
The two polymorphs were also characterized by infrared spectroscopy [46, 47]. The valuesof the stretching vibration frequencies for the groups involved in hydrogen bonds are givenin Table 2. To work as reference, the frequencies of the “free” groups, obtained from a spec‐trum of paracetamol in a CDCl3 solution were also included in the Table. From the frequen‐cy shift (Δν) of the NH and OH groups one can estimate the enthalpy involved in the twohydrogen bonds by applying the empirical relationship proposed by Iogansen: ΔH2 =1.92(Δν – 40) [48]. The value of ΔH estimated for the N–H‧‧‧O–H H-bond was found to be 12kJ mol-1 for both polymorphs, while that estimated for the O–H‧‧‧O=C one was found to be28 kJ mol-1 for form I and 19 kJ mol-1 for form II.
FormO–H···O=C N–H···O–H
H···O/Å O···O/Å O–H···O/º H···O/Å N···O/Å N–H···O/º
I 1.719 2.653 167.5 2.032 2.904 161.6
II 1.838 2.709 170.6 2.069 2.943 163.8
a Values taken from ref. [43, 45]
Table 1. Distances and angles of the hydrogen bonds in the paracetamol polymorphs.a
νNH νOH νCO
form I 3324 3160 1656
form II 3326 3205 1666 ; 1656
CDCl3 solution 3438 3600 1683
a Values taken from ref. [46, 47]
Table 2. Vibrational frequencies (ν/cm-1) corresponding to the NH, OH and CO stretching vibrations of paracetamol inthe two crystalline phases and in a CDCl3 solution. a
The higher stability of form I is also confirmed by the thermodynamic properties obtainedfor sublimation, fusion and vaporization of the two polymorphic forms [38]. The value ofthe packing density, determined by flotation or X-ray (or neutron) diffraction [49] is higherin form II than in form I. In fact, at 298K the density of the former is 1.336 g cm-3 while thatof the latter is 1.297 g cm-3. That is, the higher stability of form I results from a stronger hy‐drogen bond interaction rather than from a more favorable packing. In this compound, thedifferences between specific interactions resulting from the conformational recognition over‐come that due to the crystal packing.
Crystallization: From the Conformer to the Crystalhttp://dx.doi.org/10.5772/54447
207
The polymorphism of paracetamol assumes great importance from the practical point ofview in so far the commercialized polymorph is not the most suitable solid for formulation[45, 50, 51]. Despite it is easily obtained from various solvents, it has the inconvenient to re‐quire a binding agent to make tablets for compression. During this process it gives a brittlesolid, consequence of its rough molecular layers. Conversely, form II is constituted by thinplates that glide on pressing. Its plasticity allows the formulation into tablets by direct com‐pression without the need of incorporating any binder agent [45]. The main difficulty to ob‐tain this form comes up against the existence of an adequate method for their preparation atan industrial scale [41].
Aspirin (acetylsalicylic acid) is a drug commonly used as analgesic, antipyretic and anti-in‐flammatory. It is also known to act as anticoagulant by reducing the blood platelet aggrega‐tion [52]. About 35,000 tons of aspirin are taken a day throughout the world.
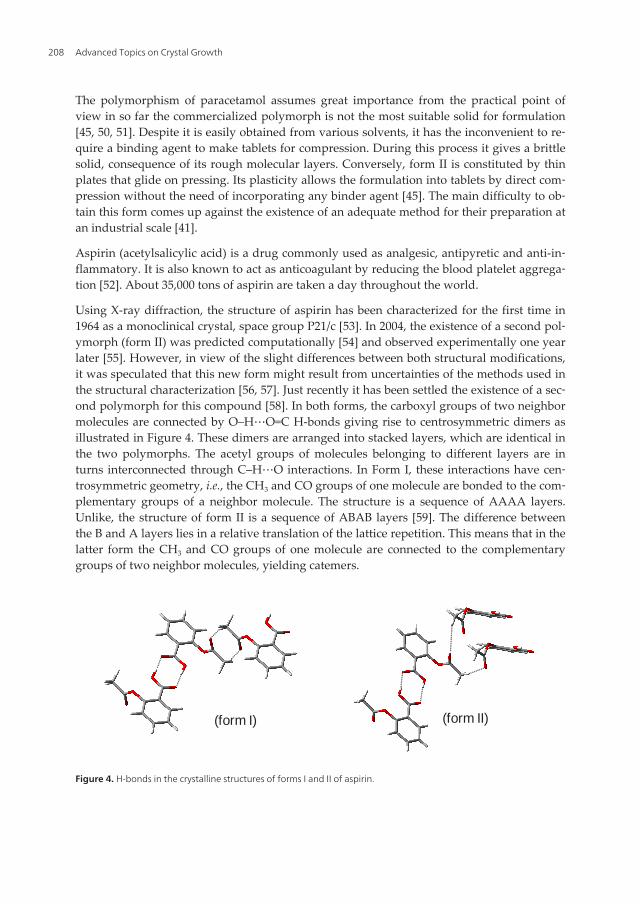
Using X-ray diffraction, the structure of aspirin has been characterized for the first time in1964 as a monoclinical crystal, space group P21/c [53]. In 2004, the existence of a second pol‐ymorph (form II) was predicted computationally [54] and observed experimentally one yearlater [55]. However, in view of the slight differences between both structural modifications,it was speculated that this new form might result from uncertainties of the methods used inthe structural characterization [56, 57]. Just recently it has been settled the existence of a sec‐ond polymorph for this compound [58]. In both forms, the carboxyl groups of two neighbormolecules are connected by O–H‧‧‧O=C H-bonds giving rise to centrosymmetric dimers asillustrated in Figure 4. These dimers are arranged into stacked layers, which are identical inthe two polymorphs. The acetyl groups of molecules belonging to different layers are inturns interconnected through C–H‧‧‧O interactions. In Form I, these interactions have cen‐trosymmetric geometry, i.e., the CH3 and CO groups of one molecule are bonded to the com‐plementary groups of a neighbor molecule. The structure is a sequence of AAAA layers.Unlike, the structure of form II is a sequence of ABAB layers [59]. The difference betweenthe B and A layers lies in a relative translation of the lattice repetition. This means that in thelatter form the CH3 and CO groups of one molecule are connected to the complementarygroups of two neighbor molecules, yielding catemers.
(form I) (form II)
Figure 4. H-bonds in the crystalline structures of forms I and II of aspirin.
Advanced Topics on Crystal Growth208
An interesting feature of aspirin single crystals is that they exhibit simultaneously domainsof forms I and II of variable relative size. Deran et al. [58] explain this type of behavior as anaccidental degeneracy. According to these authors the two polymorphs are isoenergetic andduring crystallization an intergrowth of both forms occurs. The more favorable internal con‐formation in form I is compensated by an enhanced cooperativity of the catameric H-bond‐ing network in form II. These results raise the question of whether or not these two forms ofaspirin can be called polymorphs. According to the definition given by McCrone [36], theydo not fit into the concept.
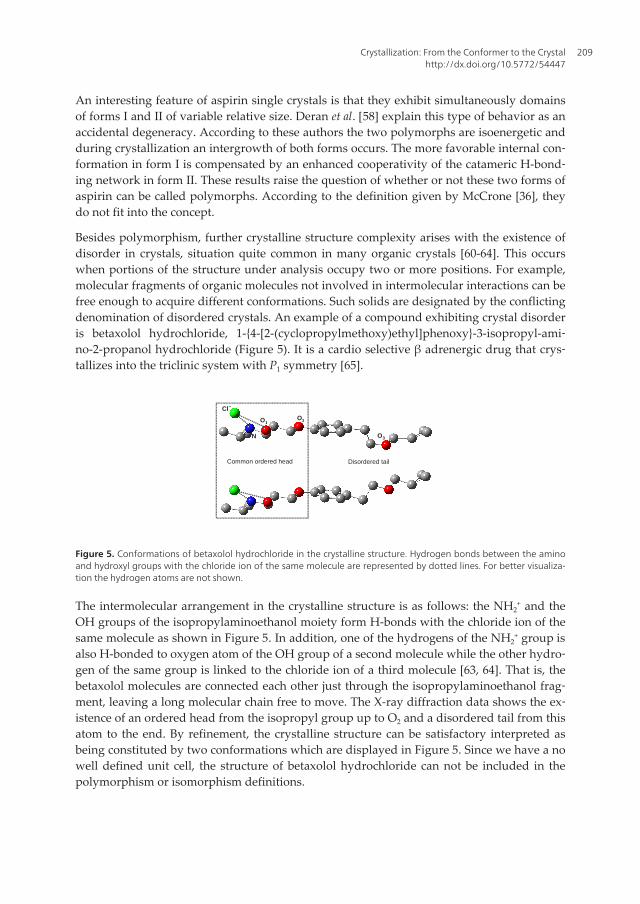
Besides polymorphism, further crystalline structure complexity arises with the existence ofdisorder in crystals, situation quite common in many organic crystals [60-64]. This occurswhen portions of the structure under analysis occupy two or more positions. For example,molecular fragments of organic molecules not involved in intermolecular interactions can befree enough to acquire different conformations. Such solids are designated by the conflictingdenomination of disordered crystals. An example of a compound exhibiting crystal disorderis betaxolol hydrochloride, 1-{4-[2-(cyclopropylmethoxy)ethyl]phenoxy}-3-isopropyl-ami‐no-2-propanol hydrochloride (Figure 5). It is a cardio selective β adrenergic drug that crys‐tallizes into the triclinic system with P1 symmetry [65].
Common ordered head Disordered tail
Cl −
O 1 O 2
O 3 N
Figure 5. Conformations of betaxolol hydrochloride in the crystalline structure. Hydrogen bonds between the aminoand hydroxyl groups with the chloride ion of the same molecule are represented by dotted lines. For better visualiza‐tion the hydrogen atoms are not shown.
The intermolecular arrangement in the crystalline structure is as follows: the NH2+ and the
OH groups of the isopropylaminoethanol moiety form H-bonds with the chloride ion of thesame molecule as shown in Figure 5. In addition, one of the hydrogens of the NH2
+ group isalso H-bonded to oxygen atom of the OH group of a second molecule while the other hydro‐gen of the same group is linked to the chloride ion of a third molecule [63, 64]. That is, thebetaxolol molecules are connected each other just through the isopropylaminoethanol frag‐ment, leaving a long molecular chain free to move. The X-ray diffraction data shows the ex‐istence of an ordered head from the isopropyl group up to O2 and a disordered tail from thisatom to the end. By refinement, the crystalline structure can be satisfactory interpreted asbeing constituted by two conformations which are displayed in Figure 5. Since we have a nowell defined unit cell, the structure of betaxolol hydrochloride can not be included in thepolymorphism or isomorphism definitions.
Crystallization: From the Conformer to the Crystalhttp://dx.doi.org/10.5772/54447
209
4. Erythritol and threitol: identical chemical structure, differentcrystalline assembling
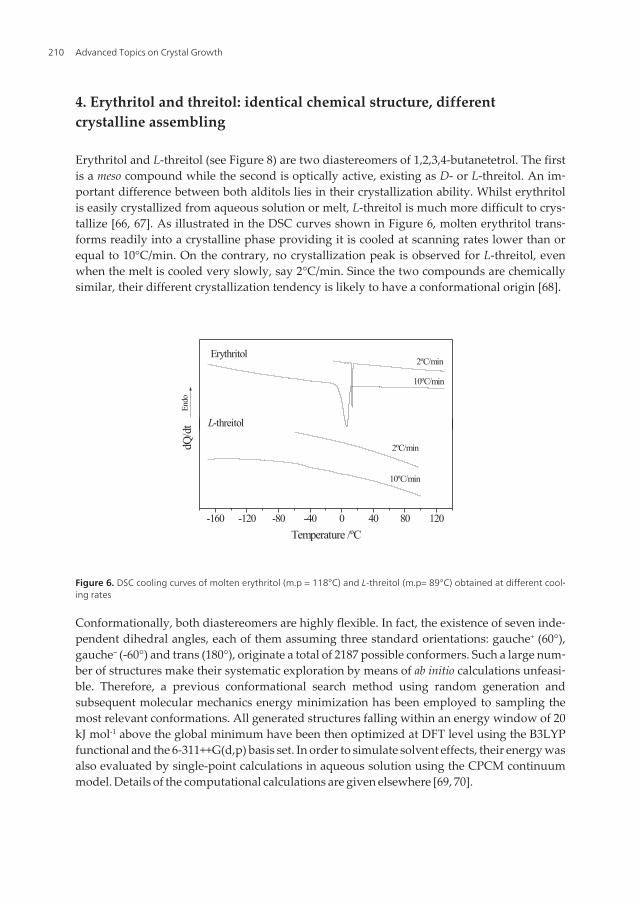
Erythritol and L-threitol (see Figure 8) are two diastereomers of 1,2,3,4-butanetetrol. The firstis a meso compound while the second is optically active, existing as D- or L-threitol. An im‐portant difference between both alditols lies in their crystallization ability. Whilst erythritolis easily crystallized from aqueous solution or melt, L-threitol is much more difficult to crys‐tallize [66, 67]. As illustrated in the DSC curves shown in Figure 6, molten erythritol trans‐forms readily into a crystalline phase providing it is cooled at scanning rates lower than orequal to 10°C/min. On the contrary, no crystallization peak is observed for L-threitol, evenwhen the melt is cooled very slowly, say 2°C/min. Since the two compounds are chemicallysimilar, their different crystallization tendency is likely to have a conformational origin [68].
-160 -120 -80 -40 0 40 80 120
10ºC/min
2ºC/min
L-threitol
Temperature /ºC
En
dodQ
/dt
10ºC/min
Erythritol2ºC/min
Figure 6. DSC cooling curves of molten erythritol (m.p = 118°C) and L-threitol (m.p= 89°C) obtained at different cool‐ing rates
Conformationally, both diastereomers are highly flexible. In fact, the existence of seven inde‐pendent dihedral angles, each of them assuming three standard orientations: gauche+ (60°),gauche– (-60°) and trans (180°), originate a total of 2187 possible conformers. Such a large num‐ber of structures make their systematic exploration by means of ab initio calculations unfeasi‐ble. Therefore, a previous conformational search method using random generation andsubsequent molecular mechanics energy minimization has been employed to sampling themost relevant conformations. All generated structures falling within an energy window of 20kJ mol-1 above the global minimum have been then optimized at DFT level using the B3LYPfunctional and the 6-311++G(d,p) basis set. In order to simulate solvent effects, their energy wasalso evaluated by single-point calculations in aqueous solution using the CPCM continuummodel. Details of the computational calculations are given elsewhere [69, 70].
Advanced Topics on Crystal Growth210
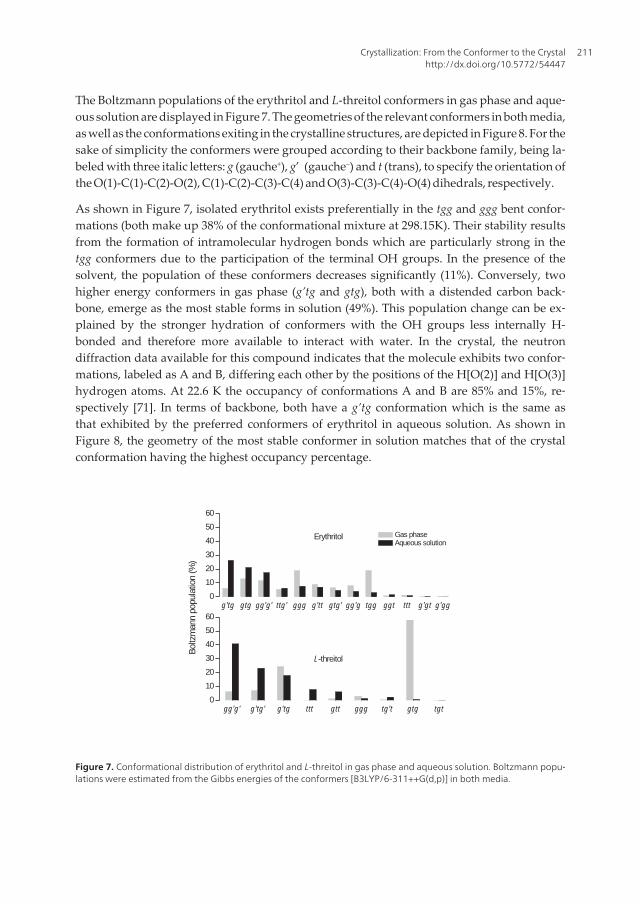
The Boltzmann populations of the erythritol and L-threitol conformers in gas phase and aque‐ous solution are displayed in Figure 7. The geometries of the relevant conformers in both media,as well as the conformations exiting in the crystalline structures, are depicted in Figure 8. For thesake of simplicity the conformers were grouped according to their backbone family, being la‐beled with three italic letters: g (gauche+), g’ (gauche–) and t (trans), to specify the orientation ofthe O(1)-C(1)-C(2)-O(2), C(1)-C(2)-C(3)-C(4) and O(3)-C(3)-C(4)-O(4) dihedrals, respectively.
As shown in Figure 7, isolated erythritol exists preferentially in the tgg and ggg bent confor‐mations (both make up 38% of the conformational mixture at 298.15K). Their stability resultsfrom the formation of intramolecular hydrogen bonds which are particularly strong in thetgg conformers due to the participation of the terminal OH groups. In the presence of thesolvent, the population of these conformers decreases significantly (11%). Conversely, twohigher energy conformers in gas phase (g’tg and gtg), both with a distended carbon back‐bone, emerge as the most stable forms in solution (49%). This population change can be ex‐plained by the stronger hydration of conformers with the OH groups less internally H-bonded and therefore more available to interact with water. In the crystal, the neutrondiffraction data available for this compound indicates that the molecule exhibits two confor‐mations, labeled as A and B, differing each other by the positions of the H[O(2)] and H[O(3)]hydrogen atoms. At 22.6 K the occupancy of conformations A and B are 85% and 15%, re‐spectively [71]. In terms of backbone, both have a g’tg conformation which is the same asthat exhibited by the preferred conformers of erythritol in aqueous solution. As shown inFigure 8, the geometry of the most stable conformer in solution matches that of the crystalconformation having the highest occupancy percentage.
gg'g' g'tg' g'tg ttt gtt ggg tg't gtg tgt0
10
20
30
40
50
60
L-threitol
Bol
tzm
ann
popu
latio
n (%
)
g'tg gtg gg'g' ttg' ggg g'tt gtg' gg'g tgg ggt ttt g'gt g'gg0
10
20
30
40
50
60
Gas phase Aqueous solution
Erythritol
Figure 7. Conformational distribution of erythritol and L-threitol in gas phase and aqueous solution. Boltzmann popu‐lations were estimated from the Gibbs energies of the conformers [B3LYP/6-311++G(d,p)] in both media.
Crystallization: From the Conformer to the Crystalhttp://dx.doi.org/10.5772/54447
211
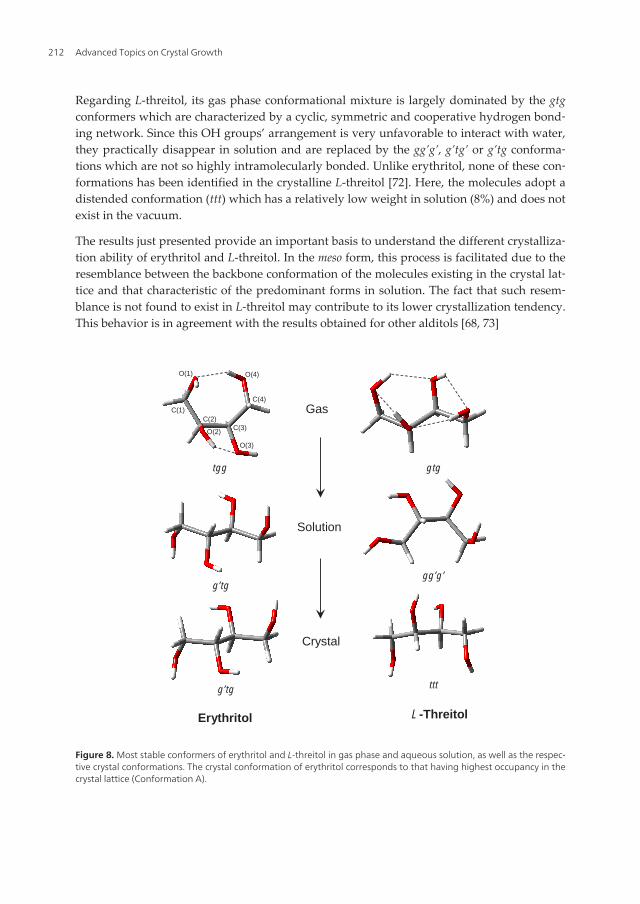
Regarding L-threitol, its gas phase conformational mixture is largely dominated by the gtgconformers which are characterized by a cyclic, symmetric and cooperative hydrogen bond‐ing network. Since this OH groups’ arrangement is very unfavorable to interact with water,they practically disappear in solution and are replaced by the gg’g’, g’tg’ or g’tg conforma‐tions which are not so highly intramolecularly bonded. Unlike erythritol, none of these con‐formations has been identified in the crystalline L-threitol [72]. Here, the molecules adopt adistended conformation (ttt) which has a relatively low weight in solution (8%) and does notexist in the vacuum.
The results just presented provide an important basis to understand the different crystalliza‐tion ability of erythritol and L-threitol. In the meso form, this process is facilitated due to theresemblance between the backbone conformation of the molecules existing in the crystal lat‐tice and that characteristic of the predominant forms in solution. The fact that such resem‐blance is not found to exist in L-threitol may contribute to its lower crystallization tendency.This behavior is in agreement with the results obtained for other alditols [68, 73]
Gas
Solution
Crystal
Erythritol L-Threitol
tgg
g’tg
g’tg
gtg
gg’g’
ttt
O(1)
C(1)C(2)
C(3)
O(3)
O(2)
C(4)
O(4)
Figure 8. Most stable conformers of erythritol and L-threitol in gas phase and aqueous solution, as well as the respec‐tive crystal conformations. The crystal conformation of erythritol corresponds to that having highest occupancy in thecrystal lattice (Conformation A).
Advanced Topics on Crystal Growth212
5. Conformational variation during the molecular incorporation into thecrystal: Glutamic acid
Glutamic acid, 2-aminopentanedioic acid (C5H9NO4), is another example illustrating the roleplayed by conformation on crystallization. Two conformational polymorphs have beenidentified for this compound, labeled as α and β, with the latter being the thermodynamical‐ly stable form over all temperature range [74-77]. The crystals have different morphologies:the metastable form exhibits a prismatic shape while the stable one has a needle-like shape.Both belong to the ortorrombic space group with four molecules in the unit cell (Z=4) [78,79]. In the crystal lattice the molecules are in the zwitterionic state and all functional groupsparticipate in a complex intermolecular hydrogen bonding network [63].
The conformations adopted by the L-glutamic acid molecules in the two polymorphs aredisplayed in Figure 9. Their main difference lies in the orientation of the two C-C-C-C dihe‐dral angles. In the crystal lattice the C(1)-C(2)-C(3)-C(4) and C(2)-C(3)-C(4)-C(5) dihedralsassume, respectively, values of 59.2°, 68.3° in α and -171.1°, -73.1° in β. Using the same dihe‐dral labeling scheme previously adopted for the polyols, the conformation of glutamic acidin the α and β-crystals is gg and tg’, respectively. Depending on the experimental conditions,namely the temperature, both polymorphs can be crystallized from aqueous solution. Cool‐ing a supersaturated solution to temperatures below 25°C originates almost pure α-crystals,whereas as the temperature raises the proportion of form β in the precipitated crystals in‐creases. For example at 45°C, the fraction of β-crystals is 45% [74, 75].
The conformational behavior of zwitterionic glutamic acid is aqueous solution is a usefulstarting point to understand the crystallization of this compound in molecular terms. Thishas been done theoretically by performing full geometry optimizations using the CPCMcontinuum solvation model and the B3LYP/aug-cc-pVDZ model chemistry, both imple‐mented in the Gaussian 03 program. The cavity was built with the Bondii radii which havebeen found to yield accurate results for the hydration of similar molecules in the zwitterion‐ic state, such for example glycine [80]. Nine starting geometries were built by assuming thethree standard orientations (g, g’ and t) for each one of the C-C-C-C dihedrals. The remain‐ing dihedrals were kept in their preferred orientations. The optimized structures were fur‐ther submitted to a vibrational frequency calculation at the same level to ensure that theycorrespond to minima on the aqueous potential energy surface and also to calculate the ther‐mal corrections at 298.15K.
The Gibbs energies of the conformers in aqueous solution at 298.15 K (Gsol) can be expressed as:Gsol = Eint + ΔGthermal + ΔGhyd, with Eint representing the intrinsic (abbreviated as “int”) electronicenergy of the conformer at 0 K, i.e., excluding solvent effects, ΔGthermal the thermal correction tothe Gibbs energy from 0 to 298K and ΔGhyd the Gibbs energy of hydration at 298.15K. The val‐ues of Eint, Gsol, ΔGhyd, as well as the equilibrium populations at 298.15 K, are given in Table 3. Inthis table are also included the values of the C(1)-C(2)-C(3)-C(3) and C(2)-C(3)-C(4)-C(5) dihe‐drals, abbreviated as D(1) and D(2), respectively. The relative stability of the conformers in sol‐ution is governed by a balance between two effects: interaction with the solvent (quantified byΔGhyd) and intramolecular interaction (quantified by Eint). In general, conformers with a favora‐
Crystallization: From the Conformer to the Crystalhttp://dx.doi.org/10.5772/54447
213
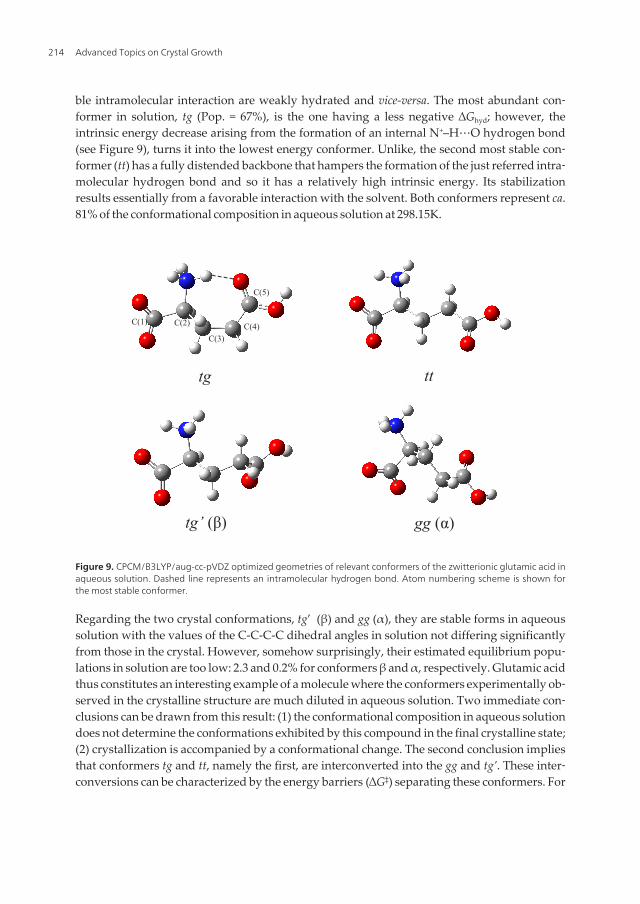
ble intramolecular interaction are weakly hydrated and vice-versa. The most abundant con‐former in solution, tg (Pop. = 67%), is the one having a less negative ∆Ghyd; however, theintrinsic energy decrease arising from the formation of an internal N+–H‧‧‧O hydrogen bond(see Figure 9), turns it into the lowest energy conformer. Unlike, the second most stable con‐former (tt) has a fully distended backbone that hampers the formation of the just referred intra‐molecular hydrogen bond and so it has a relatively high intrinsic energy. Its stabilizationresults essentially from a favorable interaction with the solvent. Both conformers represent ca.81% of the conformational composition in aqueous solution at 298.15K.
tg tt
tg’ (β) gg (α)
C(1) C(2)
C(3)C(4)
C(5)
Figure 9. CPCM/B3LYP/aug-cc-pVDZ optimized geometries of relevant conformers of the zwitterionic glutamic acid inaqueous solution. Dashed line represents an intramolecular hydrogen bond. Atom numbering scheme is shown forthe most stable conformer.
Regarding the two crystal conformations, tg’ (β) and gg (α), they are stable forms in aqueoussolution with the values of the C-C-C-C dihedral angles in solution not differing significantlyfrom those in the crystal. However, somehow surprisingly, their estimated equilibrium popu‐lations in solution are too low: 2.3 and 0.2% for conformers β and α, respectively. Glutamic acidthus constitutes an interesting example of a molecule where the conformers experimentally ob‐served in the crystalline structure are much diluted in aqueous solution. Two immediate con‐clusions can be drawn from this result: (1) the conformational composition in aqueous solutiondoes not determine the conformations exhibited by this compound in the final crystalline state;(2) crystallization is accompanied by a conformational change. The second conclusion impliesthat conformers tg and tt, namely the first, are interconverted into the gg and tg’. These inter‐conversions can be characterized by the energy barriers (∆G‡) separating these conformers. For
Advanced Topics on Crystal Growth214
this purpose, we have used the synchronous transit-guided quasi-Newton method (STQN)[81] in its QST2 variety at the CPCM/B3LYP/aug-cc-pVDZ level. The activation energies corre‐sponding to the interconversion of the most stable conformer into conformers α and β were cal‐culated to be ∆G‡ = 18 and 29 kJ mol-1, respectively. This barrier height difference may help toexplain the preferential crystallization of form α at temperatures below 25°C and the increaseof the percentage of form β in the crystals obtained at higher temperatures. Apparently, the de‐pendence of the crystallization behavior of glutamic acid on temperature is not due to a changeon the relative abundance of the crystallizing conformers in solution with temperature [75], butrather to the value of the energy barriers for the interconversion of the most stable conformer insolution into the α and β conformers.
Conf.Dihedral angles/º Eint/
kJ mol-1
-ΔGhyd/
kJ mol-1
Gsol/
kJ mol-1
Pop.
(%)D(1) D(2)
tg 178.5 75.3 13.1 184.8 0.0 67.1
tt 168.9 -177.2 56.9 223.7 3.9 13.6
g’g’ -52.5 -79.9 0.0 168.2 4.8 9.8
gt 63.1 178.8 36.4 196.1 7.4 3.5
g´t -56.5 178.7 52.1 213.7 7.7 3.0
tg’(β) 172.5 -69.8 59.6 221.9 8.4 2.3
gg’ 62.4 -85.1 49.8 208.1 12.5 0.4
gg(α) 66.1 61.1 54.7 210.5 14.0 0.2
g´g -61.7 81.4 71.1 225.3 18.3 0.0
Table 3. Dihedral angles, intrinsic electronic energies at 0K (Eint), Gibbs energies in aqueous solution (Gsol), Gibbsenergies of hydration (ΔGhyd) and Boltzmann populations (Pop.) at 298.15K of the zwitterionic glutamic acidconformers, calculated at the CPCM/B3LYP/aug-cc-pVDZ level.
6. Molecular dynamics study of pre-nucleation clusters
The molecular aggregates individualized in the early stages of nucleation (pre-nucleation)are windows to follow the crystallization process. Data on the self-assembly of erythritoland L-threitol in supersaturated aqueous solutions are reported through molecular dynam‐ics (MD) simulations. MD is one of the most comprehensive computer simulation tools, withenormous application in the study of large systems and molecular phenomena requiringlonger observation times. Relevant molecular phenomena are often adequately described byclassical mechanics, providing reliable force-fields are available for a variety of systems. Theresults of the MD simulations presented in this chapter were carried out in the NpT ensem‐ble and under periodic boundary conditions, resorting to the GROMACS package, version4.5.4 [82] and GROMOS 96 43a1 force field [83]. Long-range electrostatics was computed us‐ing the particle mesh Ewald (PME) method, while for Lennard-Jones energies a cut-off of 1.4
Crystallization: From the Conformer to the Crystalhttp://dx.doi.org/10.5772/54447
215
nm was applied. Temperature (298K) and pressure (1bar) were coupled to Berendsen exter‐nal baths, with coupling constants of 0.1 and 0.5 ps, respectively. Each system was firstlysubjected to an energy minimization step, and then left to evolve up to 80ns, using in bothparts a standard time step of 2 fs. The last 40 ns of production runs were subsequently sub‐jected to standard analysis, such as radial distribution functions [RDF, g(r)].
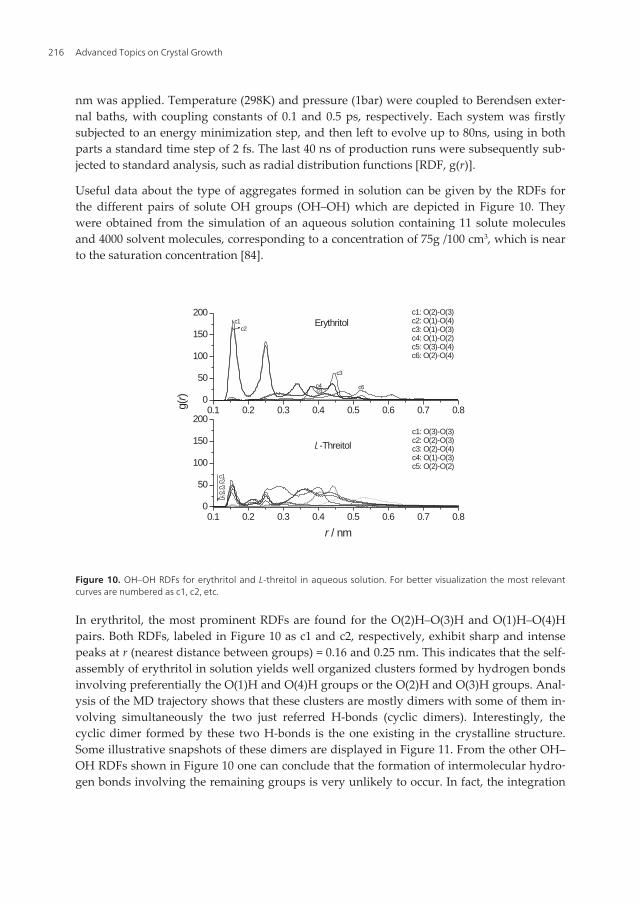
Useful data about the type of aggregates formed in solution can be given by the RDFs forthe different pairs of solute OH groups (OH–OH) which are depicted in Figure 10. Theywere obtained from the simulation of an aqueous solution containing 11 solute moleculesand 4000 solvent molecules, corresponding to a concentration of 75g /100 cm3, which is nearto the saturation concentration [84].
0.1 0.2 0.3 0.4 0.5 0.6 0.7 0.80
50
100
150
200
c6c5c4
c3
c2
g(r)
c1c1: O(2)-O(3)c2: O(1)-O(4)c3: O(1)-O(3)c4: O(1)-O(2)c5: O(3)-O(4)c6: O(2)-O(4)
r / nm
Erythritol
0.1 0.2 0.3 0.4 0.5 0.6 0.7 0.80
50
100
150
200
L-Threitol
c1: O(3)-O(3)c2: O(2)-O(3)c3: O(2)-O(4)c4: O(1)-O(3)c5: O(2)-O(2)
c5c4c3c2c1
Figure 10. OH–OH RDFs for erythritol and L-threitol in aqueous solution. For better visualization the most relevantcurves are numbered as c1, c2, etc.
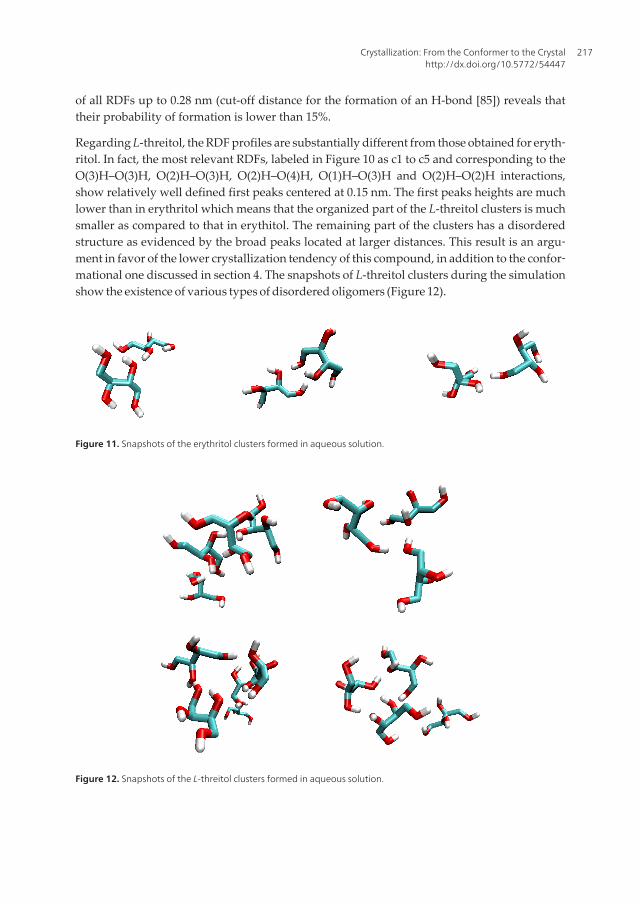
In erythritol, the most prominent RDFs are found for the O(2)H–O(3)H and O(1)H–O(4)Hpairs. Both RDFs, labeled in Figure 10 as c1 and c2, respectively, exhibit sharp and intensepeaks at r (nearest distance between groups) = 0.16 and 0.25 nm. This indicates that the self-assembly of erythritol in solution yields well organized clusters formed by hydrogen bondsinvolving preferentially the O(1)H and O(4)H groups or the O(2)H and O(3)H groups. Anal‐ysis of the MD trajectory shows that these clusters are mostly dimers with some of them in‐volving simultaneously the two just referred H-bonds (cyclic dimers). Interestingly, thecyclic dimer formed by these two H-bonds is the one existing in the crystalline structure.Some illustrative snapshots of these dimers are displayed in Figure 11. From the other OH–OH RDFs shown in Figure 10 one can conclude that the formation of intermolecular hydro‐gen bonds involving the remaining groups is very unlikely to occur. In fact, the integration
Advanced Topics on Crystal Growth216
of all RDFs up to 0.28 nm (cut-off distance for the formation of an H-bond [85]) reveals thattheir probability of formation is lower than 15%.
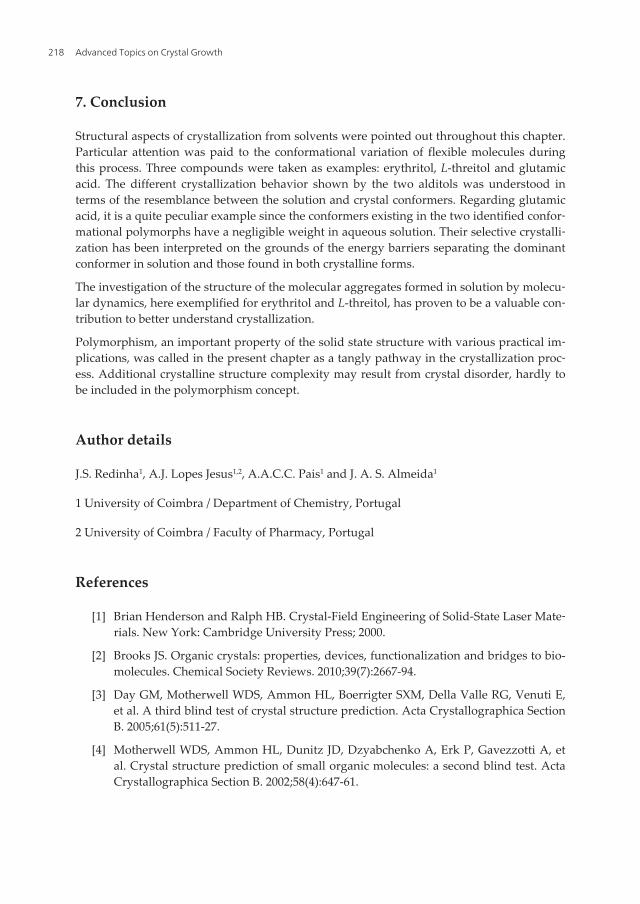
Regarding L-threitol, the RDF profiles are substantially different from those obtained for eryth‐ritol. In fact, the most relevant RDFs, labeled in Figure 10 as c1 to c5 and corresponding to theO(3)H–O(3)H, O(2)H–O(3)H, O(2)H–O(4)H, O(1)H–O(3)H and O(2)H–O(2)H interactions,show relatively well defined first peaks centered at 0.15 nm. The first peaks heights are muchlower than in erythritol which means that the organized part of the L-threitol clusters is muchsmaller as compared to that in erythitol. The remaining part of the clusters has a disorderedstructure as evidenced by the broad peaks located at larger distances. This result is an argu‐ment in favor of the lower crystallization tendency of this compound, in addition to the confor‐mational one discussed in section 4. The snapshots of L-threitol clusters during the simulationshow the existence of various types of disordered oligomers (Figure 12).
Figure 11. Snapshots of the erythritol clusters formed in aqueous solution.
Figure 12. Snapshots of the L-threitol clusters formed in aqueous solution.
Crystallization: From the Conformer to the Crystalhttp://dx.doi.org/10.5772/54447
217
7. Conclusion
Structural aspects of crystallization from solvents were pointed out throughout this chapter.Particular attention was paid to the conformational variation of flexible molecules duringthis process. Three compounds were taken as examples: erythritol, L-threitol and glutamicacid. The different crystallization behavior shown by the two alditols was understood interms of the resemblance between the solution and crystal conformers. Regarding glutamicacid, it is a quite peculiar example since the conformers existing in the two identified confor‐mational polymorphs have a negligible weight in aqueous solution. Their selective crystalli‐zation has been interpreted on the grounds of the energy barriers separating the dominantconformer in solution and those found in both crystalline forms.
The investigation of the structure of the molecular aggregates formed in solution by molecu‐lar dynamics, here exemplified for erythritol and L-threitol, has proven to be a valuable con‐tribution to better understand crystallization.
Polymorphism, an important property of the solid state structure with various practical im‐plications, was called in the present chapter as a tangly pathway in the crystallization proc‐ess. Additional crystalline structure complexity may result from crystal disorder, hardly tobe included in the polymorphism concept.
Author details
J.S. Redinha1, A.J. Lopes Jesus1,2, A.A.C.C. Pais1 and J. A. S. Almeida1
1 University of Coimbra / Department of Chemistry, Portugal
2 University of Coimbra / Faculty of Pharmacy, Portugal
References
[1] Brian Henderson and Ralph HB. Crystal-Field Engineering of Solid-State Laser Mate‐rials. New York: Cambridge University Press; 2000.
[2] Brooks JS. Organic crystals: properties, devices, functionalization and bridges to bio-molecules. Chemical Society Reviews. 2010;39(7):2667-94.
[3] Day GM, Motherwell WDS, Ammon HL, Boerrigter SXM, Della Valle RG, Venuti E,et al. A third blind test of crystal structure prediction. Acta Crystallographica SectionB. 2005;61(5):511-27.
[4] Motherwell WDS, Ammon HL, Dunitz JD, Dzyabchenko A, Erk P, Gavezzotti A, etal. Crystal structure prediction of small organic molecules: a second blind test. ActaCrystallographica Section B. 2002;58(4):647-61.
Advanced Topics on Crystal Growth218
[5] Lommerse JPM, Motherwell WDS, Ammon HL, Dunitz JD, Gavezzotti A, HofmannDWM, et al. A test of crystal structure prediction of small organic molecules. ActaCrystallographica Section B. 2000;56(4):697-714.
[6] Oganov AR, editor. Modern Methods of Crystal Structure Predictions. Weinheim:Wiley-VCH; 2011.
[7] Woodley SM, Catlow R. Crystal structure prediction from first principles. NatureMaterials. 2008;7(12):937-46.
[8] Oganov AR, Glass CW. Crystal structure prediction using ab initio evolutionarytechniques: Principles and applications. Journal of Chemical Physics. 2006;124(24):244704-15.
[9] Day GM, Cooper TG, Cruz-Cabeza AJ, Hejczyk KE, Ammon HL, Boerrigter SXM, etal. Significant progress in predicting the crystal structures of small organic molecules- a report on the fourth blind test. Acta Crystallographica Section B. 2009;65(2):107-25.
[10] Kim S, Orendt AM, Ferraro MB, Facelli JC. Crystal structure prediction of flexiblemolecules using parallel genetic algorithms with a standard force field. Journal ofComputational Chemistry. 2009;30(13):1973-85.
[11] Day GM, S. Motherwell WD, Jones W. A strategy for predicting the crystal structuresof flexible molecules: the polymorphism of phenobarbital. Physical Chemistry Chem‐ical Physics. 2007;9(14):1693-704.
[12] Hohenberg P, Kohn W. Inhomogeneous Electron Gas. Physical Review.1964;136(3B):B864-B71.
[13] Kohn W, Sham LJ. Self-Consistent Equations Including Exchange and Correlation Ef‐fects. Physical Review. 1965;140(4A):A1133-A8.
[14] Becke AD. Density-Functional Exchange-Energy Approximation with CorrectAsymptotic-Behavior. Physical Review A. 1988 Sep 15;38(6):3098-100.
[15] Becke AD. Density-Functional Thermochemistry.3. The Role of Exact Exchange. Jour‐nal of Chemical Physics. 1993 Apr 1;98(7):5648-52.
[16] Lee CT, Yang WT, Parr RG. Development of the Colle-Salvetti Correlation-EnergyFormula into a Functional of the Electron-Density. Physical Review B. 1988 Jan15;37(2):785-9.
[17] Dunning J, Thom H. Gaussian basis sets for use in correlated molecular calculations.I. The atoms boron through neon and hydrogen. Journal of Chemical Physics. 19891989/01/15/;90(2):1007-23.
[18] Woon DE, Dunning J, Thom H. Gaussian basis sets for use in correlated molecularcalculations. III. The atoms aluminum through argon. Journal of Chemical Physics.1993 1993/01/15/;98(2):1358-71.
Crystallization: From the Conformer to the Crystalhttp://dx.doi.org/10.5772/54447
219
[19] Krishnan R, Binkley JS, Seeger R, Pople JA. Self-consistent molecular orbital meth‐ods. XX. A basis set for correlated wave functions. Journal of Chemical Physics.1980;72(1):650-4.
[20] Cossi M, Rega N, Scalmani G, Barone V. Energies, structures, and electronic proper‐ties of molecules in solution with the C-PCM solvation model. Journal of Computa‐tional Chemistry. 2003 Apr 30;24(6):669-81.
[21] Cossi M, Barone V, Cammi R, Tomasi J. Ab initio study of solvated molecules: A newimplementation of the polarizable continuum model. Chemical Physics Letters. 1996Jun 14;255(4-6):327-35.
[22] Klamt A, Schuurmann G. Cosmo - a New Approach to Dielectric Screening in Sol‐vents with Explicit Expressions for the Screening Energy and Its Gradient. Journal ofthe Chemical Society- Perkin Transactions 2. 1993(5):799-805.
[23] Weissbuch I, Kuzmenko I, Vaida M, Zait S, Leiserowitz L, Lahav M. Twinned Crys‐tals of Enantiomorphous Morphology of Racemic Alanine Induced by Optically Re‐solved.alpha.-Amino Acids; A Stereochemical Probe for the Early Stages of CrystalNucleation. Chemistry of Materials. 1994 2012/09/14;6(8):1258-68.
[24] Etter MC. Hydrogen bonds as design elements in organic chemistry. Journal of Phys‐ical Chemistry. 1991 2012/09/14;95(12):4601-10.
[25] Weissbuch I, Lahav M, Leiserowitz L. Toward Stereochemical Control, Monitoring,and Understanding of Crystal Nucleation. Crystal Growth & Design. 20032012/09/14;3(2):125-50.
[26] Bernstein J. Polymorphism in Molecular Crystals. Oxford: Oxford University Press;2002.
[27] Hilfiker R, editor. Polymorphism in the Pharmaceutical Industry. Weinheim: Willey-VCH; 2006.
[28] Brittain HG, editor. Polymorphism in Pharmaceutical Solids. 2 ed. New York: Infor‐ma Healthcare USA, Inc; 2009.
[29] Nangia A. Conformational Polymorphism in Organic Crystals. Accounts of ChemicalResearch. 2008;41(5):595-604.
[30] J.W.Mullin. Crystallization. 4 ed. Oxford: Butterworth-Heinemann; 2001.
[31] Schmelzer JWP, editor. Nucleation Theory and Applications: WILEY-VCH; 2005.
[32] Laaksonen A, Talanquer V, Oxtoby DW. Nucleation: Measurements, Theory, and At‐mospheric Applications. Annual Review of Physical Chemistry. 1995;46(1):489-524.
[33] Steiner T. The hydrogen bond in the solid state. Angewandte Chemie, InternationalEdition in English. 2002;41(1):48-76.
Advanced Topics on Crystal Growth220
[34] Elangannan Arunan, Gautam R. Desiraju, Roger A. Klein, Joanna Sadlej, SteveScheiner, Ibon Alkorta, et al. Definition of the hydrogen bond (IUPAC Recommenda‐tions 2011). Pure and applied chemistry. 2011;83(8):1637-41.
[35] Lee SJ, Min A, Kim Y, Ahn A, Chang J, Lee SH, et al. Conformationally resolvedstructures of jet-cooled acetaminophen by UV-UV hole-burning spectroscopy. Physi‐cal Chemistry Chemical Physics. 2011;13(37):16537-41.
[36] McCrone WC. In: Fox D, Labes MM, Weissberger A, editors. Physics and Chemistryof the Organic Solid State. London: Interscience Publishers; 1965. p. 725-67.
[37] Singhal D, Curatolo W. Drug polymorphism and dosage form design: a practical per‐spective. Advanced Drug Delivery Reviews. 2004;56(3):335-47.
[38] Perlovich G, Volkova T, Bauer-Brandl A. Polymorphism of paracetamol. Journal ofThermal Analysis and Calorimetry. 2007;89(3):767-74.
[39] Kolesov BA, Mikhailenko MA, Boldyreva EV. Dynamics of the intermolecular hydro‐gen bonds in the polymorphs of paracetamol in relation to crystal packing and con‐formational transitions: a variable-temperature polarized Raman spectroscopy study.Physical Chemistry Chemical Physics. 2011;13(31):14243-53.
[40] Boldyreva E, Drebushchak V, Paukov I, Kovalevskaya Y, Drebushchak T. DSC andadiabatic calorimetry study of the polymorphs of paracetamol. Journal of ThermalAnalysis and Calorimetry. 2004;77(2):607-23.
[41] Di Martino P, Conflant P, Drache M, Huvenne JP, Guyot-Hermann AM. Preparationand physical characterization of forms II and III of paracetamol. Journal of ThermalAnalysis and Calorimetry. 1997;48(3):447-58.
[42] Haisa M, Kashino S, Kawai R, Maeda H. The Monoclinic Form of p-Hydroxyacetani‐lide. Acta Crystallographica Section B-Structural Science. 1976;32(4):1283-5.
[43] Bouhmaida N, Bonhomme F, Guillot B, Jelsch C, Ghermani NE. Charge density andelectrostatic potential analyses in paracetamol. Acta Crystallographica Section B.2009;65(3):363-74.
[44] Haisa M, Kashino S, Maeda H. The orthorhombic form of p-hydroxyacetanilide. ActaCrystallographica Section B. 1974;30(10):2510-2.
[45] Nichols G, Frampton CS. Physicochemical characterization of the orthorhombic poly‐morph of paracetamol crystallized from solution. Journal of Pharmaceutical Sciences.1998;87(6):684-93.
[46] Burgina EB, Baltakhinov VP, Boldyreva EV, Shakhtschneider TP. IR Spectra of Para‐cetamol and Phenacetin. 1. Theoretical and Experimental Studies. Journal of Structur‐al Chemistry. 2004;45(1):64-73.
[47] Ivanova BB. Monoclinic and orthorhombic polymorphs of paracetamol - solid statelinear dichroic infrared spectral analysis. Journal of Molecular Structure.2005;738(1-3):233-8.
Crystallization: From the Conformer to the Crystalhttp://dx.doi.org/10.5772/54447
221
[48] Iogansen AV. Direct proportionality of the hydrogen bonding energy and the intensi‐fication of the stretching v(XH) vibration in infrared spectra. Spectrochimica Acta,Part A: Molecular and Biomolecular Spectroscopy. 1999;55(7-8):1585-612.
[49] Wendy C. Duncan-Hewitt, Grant DJW. True density and thermal expansivity ofpharmaceutical solids: comparison of methods and assessment of crystallinity. Inter‐national Journal of Pharmaceutics. 1986;28(1):75-84.
[50] Joiris E, Martino PD, Berneron C, Guyot-Hermann A-M, Guyot J-C. Compression Be‐havior of Orthorhombic Paracetamol. Pharmaceutical Research. 1998;15(7):1122-30.
[51] Di Martino P, Guyot-Hermann AM, Conflant P, Drache M, Guyot JC. A new pureparacetamol for direct compression: The orthorhombic form. International Journal ofPharmaceutics. 1996;128:1-8.
[52] Roth GJ, Calverley DC. Aspirin, Platelets, and Thrombosis: Theory and Practice.Blood. 1994;83(4):885-98.
[53] Wheatley PJ. The crystal and molecular structure of aspirin. Journal of the ChemicalSociety (Resumed). 1964:6036-48.
[54] Ouvrard C, Price SL. Toward Crystal Structure Prediction for Conformationally Flex‐ible Molecules: The Headaches Illustrated by Aspirin. Crystal Growth & Design.2004;4(6):1119-27.
[55] Vishweshwar P, McMahon JA, Oliveira M, Peterson ML, Zaworotko MJ. The Predict‐ably Elusive Form II of Aspirin. Journal of the American Chemical Society. 20052012/09/10;127(48):16802-3.
[56] Bond AD, Boese R, Desiraju GR. On the Polymorphism of Aspirin. AngewandteChemie International Edition. 2007;46(4):615-7.
[57] Chang C-J, Díaz LE, Morin F, Grant DM. Solid-state 13C NMR study of drugs: Aspir‐in. Magnetic Resonance in Chemistry. 1986;24(9):768-71.
[58] Wen S, Beran GJO. Accidental Degeneracy in Crystalline Aspirin: New Insights fromHigh-Level ab Initio Calculations. Crystal Growth & Design. 2012 2012/09/10;12(5):2169-72.
[59] Bond AD, Boese R, Desiraju GR. What Is A Polymorph? Aspirin As A Case Study.American Pharmaceutical Review. 2007:1-4.
[60] Glusker JP, Lewis M, Rossi M. Crystal Structure Analysis for Chemists and Biologists(Methods in Stereochemical Analysis). New York: Wiley-VCH; 1994.
[61] Wilson CC. A basic introduction to thermal motions of atoms in crystal structures,the underlying potentials and the physical information available from their analysis.Crystallography Reviews. 2009 2012/09/11;15(1):3-56.
Advanced Topics on Crystal Growth222
[62] Habgood M, Grau-Crespo R, Price SL. Substitutional and orientational disorder inorganic crystals: a symmetry-adapted ensemble model. Physical Chemistry ChemicalPhysics. 2011;13(20):9590-600.
[63] Redinha JS, Lopes Jesus AJ. Molecular Recognition and Crystal Growth. In: McEvoyJA, editor. Molecular Recognition: Biotechnology, Chemical Engineering and Materi‐als Applications: Novapublishers; 2011.
[64] Redinha JS, Lopes Jesus AJ. Crystal Growth of Pharmaceuticals from Melt. In: Bori‐senko E, editor. Crystallization and material science of modern artificial and naturalcrystals. Rijeka: InTech; 2012.
[65] Pascard C, Tran Huu Dau E, Manoury P, Mompon B. Betaxolol hydrochloride: 1-{4-[2-(cyclopropylmethoxy)ethyl]phenoxy}-3-isopropylamino-2-propanol hydrochlor‐ide, C18H30NO3+.Cl. Acta Crystallographica, Section C: Crystal StructureCommunications. 1984;40(8):1430-2.
[66] Lopes Jesus AJ, Nunes SCC, Ramos Silva M, Matos Beja A, Redinha JS. Erythritol:Crystal growth from the melt. International Journal of Pharmaceutics. 2010;388(1-2):129-35.
[67] Lopes Jesus AJ, Redinha JS. On the structure of erythritol and L-threitol in the solidstate: An infrared spectroscopic study. Journal of Molecular Structure. 2009;938(1-3):156-64.
[68] Yu L, Reutzel-Edens SM, Mitchell CA. Crystallization and Polymorphism of Confor‐mationally Flexible Molecules: Problems, Patterns, and Strategies. Organic ProcessResearch & Development. 2000 2012/09/14;4(5):396-402.
[69] Lopes Jesus AJ, Tomé LIN, Rosado MTS, Leitão MLP, Redinha JS. Conformationalstudy of erythritol and threitol in the gas state by density functional theory calcula‐tions. Carbohydrate Research. 2005;340(2):283-91.
[70] Lopes Jesus AL, Tomé LIN, Eusébio MES, Redinha JS. Determination of the Enthalpyof Solute-Solvent Interaction from the Enthalpy of Solution: Aqueous Solutions of Er‐ythritol and L-Threitol. Journal of Physical Chemistry B. 2006 May 11, 2006;110(18):9280-5.
[71] Ceccarelli C, Jeffrey GA, McMullan RK. A Neutron-Diffraction Refinement of theCrystal-Structure of Erythritol at 22.6 K. Acta Crystallographica Section B.1980;36:3079-83.
[72] Kopf J, Morf M, Zimmer B, Haupt ETK, Jarchow O, Köll P. The crystal and molecularstructure of threitol. Carbohydrate Research. 1993;247:119-28.
[73] Jeffrey GA, Kim HS. Conformations of the alditols. Carbohydrate Research.1970;14(2):207-16.
[74] Kitamura M. Polymorphism in the crystallization of L-glutamic acid. Journal of Crys‐tal Growth. 1989;96(3):541-6.
Crystallization: From the Conformer to the Crystalhttp://dx.doi.org/10.5772/54447
223
[75] Kitamura M. Controlling factor of polymorphism in crystallization process. Journalof Crystal Growth. 2002;237-239:2205-14.
[76] Davey RJ, Blagden N, Potts GD, Docherty R. Polymorphism in Molecular Crystals:Stabilization of a Metastable Form by Conformational Mimicry. Journal of the Ameri‐can Chemical Society. 1997;119(7):1767-72.
[77] Ono T, ter Horst JH, Jansens PJ. Quantitative Measurement of the PolymorphicTransformation of l-Glutamic Acid Using In-Situ Raman Spectroscopy. CrystalGrowth & Design. 2004;4(3):465-9.
[78] Lehmann M, Koetzle T, Hamilton W. Precision neutron diffraction structure determi‐nation of protein and nucleic acid components. VII. The crystal and molecular struc‐ture of the amino acid L-lysine monohydrochloride dihydrate. Journal of ChemicalCrystallography. 1972;2(5):225-33.
[79] Lehmann MS, Nunes AC. A short hydrogen bond between near identical carboxylgroups in the [alpha]-modification of l-glutamic acid. Acta Crystallographica, SectionB: Structural Science. 1980;36(7):1621-5.
[80] Kim CK, Park B-H, Lee HW, Kim CK. Comprehensive Studies on the Free Energiesof Solvation and Conformers of Glycine: A Theoretical Study. Bulletin of the KoreanChemical Society. 2011;32(6):1985 - 92.
[81] Peng CY, Ayala PY, Schlegel HB, Frisch MJ. Using redundant internal coordinates tooptimize equilibrium geometries and transition states. Journal of ComputationalChemistry. 1996;17(1):49-56.
[82] Hess B, Kutzner C, van der Spoel D, Lindahl E. GROMACS 4: Algorithms for HighlyEfficient, Load-Balanced, and Scalable Molecular Simulation. Journal of ChemicalTheory and Computation. 2008;4(3):435-47.
[83] Schuttelkopf AW, van Aalten DMF. PRODRG: a tool for high-throughput crystallog‐raphy of protein-ligand complexes. Acta Crystallographica Section D. 2004;60(8):1355-63.
[84] Cohen S, Marcus Y, Migron Y, Dikstein S, Shafran A. Water sorption, binding andsolubility of polyols. Journal of the Chemical Society, Faraday Transactions.1993;89(17):3271-5.
[85] Gilli G, Gilli P. Towards an unified hydrogen-bond theory. Journal of MolecularStructure. 2000;552(1-3):1-15.
Advanced Topics on Crystal Growth224


![Influence of heat conducting substrates on explosive crystallization … · 2017-04-11 · crystallization fronts based on rate equations for crystal-lization [4] has been presented](https://img.pdfslide.net/doc/110x75/5e7ac226dbe503702a659175/influence-of-heat-conducting-substrates-on-explosive-crystallization-2017-04-11.jpg)