Embed Size (px)
Citation preview
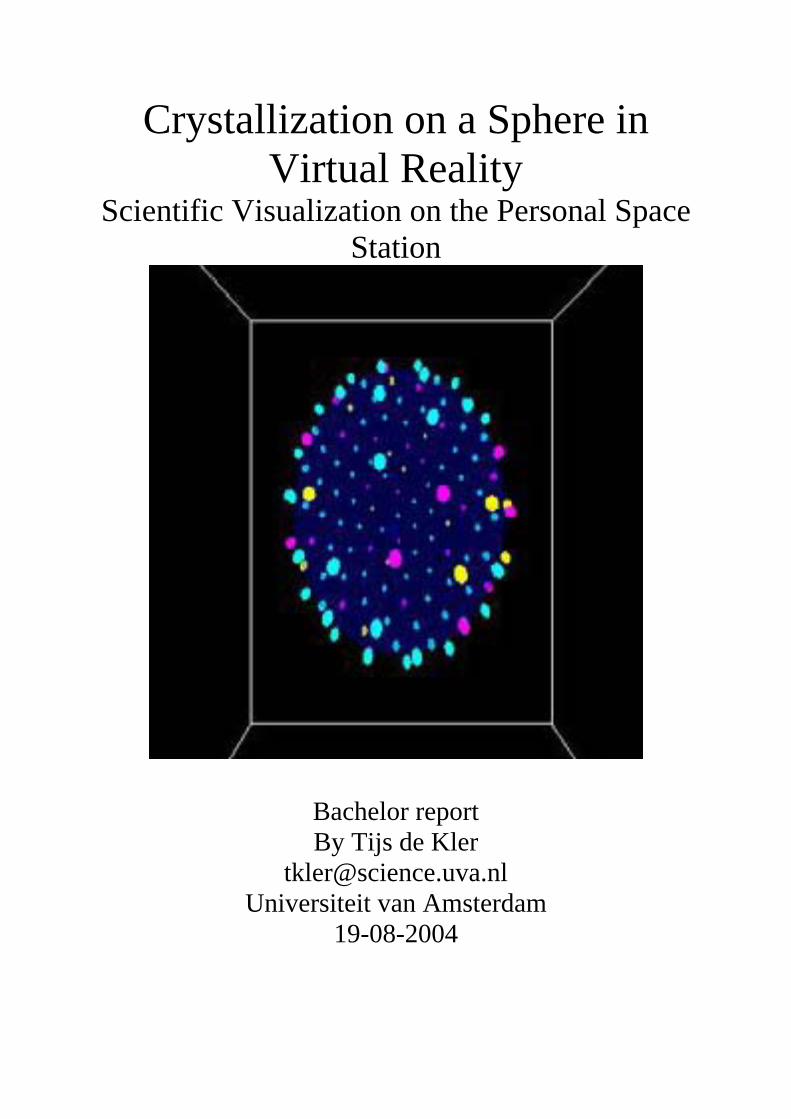
Crystallization on a Sphere in Virtual Reality
Scientific Visualization on the Personal Space Station
Bachelor report By Tijs de Kler
[email protected] Universiteit van Amsterdam
19-08-2004
2
Abstract The Personal Space Station (PSS) is a desktop Virtual Reality system designed for easy interaction with manipulators. To get a better understanding on how to optimally use the PSS for scientific visualization, we designed and built an application for visualizing crystallization of point particles on a sphere. The dataset consists of molecules forming patterns on the surface of a sphere, using Lennard-Jones interaction. Primary goal for the application is to enable easy and intuitive interaction within the application by using the interaction features the PSS provides.
3
Contents Title page
1
Abstract
2
Contents
3
Chapter 1: Introduction
4
Chapter 2: Crystallisation on a Sphere
6
Chapter 3: The Personal Space Station
8
Chapter 4: Design and Functionality
10
Chapter 5: The Results 5.2: Detailed components 5.3: Screenshots 5.4: Modes of visualization 5.5: Interaction 5.5: Known issues
13 13 15 16 17 17
Chapter 6: Discussion
18
Future Work Acknowledgements
19 20
References
21
4
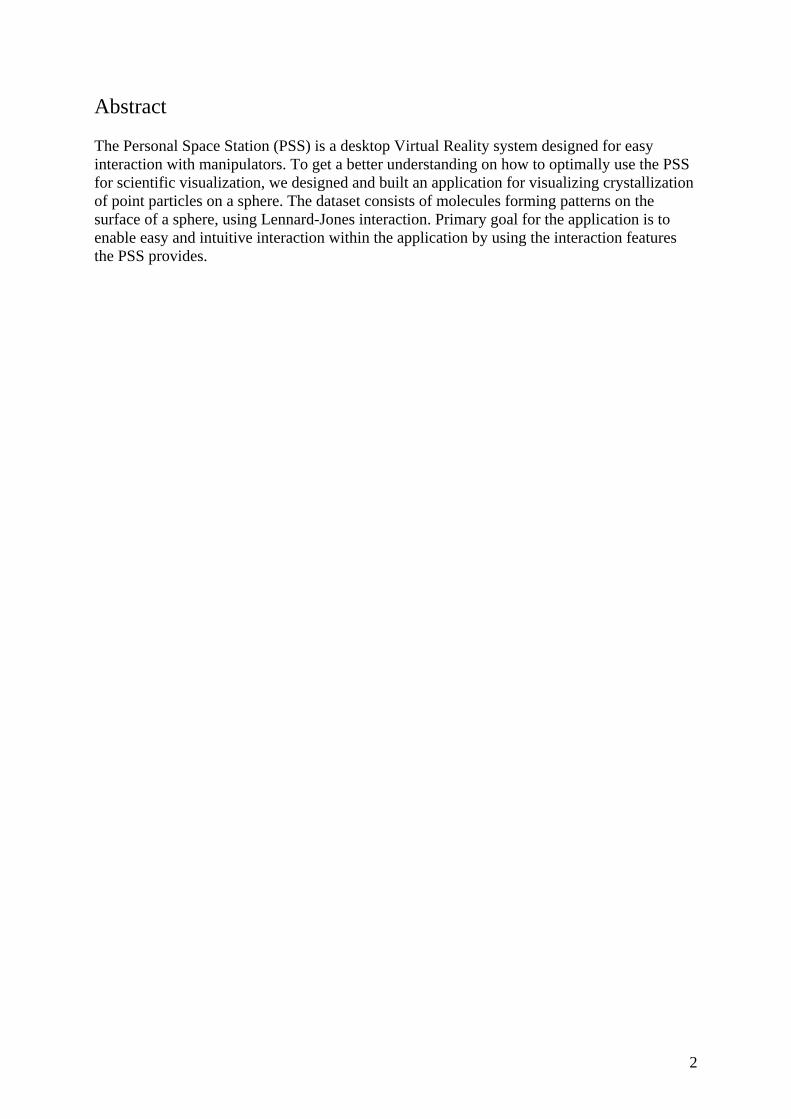
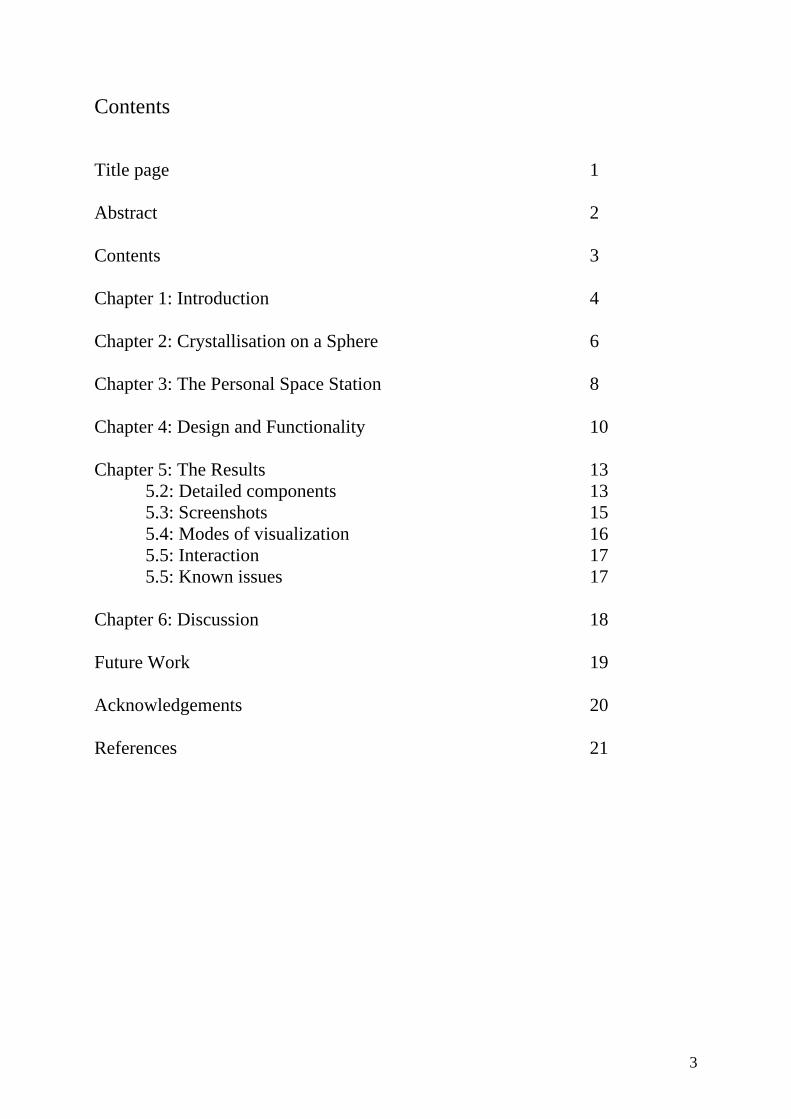
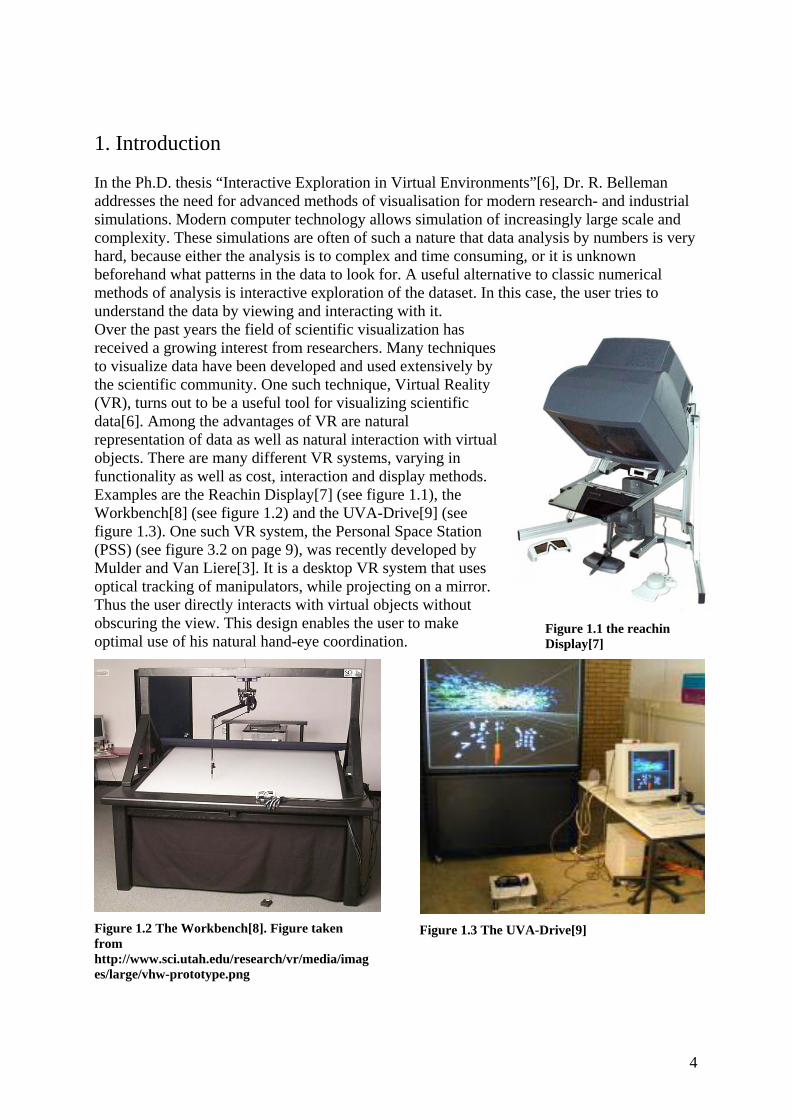
1. Introduction In the Ph.D. thesis “Interactive Exploration in Virtual Environments”[6], Dr. R. Belleman addresses the need for advanced methods of visualisation for modern research- and industrial simulations. Modern computer technology allows simulation of increasingly large scale and complexity. These simulations are often of such a nature that data analysis by numbers is very hard, because either the analysis is to complex and time consuming, or it is unknown beforehand what patterns in the data to look for. A useful alternative to classic numerical methods of analysis is interactive exploration of the dataset. In this case, the user tries to understand the data by viewing and interacting with it. Over the past years the field of scientific visualization has received a growing interest from researchers. Many techniques to visualize data have been developed and used extensively by the scientific community. One such technique, Virtual Reality (VR), turns out to be a useful tool for visualizing scientific data[6]. Among the advantages of VR are natural representation of data as well as natural interaction with virtual objects. There are many different VR systems, varying in functionality as well as cost, interaction and display methods. Examples are the Reachin Display[7] (see figure 1.1), the Workbench[8] (see figure 1.2) and the UVA-Drive[9] (see figure 1.3). One such VR system, the Personal Space Station (PSS) (see figure 3.2 on page 9), was recently developed by Mulder and Van Liere[3]. It is a desktop VR system that uses optical tracking of manipulators, while projecting on a mirror. Thus the user directly interacts with virtual objects without obscuring the view. This design enables the user to make optimal use of his natural hand-eye coordination.
Figure 1.1 the reachin Display[7]
Figure 1.2 The Workbench[8]. Figure taken from http://www.sci.utah.edu/research/vr/media/images/large/vhw-prototype.png
Figure 1.3 The UVA-Drive[9]
5
The Section Computational Science1 has built its own version of the PSS, and aims to use it for scientific visualisation. It is however still an open question how to optimally use the PSS for scientific analysis of large and complex datasets. A reasonable way to address this question is by gathering actual user experience with the PSS. In this paper we will investigate the functionality of the PSS in the field of scientific visualization. As a use case, we will take a dataset to be visualized, and design an application to utilize the extra features the PSS provides compared to regular desktop systems. In the Ph.D. thesis “Crystallisation on a Sphere”[1], Dr.J.M. Voogd simulated the behaviour of particles on a sphere, as a model for the hydrophobic backbone of vesicles. These particles form certain patterns that are of interest to scientists. We assume that the dataset is suitable to be visualized on the PSS. It consists of particles defined on a spherical surface. The particles are free to move over the surface, under the influence of mutual interaction forces. Particles appear on all sides of the sphere. Required interaction modalities are: rotation, zooming and selecting individual particles. The goal of the project was to design a visualisation application on the PSS for the ‘particles on a sphere’ dataset. This application is of high value for the scientists working with the data. Moreover, this will provide us with a use case of scientific visualization with the PSS. We designed and built an application to explore the dataset of Crystallisation on a Sphere. Different aspects addressed in the application design are visualisation, interaction, and analysis. Main points are correct and clear visualisation of the dataset and easy and direct interaction with manipulators. In Chapter 2 we will take a look at the theory behind crystallization on a sphere and look at the data generated by the simulator used. Chapter 3 describes the PSS system and the software used for developing the application. We take a look at the advantages the PSS offers. In Chapter 4 we list the demands for functionality and explain the design choices that were made to ensure this. In Chapter 5 we give details about the software components and present screenshots of the resulting application. In Chapter 6 we discuss the results, user experience and possible future work.
1 http: //www.science.uva.nl/research/scsi
6
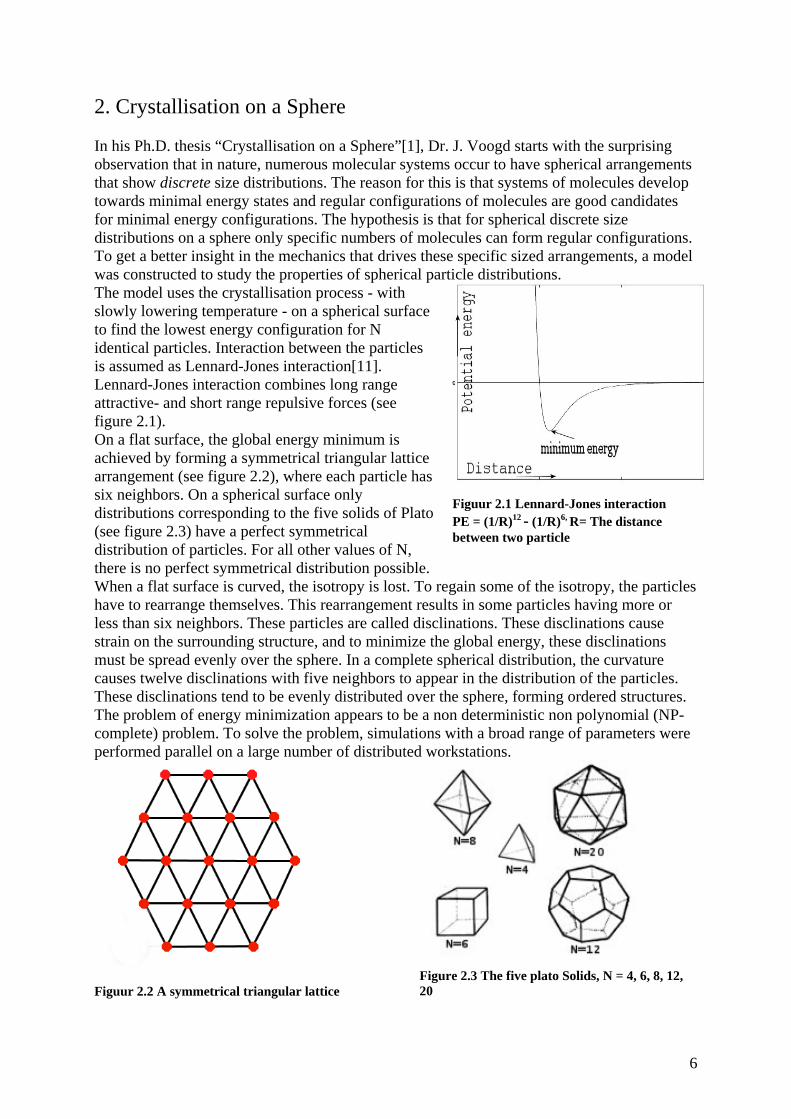
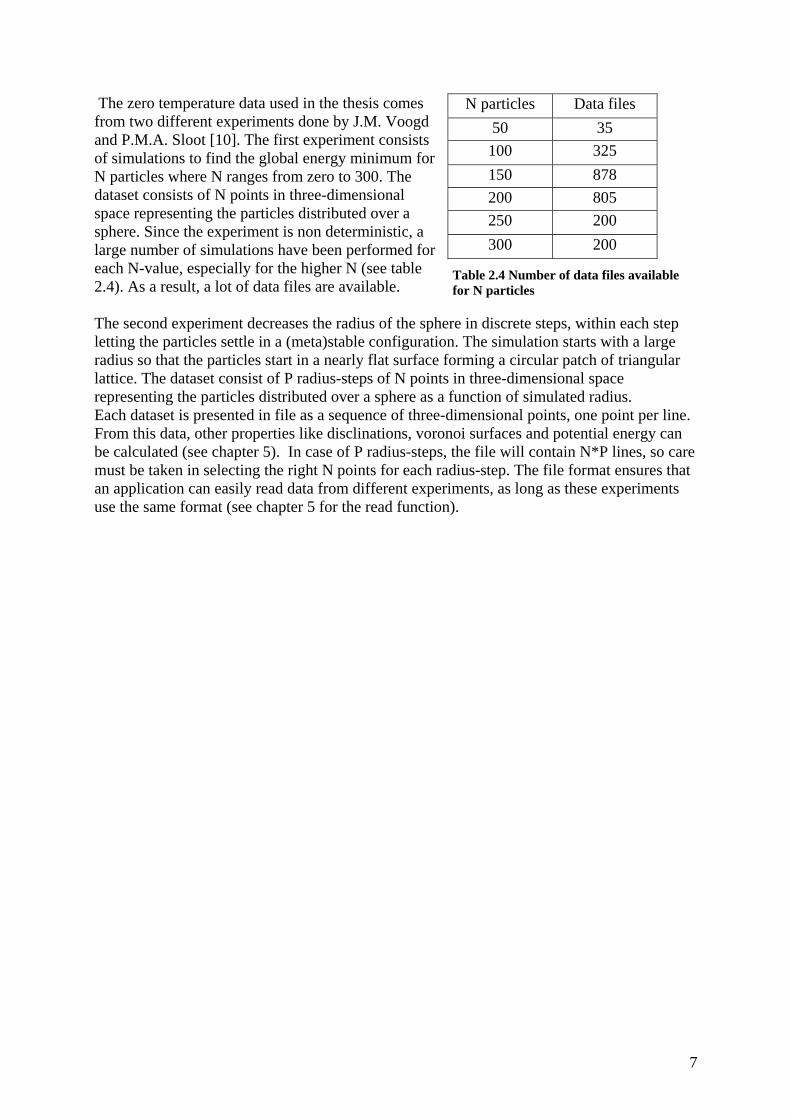
2. Crystallisation on a Sphere In his Ph.D. thesis “Crystallisation on a Sphere”[1], Dr. J. Voogd starts with the surprising observation that in nature, numerous molecular systems occur to have spherical arrangements that show discrete size distributions. The reason for this is that systems of molecules develop towards minimal energy states and regular configurations of molecules are good candidates for minimal energy configurations. The hypothesis is that for spherical discrete size distributions on a sphere only specific numbers of molecules can form regular configurations. To get a better insight in the mechanics that drives these specific sized arrangements, a model was constructed to study the properties of spherical particle distributions. The model uses the crystallisation process - with slowly lowering temperature - on a spherical surface to find the lowest energy configuration for N identical particles. Interaction between the particles is assumed as Lennard-Jones interaction[11]. Lennard-Jones interaction combines long range attractive- and short range repulsive forces (see figure 2.1). On a flat surface, the global energy minimum is achieved by forming a symmetrical triangular lattice arrangement (see figure 2.2), where each particle has six neighbors. On a spherical surface only distributions corresponding to the five solids of Plato (see figure 2.3) have a perfect symmetrical distribution of particles. For all other values of N, there is no perfect symmetrical distribution possible.
Figuur 2.1 Lennard-Jones interaction PE = (1/R)12 - (1/R)6, R= The distance between two particle
When a flat surface is curved, the isotropy is lost. To regain some of the isotropy, the particles have to rearrange themselves. This rearrangement results in some particles having more or less than six neighbors. These particles are called disclinations. These disclinations cause strain on the surrounding structure, and to minimize the global energy, these disclinations must be spread evenly over the sphere. In a complete spherical distribution, the curvature causes twelve disclinations with five neighbors to appear in the distribution of the particles. These disclinations tend to be evenly distributed over the sphere, forming ordered structures. The problem of energy minimization appears to be a non deterministic non polynomial (NP-complete) problem. To solve the problem, simulations with a broad range of parameters were performed parallel on a large number of distributed workstations.
Figuur 2.2 A symmetrical triangular lattice
Figure 2.3 The five plato Solids, N = 4, 6, 8, 12, 20
7
The zero temperature data used in the thesis comes from two different experiments done by J.M. Voogd and P.M.A. Sloot [10]. The first experiment consists of simulations to find the global energy minimum for N particles where N ranges from zero to 300. The dataset consists of N points in three-dimensional space representing the particles distributed over a sphere. Since the experiment is non deterministic, a large number of simulations have been performed for each N-value, especially for the higher N (see table 2.4). As a result, a lot of data files are available.
N particles Data files 50 35 100 325 150 878 200 805 250 200 300 200
Table 2.4 Number of data files available for N particles
The second experiment decreases the radius of the sphere in discrete steps, within each step letting the particles settle in a (meta)stable configuration. The simulation starts with a large radius so that the particles start in a nearly flat surface forming a circular patch of triangular lattice. The dataset consist of P radius-steps of N points in three-dimensional space representing the particles distributed over a sphere as a function of simulated radius. Each dataset is presented in file as a sequence of three-dimensional points, one point per line. From this data, other properties like disclinations, voronoi surfaces and potential energy can be calculated (see chapter 5). In case of P radius-steps, the file will contain N*P lines, so care must be taken in selecting the right N points for each radius-step. The file format ensures that an application can easily read data from different experiments, as long as these experiments use the same format (see chapter 5 for the read function).
8
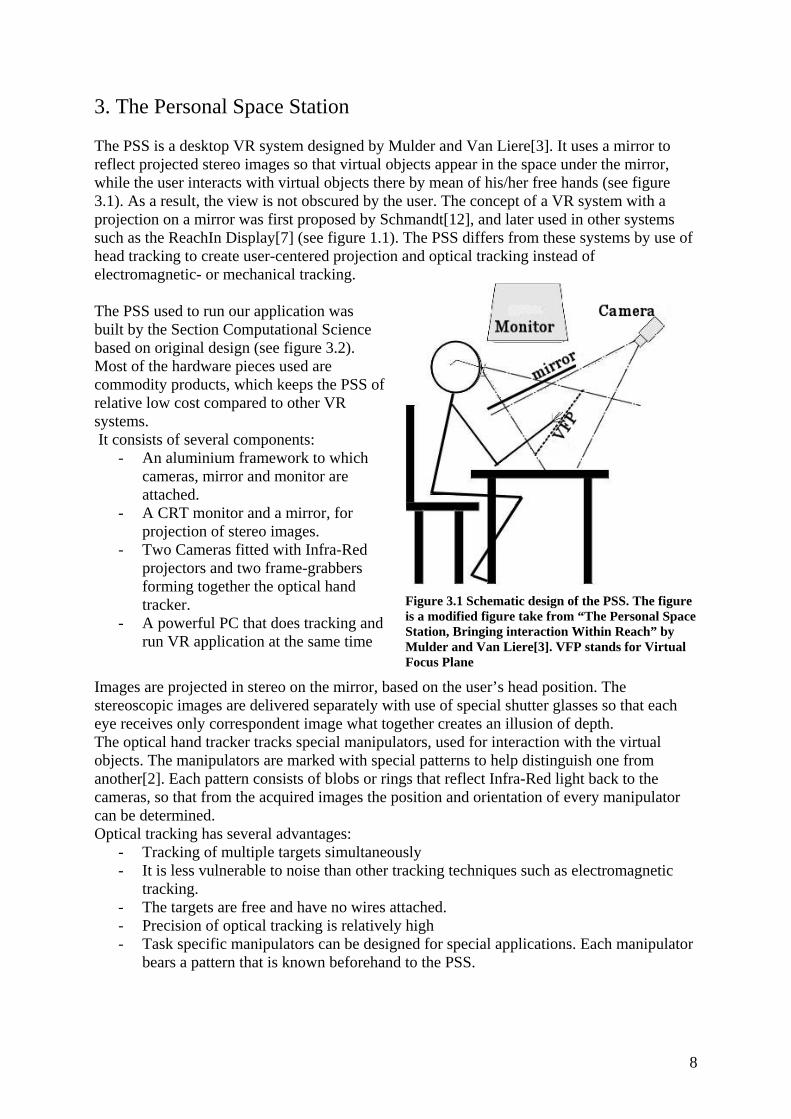
3. The Personal Space Station The PSS is a desktop VR system designed by Mulder and Van Liere[3]. It uses a mirror to reflect projected stereo images so that virtual objects appear in the space under the mirror, while the user interacts with virtual objects there by mean of his/her free hands (see figure 3.1). As a result, the view is not obscured by the user. The concept of a VR system with a projection on a mirror was first proposed by Schmandt[12], and later used in other systems such as the ReachIn Display[7] (see figure 1.1). The PSS differs from these systems by use of head tracking to create user-centered projection and optical tracking instead of electromagnetic- or mechanical tracking. The PSS used to run our application was built by the Section Computational Science based on original design (see figure 3.2). Most of the hardware pieces used are commodity products, which keeps the PSS of relative low cost compared to other VR systems. It consists of several components:
- An aluminium framework to which cameras, mirror and monitor are attached.
- A CRT monitor and a mirror, for projection of stereo images.
- Two Cameras fitted with Infra-Red projectors and two frame-grabbers forming together the optical hand tracker.
- A powerful PC that does tracking and run VR application at the same time
Figure 3.1 Schematic design of the PSS. The figure is a modified figure take from “The Personal Space Station, Bringing interaction Within Reach” by Mulder and Van Liere[3]. VFP stands for Virtual Focus Plane
Images are projected in stereo on the mirror, based on the user’s head position. The stereoscopic images are delivered separately with use of special shutter glasses so that each eye receives only correspondent image what together creates an illusion of depth. The optical hand tracker tracks special manipulators, used for interaction with the virtual objects. The manipulators are marked with special patterns to help distinguish one from another[2]. Each pattern consists of blobs or rings that reflect Infra-Red light back to the cameras, so that from the acquired images the position and orientation of every manipulator can be determined. Optical tracking has several advantages:
- Tracking of multiple targets simultaneously - It is less vulnerable to noise than other tracking techniques such as electromagnetic
tracking. - The targets are free and have no wires attached. - Precision of optical tracking is relatively high - Task specific manipulators can be designed for special applications. Each manipulator
bears a pattern that is known beforehand to the PSS.
9
There are two kinds of interaction devices for the PSS, controllers and manipulators. Controllers include buttons and joysticks. Joysticks are often used for navigating trough the virtual world and buttons to control the visualization. The keyboard is only used for starting and quitting applications, for keyboard interaction distracts from the VR experience, and so should not be used for anything else. PSS manipulators are tracked targets allowing one to interact with the VR world. PSS manipulators come in many forms, like a cube or a thimble. A manipulator can also have buttons attached, making it eventually two devices combined in one. Examples of interaction with manipulators are selecting objects, pointing in a direction or rotating objects.
Figure 3.2 The PSS at Section Computer Science, UvA
The software libraries used for developing our application on the PSS are OpenGL[5] and CaveLib[4]. OpenGL is a commonly used library for 3D drawing. The OpenGL library is used for drawing objects described as sets of polygons, create lighting depending on material properties, and to control object positions with transformations. CaveLib is a framework abstraction for development of VR applications. It does not draw any objects itself, but instead for each frame to be drawn, calls an external OpenGL function to do the actual drawing. Based on the position of the user’s head, CaveLib calculates the user-centred projection needed for proper perspective. For each frame CaveLib updates the properties of the virtual environment, and processes the input from the user.
The PSS is designed with an aim to perform interaction in a direct and natural way. The PSS manipulators give full control over 6 DOF (6 Degrees Of Freedom) (i.e. position and orientation) of the operated object simultaneously. The user-centred projection combined with the high spatial correspondence between the virtual objects and the manipulators, especially in the sense of moving and orienting, allows the user to make use of his or her natural hand-to-eye coordination. This makes the PSS a good system for highly interactive scientific visualisations.
10
4. Design and functionality In this project we designed and built an application for visualizing the ‘particles on a sphere’ dataset on the PSS, making optimal use of the features provided by the PSS. As a first step in the design, a list of desired functionality was made. 1. Real-time The application should be responsive enough to the user input, keeping reaction time under 50 milliseconds. Waiting to long for the input to take an effect on the application greatly decreases its operability. 2. Smooth visualisation/animation For smooth animation, the application should produce a minimum of 20 frames per second. Calculations performed for each frame should be minimized so that an acceptable frame rate can be achieved. 3. Intuitive and easy interaction The PPS is built to provide easy and intuitive interaction. The application should use simple and obvious interaction methods, so that the application can be learned quickly by new users. Interaction should include navigation through a VR world as well as selecting, moving and orientating individual objects in VR. 4. Several data formats At the start of this project only one data format was available. During the development, other data formats were added, and more might follow. The application should be able to deal with the known formats, and allow future formats to be added with little or no additional programming. 5. Clear and informative The goal of the application is clear and informative visualization of crystallisation process on a sphere in VR. The visualisation should be unambiguous, easy to understand and contain no graphical glitches. The visualisation should allow the user to easily locate and examine interesting features of the dataset. 6. Portable The application is designed and written for the PSS. However it is not difficult to design the application in a way that would be portable to other VR systems with little overhead, since it is built on top of the CaveLib library, which provides a handy abstract interface to different kind of VR hardware. In general, a component that is not easily portable is the one providing interaction, since it is often system specific. However, most VR systems use roughly the same interaction methods, such as pointing in the desired direction and pushing joystick for navigation. As an example, if a demonstration for several spectators is required, the application could run on the UVA-Drive[9] (see figure 1.3) as well, still providing enough means for interaction. 7. Analysis methods The dataset contains many interesting features for a scientist. Examples are disclinations, Voronoi surfaces and potential energy distributions (see chapter 5). More methods to analyze the dataset exist and can be added later (see Future work).
11
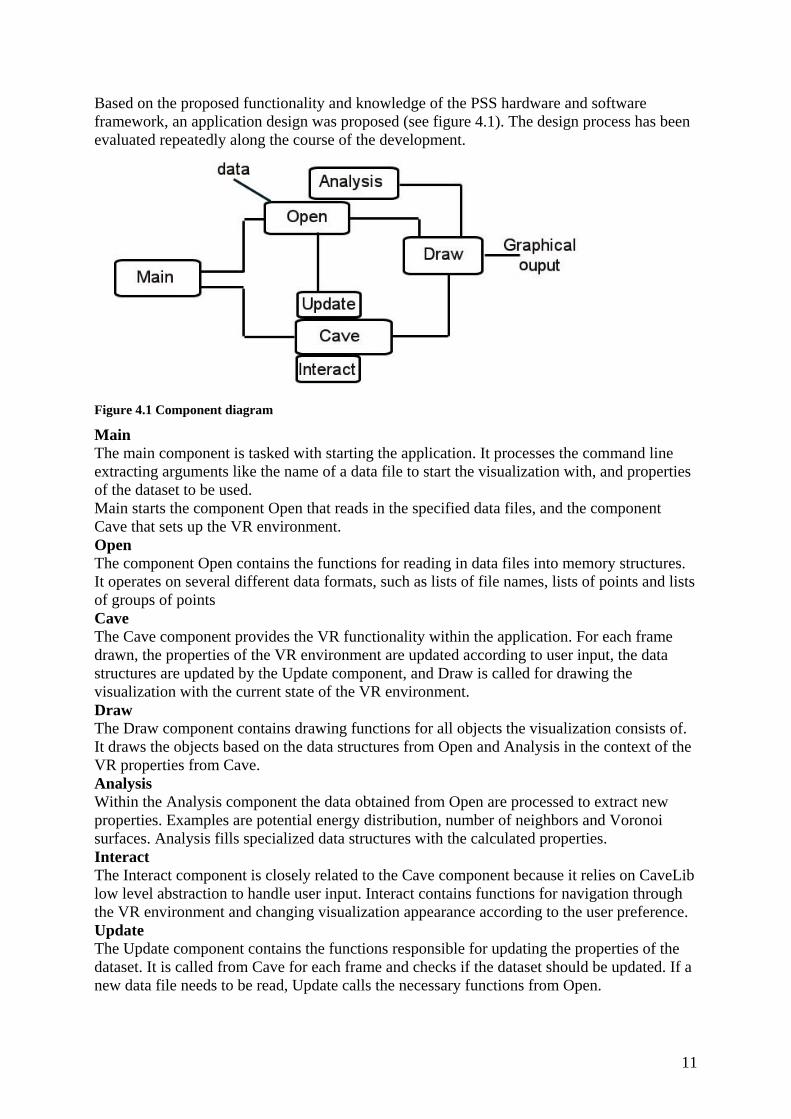
Based on the proposed functionality and knowledge of the PSS hardware and software framework, an application design was proposed (see figure 4.1). The design process has been evaluated repeatedly along the course of the development.
Figure 4.1 Component diagram
Main The main component is tasked with starting the application. It processes the command line extracting arguments like the name of a data file to start the visualization with, and properties of the dataset to be used. Main starts the component Open that reads in the specified data files, and the component Cave that sets up the VR environment. Open The component Open contains the functions for reading in data files into memory structures. It operates on several different data formats, such as lists of file names, lists of points and lists of groups of points Cave The Cave component provides the VR functionality within the application. For each frame drawn, the properties of the VR environment are updated according to user input, the data structures are updated by the Update component, and Draw is called for drawing the visualization with the current state of the VR environment. Draw The Draw component contains drawing functions for all objects the visualization consists of. It draws the objects based on the data structures from Open and Analysis in the context of the VR properties from Cave. Analysis Within the Analysis component the data obtained from Open are processed to extract new properties. Examples are potential energy distribution, number of neighbors and Voronoi surfaces. Analysis fills specialized data structures with the calculated properties. Interact The Interact component is closely related to the Cave component because it relies on CaveLib low level abstraction to handle user input. Interact contains functions for navigation through the VR environment and changing visualization appearance according to the user preference. Update The Update component contains the functions responsible for updating the properties of the dataset. It is called from Cave for each frame and checks if the dataset should be updated. If a new data file needs to be read, Update calls the necessary functions from Open.

12
The time for developing the application was limited by what was available for a bachelor’s project. As a result, priority was given to implement core functionality first, to provide a working prototype. After this, analysis methods were implemented. Interaction methods for selecting particles were planned, but could not be done due lack of time The resulting application is described in the next chapter.
13
5.1 Results This chapter covers the details of the working prototype of the application for visualizing crystallization on a sphere. It has most of the functionality a proposed in chapter 4, with a few exceptions (see section 5.6, Known issues). The application is written using the programming language C, with use of the standard C libraries as well as the openGL[5] and CaveLib[4] libraries described in chapter 3. The development environment used is one provided by a linux operating system. To test code written during development, CaveLib “simulator” mode was used to simulate a VR environment on a normal desktop computer. The simulator mode uses keyboard and mouse as substitute for interaction with PSS manipulators. 5.2 Detailed components The design proposed in chapter 4 (see figure 4.1) was used as a guideline and resulted in five files with code, roughly corresponding to the components. The components Interact and Update were joined into Cave, since they are closely related and small in size. A description of the key functions of the files: main.cpp2 Main contains functions for parsing and interpreting the commands given upon starting the application. The application is started from a command line with some optional and obligatory arguments. Arguments are the data file to use, what function to open the data file with, and sometimes additional parameters. The type of data must be indicated because the application cannot always recognize what kind of data a file contains. For example the usage of the function readFileN requires a file, a parameter N specifying how many points there are in a group, and the type of data. If no points are successfully read, the application quits notifying the user. Otherwise the Cave component is started by calling the function caveDraw to start the VR environment. open.cpp The file open.cpp contains functions for reading data from data files into data structures. The data structure used is a simple array of N by 3 floats, where N is the number of points in the data file. The floats respectively are the x, y and z coordinates of a particle. The readFile function takes a data file and reads the coordinates in the file line by line into the data structure. For each new particle read, new memory is allocated. There are 3 different versions of readFile -- readFile, readTbl and readFileN. ReadFile is the basic version that simply reads one file containing N points. ReadTbl reads a list of filenames from a “TBL” file. These filenames are stored in an array of strings for later use with readFile to open each individual data file. As result the application can cycle through a list of files/datasets. The additional parameter is in this case the path where the data files from the list can be found. The function readFileN was created for a new data format discovered during the development. The data is structured as a group of N particles with their position animated in discrete steps. The data is stored in a file of N*P points, listed one per line, where P is the number of discrete steps in the file. The P different groups of points are not separated, making it impossible to distinguish one without knowing N.
2 Although the extension used here is .cpp, normal c code is used in the files. Switching to .c extension caused errors that could not easily be resolved. As a result, we stick to .cpp extension.
14
When the application loads such a data file, N must be given as additional parameter. The function keeps track on the position last read, and reads N points forward each time. It is possible so to advance and go back in discrete steps. After reading a data file, the data is analyzed by functions in voronoi.cpp for nearest neighbor and Voronoi surface properties. cave.cpp Cave.cpp initializes and controls the VR environment. For each frame drawn, two functions handling user input are called, update and navigate. The actual drawing is done with call to doDrawing in draw.cpp, to draw the objects in context of the VR world. The update function checks for user input to the joystick buttons. It handles switching between visualization modes, zooming in and out, going back and forward trough the datasets. In case of dynamic datasets or lists of datasets from readTbl, update has to call open.cpp for reading new points. Navigate contains the code for moving individual objects and navigation trough the entire VR scene. User input to the joystick axis and PSS manipulators is used for changing the position and orientation of the sphere as well as moving around in VR. Further details about interaction can be found in section 5.5. draw.cpp Draw.cpp includes all functions for drawing the objects the visualization consists of. DoDrawing is called by cave.cpp for each frame to be drawn, and from doDrawing all other functions for drawing are invoked. Depending on mode of visualization (see below) different objects are drawn, based on information read out of the data structures received from voronoi.cpp and open.cpp. The particles are drawn in loop, placing small spheres representing particles in their location on the main sphere surface. The spheres are colored depending on the particle properties and the mode of visualization. The crystallization surface is drawn as a blue transparent sphere with a radius taken as the average of the displacement of all the particles. voronoi.cpp This file contains code provided by Dr. J. M. Voogd. Exact details of the performed calculations are too complex, and are not in the scope of this project. Details can be found in the Ph.D. thesis “Crystallisation on a Sphere”[1]. The code calculates the intersection points of the Voronoi surfaces, as well as the number of nearest neighbors for each particle. Voronoi surfaces are defined as the polygonal region defined by points closest to a given particle. The number of edges of a Voronoi surface equals to the number of nearest neighbors of a particle. The calculated properties are stored in a separate array for further use with drawing functions.
15
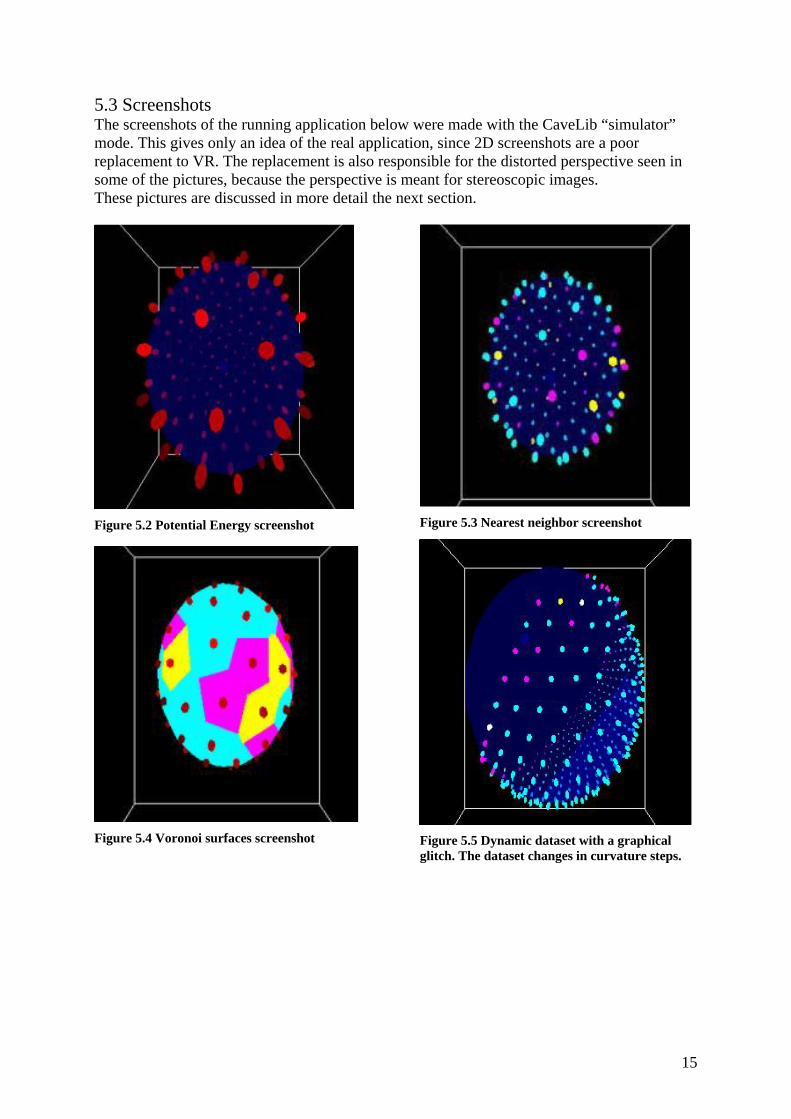
5.3 Screenshots The screenshots of the running application below were made with the CaveLib “simulator” mode. This gives only an idea of the real application, since 2D screenshots are a poor replacement to VR. The replacement is also responsible for the distorted perspective seen in some of the pictures, because the perspective is meant for stereoscopic images. These pictures are discussed in more detail the next section.
Figure 5.2 Potential Energy screenshot
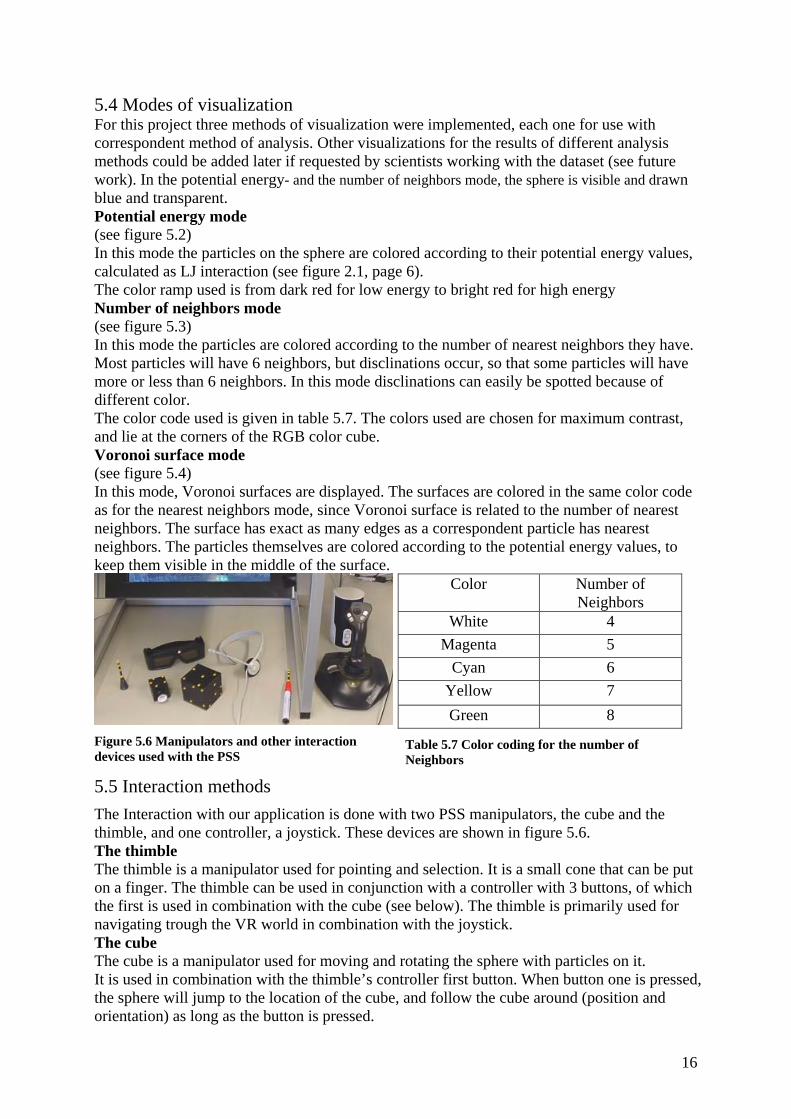
Figure 5.3 Nearest neighbor screenshot
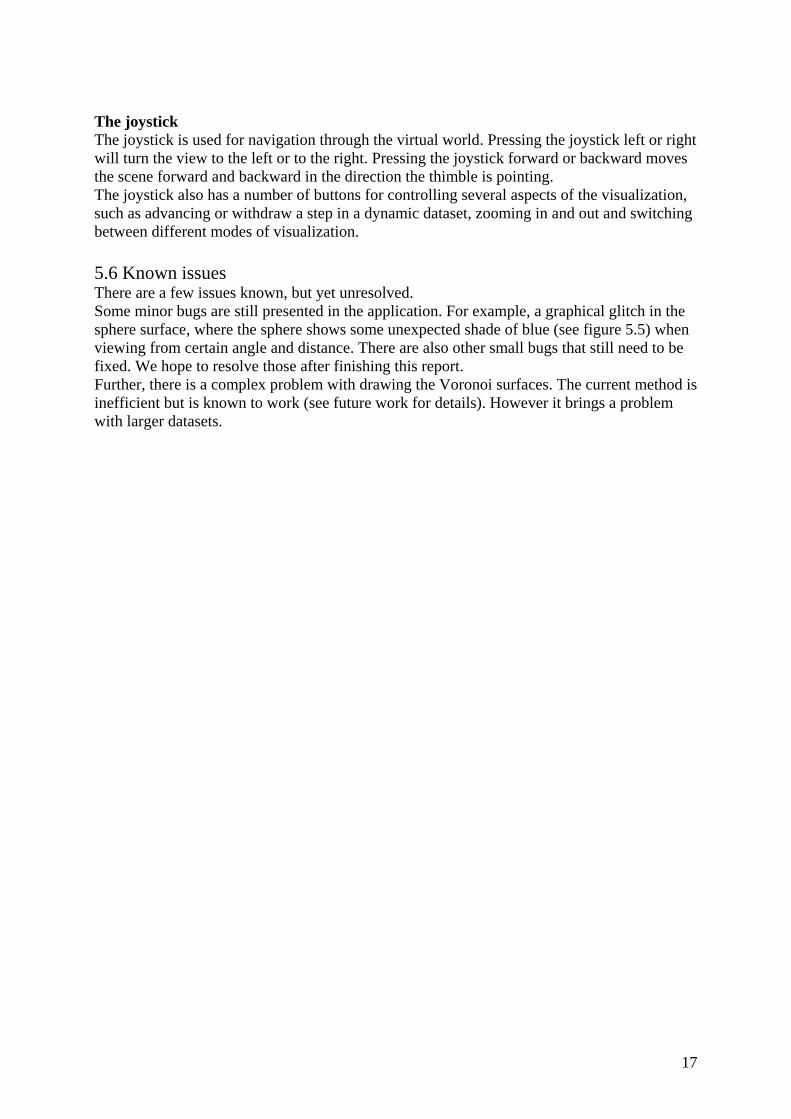
Figure 5.4 Voronoi surfaces screenshot
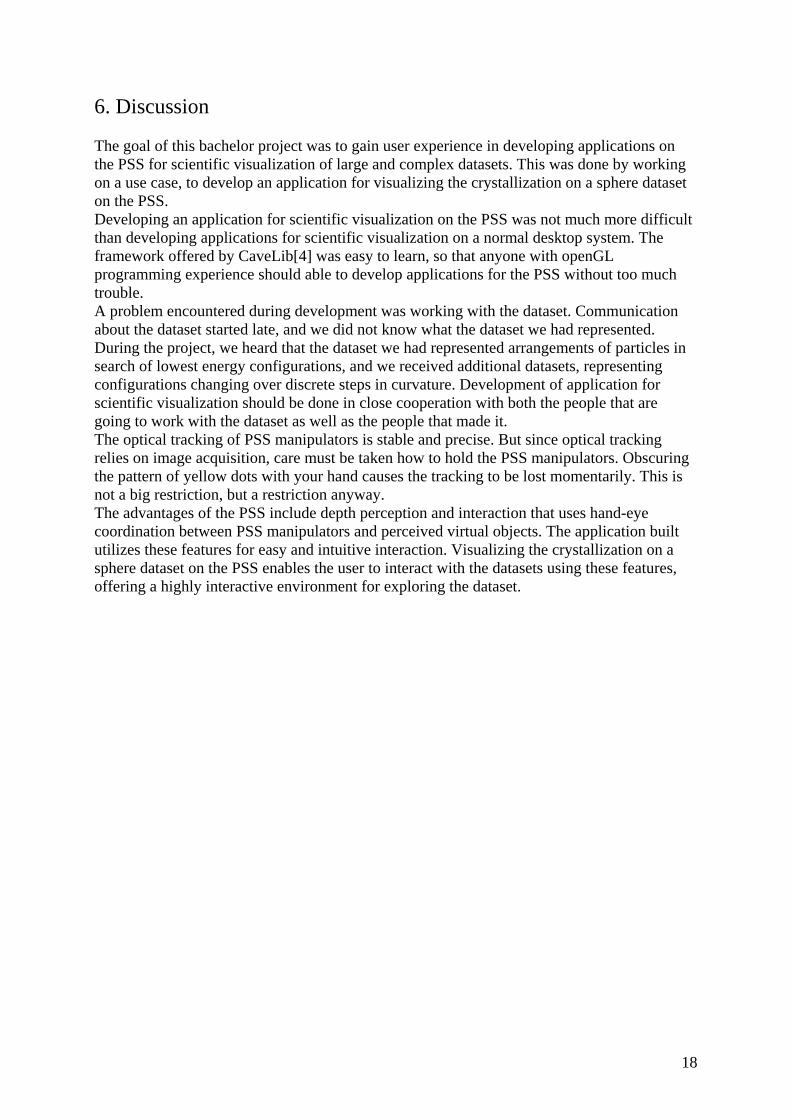
Figure 5.5 Dynamic dataset with a graphical glitch. The dataset changes in curvature steps.
16
5.4 Modes of visualization For this project three methods of visualization were implemented, each one for use with correspondent method of analysis. Other visualizations for the results of different analysis methods could be added later if requested by scientists working with the dataset (see future work). In the potential energy- and the number of neighbors mode, the sphere is visible and drawn blue and transparent. Potential energy mode (see figure 5.2) In this mode the particles on the sphere are colored according to their potential energy values, calculated as LJ interaction (see figure 2.1, page 6). The color ramp used is from dark red for low energy to bright red for high energy Number of neighbors mode (see figure 5.3) In this mode the particles are colored according to the number of nearest neighbors they have. Most particles will have 6 neighbors, but disclinations occur, so that some particles will have more or less than 6 neighbors. In this mode disclinations can easily be spotted because of different color. The color code used is given in table 5.7. The colors used are chosen for maximum contrast, and lie at the corners of the RGB color cube. Voronoi surface mode (see figure 5.4) In this mode, Voronoi surfaces are displayed. The surfaces are colored in the same color code as for the nearest neighbors mode, since Voronoi surface is related to the number of nearest neighbors. The surface has exact as many edges as a correspondent particle has nearest neighbors. The particles themselves are colored according to the potential energy values, to keep them visible in the middle of the surface.
Figure 5.6 Manipulators and other interaction devices used with the PSS
Color Number of Neighbors
White 4 Magenta 5
Cyan 6 Yellow 7 Green 8
Table 5.7 Color coding for the number of Neighbors
5.5 Interaction methods The Interaction with our application is done with two PSS manipulators, the cube and the thimble, and one controller, a joystick. These devices are shown in figure 5.6. The thimble The thimble is a manipulator used for pointing and selection. It is a small cone that can be put on a finger. The thimble can be used in conjunction with a controller with 3 buttons, of which the first is used in combination with the cube (see below). The thimble is primarily used for navigating trough the VR world in combination with the joystick. The cube The cube is a manipulator used for moving and rotating the sphere with particles on it. It is used in combination with the thimble’s controller first button. When button one is pressed, the sphere will jump to the location of the cube, and follow the cube around (position and orientation) as long as the button is pressed.
17
The joystick The joystick is used for navigation through the virtual world. Pressing the joystick left or right will turn the view to the left or to the right. Pressing the joystick forward or backward moves the scene forward and backward in the direction the thimble is pointing. The joystick also has a number of buttons for controlling several aspects of the visualization, such as advancing or withdraw a step in a dynamic dataset, zooming in and out and switching between different modes of visualization. 5.6 Known issues There are a few issues known, but yet unresolved. Some minor bugs are still presented in the application. For example, a graphical glitch in the sphere surface, where the sphere shows some unexpected shade of blue (see figure 5.5) when viewing from certain angle and distance. There are also other small bugs that still need to be fixed. We hope to resolve those after finishing this report. Further, there is a complex problem with drawing the Voronoi surfaces. The current method is inefficient but is known to work (see future work for details). However it brings a problem with larger datasets.
18
6. Discussion The goal of this bachelor project was to gain user experience in developing applications on the PSS for scientific visualization of large and complex datasets. This was done by working on a use case, to develop an application for visualizing the crystallization on a sphere dataset on the PSS. Developing an application for scientific visualization on the PSS was not much more difficult than developing applications for scientific visualization on a normal desktop system. The framework offered by CaveLib[4] was easy to learn, so that anyone with openGL programming experience should able to develop applications for the PSS without too much trouble. A problem encountered during development was working with the dataset. Communication about the dataset started late, and we did not know what the dataset we had represented. During the project, we heard that the dataset we had represented arrangements of particles in search of lowest energy configurations, and we received additional datasets, representing configurations changing over discrete steps in curvature. Development of application for scientific visualization should be done in close cooperation with both the people that are going to work with the dataset as well as the people that made it. The optical tracking of PSS manipulators is stable and precise. But since optical tracking relies on image acquisition, care must be taken how to hold the PSS manipulators. Obscuring the pattern of yellow dots with your hand causes the tracking to be lost momentarily. This is not a big restriction, but a restriction anyway. The advantages of the PSS include depth perception and interaction that uses hand-eye coordination between PSS manipulators and perceived virtual objects. The application built utilizes these features for easy and intuitive interaction. Visualizing the crystallization on a sphere dataset on the PSS enables the user to interact with the datasets using these features, offering a highly interactive environment for exploring the dataset.
19
Future work For this project an application was designed for viewing different formats of the Crystallization on a Sphere dataset. A working prototype has been built with most of the planned functionality. However the time and resources for writing the application were limited with what was available for the bachelor project. Therefore not everything that was planned has been achieved. Furthermore, there are also ideas that came during development that could be implemented in the future. Selecting particles The method for selecting individual particles was originally planned for the application. The idea is to have a big, easy to select handle connected to the center of the sphere by a rubber band. The point of intersection of the band with the sphere surface has to be calculated. If this lies inside a certain distance away from particle, the particle is to be selected. Following selected particles In dynamic datasets it might be interesting to follow a selected particle. This can only be done if it is possible to distinguish individual particles. That depends on the simulation. Does any give particle always stay in the same location in the data file? If individual particles can be distinguished, it opens up numerous possibilities. In datasets that change over time, with the curvature radius or with other features changing in discrete steps, it might be interesting to follow the selected particle. Does a particle move around in rearranging patterns? Numerical info with selected particle From the dataset a lot of derived properties can be calculated. Properties like potential energy (LJ), number of nearest neighbors and many more can be added as textual analysis. Upon selecting a particle, text displaying properties of the selected particle would pop up on the screen. As an example, the visualization now uses a red color scale to display potential energy. It is easier to compare numerical data then to compare different shades of red. Improved Voronoi surfaces The Voronoi surfaces are currently drawn in a not too optimal way. The problem is that every surface is defined with n intersection points, forming the corners, where n is the number of nearest neighbors. These n points are typically unordered, and as a result it is not possible to draw a simple convex polygon for the surface. The method now used draws a triangle from the first point to each combination of 2 points from those left. This results in as many as 28 (7+6...+1) triangles for 8 points. The trick works for now, but it is not efficient. Furthermore, the surfaces do not have a distinguishable border, since this would ask for drawing edges separately along ordered points. Voronoi surfaces with the same number of neighbors have the same color, so that you cannot see where one finishes and another begins. If the Voronoi surface intersection points can be ordered, they can be drawn as polygons with black border lines, making a better picture. The problem of ordering is not a simple one, but needs to be solved Data formats In the future different simulations might be done, or data of different simulations already made might become available. If the data files consist of more than three values for coordinates per line, extensions could be made to the read functions in the Open Component. Additional analysis methods There might be other interesting features in the dataset. Currently the analysis methods include potential energy distributions, number of nearest neighbors and Voronoi surfaces. Additional methods for analysis might be requested by scientists working with the application.
20
Portability It is likely that the application would be considered for use on other VR systems, for example by scientist who do not have access to a PSS in it’s original design, but do have access to a VR system of similar use. To port the application’s complete functionality, in general only the interaction specific parts have to be adapted to the new VR system. Acknowledgements I want to thank these people for helping me during my project:
• Roman Shulakov for his support in developing an application for the PSS, for proofreading my report, and for having patience with me.
• Jeroen Voogd, for providing me with the code for analysis, tips, extra data, and of
course doing his thesis, for without it my project would not have existed.
• Alfons Hoekstra for helping me during the early stages of my project, for proofreading my report and of course for approving the result.
• The bachelor team and my fellow bachelor students for support and ideas.
My final words are for two things that played an important role in writing my report: Digitally Imported (www.digitallyimported.com) for providing music during the long hours of writing and my coffee machine for keeping me awake.
21
References [1] J. M. Voogd, Crystalisation on a Sphere, Computational studies of two-dimensional Lennard-Jones Systems, Ph.D. thesis, University of Amsterdam, 1998. [2] R van Liere, J.D. Mulder, Optical Tracking Using Projective Invariant Marker Pattern Properties, IEEE VR 2003, March 2003. [3] R van Liere, J.D. Mulder, The Personal Space Station, Bringing interaction Within Reach, Proceedings of VRIC 2002, June 2002. [4] Virtual Reality Consulting (VRCO), CaveLib User’s manual <http://www.vrco.com/CAVE_USER/index.html> (8-6-2004) [5] M. Woo, J. Neider T. Davis (OpenGl Architecture Review Board), OpenGL Programming Guide 2n Edition 1996, Addison-Wesley [6] R. Belleman, Interactive Exploration in Virtual Environments, Ph.D. thesis, University of Amsterdam, 2003 [7] Reachin Display, Reachin. <http://www.reachin.se> (15-7-2004) [8] Krueger, W., C. Bohn, B. Frohlich, H. Scheuth, W. Strauss, G. Wesche, "The Responsive Workbench", IEEE Computer, Vol. 28, No. 7, 1995. [9] UVA-Drive, by R. Belleman, Interactive Exploration in Virtual Environments, Ph.D. thesis, University of Amsterdam, 2003 (see also[6]) [10] J.M. Voogd, P.M.A. Sloot, Equilibrium spherical 2D Lennard-Jones systems Submitted to PRL [11] D.C. Rapapor, The art of molecular dynamics simulation, Cambridge, 1995 [12] C. Schmandt, Spatial input/display correspondence in a stereoscopic computer graphic workstation, Computer Graphics, 17(3): 253-261, 1983 J.D. Mulder et al, An Affordable Optical Head Tracking System for Desktop VR/AR Systems, EGVE 2003, June 2003.


![Crystallization Mechanism of Hard Sphere Glasses · 2018. 9. 21. · arXiv:1104.3828v1 [physics.chem-ph] 19 Apr 2011 Crystallization Mechanism of Hard Sphere Glasses Eduardo Sanz,1,∗](https://img.pdfslide.net/doc/110x75/60b1b56600992650b355c8a5/crystallization-mechanism-of-hard-sphere-glasses-2018-9-21-arxiv11043828v1.jpg)