Embed Size (px)
Citation preview
CS 128/ES 228 - Lecture 11b 1
Spatial Analysis (3D)
CS 128/ES 228 - Lecture 11b 2
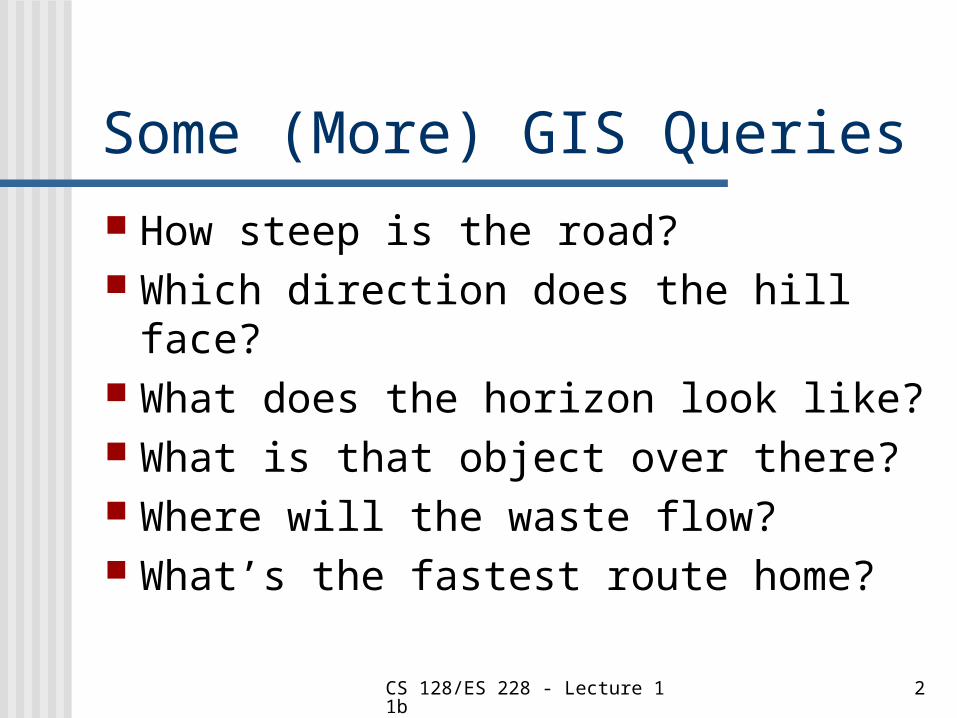
Some (More) GIS Queries How steep is the road? Which direction does the hill face? What does the horizon look like? What is that object over there? Where will the waste flow? What’s the fastest route home?
CS 128/ES 228 - Lecture 11b 3
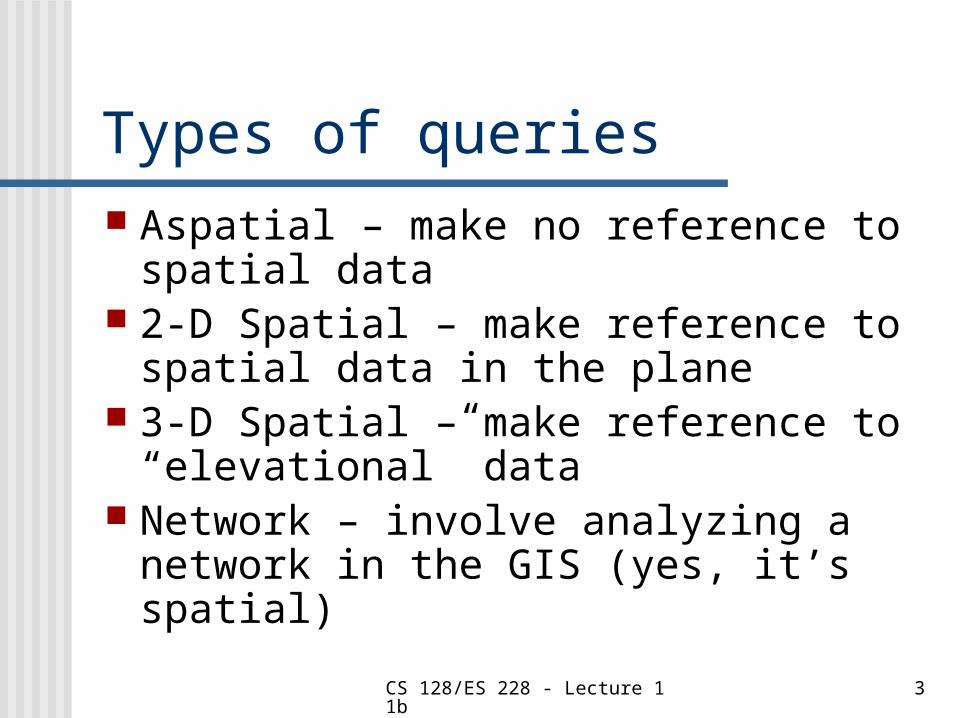
Types of queries Aspatial – make no reference to
spatial data 2-D Spatial – make reference to
spatial data in the plane 3-D Spatial – make reference to
“elevational” data Network – involve analyzing a
network in the GIS (yes, it’s spatial)
CS 128/ES 228 - Lecture 11b 4
3-D Computational Complexity
1984
technology
1997
technology
CS 128/ES 228 - Lecture 11b 5
Approximations In the vector model, each object
represents exactly one feature; it is “linked” to its complete set of attribute data
In the raster model, each cell represents exactly one piece of data; the data is specifically for that cell
THE DATA IS DISCRETE!!!
CS 128/ES 228 - Lecture 11b 6
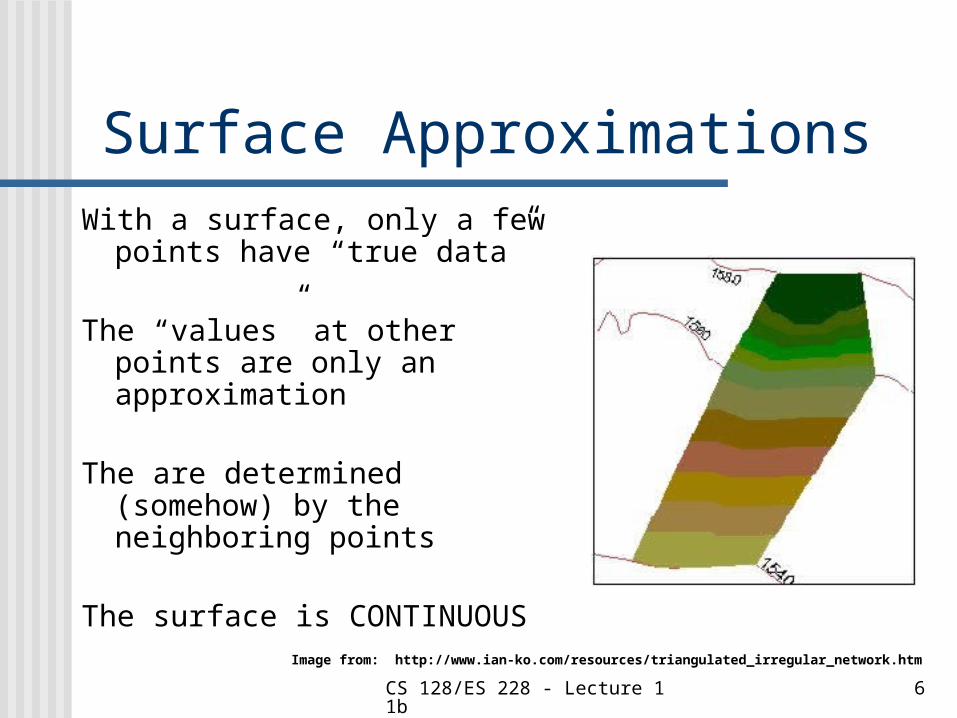
Surface ApproximationsWith a surface, only a few
points have “true data”
The “values” at other points are only an approximation
The are determined (somehow) by the neighboring points
The surface is CONTINUOUSImage from: http://www.ian-ko.com/resources/triangulated_irregular_network.htm
CS 128/ES 228 - Lecture 11b 7
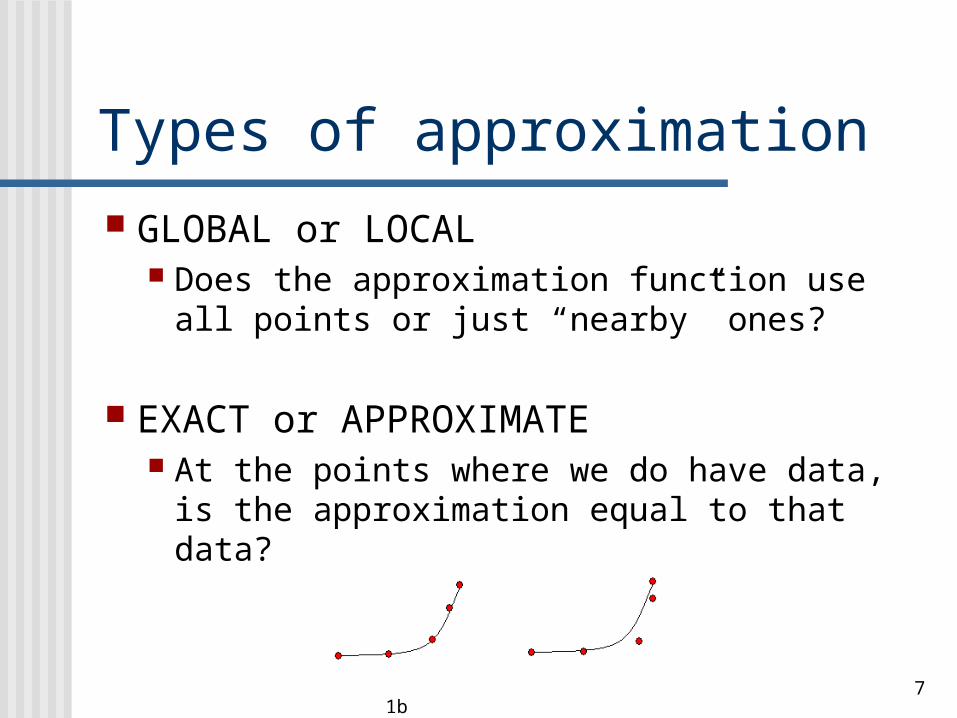
Types of approximation
GLOBAL or LOCAL Does the approximation function use all
points or just “nearby” ones?
EXACT or APPROXIMATE At the points where we do have data, is
the approximation equal to that data?
CS 128/ES 228 - Lecture 11b 8
Types of approximation GRADUAL or ABRUPT
Does the approximation function vary continuously or does it “step” at boundaries?
DETERMINISTIC or STOCHASTIC Is there a randomness component to
the approximation?
CS 128/ES 228 - Lecture 11b 9
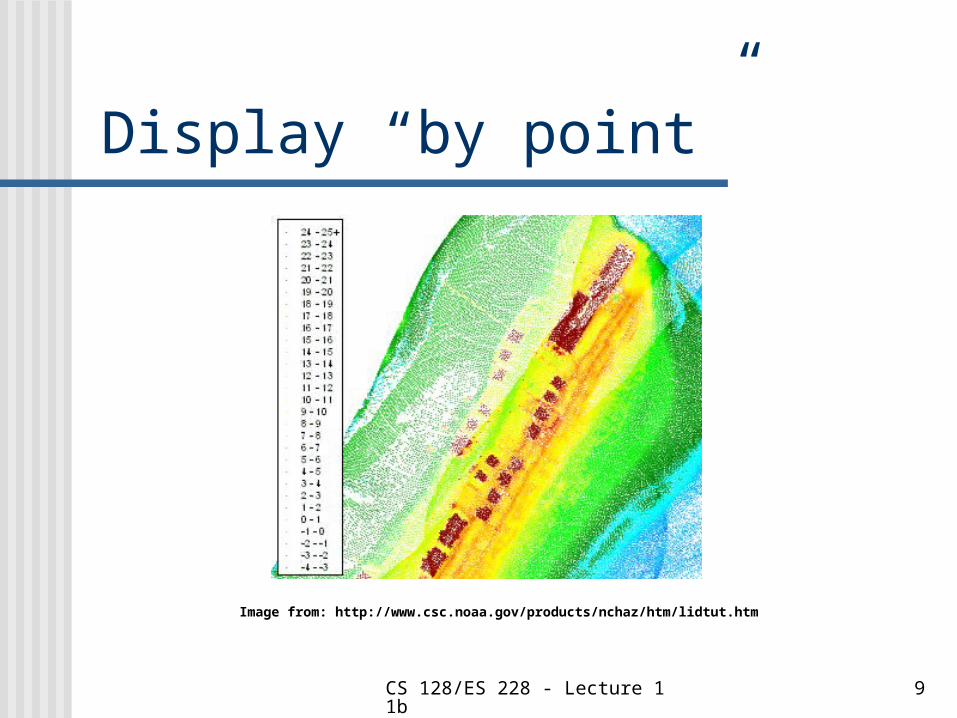
Display “by point”
Image from: http://www.csc.noaa.gov/products/nchaz/htm/lidtut.htm
CS 128/ES 228 - Lecture 11b 10
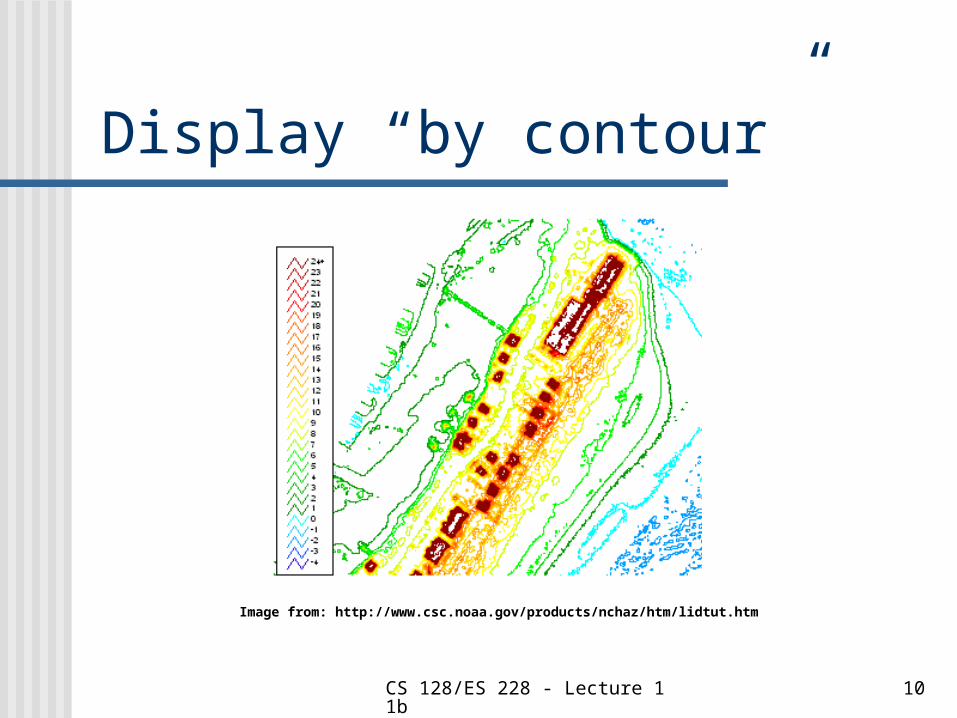
Display “by contour”
Image from: http://www.csc.noaa.gov/products/nchaz/htm/lidtut.htm
CS 128/ES 228 - Lecture 11b 11
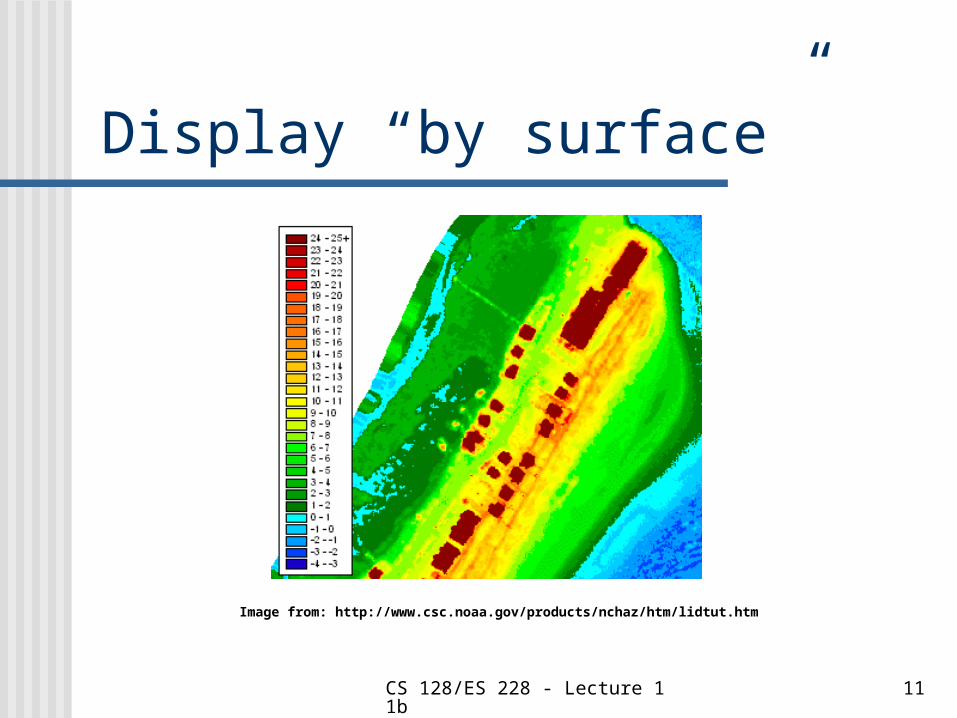
Display “by surface”
Image from: http://www.csc.noaa.gov/products/nchaz/htm/lidtut.htm
CS 128/ES 228 - Lecture 11b 12
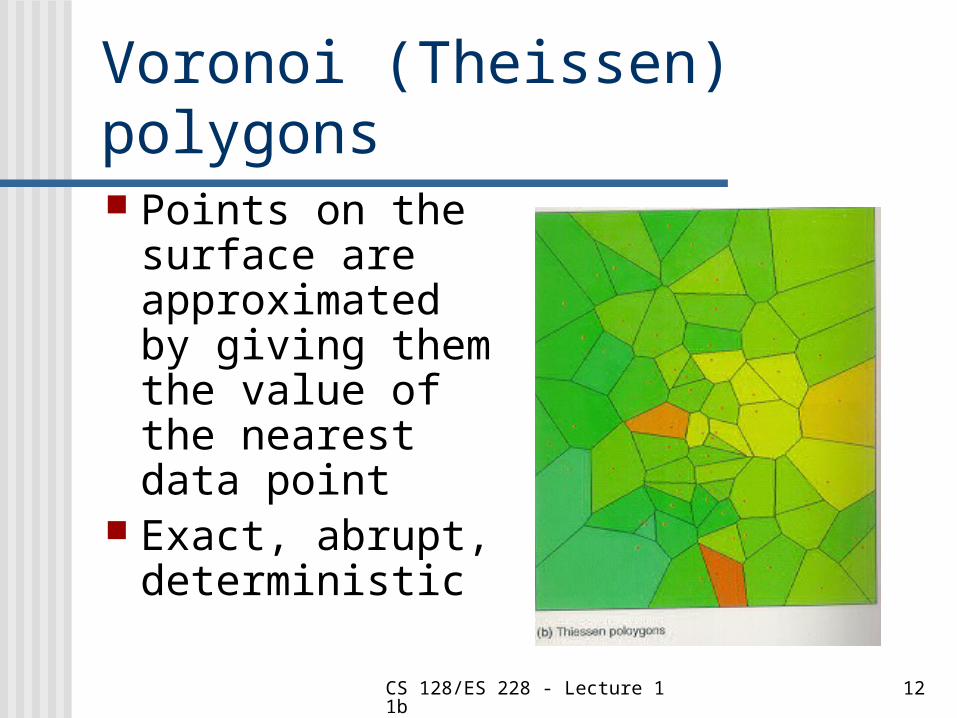
Voronoi (Theissen) polygons Points on the
surface are approximated by giving them the value of the nearest data point
Exact, abrupt, deterministic
CS 128/ES 228 - Lecture 11b 13
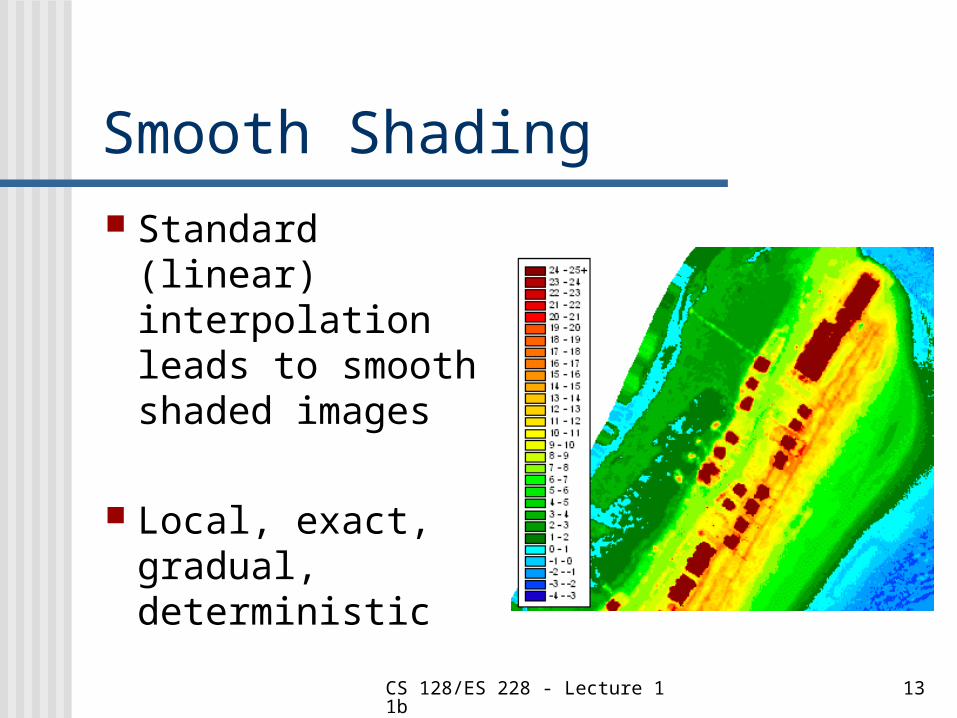
Smooth Shading Standard (linear)
interpolation leads to smooth shaded images
Local, exact, gradual, deterministic
X yw
1-
W = *y + (1-)*x
CS 128/ES 228 - Lecture 11b 14
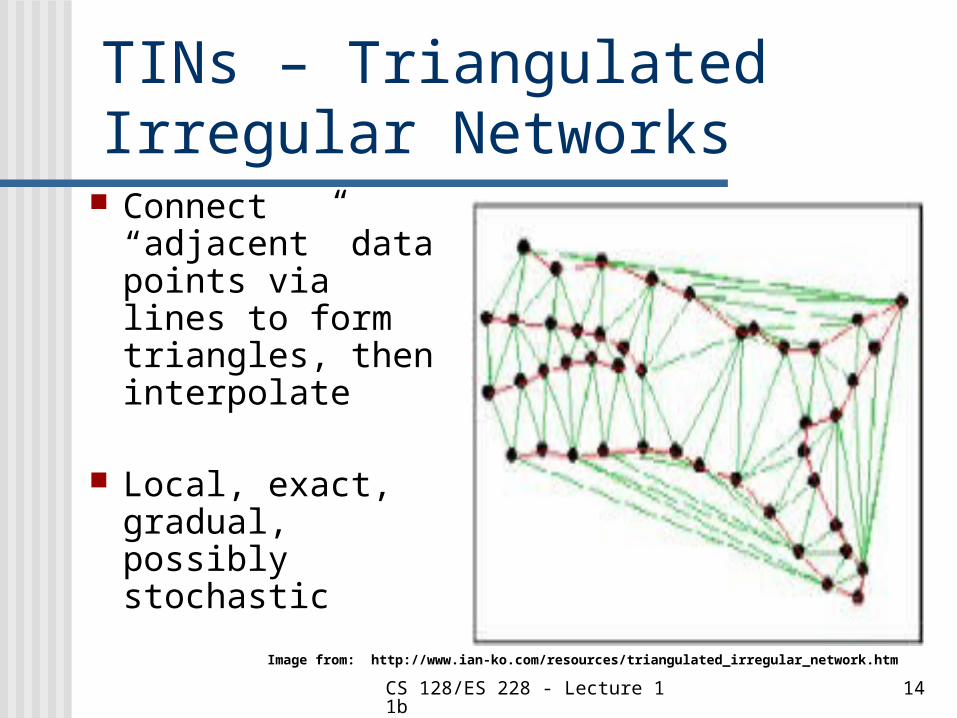
TINs – Triangulated Irregular Networks
Connect “adjacent” data points via lines to form triangles, then interpolate
Local, exact, gradual, possibly stochastic
or
Image from: http://www.ian-ko.com/resources/triangulated_irregular_network.htm
CS 128/ES 228 - Lecture 11b 15
Simple Queries?
The descriptions thus far represent “simple” queries, in the same sense that length, area, etc. did for 2-D.
A more complex query would involve comparing the various data points in some way
CS 128/ES 228 - Lecture 11b 16
Slope and aspect A natural question with elevational
data is to ask how rapidly that data is changing, e.g. “What is the gradient?”
Another natural question is to ask what direction the slope is facing, i.e. “What is the normal?”
slope
aspect
CS 128/ES 228 - Lecture 11b 17
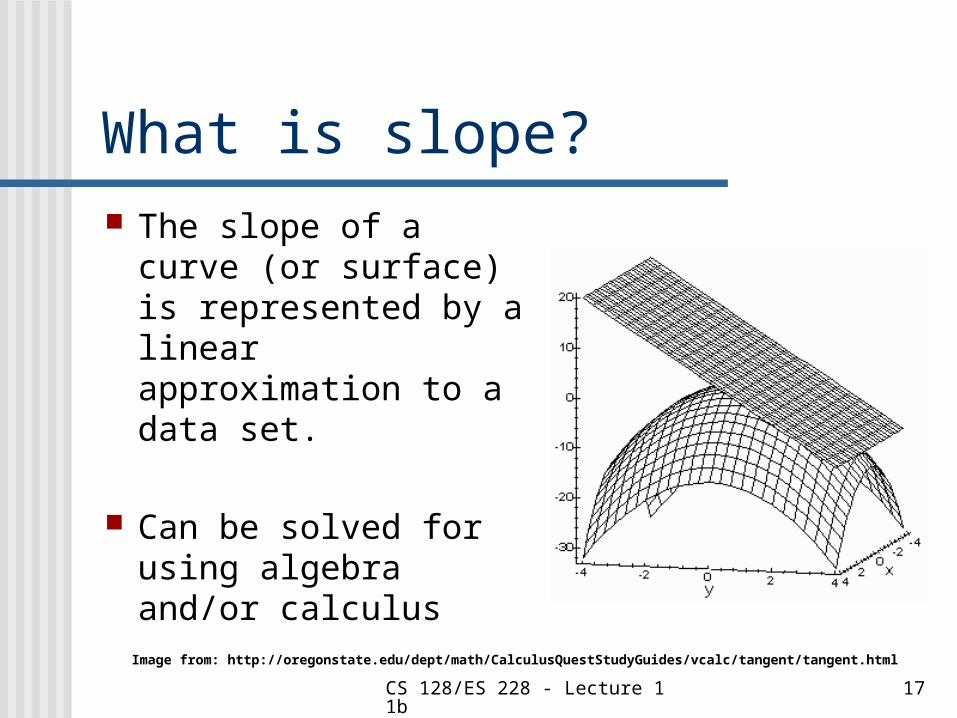
What is slope? The slope of a curve
(or surface) is represented by a linear approximation to a data set.
Can be solved for using algebra and/or calculus
Image from: http://oregonstate.edu/dept/math/CalculusQuestStudyGuides/vcalc/tangent/tangent.html
CS 128/ES 228 - Lecture 11b 18
Solving for slope In a raster world, we use the
equation for a plane:z = a*x + b*y + c
and we solve for a “best fit”
In a vector world, it is usually computed as the TIN is formed (viz. the way area is pre-computed for polygons)
CS 128/ES 228 - Lecture 11b 19
Our friend calculus Slope is essentially a first derivative
Second derivatives are also useful for…
convexity computations
CS 128/ES 228 - Lecture 11b 20
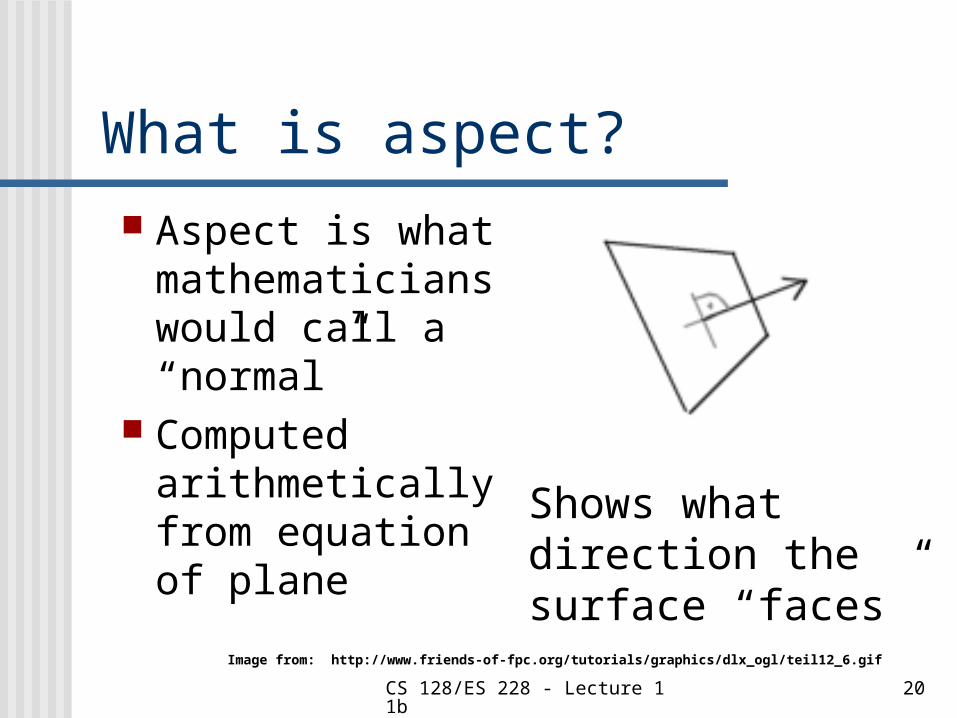
What is aspect? Aspect is what
mathematicians would call a “normal”
Computed arithmetically from equation of plane
Image from: http://www.friends-of-fpc.org/tutorials/graphics/dlx_ogl/teil12_6.gif
Shows what direction the surface “faces”
CS 128/ES 228 - Lecture 11b 21
Visibility
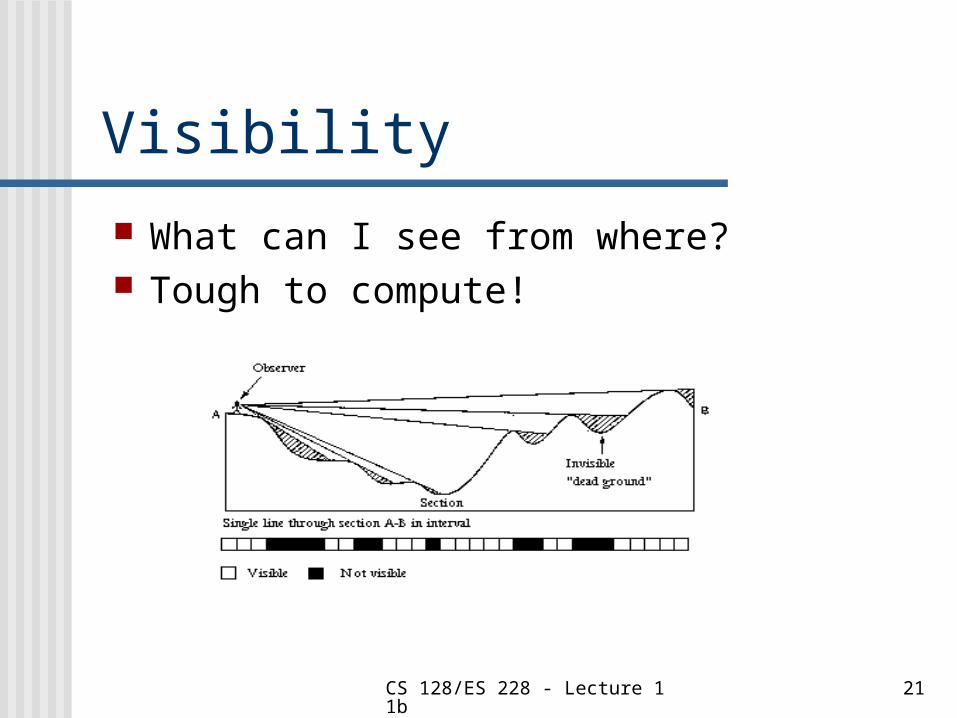
What can I see from where? Tough to compute!
CS 128/ES 228 - Lecture 11b 22
What is an elevation? It could be an ELEVATION, i.e. an
altitude BUT, it could be rainfall, income, or
any other scalar measurement
Bottom Line: It’s one more dimension on top of the geographic data
CS 128/ES 228 - Lecture 11b 23
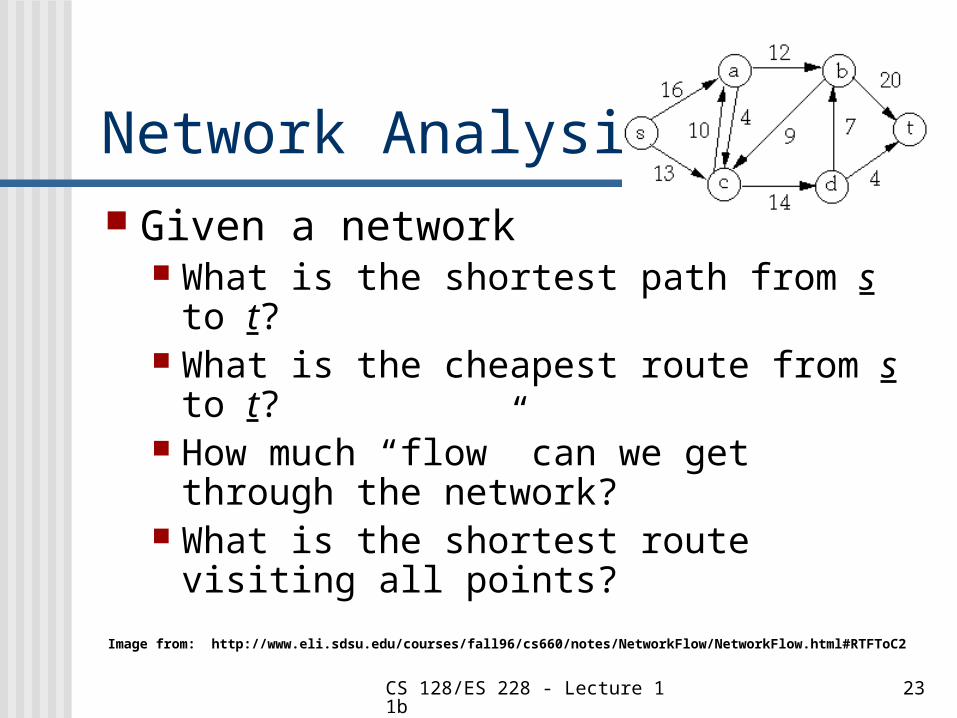
Network Analysis Given a network
What is the shortest path from s to t? What is the cheapest route from s to t?
How much “flow” can we get through the network?
What is the shortest route visiting all points?
Image from: http://www.eli.sdsu.edu/courses/fall96/cs660/notes/NetworkFlow/NetworkFlow.html#RTFToC2
CS 128/ES 228 - Lecture 11b 24
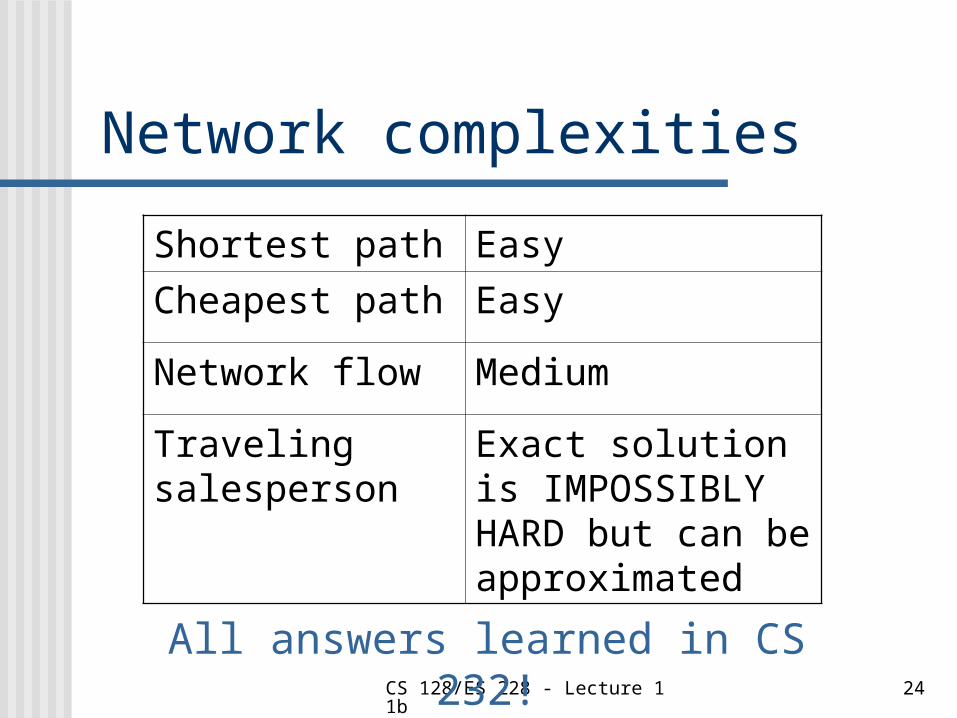
Network complexities
Shortest path Easy
Cheapest path Easy
Network flow Medium
Traveling salesperson
Exact solution is IMPOSSIBLY HARD but can be approximated
All answers learned in CS 232!
CS 128/ES 228 - Lecture 11b 25
Conclusions A GIS without spatial analysis is like
a car without a gas pedal.
A GIS without 3-D spatial analysis is like a car without a radio.
It may still be useful, but you wish you had the “luxury”.