Embed Size (px)
Citation preview

CSC 4510/9010 Spring 2015. Paula Matuszek
CS 4510/9010: Applied Machine Learning
Function Algorithms: Linear Regression, Logistic Regression, SVMs
Paula MatuszekSpring, 2015
1

CSC 4510/9010 Spring 2015. Paula Matuszek
Regression Classifiers• The task of a supervised learning system
can be viewed as learning a function which predicts the outcome from the inputs: – Given a training set of N example pairs (x1, y1)
(x2,y2)...(xn,yn), where each yj was generated by an unknown function y = f(x), discover a function h that approximates the true function y
• A large class of supervised learning approaches discover h with regression methods.
2

CSC 4510/9010 Spring 2015. Paula Matuszek
Regression Classifiers• The basic idea underlying regression is:
– plot all of the sample points for n-feature examples in an n-dimensional space
– find an n-dimensional plane that separates the positive examples from the negative examples best
• If you are familiar with the statistical concept of regression for prediction, this is the same idea.
3

Borrowed heavily from Andrew tutorials:: http://www.cs.cmu.edu/~awm/tutorials.
Linear Classifiers
CSC 4510/9010 Spring 2015. Paula Matuszek
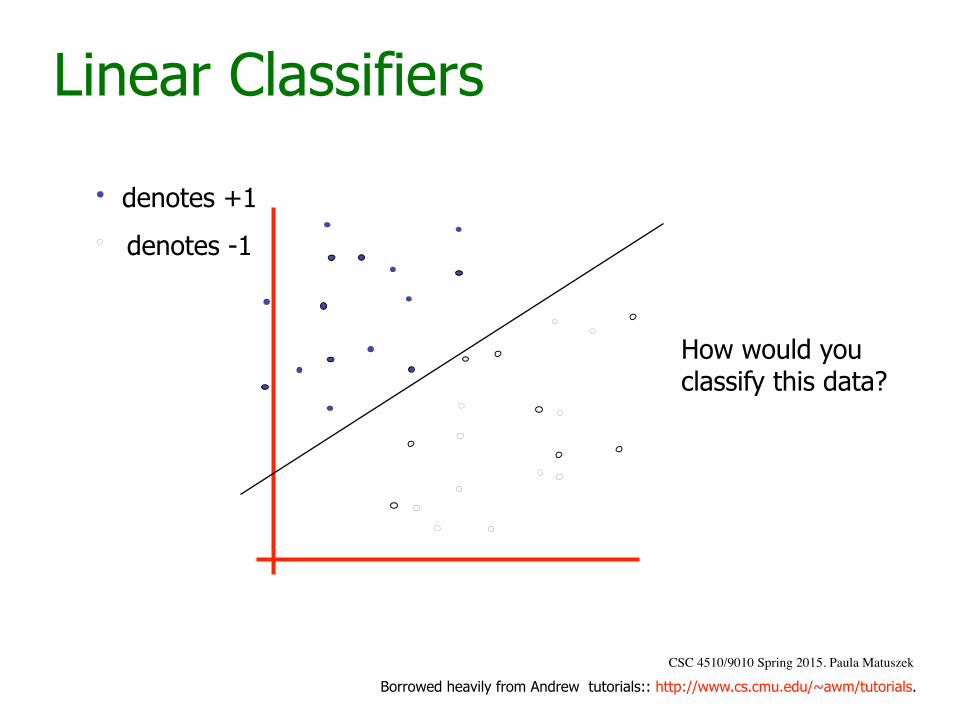
denotes +1
denotes -1
How would you classify this data?

Borrowed heavily from Andrew tutorials:: http://www.cs.cmu.edu/~awm/tutorials.
Linear Classifiers
CSC 4510/9010 Spring 2015. Paula Matuszek
denotes +1
denotes -1
How would you classify this data?

Borrowed heavily from Andrew tutorials:: http://www.cs.cmu.edu/~awm/tutorials.
Linear Classifiers
CSC 4510/9010 Spring 2015. Paula Matuszek
denotes +1
denotes -1
How would you classify this data?

Borrowed heavily from Andrew tutorials:: http://www.cs.cmu.edu/~awm/tutorials.
Linear Classifiers
CSC 4510/9010 Spring 2015. Paula Matuszek
denotes +1
denotes -1
How would you classify this data?

Borrowed heavily from Andrew tutorials:: http://www.cs.cmu.edu/~awm/tutorials.
Linear Classifiers
CSC 4510/9010 Spring 2015. Paula Matuszek
denotes +1
denotes -1
Any of these would be fine..
..but which is best?
CSC 4510/9010 Spring 2015. Paula Matuszek
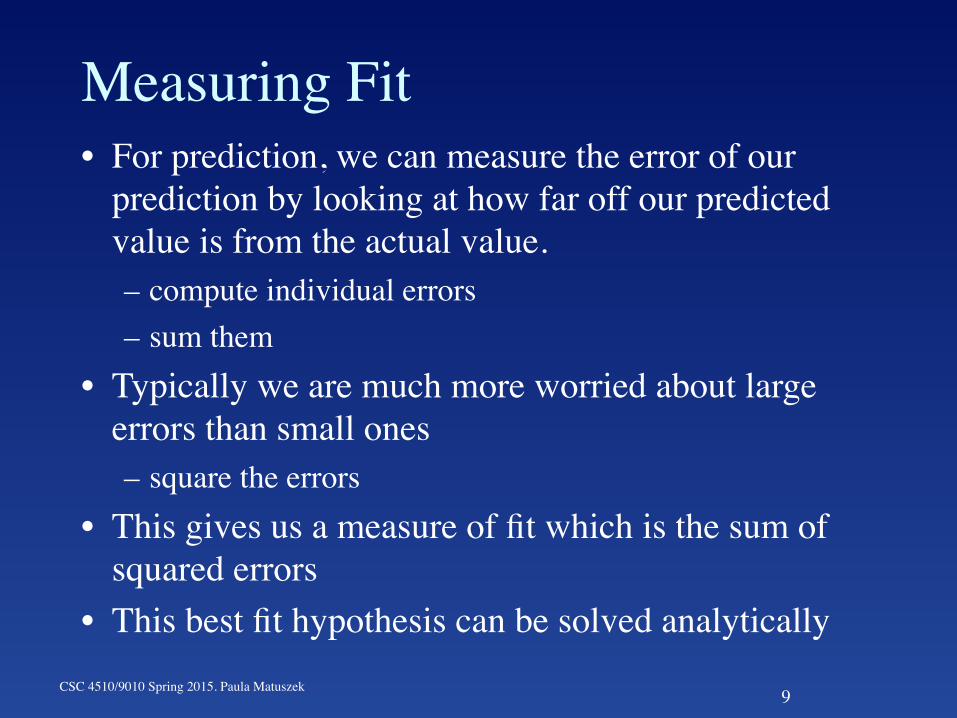
Measuring Fit• For prediction, we can measure the error of our
prediction by looking at how far off our predicted value is from the actual value.– compute individual errors– sum them
• Typically we are much more worried about large errors than small ones– square the errors
• This gives us a measure of fit which is the sum of squared errors
• This best fit hypothesis can be solved analytically
9

Data Mining: Practical Machine Learning Tools and Techniques (Chapter 4) 10
Classification
● Any regression technique can be used for classification. For non-binary classes
● One vs many comparison:♦ Training: perform a regression for each class, setting
the output to 1 for training instances that belong to class, and 0 for those that don’t
♦ Prediction: predict class corresponding to model with largest output value (membership value)
● Sometimes called multi-response linear regression

Data Mining: Practical Machine Learning Tools and Techniques (Chapter 3) 11
● Binary classification● Line separates the two classes
♦ Decision boundary - defines where the decision changes from one class value to the other
● Prediction is made by plugging in observed values of the attributes into the expression
♦ Predict one class if output ≥ 0, and the other class if output < 0
● Boundary becomes a high-dimensional plane (hyperplane) when there are multiple attributes
Linear models for classification

Data Mining: Practical Machine Learning Tools and Techniques (Chapter 4) 12
Linear models: linear regression
● Work most naturally with numeric attributes● Standard technique for numeric prediction● Weights are calculated from the training data♦ Outcome is linear combination of attributes
CSC 4510/9010 Spring 2015. Paula Matuszek
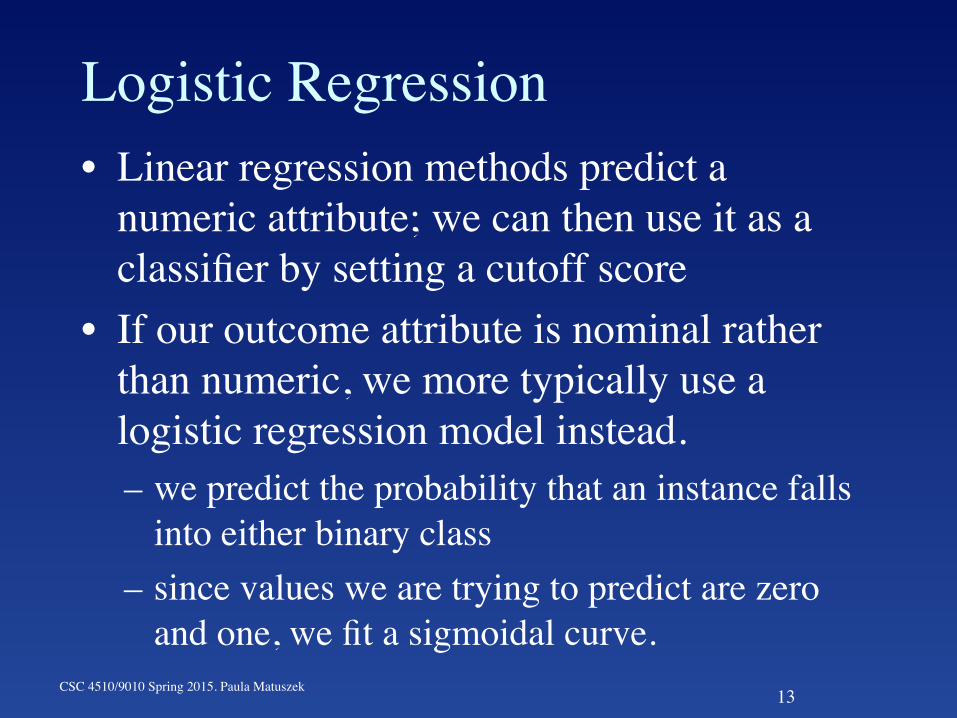
Logistic Regression• Linear regression methods predict a
numeric attribute; we can then use it as a classifier by setting a cutoff score
• If our outcome attribute is nominal rather than numeric, we more typically use a logistic regression model instead.– we predict the probability that an instance falls
into either binary class– since values we are trying to predict are zero
and one, we fit a sigmoidal curve.13
Data Mining: Practical Machine Learning Tools and Techniques (Chapter 4) 14
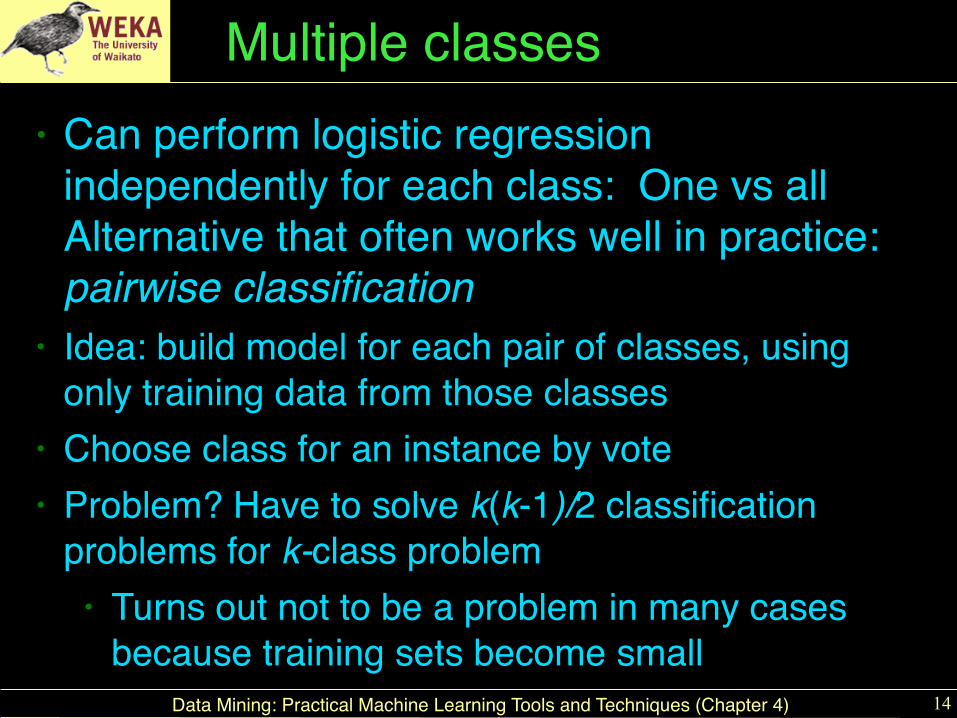
Multiple classes● Can perform logistic regression
independently for each class: One vs all Alternative that often works well in practice: pairwise classification
● Idea: build model for each pair of classes, using only training data from those classes
● Choose class for an instance by vote● Problem? Have to solve k(k-1)/2 classification
problems for k-class problem● Turns out not to be a problem in many cases
because training sets become small
CSC 4510/9010 Spring 2015. Paula Matuszek
Check• Consider the Contact Lens dataset in Weka• It has three classes: soft, hard, none• If you are doing pairwise classification, how
many classifications do you need to do?
15

CSC 4510/9010 Spring 2015. Paula Matuszek
Support Vector Machines(SVMs)
16

CSC 4510/9010 Spring 2015. Paula Matuszek
A Motivating Problem• People who set up bird feeders want to feed
birds.• We don’t want to feed squirrels
– they eat too fast– they drive the birds away
• So how do we create a bird feeder that isn’t a squirrel feeder?
17

CSC 4510/9010 Spring 2015. Paula Matuszek
Birds vs Squirrels• How are birds and squirrels different?• Take a moment and write down a couple of
features that distinguish birds from squirrels.
18

CSC 4510/9010 Spring 2015. Paula Matuszek
Birds vs Squirrels• How are birds and squirrels different?• Take a moment and write down a couple of
features that distinguish birds from squirrels.
• And now take another and write down how YOU tell a bird from a squirrel.
19

CSC 4510/9010 Spring 2015. Paula Matuszek
Possible Features• Birds
– • Squirrels
– • And what do people actually do?
20

CSC 4510/9010 Spring 2015. Paula Matuszek
The Typical Bird Feeder Solutions• Birds are lighter:
• Birds can fly
21
Squirrels are heavier
Squirrels can’t fly

CSC 4510/9010 Spring 2015. Paula Matuszek
And Then There’s This:
22
http://youtu.be/_mbvqxjFZpE
http://www.slideshare.net/kgrandis/pycon-2012-militarizing-your-backyard-computer-vision-and-the-squirrel-hordes

CSC 4510/9010 Spring 2015. Paula Matuszek
Knowledge for SVMs• We are trying here to emulate our human
decision making about whether something is a squirrel. So we will have:– Features– A classification
• As we saw in our discussion, there are a couple of obvious features, but mostly we decide based on a number of visual cues: size, color, general arrangement of pixels.
23

CSC 4510/9010 Spring 2015. Paula Matuszek
Kurt Grandis’ Squirrel Gun• The water gun is driven by a system which
– uses a camera to watch the bird feeder– detects blobs– determines whether the blob is a squirrel– targets the squirrel– shoots!
• Mostly in Python, using openCV for the vision.• Of interest to us is that decision about whether
a blob is a squirrel is made by an SVM.
24

CSC 4510/9010 Spring 2015. Paula Matuszek
So What’s an SVM?• A Support Vector Machine (SVM) is a classifier
– It uses features of instances to decide which class each instance belongs to
• It is a supervised machine-learning classifier– Training cases are used to calculate parameters for a model
which can then be applied to new instances to make a decision
• It is a binary classifier – it distinguishes between two classes
• For the squirrel vs bird, Grandis used size, a histogram of pixels, and a measure of texture as the features
25
CSC 4510/9010 Spring 2015. Paula Matuszek
Basic Idea Underlying SVMs• Find a line, or a plane, or a hyperplane, that
separates our classes cleanly.– This is the same concept as we have seen in
regression.• By finding the greatest margin separating
them– This is not the same concept as we have seen in
regression. What does it mean?
26
Borrowed heavily from Andrew tutorials:: http://www.cs.cmu.edu/~awm/tutorials.
Linear Classifiers
CSC 4510/9010 Spring 2015. Paula Matuszek
denotes +1
denotes -1
How would you classify this data?

Borrowed heavily from Andrew tutorials:: http://www.cs.cmu.edu/~awm/tutorials.
Linear Classifiers
CSC 4510/9010 Spring 2015. Paula Matuszek
denotes +1
denotes -1
How would you classify this data?

Borrowed heavily from Andrew tutorials:: http://www.cs.cmu.edu/~awm/tutorials.
Linear Classifiers
CSC 4510/9010 Spring 2015. Paula Matuszek
denotes +1
denotes -1
Any of these would be fine..
..but which is best?

Borrowed heavily from Andrew tutorials:: http://www.cs.cmu.edu/~awm/tutorials.
Classifier Margin
CSC 4510/9010 Spring 2015. Paula Matuszek
denotes +1
denotes -1 Define the margin of a linear classifier as the width that the boundary could be increased by before hitting a datapoint.

Borrowed heavily from Andrew tutorials:: http://www.cs.cmu.edu/~awm/tutorials.
Maximum Margin
CSC 4510/9010 Spring 2015. Paula Matuszek
denotes +1
denotes -1 The maximum margin linear classifier is the linear classifier with the maximum margin.

Borrowed heavily from Andrew tutorials:: http://www.cs.cmu.edu/~awm/tutorials.
Maximum Margin
CSC 4510/9010 Spring 2015. Paula Matuszek
denotes +1
denotes -1 The maximum margin linear classifier is the linear classifier with the maximum margin.
Called Linear Support Vector Machine (SVM)

Borrowed heavily from Andrew tutorials:: http://www.cs.cmu.edu/~awm/tutorials.
Maximum Margin
CSC 4510/9010 Spring 2015. Paula Matuszek
denotes +1
denotes -1 The maximum margin linear classifier is the linear classifier with the, um, maximum margin.
Called Linear Support Vector Machine (SVM)
Support Vectors are those datapoints that the margin pushes up against

Borrowed heavily from Andrew tutorials:: http://www.cs.cmu.edu/~awm/tutorials.
Why Maximum Margin?
CSC 4510/9010 Spring 2015. Paula Matuszek
denotes +1
denotes -1
f(x,w,b) = sign(w. x - b)
The maximum margin linear classifier is the linear classifier with the, um, maximum margin.
This is the simplest kind of SVM (Called an LSVM)
Support Vectors are those datapoints that the margin pushes up against
1. If we’ve made a small error in the location of the boundary (it’s been jolted in its perpendicular direction) this gives us least chance of causing a misclassification.
2. Empirically it works very very well.

Borrowed heavily from Andrew tutorials:: http://www.cs.cmu.edu/~awm/tutorials.
Maximum Margin Classifier (SVM)• Find the linear classifier
• separates documents of the positive class from those of the negative class
• has the largest classification margin
CSC 4510/9010 Spring 2015. Paula Matuszek
+1
-1
• Compute the classification margin
• Search the linear classifier with the largest classification margin
Classification margin
Plus-Plane
Minus-Plane
Classifier Boundary

CSC 4510/9010 Spring 2015. Paula Matuszek
Concept Check• For which of these could we use a basic linear
SVM?– A: Classify the three kinds of iris in the Weka data
set?– B: Classify email into spam and non-spam?– C: Classify students into likely to pass or not?
• Which of these is the SVM margin?
36
BA

CSC 4510/9010 Spring 2015. Paula Matuszek
Messy Data• This is all good so far.• Suppose our aren’t that neat:
37

CSC 4510/9010 Spring 2015. Paula Matuszek
Soft Margins• Intuitively, it still looks like we can make a
decent separation here.– Can’t make a clean margin– But can almost do so, if we allow some errors
• We introduce slack variables, which measure the degree of misclassification
• A soft margin is one which lets us make some errors, in order to get a wider margin
• Tradeoff between wide margin and classification errors
38

CSC 4510/9010 Spring 2015. Paula Matuszek 39
Only Two Errors, Narrow Margin

CSC 4510/9010 Spring 2015. Paula Matuszek 40
Several Errors, Wider Margin

CSC 4510/9010 Spring 2015. Paula Matuszek
Slack Variables and Cost• In order to find a soft margin, we allow slack variables,
which measure the degree of misclassification.– Takes into account the distance from the margin as well we
the number of misclassified instances• We then modify this by a cost (C) for these
misclassified instances.– High cost will give relatively narrow margins– Low cost will give broader margins but misclassify more
data.• How much we want it to cost to misclassify instances
depends on our domain -- what we are trying to do
41

CSC 4510/9010 Spring 2015. Paula Matuszek
Concept Check• Which of these represents a soft margin?
42
A B
CSC 4510/9010 Spring 2015. Paula Matuszek
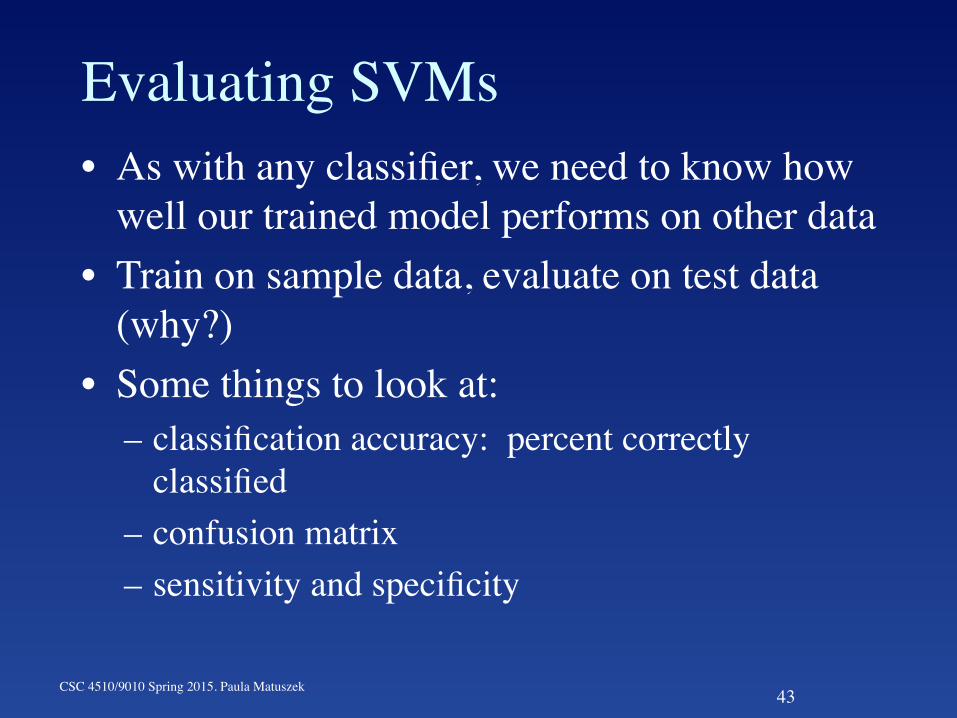
Evaluating SVMs• As with any classifier, we need to know how
well our trained model performs on other data• Train on sample data, evaluate on test data
(why?)• Some things to look at:
– classification accuracy: percent correctly classified
– confusion matrix– sensitivity and specificity
43

CSC 4510/9010 Spring 2015. Paula Matuszek
More on Evaluating SVMs• Overfitting: very close fit to training data
which takes advantage of irrelevant variations in instances– performance on test data will be much lower– may mean that your training sample isn’t
representative– in SVMs, may mean that C is too high
• Is the SVM actually useful?– Compare to the “majority” classifier
44

CSC 4510/9010 Spring 2015. Paula Matuszek
Why SVMs?• Focus on the instances nearest the margin is
paying more attention to where the differences are critical
• Can handle very large feature sets effectively
• In practice has been shown to work well in a variety of domains
45

CSC 4510/9010 Spring 2015. Paula Matuszek 46
But wait, there’s more!

CSC 4510/9010 Spring 2015. Paula Matuszek
Non-Linearly-Separable Data• Suppose we can’t do a good linear
separation of our data?• Allowing non-linearity will give us much
better modeling of many data sets.• In SVMs, we do this by using a kernel.• A kernel is a function which maps our data
into a higher-order order feature space where we can find a separating hyperplane
47

CSC 4510/9010 Spring 2015. Paula Matuszek
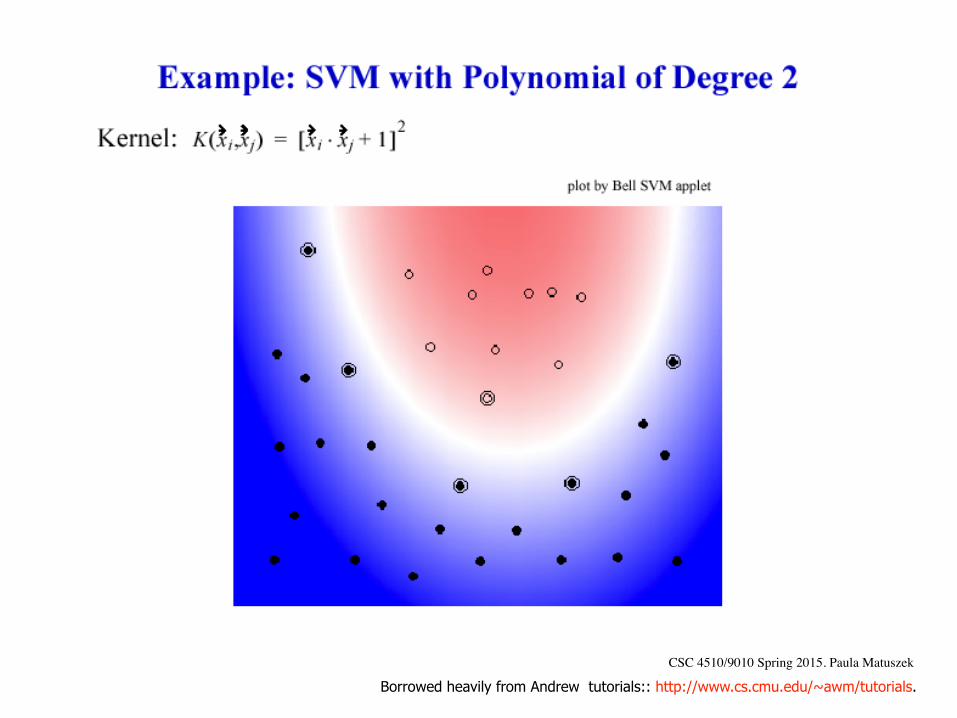
Kernels for SVMs• We always specify a kernel for an SVM;
Linear is simplest, but seldom a good match to the data
• Other common ones are– polynomial– RBF (Gaussian Radial Basis Function)
• Weka defaults to polynomial for SMO and radial basis for LibSVM
48
Borrowed heavily from Andrew tutorials:: http://www.cs.cmu.edu/~awm/tutorials.
CSC 4510/9010 Spring 2015. Paula Matuszek

Borrowed heavily from Andrew tutorials:: http://www.cs.cmu.edu/~awm/tutorials.
CSC 4510/9010 Spring 2015. Paula Matuszek

CSC 4510/9010 Spring 2015. Paula Matuszek
What If We Want Three Classes?• Suppose our task involves more than two
classes, such as for the IRIS data set?• Reduce multiple class problem to multiple
binary class problems.– one-versus-all, N-1 classifiers
• winner takes all– one-versus-one, N(N-1)/2 classifiers
• max-wins voter
• Weka will do this automatically if there are more than two classes.
51

Borrowed heavily from Andrew tutorials:: http://www.cs.cmu.edu/~awm/tutorials.
Linear Classifiers
CSC 4510/9010 Spring 2015. Paula Matuszek
f x
α
yest
denotes +1
denotes -1
f(x,w,b) = sign(w. x - b)
How would you classify this data?

Borrowed heavily from Andrew tutorials:: http://www.cs.cmu.edu/~awm/tutorials.
Maximum Margin
CSC 4510/9010 Spring 2015. Paula Matuszek
f x
α
yest
denotes +1
denotes -1
f(x,w,b) = sign(w. x - b)
The maximum margin linear classifier is the linear classifier with the, um, maximum margin.
This is the simplest kind of SVM (Called an LSVM)
Support Vectors are those datapoints that the margin pushes up against
Linear SVM

CSC 4510/9010 Spring 2015. Paula Matuszek
How Do We Solve It?• Gradient Descent?
• search the space of w and b for largest margin that classifies all points correctly
• Better: our equation is in a form which can be solved by quadratic programming, – well-understood set of algorithms for
optimizing a function– uses only the dot products of pairs of points– weights will be 0 except for points support
vectors
54

CSC 4510/9010 Spring 2015. Paula Matuszek
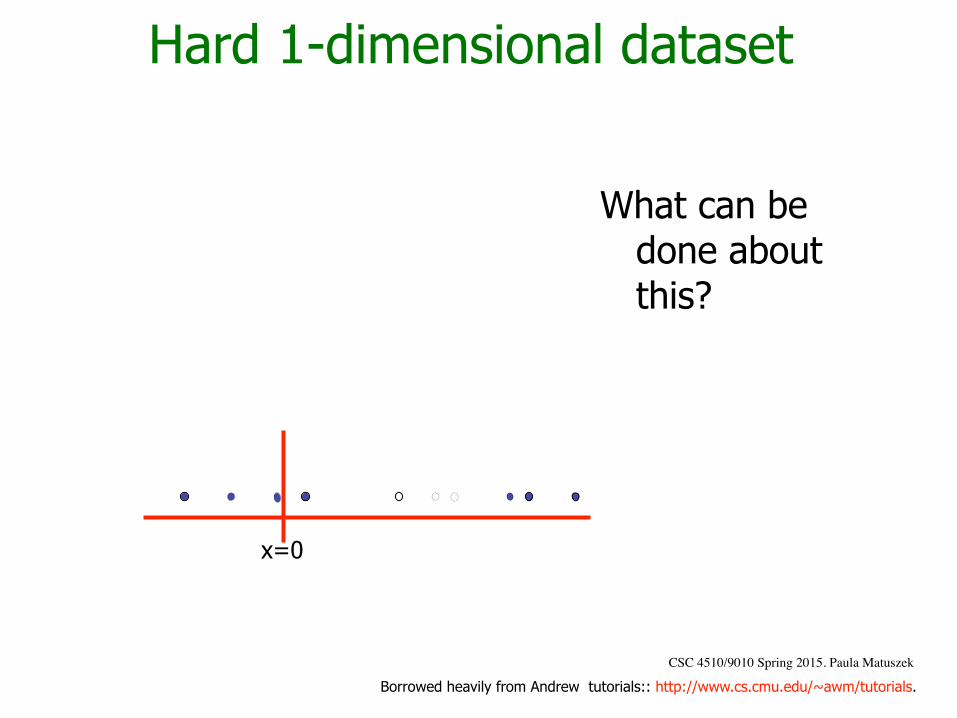
Back to Kernels• Data which are not linearly separable• Can generally be separated cleanly if we
transform it into a higher dimensions• So we want a new function over the data
points that lets us transform them
55
Borrowed heavily from Andrew tutorials:: http://www.cs.cmu.edu/~awm/tutorials.
Hard 1-dimensional dataset
CSC 4510/9010 Spring 2015. Paula Matuszek
What can be done about this?
x=0

Borrowed heavily from Andrew tutorials:: http://www.cs.cmu.edu/~awm/tutorials.
Hard 1-dimensional dataset
CSC 4510/9010 Spring 2015. Paula Matuszek
x=0

Borrowed heavily from Andrew tutorials:: http://www.cs.cmu.edu/~awm/tutorials.
Hard 1-dimensional dataset
CSC 4510/9010 Spring 2015. Paula Matuszek
x=0
CSC 4510/9010 Spring 2015. Paula Matuszek
Kernel Trick• We don’t actually have to compute the complete
higher-order function• In the equation for the margin we only use the dot
product of our attributes• So we replace it with a kernel function• This means we can work with much higher
dimensions without getting hopeless performance• The kernel trick in SVMs refers to all of this: using
a kernel function instead of the dot product to give us separation of non-linear data without impossible performance cost.
59

CSC 4510/9010 Spring 2015. Paula Matuszek
Setting the SVM Parameters• SVMs are quite sensitive to their parameters• There are not good a priori rules for setting
them. The usual recommendation is “try some and see what works in your domain”
• Weka has decent defaults
60
CSC 4510/9010 Spring 2015. Paula Matuszek
What Do We Do With SVMs• Popular because successful in a wide variety
of domains. Some examples:– Medicine: Detecting breast cancer. (EARLY
DETECTION OF BREAST CANCER USING SVM CLASSIFIER TECHNIQUE Y.Ireaneus Anna Rejani, Dr.S.Thamarai Selvi, International Journal on Computer Science and Engineering Vol.1(3), 2009, 127-130 )
– Natural Language Processing: Text classification. http://www.cs.cornell.edu/People/tj/publications/joachims_98a.pdf
– Psychology: Decoding Cognitive States From MRI data. (Decoding Cognitive States from fMRI Data Using Support Vector Regression, Maria Grazia Di Bono, Marco Zorzi. PsychNology Journal, 2008, Volume 6, Number 2, 189 – 201)
61

CSC 4510/9010 Spring 2015. Paula Matuszek
Summary• SVMs are a form of supervised classifier• The basic SVM is binary and linear, but there are non-
linear and multi-class extensions• “One k• ey insight and one neat trick”1
– key insight: maximum margin separator– neat trick: kernel trick
• A good method to try first if you have no knowledge about the domain
• Applicable in a wide variety of domains• Handles very large number of attributes smoothly
62
1Artificial Intelligence, a Modern Approach, third edition, Russell and Norvig, 2010, p, 744