Embed Size (px)
Citation preview
Central Statistical Agency, EthiopiaTel: 251-11-1553011/251-11-1578156 - Fax: 251-11-1550334 - Box: 1143
E-mail: [email protected] - Website: www.csa.gov.etNovember, 2010
Why EthiopiaNeeds a Good Statistical System
The role of evidence based policy making has been well recognized by Ethiopia and a great emphasis has been given towards generatingreliable and timely statistical information. This is mainly because the policies and decisions made based on reliable statistics will facilitatethe development and democratization process in progress.
Accordingly the government of Ethiopia has placed due emphasis on using better statistics for furthering its development efforts toimprove the lives of its people.
The basic role of statistics
Statistics can identify social and economic issues. • Statistics have the power to reveal various aspects of economic, social or demographic issues for policy makers and the generalpublic.
Statistics inform the design and choice of policy. • Data informing the economic, social or demographic status of the society can guide governments on how to choose the beststrategy for the interventions to be made. In this regard,- Statistics are a means to map the physical and economic landscape of the society. - Statistics help to provide an empirical evidence for improving the existing policy. - Statistics guide in redesigning policy.
Statistics forecast the future. • Forecasting can evaluate the long term success of a policy or indicate where policies should be focused to prevent future challenges.
Why Ethiopia Needs a Good Statistical System
Better statistics enable to design better policies in order to achievebetter development outcomes
2
Statistics help to inform decisions.• Statistics show policy makers when key indicators are going off track and prompt investigation to re-align policy for better results.Timely and reliable social and economic statistics are needed by government, the business community and citizens in general tomake informed decisions.
To serve the above purposes and play its significant role in the national development processes, statistical information should be timely,reliable and relevant to the national and international development agenda.
Better statistics:
• lead to successful policies.
• provide a corner stone basis for good decision making and allow for in-depth analysis of complex economic and social problems.
• are essential to manage the effective delivery of basic services.
• inform various development challenges facing a country and are a crucial part of development.
• help policy makers and government choose the best interventions and monitor their effect.
• enable the people to judge the successes of government policies and to hold government accountable for its policy implementation.
• are core components of good governance.
• inform and equip the public to participate in national development and consolidate democracy.
• ensure that limited resources are used in an effective way, highlight where resources are needed and follow their impact.
Therefore, good statistics are part of the enabling environment for decision making and development outcomes at all levels. Statisticsmeasure inputs, outputs, outcomes and impact, providing reliable assessments of key economic and social indicators, covering all aspectsof development from measures of economic output and price inflation to the well being of individuals.
If You Can’t Measure It, You Can’t Manage It !Robert S. Kaplan and David P. Norton.
3

The Integration of Statistical Information with Development
Statistical Information
Strategy Policy & Program
Statistical Information
Improved Strategy Policy& Program
Monitoring & Evaluation
Development
4
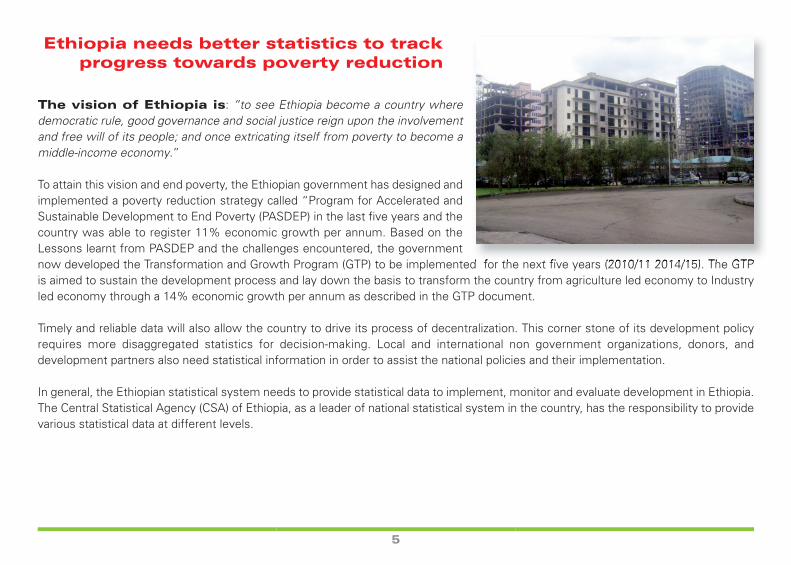
The vision of Ethiopia is: “to see Ethiopia become a country wheredemocratic rule, good governance and social justice reign upon the involvementand free will of its people; and once extricating itself from poverty to become amiddle-income economy.”
To attain this vision and end poverty, the Ethiopian government has designed andimplemented a poverty reduction strategy called “Program for Accelerated andSustainable Development to End Poverty (PASDEP) in the last five years and thecountry was able to register 11% economic growth per annum. Based on theLessons learnt from PASDEP and the challenges encountered, the governmentnow developed the Transformation and Growth Program (GTP) to be implemented for the next five years (2010/11 2014/15). The GTPis aimed to sustain the development process and lay down the basis to transform the country from agriculture led economy to Industryled economy through a 14% economic growth per annum as described in the GTP document.
Timely and reliable data will also allow the country to drive its process of decentralization. This corner stone of its development policyrequires more disaggregated statistics for decision-making. Local and international non government organizations, donors, anddevelopment partners also need statistical information in order to assist the national policies and their implementation.
In general, the Ethiopian statistical system needs to provide statistical data to implement, monitor and evaluate development in Ethiopia.The Central Statistical Agency (CSA) of Ethiopia, as a leader of national statistical system in the country, has the responsibility to providevarious statistical data at different levels.
Ethiopia needs better statistics to track progress towards poverty reduction
5
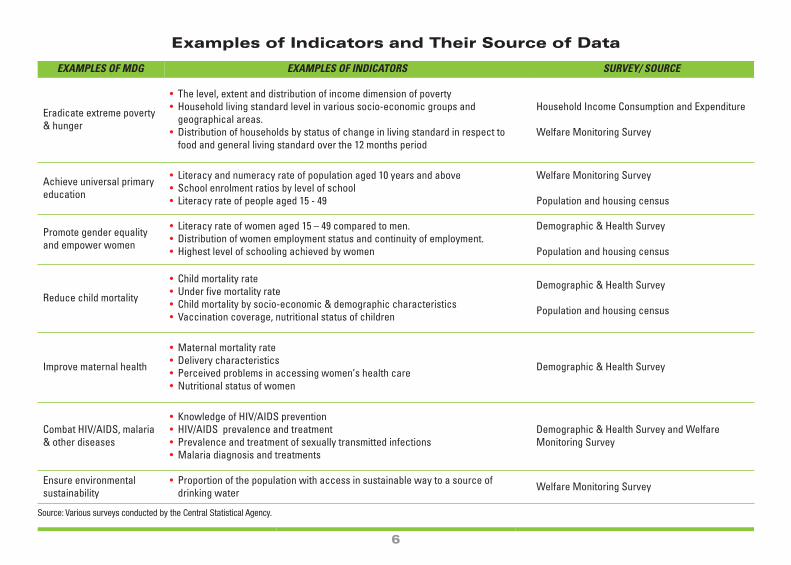
EXAMPLES OF MDG EXAMPLES OF INDICATORS SURVEY/ SOURCE
Eradicate extreme poverty& hunger
• The level, extent and distribution of income dimension of poverty• Household living standard level in various socio-economic groups andgeographical areas.
• Distribution of households by status of change in living standard in respect tofood and general living standard over the 12 months period
Household Income Consumption and Expenditure
Welfare Monitoring Survey
Achieve universal primaryeducation
• Literacy and numeracy rate of population aged 10 years and above• School enrolment ratios by level of school• Literacy rate of people aged 15 - 49
Welfare Monitoring Survey
Population and housing census
Promote gender equalityand empower women
• Literacy rate of women aged 15 – 49 compared to men.• Distribution of women employment status and continuity of employment.• Highest level of schooling achieved by women
Demographic & Health Survey
Population and housing census
Reduce child mortality
• Child mortality rate• Under five mortality rate• Child mortality by socio-economic & demographic characteristics• Vaccination coverage, nutritional status of children
Demographic & Health Survey
Population and housing census
Improve maternal health
• Maternal mortality rate• Delivery characteristics• Perceived problems in accessing women’s health care• Nutritional status of women
Demographic & Health Survey
Combat HIV/AIDS, malaria& other diseases
• Knowledge of HIV/AIDS prevention• HIV/AIDS prevalence and treatment• Prevalence and treatment of sexually transmitted infections • Malaria diagnosis and treatments
Demographic & Health Survey and WelfareMonitoring Survey
Ensure environmentalsustainability
• Proportion of the population with access in sustainable way to a source ofdrinking water Welfare Monitoring Survey
Examples of Indicators and Their Source of Data
6
Source: Various surveys conducted by the Central Statistical Agency.
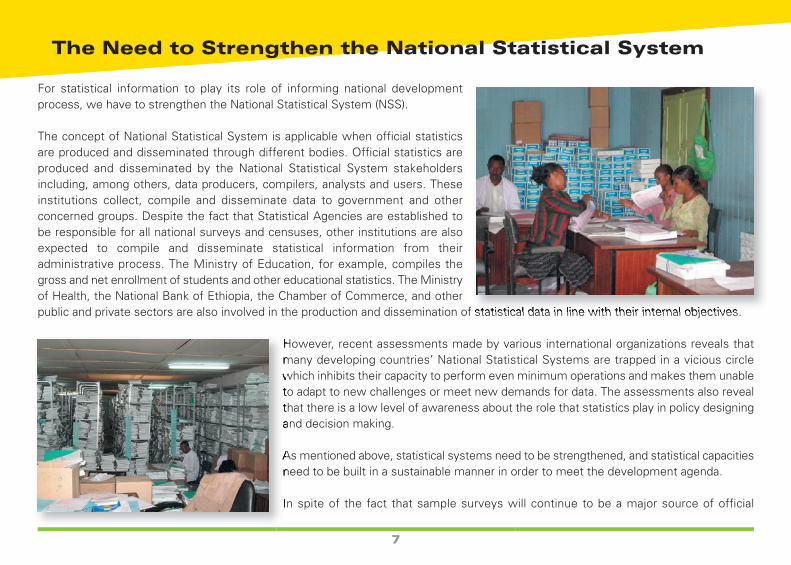
For statistical information to play its role of informing national developmentprocess, we have to strengthen the National Statistical System (NSS).
The concept of National Statistical System is applicable when official statisticsare produced and disseminated through different bodies. Official statistics areproduced and disseminated by the National Statistical System stakeholdersincluding, among others, data producers, compilers, analysts and users. Theseinstitutions collect, compile and disseminate data to government and otherconcerned groups. Despite the fact that Statistical Agencies are established tobe responsible for all national surveys and censuses, other institutions are alsoexpected to compile and disseminate statistical information from theiradministrative process. The Ministry of Education, for example, compiles thegross and net enrollment of students and other educational statistics. The Ministryof Health, the National Bank of Ethiopia, the Chamber of Commerce, and otherpublic and private sectors are also involved in the production and dissemination of statistical data in line with their internal objectives.
However, recent assessments made by various international organizations reveals thatmany developing countries’ National Statistical Systems are trapped in a vicious circlewhich inhibits their capacity to perform even minimum operations and makes them unableto adapt to new challenges or meet new demands for data. The assessments also revealthat there is a low level of awareness about the role that statistics play in policy designingand decision making.
As mentioned above, statistical systems need to be strengthened, and statistical capacitiesneed to be built in a sustainable manner in order to meet the development agenda.
In spite of the fact that sample surveys will continue to be a major source of official
The Need to Strengthen the National Statistical System
7

statistics, the administrative data will increasingly be used in combination with sample survey data. It is believed that successful use ofadministrative data across all domains of social and economic concern would greatly improve the National Statistical System.
In order to make an effective use of different statistics produced and standardize the statistical work of the country, developing a NationalStatistical System (NSS) is crucial. To this end, the CSA in close collaboration with the major stakeholders in the NSS, has prepared theNational Strategy for the Development of Statistics (NSDS) that covers the major activities and improvements to be realized in the nextfive years (2009/10-2013/14).
The identified strategic themes identified in the NSDS
8
Strategic Themes
1. Implementation of the Statistics Law
1.1 The establishment of a NSS methodological and support unit in CSA for quality assessment and NSS capacity building
1.2 The development of common standards & definitions for the NSS and the issuance of proclamations by Council
1.3 The introduction of memoranda of understanding between CSA and its NSS partners
1.4 The coordination of donor relations and statistical initiatives in the NSS
2. Develop data quality procedures
2.1 Developing a data quality assessment framework for Ethiopia (DQAF-E)
2.2 The development and support of ministerial statistical units in NSS partners
2.3 The strengthening of a NSS quality and support unit in CSA for quality assessment and NSS capacity building
3. Enhance advocacy and use of statistics
3.1 Developing an appropriate shared website for the NSS
3.2 Improving statistical launch procedures and press relations
3.3 Training for users including the media
3.4 Establishing regular consultations with data users
9
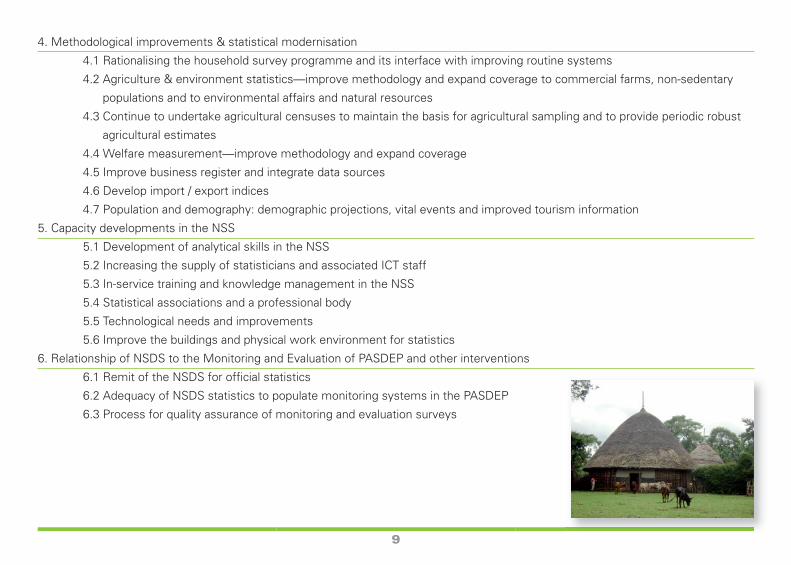
4. Methodological improvements & statistical modernisation
4.1 Rationalising the household survey programme and its interface with improving routine systems
4.2 Agriculture & environment statistics—improve methodology and expand coverage to commercial farms, non-sedentary
populations and to environmental affairs and natural resources
4.3 Continue to undertake agricultural censuses to maintain the basis for agricultural sampling and to provide periodic robust
agricultural estimates
4.4 Welfare measurement—improve methodology and expand coverage
4.5 Improve business register and integrate data sources
4.6 Develop import / export indices
4.7 Population and demography: demographic projections, vital events and improved tourism information
5. Capacity developments in the NSS
5.1 Development of analytical skills in the NSS
5.2 Increasing the supply of statisticians and associated ICT staff
5.3 In-service training and knowledge management in the NSS
5.4 Statistical associations and a professional body
5.5 Technological needs and improvements
5.6 Improve the buildings and physical work environment for statistics
6. Relationship of NSDS to the Monitoring and Evaluation of PASDEP and other interventions
6.1 Remit of the NSDS for official statistics
6.2 Adequacy of NSDS statistics to populate monitoring systems in the PASDEP
6.3 Process for quality assurance of monitoring and evaluation surveys
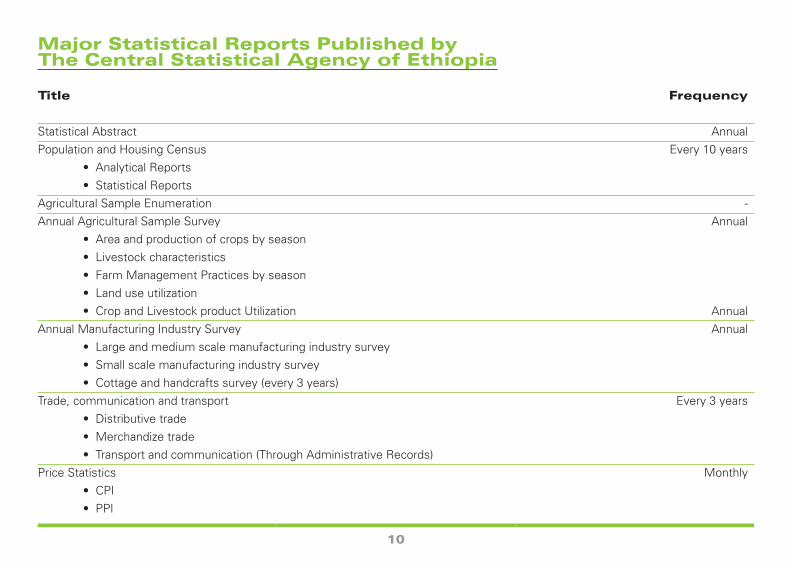
Major Statistical Reports Published by The Central Statistical Agency of Ethiopia
Title Frequency
Statistical Abstract AnnualPopulation and Housing Census Every 10 years
• Analytical Reports• Statistical Reports
Agricultural Sample Enumeration -Annual Agricultural Sample Survey Annual
• Area and production of crops by season• Livestock characteristics• Farm Management Practices by season• Land use utilization• Crop and Livestock product Utilization Annual
Annual Manufacturing Industry Survey Annual• Large and medium scale manufacturing industry survey• Small scale manufacturing industry survey• Cottage and handcrafts survey (every 3 years)
Trade, communication and transport Every 3 years• Distributive trade• Merchandize trade• Transport and communication (Through Administrative Records)
Price Statistics Monthly• CPI• PPI
10
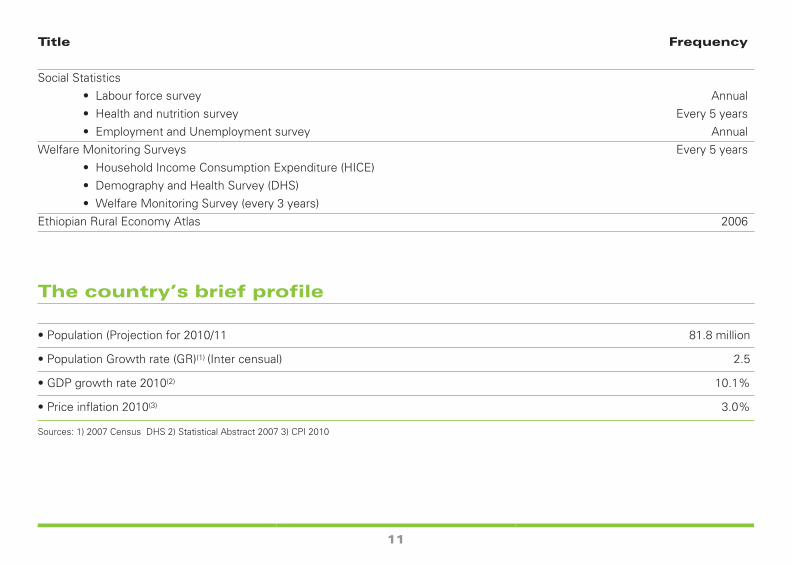
Title Frequency
Social Statistics• Labour force survey Annual• Health and nutrition survey Every 5 years• Employment and Unemployment survey Annual
Welfare Monitoring Surveys Every 5 years• Household Income Consumption Expenditure (HICE)• Demography and Health Survey (DHS)• Welfare Monitoring Survey (every 3 years)
Ethiopian Rural Economy Atlas 2006
The country’s brief profile
• Population (Projection for 2010/11 81.8 million
• Population Growth rate (GR)(1) (Inter censual) 2.5
• GDP growth rate 2010(2) 10.1%
• Price inflation 2010(3) 3.0%
Sources: 1) 2007 Census DHS 2) Statistical Abstract 2007 3) CPI 2010
11
12
This booklet has been produced in collaboration with PARIS21
Central Statistical Agency, EthiopiaTel: 251-11-1553011/251-11-1578156 - Fax: 251-11-1550334 - Box: 1143
E-mail: [email protected]
Website: www.csa.gov.et