Embed Size (px)
Citation preview
Zonge Engineering Strawberry K2 Site, p. 1
CSAMT Geophysical Survey K2 Groundwater Project
Strawberry, Arizona
Prepared for: Pine Water Company
January 30, 2008
by Zonge Engineering & Research Organization, Inc.
3322 E Fort Lowell Rd. Tucson, Arizona, USA 85716
Phone: 520-327-5501 FAX: 520-325-1588 www.zonge.com
Zonge Engineering Strawberry K2 Site, p. 2
TABLE OF CONTENTS
Survey Results Page 3 Project Logistics Page 9
Survey Summary Page 9 Field Instrumentation Page 9 Cultural Contamination Page 10 Data Quality Page 10 Data Presentation Page 11 Smooth-model Inversion Page 11
Sounding Plots Appendix A Equipment Specifications Appendix B CSAMT Background and References Appendix C
List of Plates and Figures
General Map Figure 1 Transmitter Location Map Figure 2 Pseudo-cross section plot of CSAMT data Figure 3
Zonge Engineering Strawberry K2 Site, p. 3
CSAMT Geophysical Survey
Strawberry K2 Site Project
for
Pine Water Company
by Zonge Engineering & Research Organization, Inc.
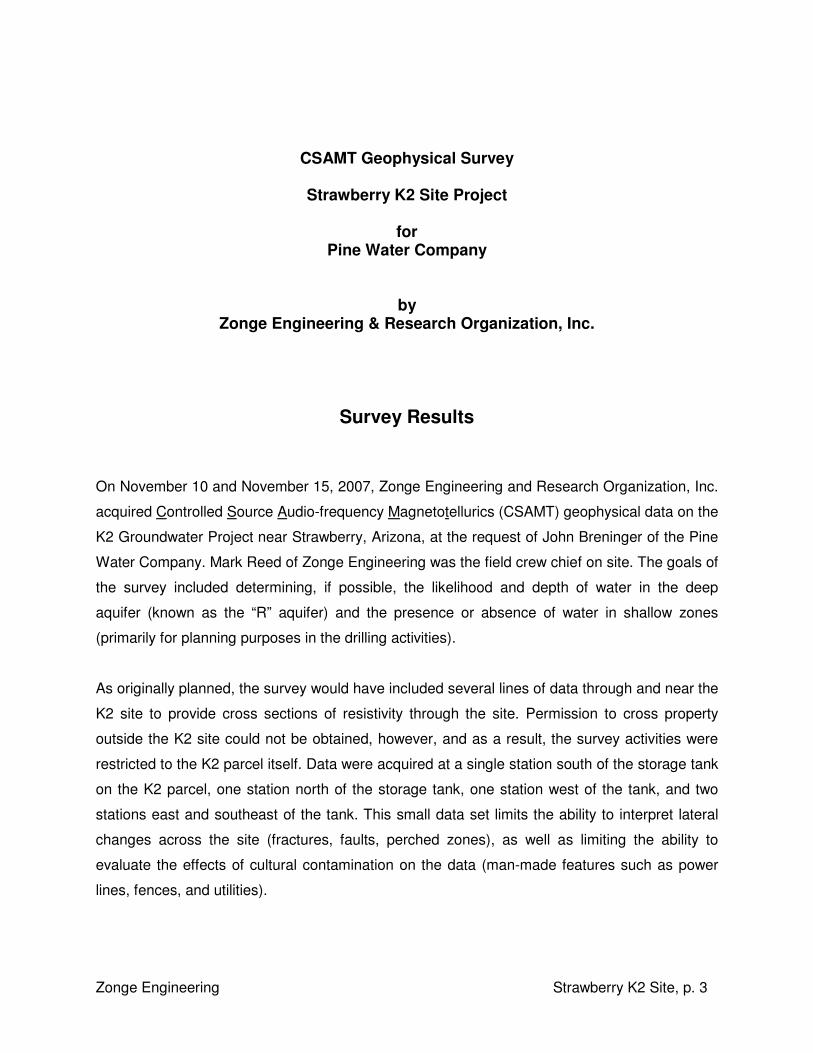
Survey Results On November 10 and November 15, 2007, Zonge Engineering and Research Organization, Inc.
acquired Controlled Source Audio-frequency Magnetotellurics (CSAMT) geophysical data on the
K2 Groundwater Project near Strawberry, Arizona, at the request of John Breninger of the Pine
Water Company. Mark Reed of Zonge Engineering was the field crew chief on site. The goals of
the survey included determining, if possible, the likelihood and depth of water in the deep
aquifer (known as the “R” aquifer) and the presence or absence of water in shallow zones
(primarily for planning purposes in the drilling activities).
As originally planned, the survey would have included several lines of data through and near the
K2 site to provide cross sections of resistivity through the site. Permission to cross property
outside the K2 site could not be obtained, however, and as a result, the survey activities were
restricted to the K2 parcel itself. Data were acquired at a single station south of the storage tank
on the K2 parcel, one station north of the storage tank, one station west of the tank, and two
stations east and southeast of the tank. This small data set limits the ability to interpret lateral
changes across the site (fractures, faults, perched zones), as well as limiting the ability to
evaluate the effects of cultural contamination on the data (man-made features such as power
lines, fences, and utilities).
Zonge Engineering Strawberry K2 Site, p. 4
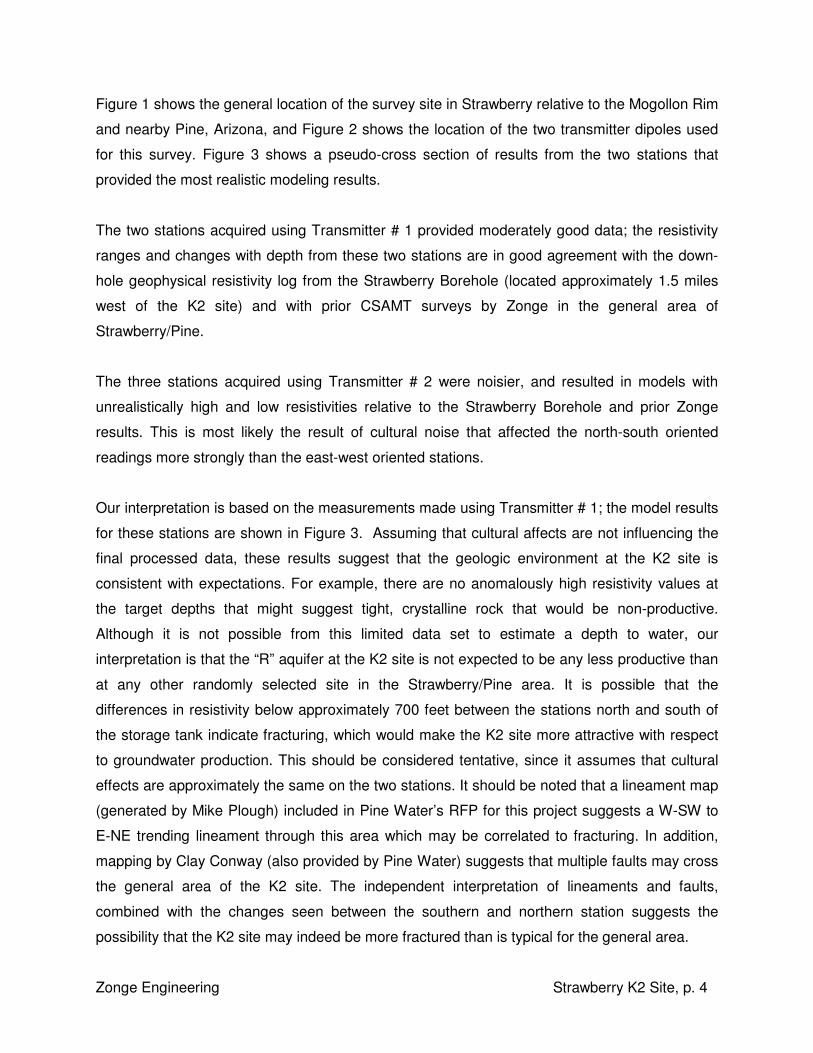
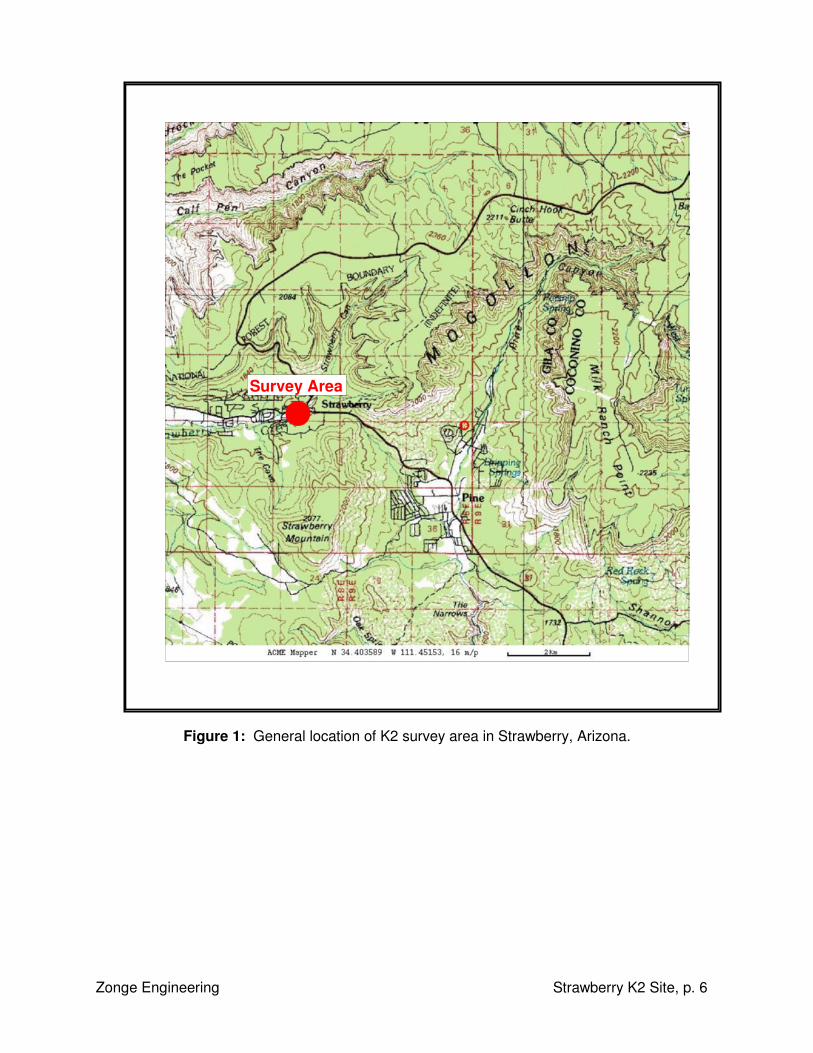
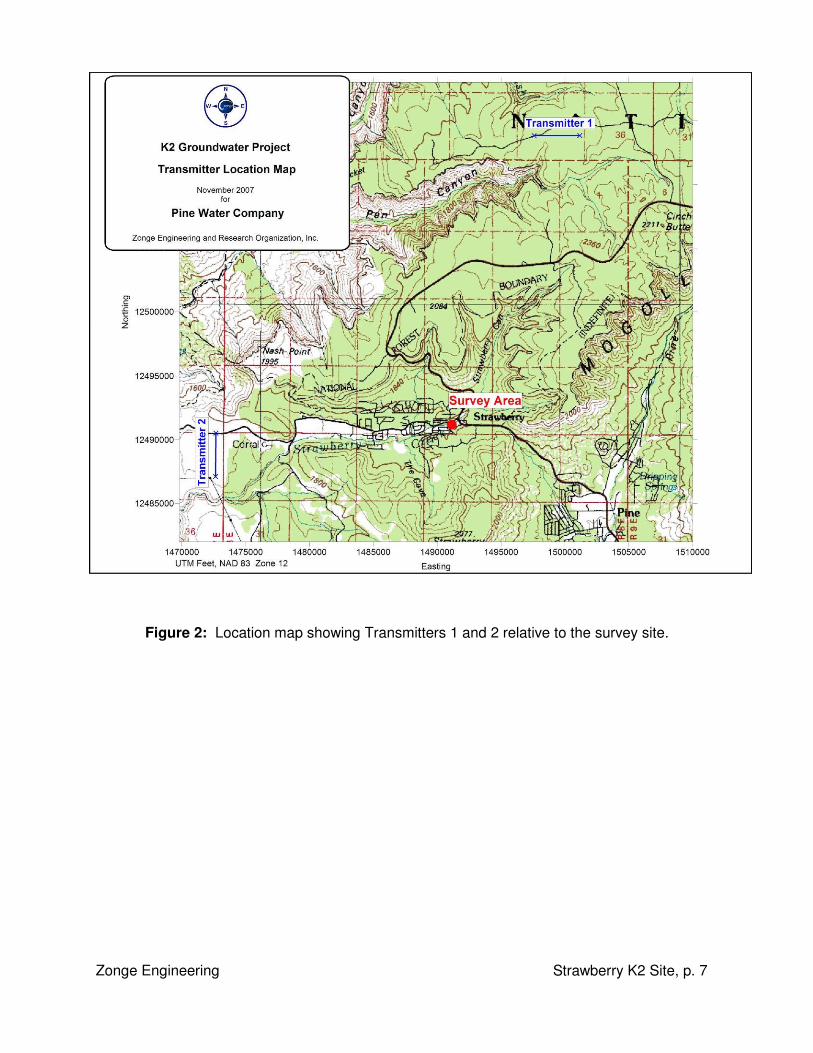
Figure 1 shows the general location of the survey site in Strawberry relative to the Mogollon Rim
and nearby Pine, Arizona, and Figure 2 shows the location of the two transmitter dipoles used
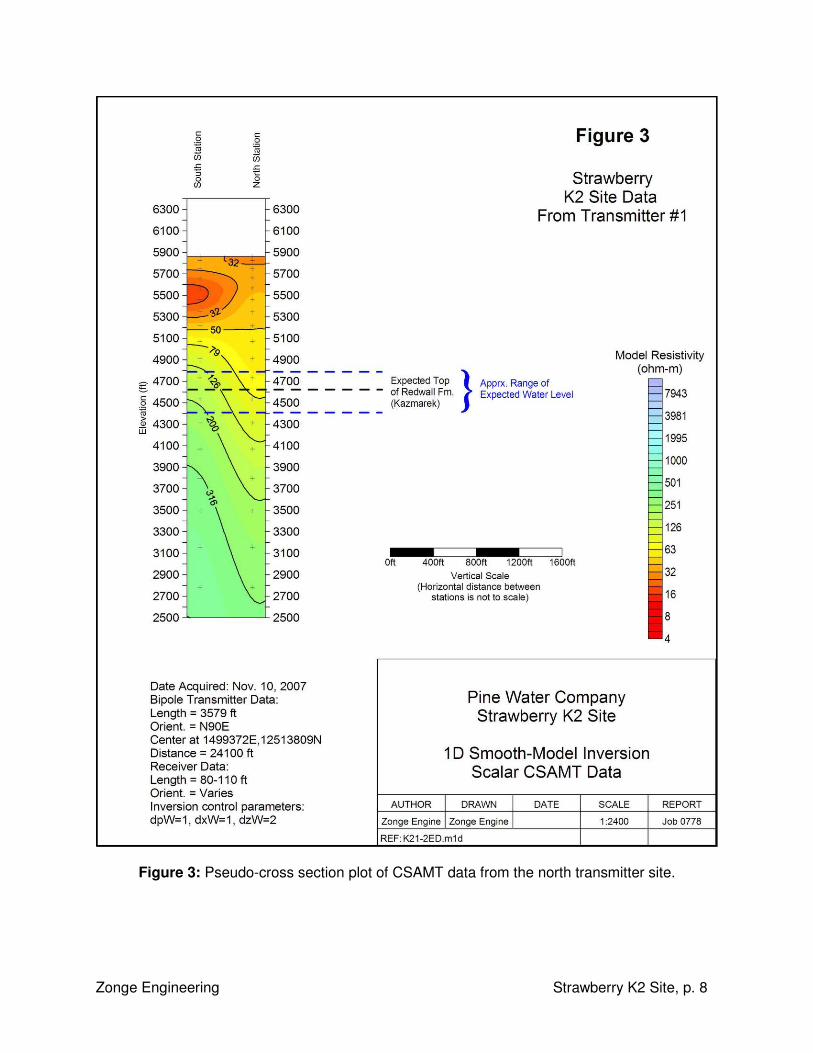
for this survey. Figure 3 shows a pseudo-cross section of results from the two stations that
provided the most realistic modeling results.
The two stations acquired using Transmitter # 1 provided moderately good data; the resistivity
ranges and changes with depth from these two stations are in good agreement with the down-
hole geophysical resistivity log from the Strawberry Borehole (located approximately 1.5 miles
west of the K2 site) and with prior CSAMT surveys by Zonge in the general area of
Strawberry/Pine.
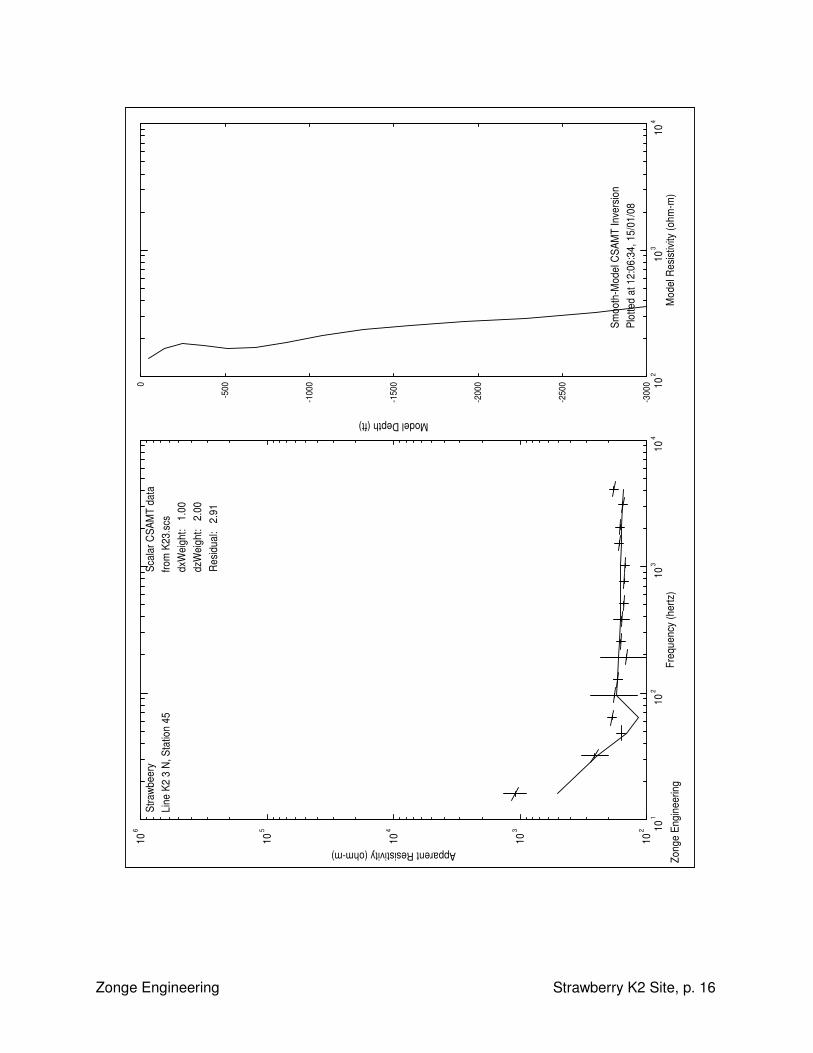
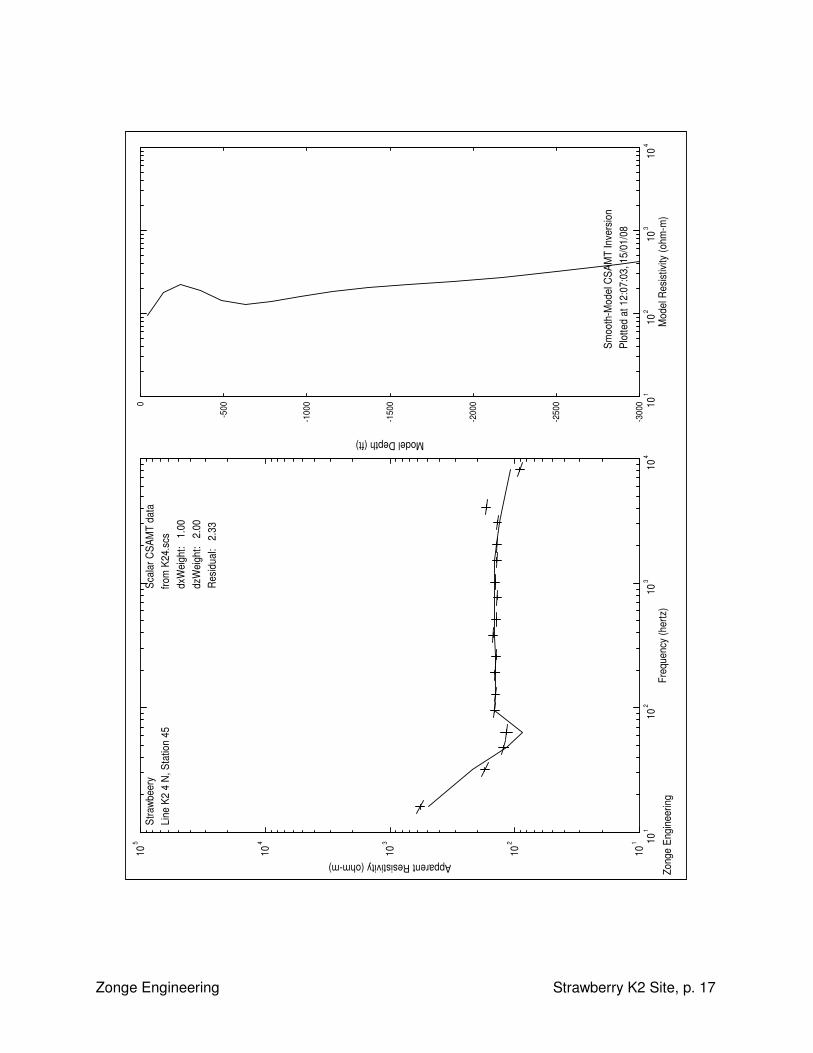
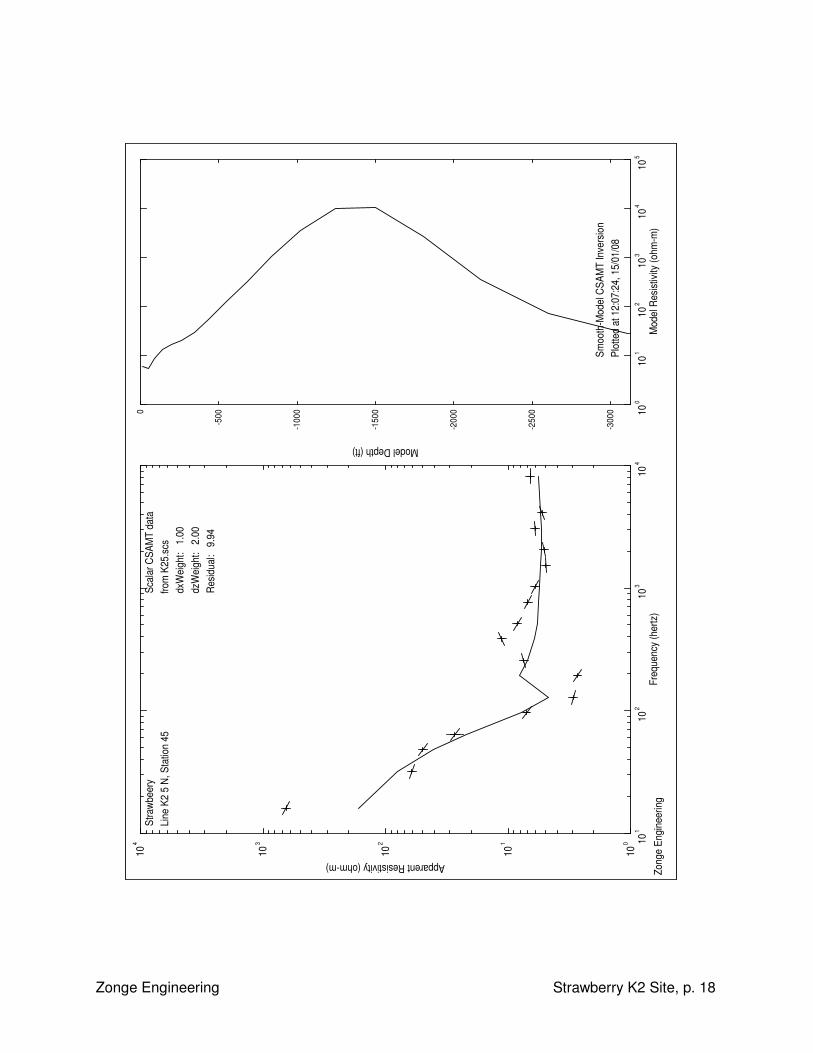
The three stations acquired using Transmitter # 2 were noisier, and resulted in models with
unrealistically high and low resistivities relative to the Strawberry Borehole and prior Zonge
results. This is most likely the result of cultural noise that affected the north-south oriented
readings more strongly than the east-west oriented stations.
Our interpretation is based on the measurements made using Transmitter # 1; the model results
for these stations are shown in Figure 3. Assuming that cultural affects are not influencing the
final processed data, these results suggest that the geologic environment at the K2 site is
consistent with expectations. For example, there are no anomalously high resistivity values at
the target depths that might suggest tight, crystalline rock that would be non-productive.
Although it is not possible from this limited data set to estimate a depth to water, our
interpretation is that the “R” aquifer at the K2 site is not expected to be any less productive than
at any other randomly selected site in the Strawberry/Pine area. It is possible that the
differences in resistivity below approximately 700 feet between the stations north and south of
the storage tank indicate fracturing, which would make the K2 site more attractive with respect
to groundwater production. This should be considered tentative, since it assumes that cultural
effects are approximately the same on the two stations. It should be noted that a lineament map
(generated by Mike Plough) included in Pine Water’s RFP for this project suggests a W-SW to
E-NE trending lineament through this area which may be correlated to fracturing. In addition,
mapping by Clay Conway (also provided by Pine Water) suggests that multiple faults may cross
the general area of the K2 site. The independent interpretation of lineaments and faults,
combined with the changes seen between the southern and northern station suggests the
possibility that the K2 site may indeed be more fractured than is typical for the general area.
Zonge Engineering Strawberry K2 Site, p. 5
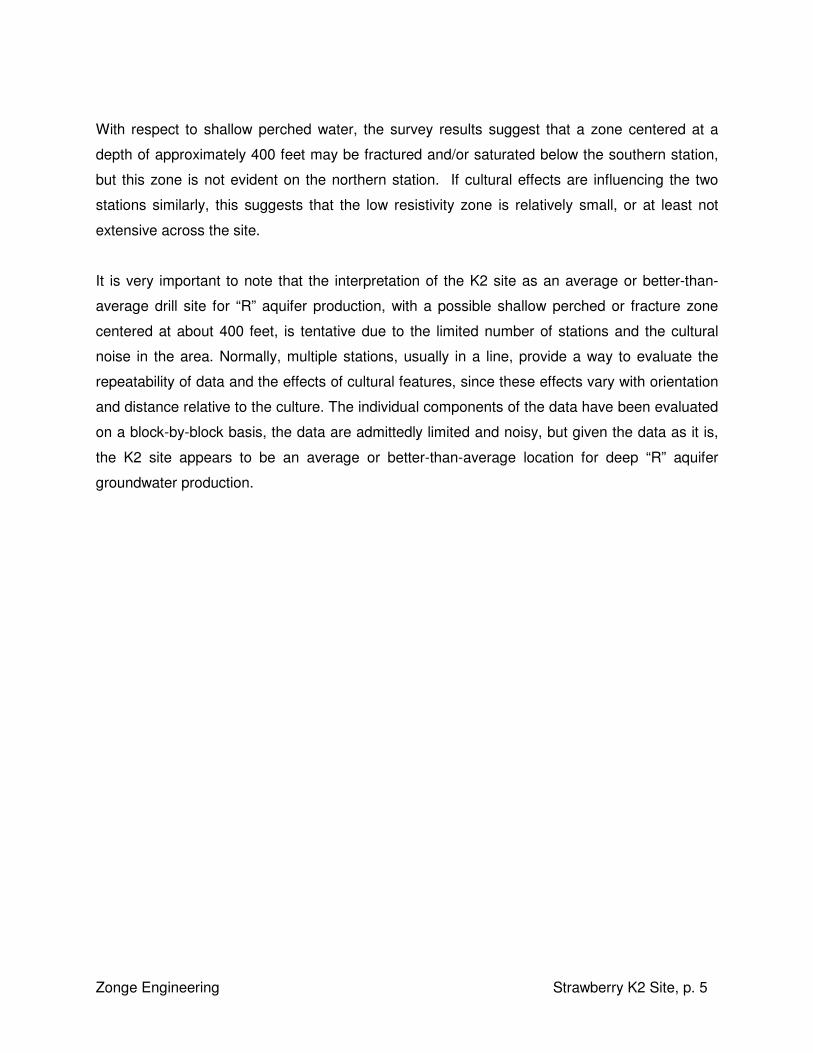
With respect to shallow perched water, the survey results suggest that a zone centered at a
depth of approximately 400 feet may be fractured and/or saturated below the southern station,
but this zone is not evident on the northern station. If cultural effects are influencing the two
stations similarly, this suggests that the low resistivity zone is relatively small, or at least not
extensive across the site.
It is very important to note that the interpretation of the K2 site as an average or better-than-
average drill site for “R” aquifer production, with a possible shallow perched or fracture zone
centered at about 400 feet, is tentative due to the limited number of stations and the cultural
noise in the area. Normally, multiple stations, usually in a line, provide a way to evaluate the
repeatability of data and the effects of cultural features, since these effects vary with orientation
and distance relative to the culture. The individual components of the data have been evaluated
on a block-by-block basis, the data are admittedly limited and noisy, but given the data as it is,
the K2 site appears to be an average or better-than-average location for deep “R” aquifer
groundwater production.
Zonge Engineering Strawberry K2 Site, p. 6
Figure 1: General location of K2 survey area in Strawberry, Arizona.
Survey Area
Zonge Engineering Strawberry K2 Site, p. 7
Figure 2: Location map showing Transmitters 1 and 2 relative to the survey site.
Zonge Engineering Strawberry K2 Site, p. 8
Figure 3: Pseudo-cross section plot of CSAMT data from the north transmitter site.
Zonge Engineering Strawberry K2 Site, p. 9
PROJECT LOGISTICS
Survey Summary: The geophysical survey was designed to map subsurface changes in
resistivity, which can be related to changes in pore space and pore fluids. Bedrock is often high
resistivity relative to overlying material, and fractured, saturated bedrock is often lower resistivity
than un-fractured bedrock. Areas of high TDS in the groundwater should appear more
conductive than equivalent areas of low TDS. Variations in depth to bedrock, faulting, and other
structural changes are often also evident as changes in resistivity. The geophysical method
used was controlled source audio-frequency magnetotellurics (CSAMT). CSAMT is a resistivity
sounding method used commonly in the minerals, geothermal, and groundwater exploration
industries. This method typically has higher lateral resolution than other resistivity methods, and
is usually logistically more efficient.
The CSAMT data were acquired on two days in November of 2007. The CSAMT stations were
acquired using an electric-field receiver dipole size varying from 80 to120 feet (due to property
restrictions), and the transmitted frequencies were in binary increments from 4 Hz up to 8192 Hz
(i.e., 4Hz, 8 Hz, 16 Hz, etc.). For each electric-field measurement, a magnetic field
measurement was made simultaneously at the center of the dipole.
Hand-held GPS measurements for the station locations are as follows (in NAD 83 UTM feet,
Zone 12):
Sounding Easting Northing K21 1491112 12491205 K22 1491110 12491259 K23 1491078 12491220 K24 1491150 12491204 K25 1491164 12491136
These locations should be considered approximate, since the GPS locations were acquired
using a hand-held GPS unit, and vegetative cover, structures, and topography most likely
affected satellite reception.
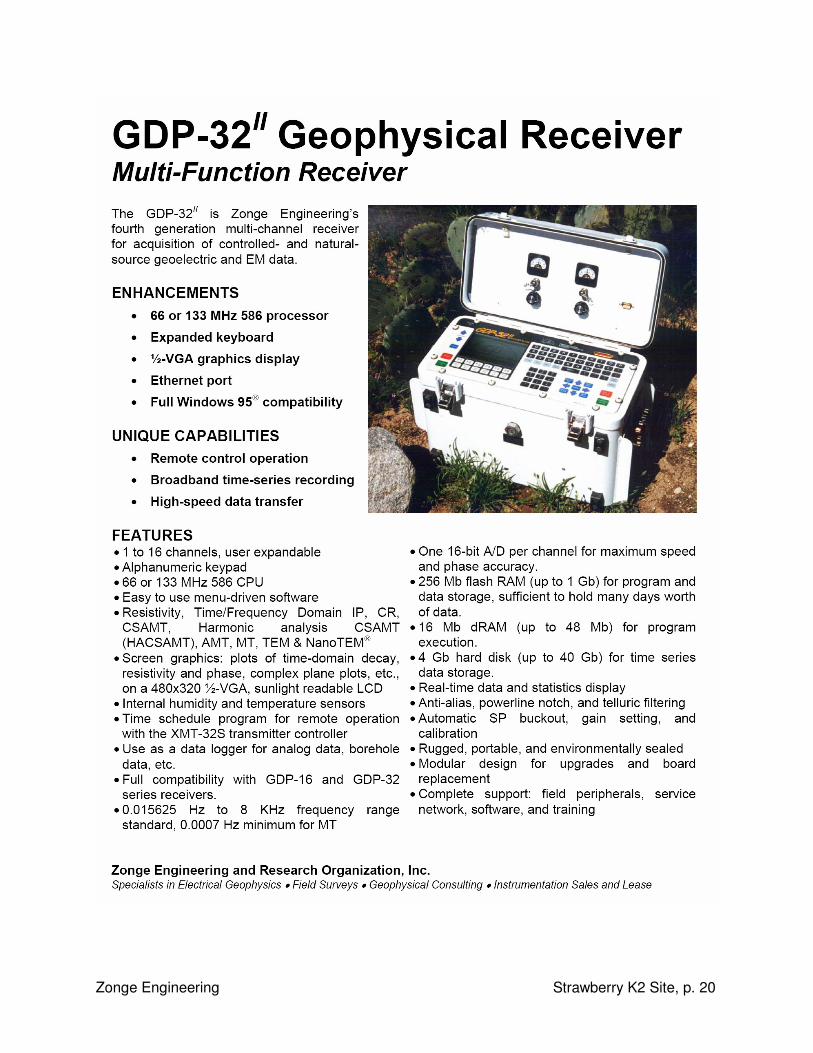
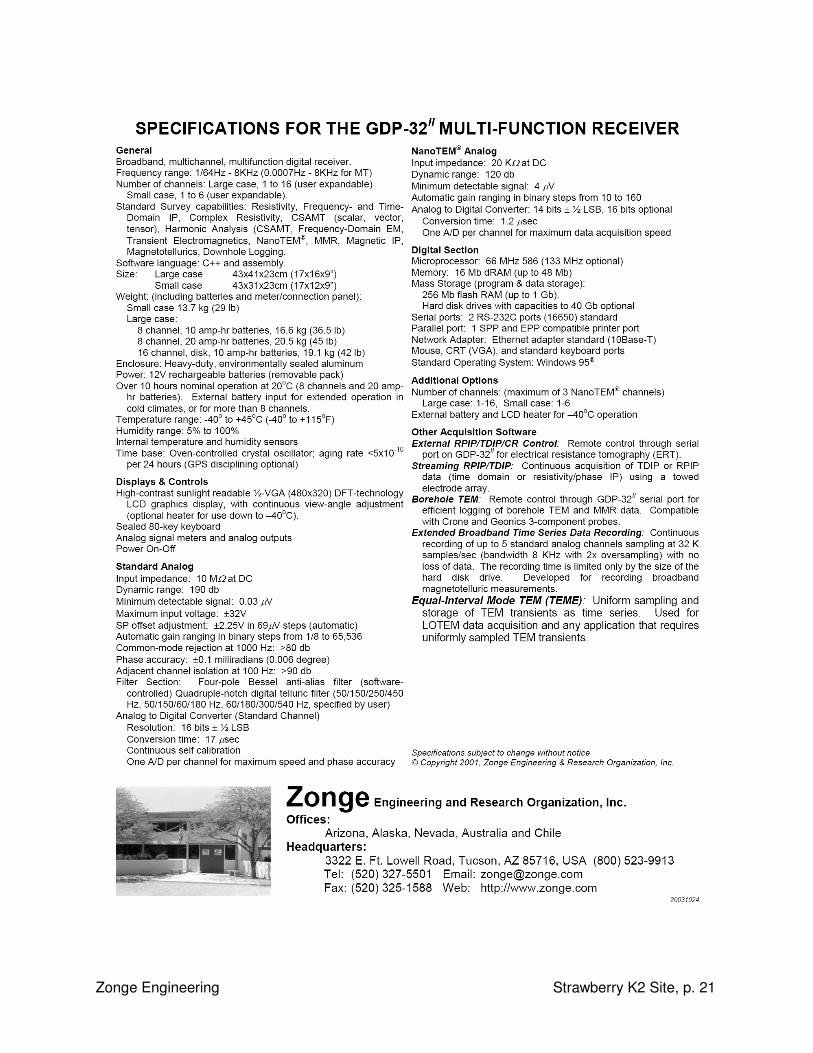
Field Instrumentation: The receiver used for the CSAMT survey was a Zonge GDP-32 multi-
purpose receiver. This receiver is a backpack-portable, 16-bit, microprocessor-controlled
Zonge Engineering Strawberry K2 Site, p. 10
receiver capable of gathering data on as many as 16 channels simultaneously. The electric-
field signals were sensed using non-polarizable porous pot electrodes, connected to the
receiver with 16-gauge insulated wire. The CSAMT magnetic-field signal was sensed with a
Zonge Ant/1B magnetic field antenna.
The signal source for the survey was a Zonge GGT-30 transmitter, which is a current-controlled
transmitter capable of 30 kW output. The transmitter was controlled with an XMT-32 transmitter
controller, which contains a quartz oscillator identical to the one in the receiver. Each morning
prior to data acquisition, the two oscillators were trimmed and synchronized in order to allow the
crew to acquire accurate phase data.
For each CSAMT receiver setup, the transmitter generates a square-wave signal at discrete
frequencies from 4 hertz to 8192 hertz in binary increments (i.e.,4 Hz, 8 Hz, 16 Hz, etc.).
Electric and magnetic field values were recorded at each of these primary frequencies, as well
as the odd harmonics for all frequencies up to 1024 Hz. Results from the electric and magnetic
field measurements are then used to calculate resistivity and impedance phase values at each
measured frequency, from which depth vs. resistivity sections can be generated. At all
frequencies, the receiver recorded the received electric field and magnetic field magnitude and
phase components, as well as the data at the odd harmonics (3rd, 5th, 7th, and 9th) of the
transmitted frequencies, providing a very large data set for modeling purposes. The 1st and 3rd
harmonics were used for modeling purposes.
Cultural Contamination: Cultural contamination refers to any man-made electrically conductive
or electrically noisy objects that may influence the geophysical measurements. These include
passive objects like metal fences, pipelines, power lines, or large metal structures, and active
(electrically) objects such as active power lines, pipelines with cathodic protection, and radio
transmitters. The K2 site is in a residential area and has numerous sources of electrical noise,
including power lines, fences, and pipelines, as well as suspected buried utilities that were not
obvious to the field crew.
Data Quality: Data quality was only poor to fair on this project, due to the cultural noise
discussed above. Standard Zonge field procedure requires that the receiver operator make
multiple measurements of each data point while monitoring real-time standard-error values
displayed on the screen of the receiver. For CSAMT, multiple blocks of the data are also
displayed graphically as resistivity-versus-frequency curves (plotted on a log-log scale), with
Zonge Engineering Strawberry K2 Site, p. 11
error bars denoting data scatter for the operator in the field. The data quality for these five sets
of measurements is considered poor (at Station 5 for example) to fair (at Station 1).
Data Presentation: The results of processing and modeling the data are shown as a color
pseudo-cross section for stations 1 and 2 (south and north of the storage tank, respectively),
which were acquired from the northern transmitter. In this plot, decreasing elevation is shown
down the side of the plot. Resistivity results are shown in ohm-meters, with “warm” colors
(orange, red) indicating low resistivity and “cool” colors (green, blue) indicating high resistivity.
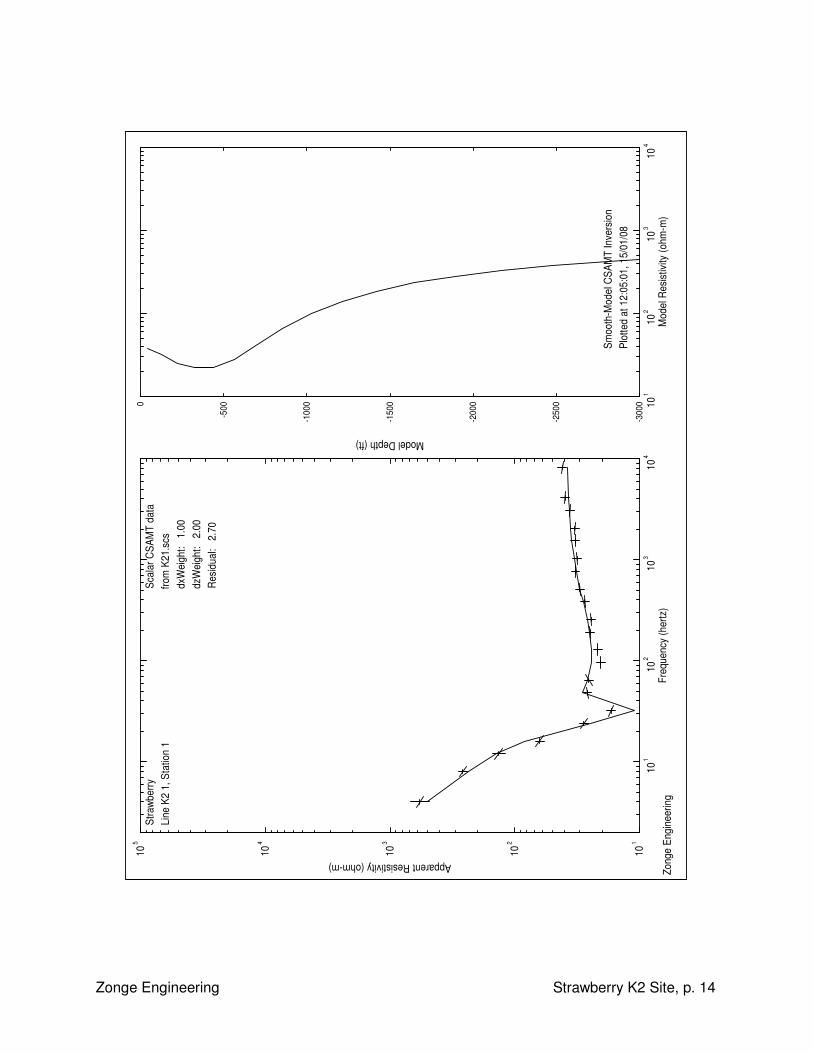
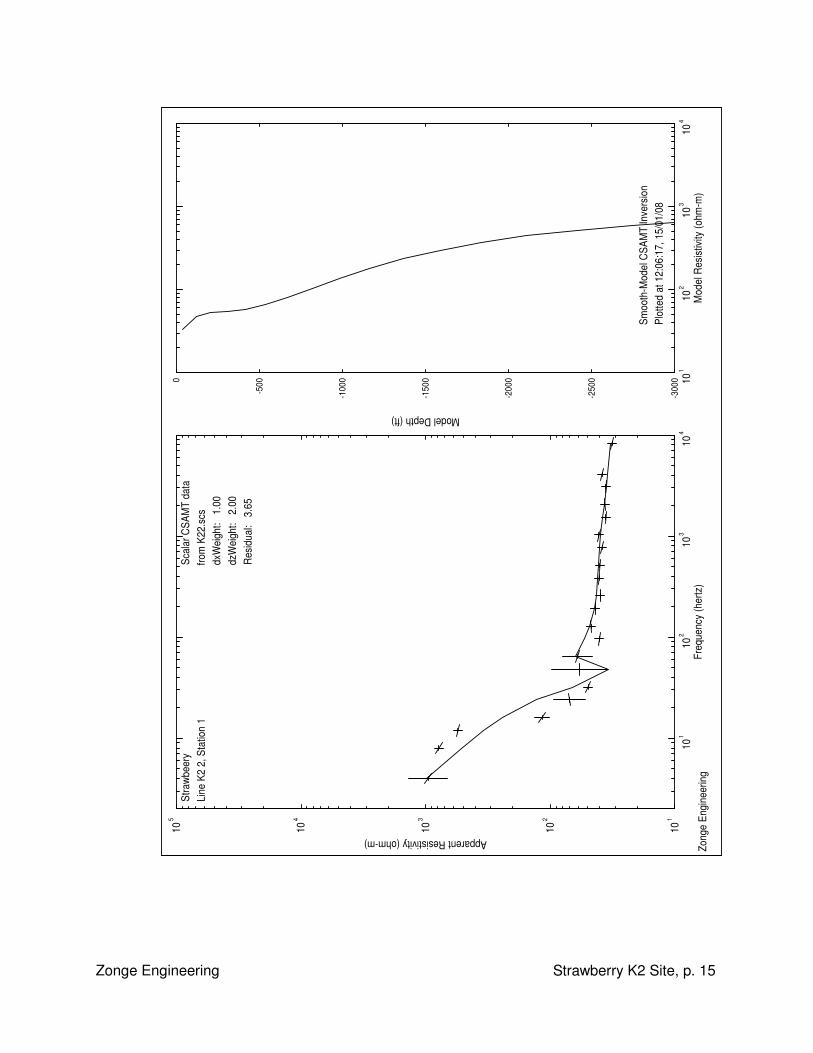
The color shading and contouring is on a logarithmic scale. Raw data and sounding curves for
each station are also included in the appendix of this report.
Smooth-Model Inversion: Briefly, smooth-model inversion mathematically “back-calculates” (or
“inverts”) from the measured data to determine a likely location, size and depth of the source or
sources of resistivity changes. The results of the smooth-model inversion are intentionally
gradational, rather than showing abrupt, “blocky” changes in the subsurface.
For the CSAMT data, a 1D smooth-model inversion program was used for modeling this data
due to the inability to acquire multiple stations in along a line. This program is a robust method
for converting CSAMT measurements to profiles of resistivity versus depth. Cagniard apparent
resistivities and impedance-phase data for each station are used to determine the parameters of
a layered earth model. Layer thicknesses are fixed by calculating source-field penetration
depths for each frequency. Layer resistivities are then adjusted iteratively until the model
CSAMT response is as close as possible to the observed data. The algorithm for calculating
the CSAMT response of a layered model includes the effects of finite transmitter-receiver
separation and a three-dimensional source field. Accurate impedance magnitude and phase
values are calculated for all frequencies and transmitter-receiver separations for the 1-D
models. The result of the smooth-model inversion is a set of estimated resistivities which vary
smoothly with depth, giving the gradational result seen in the color data plots in this report. The
smooth-model inversion does not require any a priori estimates of model parameters, thus the
results are unaffected by any data processor's bias.
Zonge Engineering Strawberry K2 Site, p. 12
Norman R. Carlson Cris Mayerle Chief Geophysicist Geophysicist Zonge Engineering & Research Organization, Inc. 3322 E. Fort Lowell Rd. Tucson. Arizona, USA 85716
Zonge Engineering Strawberry K2 Site, p. 13
Appendix A
Sounding Plots
Zonge Engineering Strawberry K2 Site, p. 14
Freq
uenc
y (h
ertz
)10
110
210
310
4
Apparent Resistivity (ohm-m)
101
102
103
104
105
Mod
el R
esis
tivity
(ohm
-m)
101
102
103
104
Model Depth (ft)
-300
0
-250
0
-200
0
-150
0
-100
0
-5000
Stra
wbe
rryLi
ne K
2 1,
Sta
tion
1Sc
alar
CSA
MT
data
from
K21
.scs
dxW
eigh
t: 1
.00
dzW
eigh
t: 2
.00
Res
idua
l: 2
.70
Smoo
th-M
odel
CSA
MT
Inve
rsio
nPl
otte
d at
12:
05:0
1, 1
5/01
/08
Zong
e En
gine
erin
g
Zonge Engineering Strawberry K2 Site, p. 15
Freq
uenc
y (h
ertz
)10
110
210
310
4
Apparent Resistivity (ohm-m)
101
102
103
104
105
Mod
el R
esis
tivity
(ohm
-m)
101
102
103
104
Model Depth (ft)
-300
0
-250
0
-200
0
-150
0
-100
0
-5000
Stra
wbe
ery
Line
K2
2, S
tatio
n 1
Scal
ar C
SAM
T da
tafro
m K
22.s
csdx
Wei
ght:
1.0
0dz
Wei
ght:
2.0
0R
esid
ual:
3.6
5
Smoo
th-M
odel
CSA
MT
Inve
rsio
nPl
otte
d at
12:
06:1
7, 1
5/01
/08
Zong
e En
gine
erin
g
Zonge Engineering Strawberry K2 Site, p. 16
Freq
uenc
y (h
ertz
)10
110
210
310
4
Apparent Resistivity (ohm-m)
102
103
104
105
106
Mod
el R
esis
tivity
(ohm
-m)
102
103
104
Model Depth (ft)
-300
0
-250
0
-200
0
-150
0
-100
0
-5000
Stra
wbe
ery
Line
K2
3 N
, Sta
tion
45Sc
alar
CSA
MT
data
from
K23
.scs
dxW
eigh
t: 1
.00
dzW
eigh
t: 2
.00
Res
idua
l: 2
.91
Smoo
th-M
odel
CSA
MT
Inve
rsio
nPl
otte
d at
12:
06:3
4, 1
5/01
/08
Zong
e En
gine
erin
g
Zonge Engineering Strawberry K2 Site, p. 17
Freq
uenc
y (h
ertz
)10
110
210
310
4
Apparent Resistivity (ohm-m)
101
102
103
104
105
Mod
el R
esis
tivity
(ohm
-m)
101
102
103
104
Model Depth (ft)
-300
0
-250
0
-200
0
-150
0
-100
0
-5000
Stra
wbe
ery
Line
K2
4 N
, Sta
tion
45Sc
alar
CSA
MT
data
from
K24
.scs
dxW
eigh
t: 1
.00
dzW
eigh
t: 2
.00
Res
idua
l: 2
.33
Smoo
th-M
odel
CSA
MT
Inve
rsio
nPl
otte
d at
12:
07:0
3, 1
5/01
/08
Zong
e En
gine
erin
g
Zonge Engineering Strawberry K2 Site, p. 18
Freq
uenc
y (h
ertz
)10
110
210
310
4
Apparent Resistivity (ohm-m)
100
101
102
103
104
Mod
el R
esis
tivity
(ohm
-m)
100
101
102
103
104
105
Model Depth (ft)-3
000
-250
0
-200
0
-150
0
-100
0
-5000
Stra
wbe
ery
Line
K2
5 N
, Sta
tion
45Sc
alar
CSA
MT
data
from
K25
.scs
dxW
eigh
t: 1
.00
dzW
eigh
t: 2
.00
Res
idua
l: 9
.94
Smoo
th-M
odel
CSA
MT
Inve
rsio
nPl
otte
d at
12:
07:2
4, 1
5/01
/08
Zong
e En
gine
erin
g

Zonge Engineering Strawberry K2 Site, p. 19
Appendix B
Equipment Specifications
Zonge Engineering Strawberry K2 Site, p. 20
Zonge Engineering Strawberry K2 Site, p. 21
Zonge Engineering Strawberry K2 Site, p. 22
Appendix C CSAMT is a commonly-used, surface-based geophysical method which provides resistivity
information of the subsurface, usually at greater depths and better lateral resolution than other
resistivity methods such as Schlumberger soundings, dipole-dipole, or gradient arrays. CSAMT
has been used extensively by the minerals, geothermal, hydrocarbon, and groundwater
exploration industries since 1978 when CSAMT equipment systems first became commercially
available.
CSAMT Methodology: Controlled source audio-frequency magnetotellurics (CSAMT) is a high-
resolution electromagnetic sounding technique that uses a fixed grounded dipole as a signal
source. For complete, published, peer-reviewed discussions of the CSAMT method and its
common applications, see the Zonge and Hughes (1991) and Zonge (1992) references. Briefly,
the CSAMT method can be described as follows:
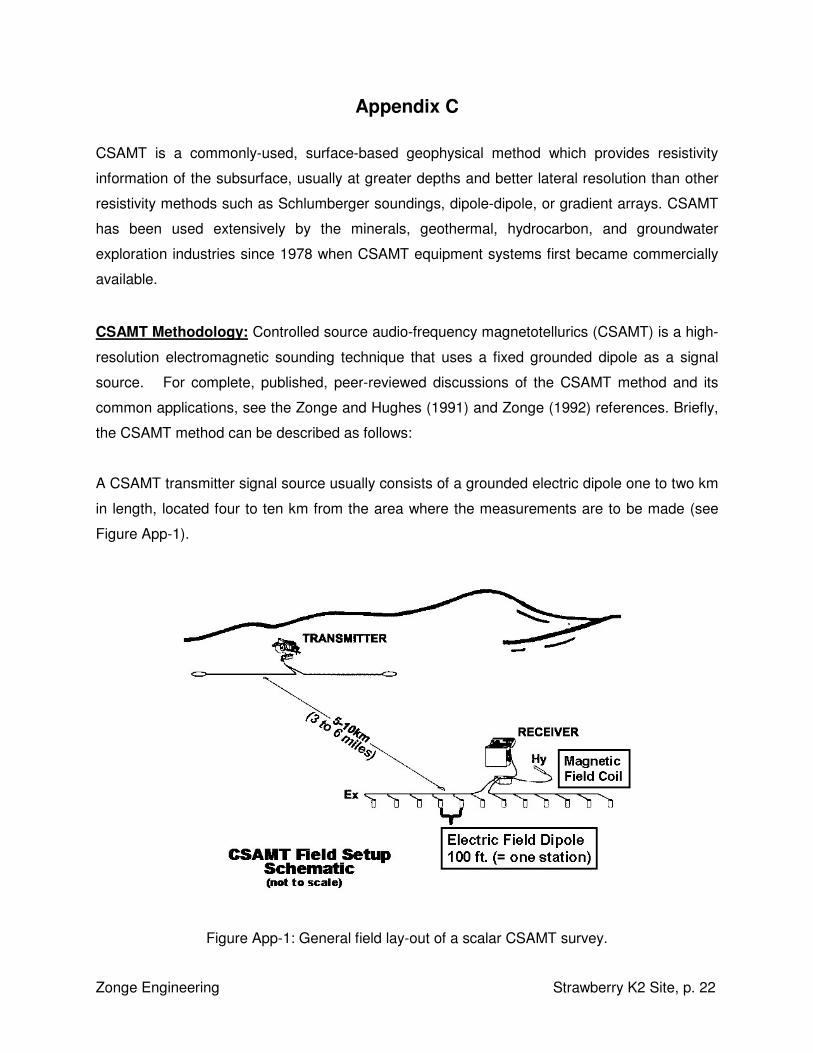
A CSAMT transmitter signal source usually consists of a grounded electric dipole one to two km
in length, located four to ten km from the area where the measurements are to be made (see
Figure App-1).
Figure App-1: General field lay-out of a scalar CSAMT survey.
Zonge Engineering Strawberry K2 Site, p. 23
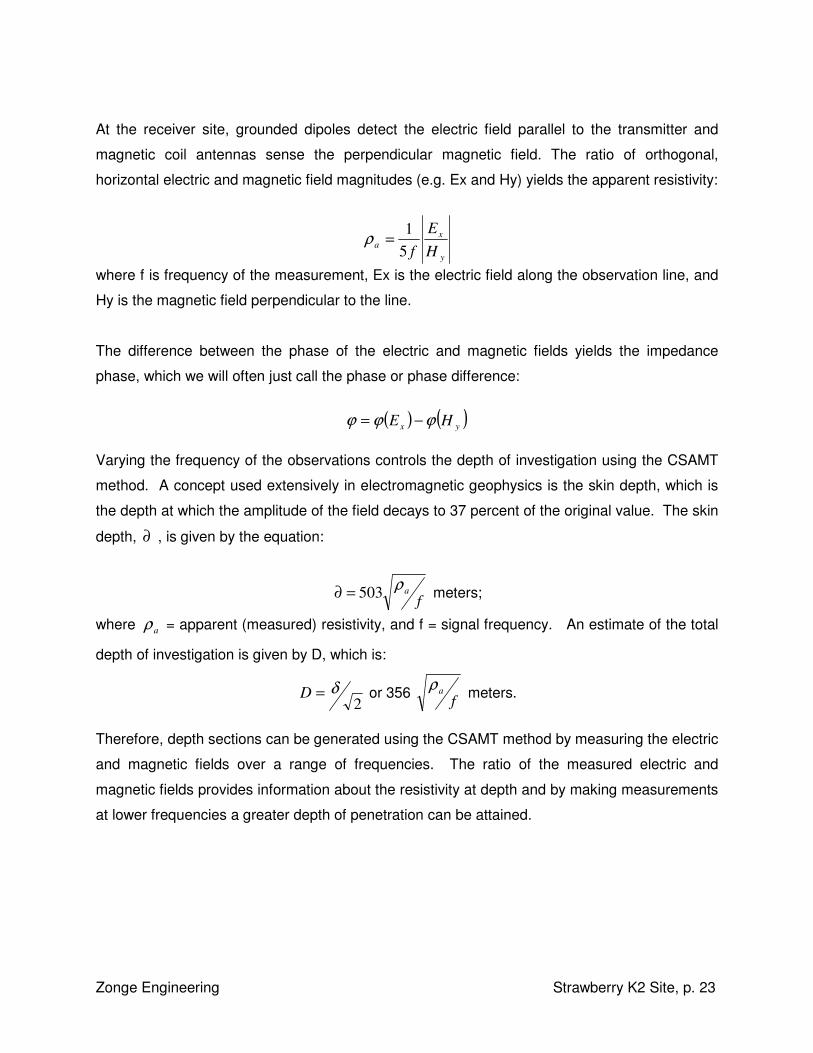
At the receiver site, grounded dipoles detect the electric field parallel to the transmitter and
magnetic coil antennas sense the perpendicular magnetic field. The ratio of orthogonal,
horizontal electric and magnetic field magnitudes (e.g. Ex and Hy) yields the apparent resistivity:
y
xa H
Ef5
1=ρ
where f is frequency of the measurement, Ex is the electric field along the observation line, and
Hy is the magnetic field perpendicular to the line.
The difference between the phase of the electric and magnetic fields yields the impedance
phase, which we will often just call the phase or phase difference:
( ) ( )yx HE ϕϕϕ −=
Varying the frequency of the observations controls the depth of investigation using the CSAMT
method. A concept used extensively in electromagnetic geophysics is the skin depth, which is
the depth at which the amplitude of the field decays to 37 percent of the original value. The skin
depth, ∂ , is given by the equation:
faρ503=∂ meters;
where aρ = apparent (measured) resistivity, and f = signal frequency. An estimate of the total
depth of investigation is given by D, which is:
2δ=D or 356 f
aρ meters.
Therefore, depth sections can be generated using the CSAMT method by measuring the electric
and magnetic fields over a range of frequencies. The ratio of the measured electric and
magnetic fields provides information about the resistivity at depth and by making measurements
at lower frequencies a greater depth of penetration can be attained.
Zonge Engineering Strawberry K2 Site, p. 24
CSAMT Reference Material
Cagniard, L. 1953, Basic Theory of the magnetotelluric method of geophysical prospecting, Geophysics, 18, pp. 605-635. Goldstein, M.A., and Strangway, D.W., 1975, Audio-frequency magnetotellurics with a grounded electric dipole source: Geophysics, 40, 669-683. Hughes, L.J., and Carlson, N.R., 1987, Structure mapping at Trap Spring Oilfield, Nevada, using controlled-source magnetotellurics, First Break, Vol. 5, No. 11, the European Association of Exploration Geophysicists, pp. 403-418. Zonge, K.L., Ostrander, A.O., and Emer, D.F., 1985, Controlled-source Audio-Frequency Magnetotelluric Measurements, in Magnetotelluric Methods, ed. Vozoff, K., Geophysics Reprint Series No. 5, Society of Exploration Geophysicists, pp. 749-763. Zonge, K.L. and Hughes, L.J., 1991, “Controlled source audio-frequency magnetotellurics”, in Electromagnetic Methods in Applied Geophysics, ed. Nabighian, M.N., Vol. 2, Society of Exploration Geophysicists, pp. 713-809. Zonge, K. L., 1992, “Broad Band Electromagnetic Systems”, in Practical Geophysics II for the Exploration Geologist”, ed. Richard Van Blaricom, Northwest Mining Association, pp. 439-523.