Embed Size (px)
Citation preview

CSc 110, Spring 2017Lecture 26: Lists of Lists
1

List of lists mysterydef mystery(data, pos, n):
result = []
for i in range(0, n):
for j in range(0, n):
result.append(data[i + pos][j + pos])
return result
Suppose that a variable called grid has been declared as follows:grid = [[8, 2, 7, 8, 2, 1], [1, 5, 1, 7, 4, 7],
[5, 9, 6, 7, 3, 2], [7, 8, 7, 7, 7, 9],
[4, 2, 6, 9, 2, 3], [2, 2, 8, 1, 1, 3]]
which means it will store the following 6-by-6 grid of values:8 2 7 8 2 1 1 5 1 7 4 7 5 9 6 7 3 2 7 8 7 7 7 9 4 2 6 9 2 3 2 2 8 1 1 3
For each call at right, indicate what value is returned. If the function call results in an error, write error instead.
Function Call Contents of List Returned
mystery(grid, 2, 2) ___________________________
mystery(grid, 0, 2) ___________________________
mystery(grid, 3, 3) ___________________________
2

Find Lucky 7Write a function lucky(m)that takes a rectangular list m and looks for the number 7 in m. If found, lucky returns a list containing the row and column position of 7, and if not found, returns an empty list.
Example:
z = [[20, 3, 6], [4, 12, 18], [6, 13, 5], [15, 7, 8]]
lucky(z)
Returns
[3,1]
3
Mountain peak
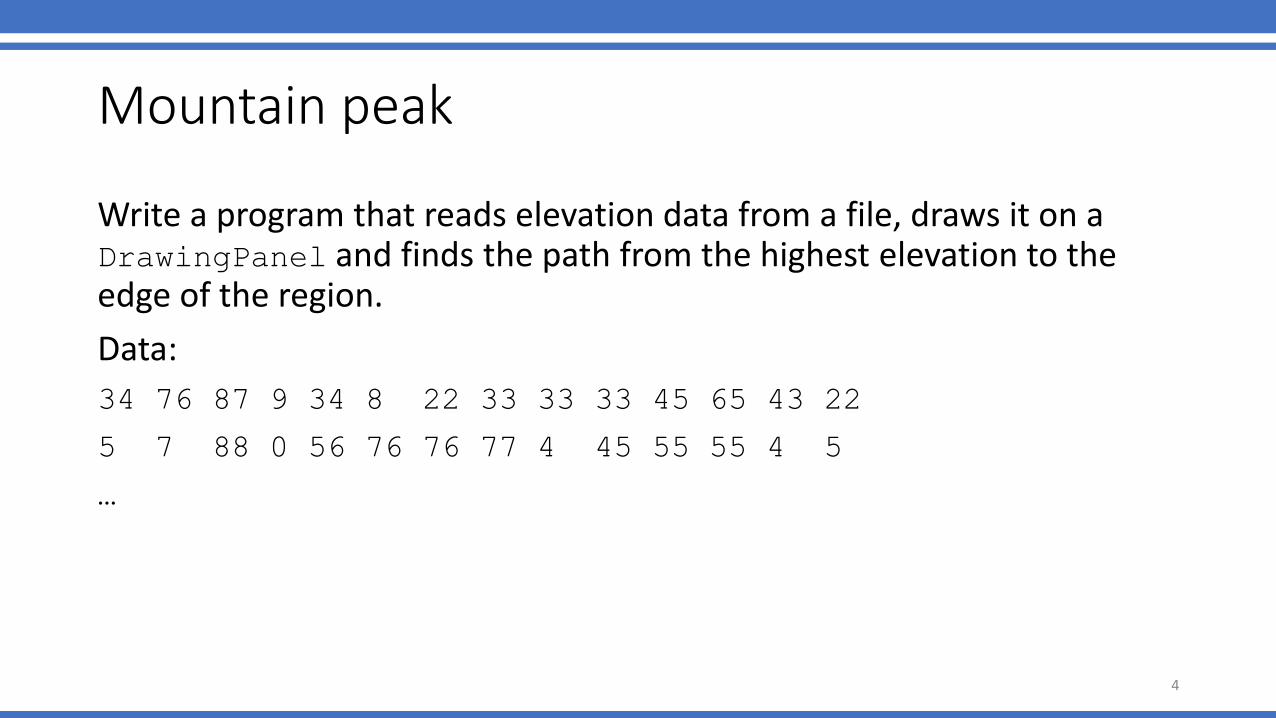
Write a program that reads elevation data from a file, draws it on a DrawingPanel and finds the path from the highest elevation to the edge of the region.
Data:
34 76 87 9 34 8 22 33 33 33 45 65 43 22
5 7 88 0 56 76 76 77 4 45 55 55 4 5
…
4
Mountain peak
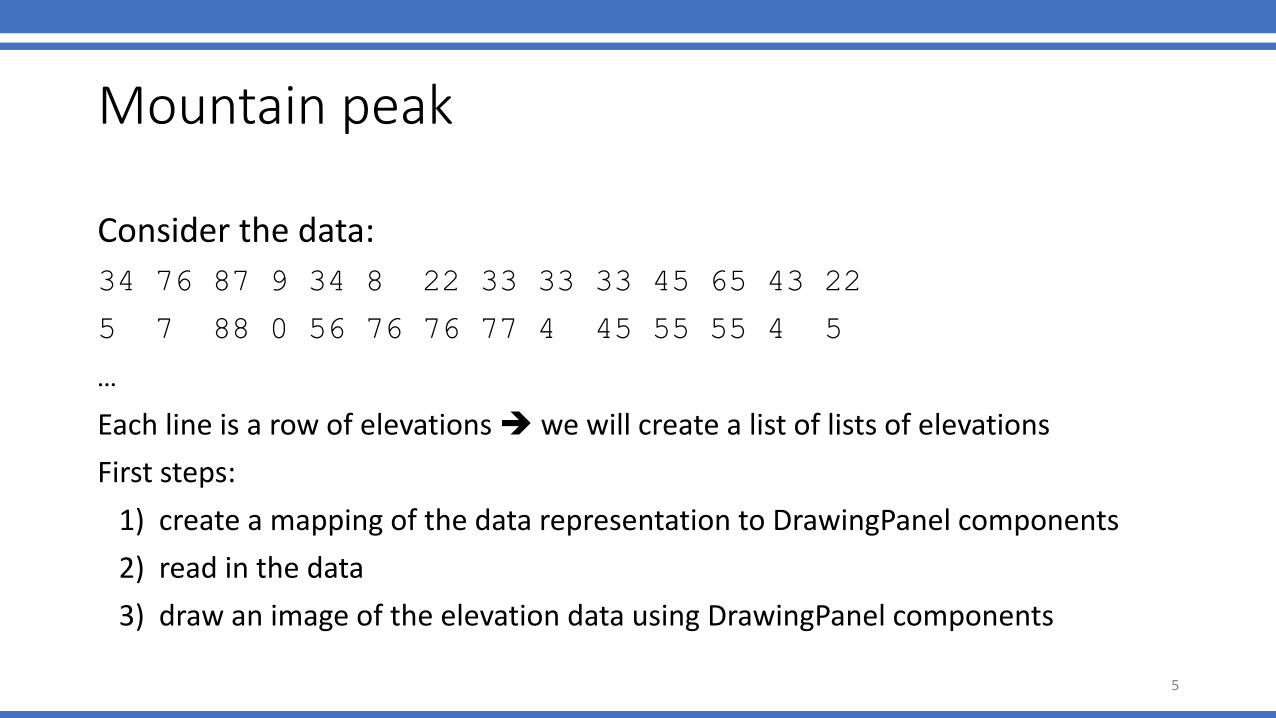
Consider the data:
34 76 87 9 34 8 22 33 33 33 45 65 43 22
5 7 88 0 56 76 76 77 4 45 55 55 4 5
…
Each line is a row of elevations we will create a list of lists of elevations
First steps:
1) create a mapping of the data representation to DrawingPanel components
2) read in the data
3) draw an image of the elevation data using DrawingPanel components
5

[ [34, 76, 87, 9, 34, 8, 22, 33, 33, 33, 45, 65, 43, 22]
[5, 7, 88, 0, 56, 76, 76, 77, 4, 45, 55, 55, 4, 5]
…
]
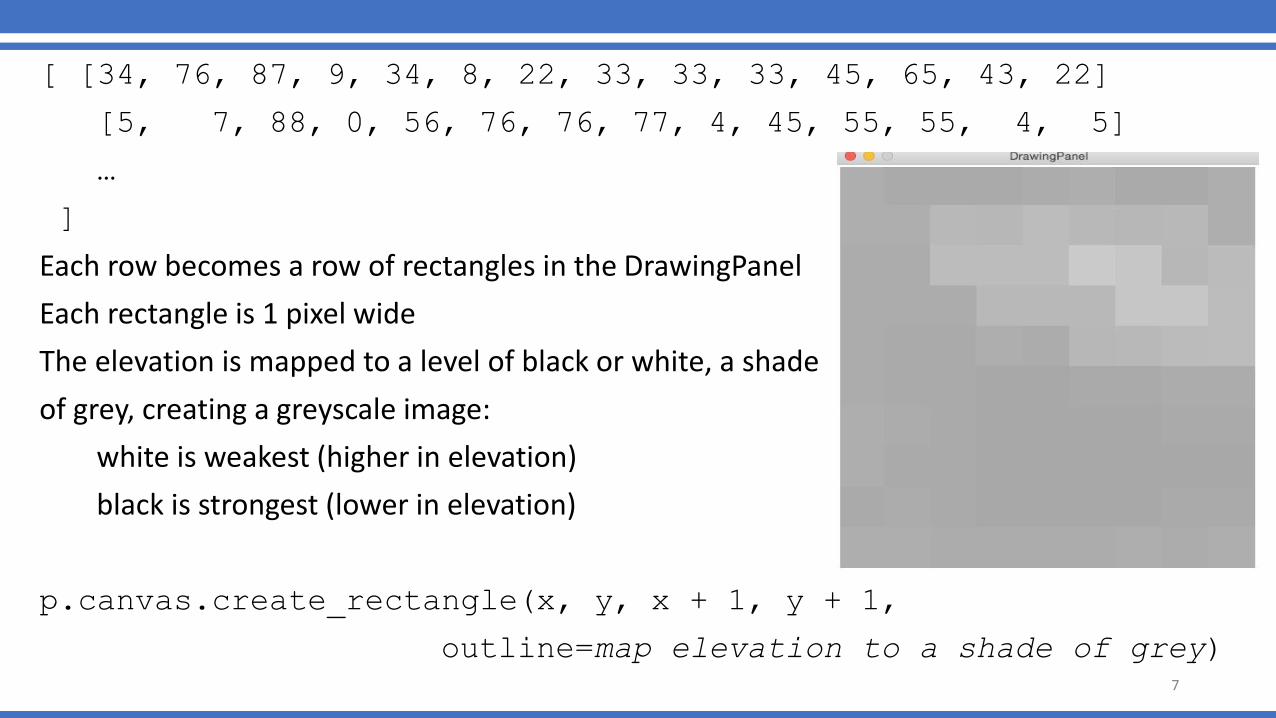
Each row becomes a row of rectangles in the DrawingPanel
Each rectangle is 1 pixel wide
If the mountain data is stored in a list of lists data, how
large do we make the DrawingPanel?
p = DrawingPanel( width ??, height ??)
6
[ [34, 76, 87, 9, 34, 8, 22, 33, 33, 33, 45, 65, 43, 22]
[5, 7, 88, 0, 56, 76, 76, 77, 4, 45, 55, 55, 4, 5]
…
]
Each row becomes a row of rectangles in the DrawingPanel
Each rectangle is 1 pixel wide
The elevation is mapped to a level of black or white, a shade
of grey, creating a greyscale image:
white is weakest (higher in elevation)
black is strongest (lower in elevation)
p.canvas.create_rectangle(x, y, x + 1, y + 1,
outline=map elevation to a shade of grey)
7

Mapping indices to argumentsdata =
[ [34, 76, 87, 9, 34, 8, 22, 33, 33, 33, 45, 65, 43, 22]
[5, 7, 88, 0, 56, 76, 76, 77, 4, 45, 55, 55, 4, 5]...
]
For the first row:
p.canvas.create_rectangle(0, 0, 1, 1, outline = color of 34)
p.canvas.create_rectangle(1, 0, 2, 1, outline = color of 76)
p.canvas.create_rectangle(2, 0, 3, 1, outline = color of 87)
p.canvas.create_rectangle(3, 0, 4, 1, outline = color of 9)
....
8

Mapping to indices to argumentsdata =
[ [34, 76, 87, 9, 34, 8, 22, 33, 33, 33, 45, 65, 43, 22]
[5, 7, 88, 0, 56, 76, 76, 77, 4, 45, 55, 55, 4, 5]...
]
for row in range(0, len(data)):
for col in range(0, len(data[row])):
color = get_color(data[row][col])
p.canvas.create_rectangle(col, row, col + 1, row + 1, outline = color)
p.canvas.create_rectangle(0, 0, 1, 1, outline = color of 34-- data[0][0])
p.canvas.create_rectangle(1, 0, 2, 1, outline = color of 76-- data[0][1])
p.canvas.create_rectangle(2, 0, 3, 1, outline = color of 87-- data[0][2])
p.canvas.create_rectangle(3, 0, 4, 1, outline = color of 9-- data[0][3])
...
9

2) Read in the datafrom drawingpanel import *
from random import *
def main():
file = open("mountaindata.dat")
lines = file.readlines()
data = []
for line in lines:
data.append(line.split())
p = DrawingPanel(len(data[0]), len(data))
draw_image(p, data)
10

3) Draw the elevation image
# draws the passed in data on the passed in drawing panel.
# The data is a list of lists of numbers representing
# elevation data.
def draw_image(p, data):
for row in range(0, len(data)):
# data[row] -> [3, 5, 76, 3]
for col in range(0, len(data[row])):
color = get_color(int(data[row][col]))
p.canvas.create_rectangle(col, row, col + 1,
row + 1, outline=color)
11
Mountain peak
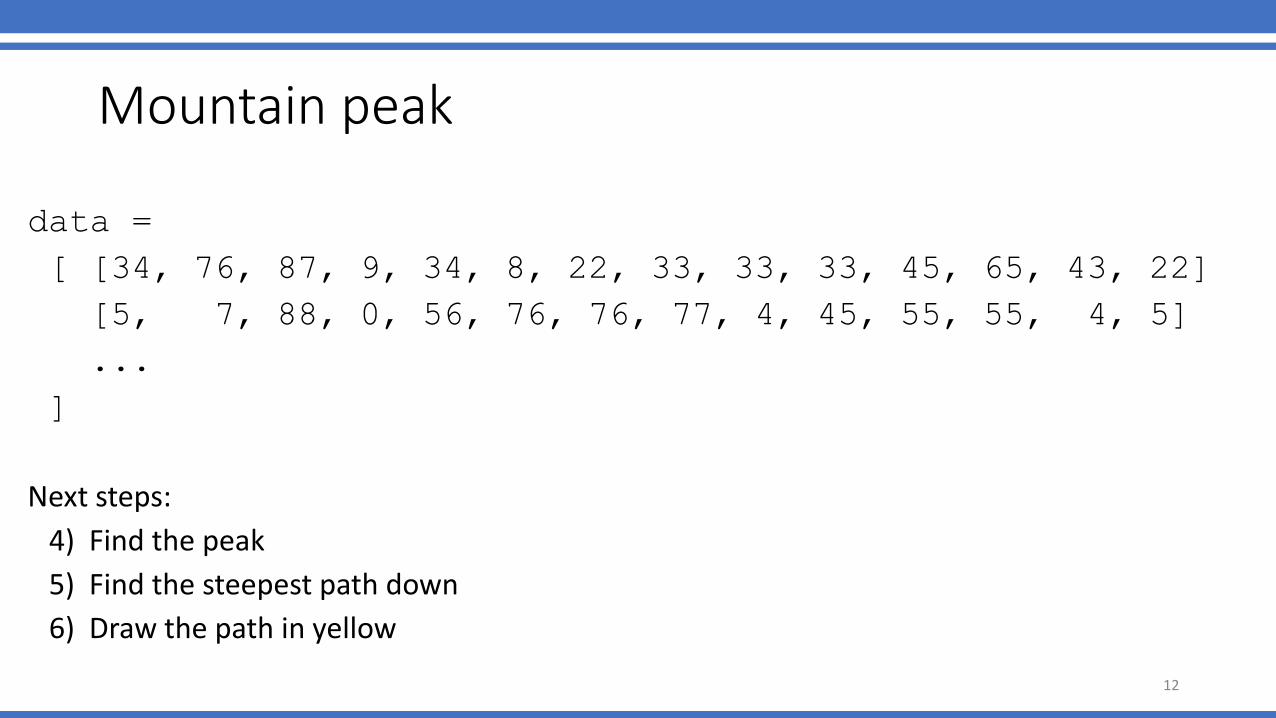
data =
[ [34, 76, 87, 9, 34, 8, 22, 33, 33, 33, 45, 65, 43, 22]
[5, 7, 88, 0, 56, 76, 76, 77, 4, 45, 55, 55, 4, 5]
...
]
Next steps:
4) Find the peak
5) Find the steepest path down
6) Draw the path in yellow
12
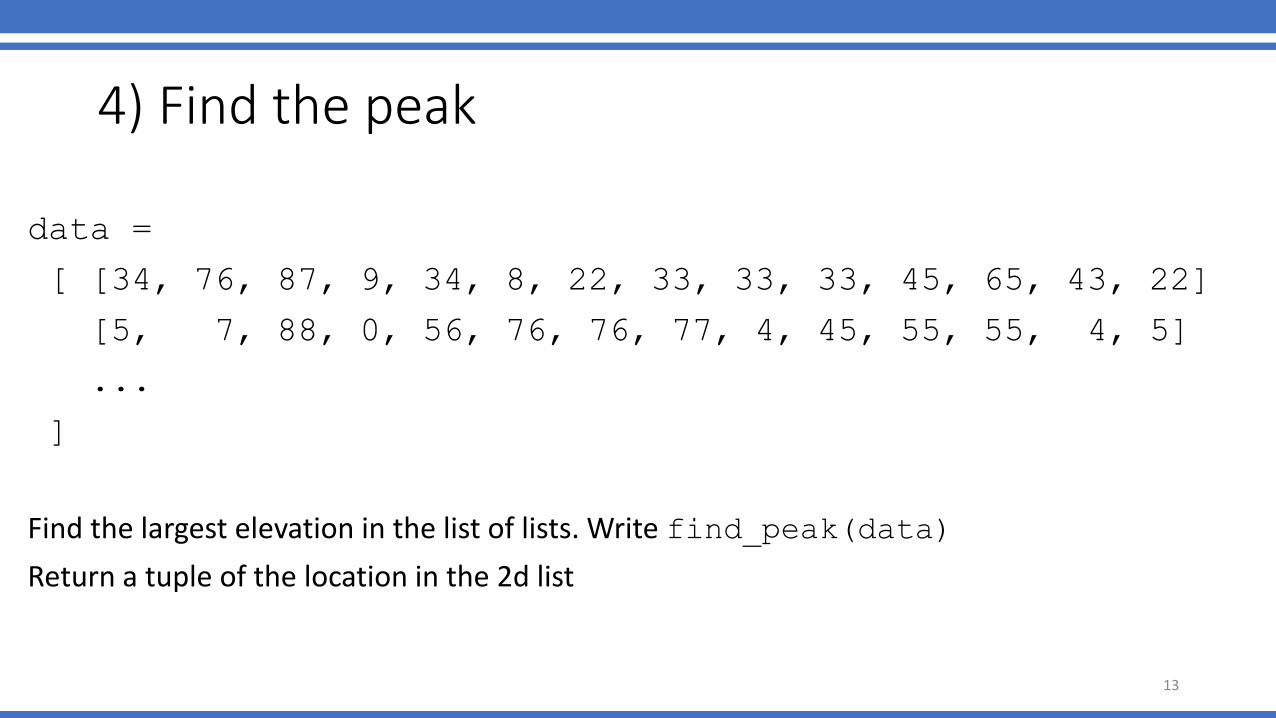
4) Find the peak
data =
[ [34, 76, 87, 9, 34, 8, 22, 33, 33, 33, 45, 65, 43, 22]
[5, 7, 88, 0, 56, 76, 76, 77, 4, 45, 55, 55, 4, 5]
...
]
Find the largest elevation in the list of lists. Write find_peak(data)
Return a tuple of the location in the 2d list
13
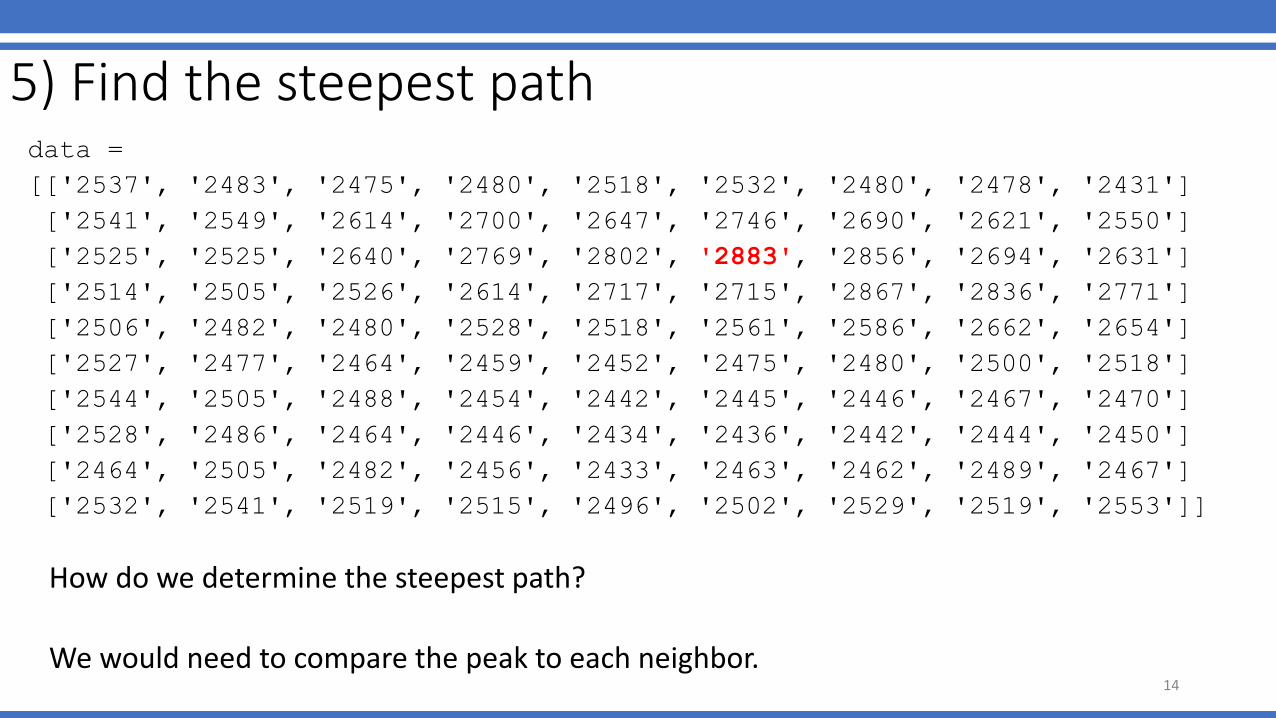
5) Find the steepest pathdata =
[['2537', '2483', '2475', '2480', '2518', '2532', '2480', '2478', '2431']
['2541', '2549', '2614', '2700', '2647', '2746', '2690', '2621', '2550']
['2525', '2525', '2640', '2769', '2802', '2883', '2856', '2694', '2631']
['2514', '2505', '2526', '2614', '2717', '2715', '2867', '2836', '2771']
['2506', '2482', '2480', '2528', '2518', '2561', '2586', '2662', '2654']
['2527', '2477', '2464', '2459', '2452', '2475', '2480', '2500', '2518']
['2544', '2505', '2488', '2454', '2442', '2445', '2446', '2467', '2470']
['2528', '2486', '2464', '2446', '2434', '2436', '2442', '2444', '2450']
['2464', '2505', '2482', '2456', '2433', '2463', '2462', '2489', '2467']
['2532', '2541', '2519', '2515', '2496', '2502', '2529', '2519', '2553']]
How do we determine the steepest path?
We would need to compare the peak to each neighbor. 14
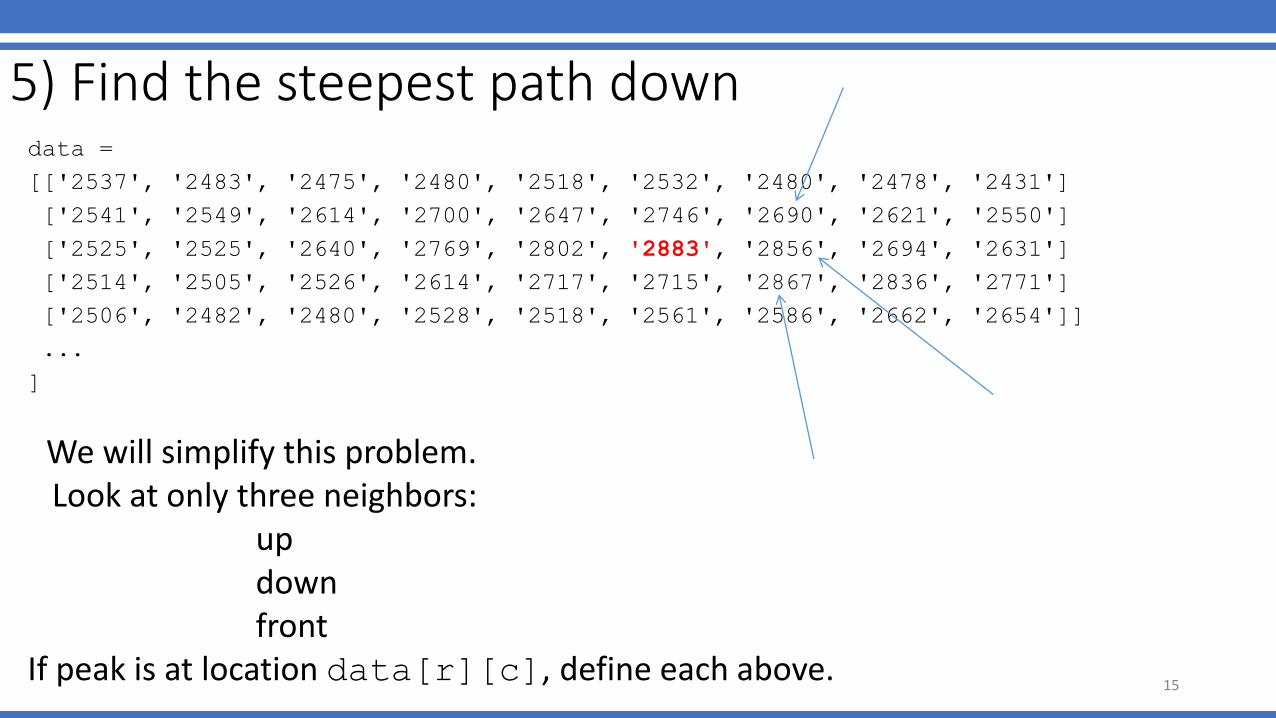
5) Find the steepest path downdata =
[['2537', '2483', '2475', '2480', '2518', '2532', '2480', '2478', '2431']
['2541', '2549', '2614', '2700', '2647', '2746', '2690', '2621', '2550']
['2525', '2525', '2640', '2769', '2802', '2883', '2856', '2694', '2631']
['2514', '2505', '2526', '2614', '2717', '2715', '2867', '2836', '2771']
['2506', '2482', '2480', '2528', '2518', '2561', '2586', '2662', '2654']]
...
]
We will simplify this problem. Look at only three neighbors:
updownfront
If peak is at location data[r][c], define each above.15

5) Find the steepest path downdata =
[['2537', '2483', '2475', '2480', '2518', '2532', '2480', '2478', '2431']
['2541', '2549', '2614', '2700', '2647', '2746', '2690', '2621', '2550']
['2525', '2525', '2640', '2769', '2802', '2883', '2856', '2694', '2631']
['2514', '2505', '2526', '2614', '2717', '2715', '2867', '2836', '2771']
...]
Compare and find the smallest of the three to create the next
path element.
What happens if there are ties?
16
5) Find the steepest path down
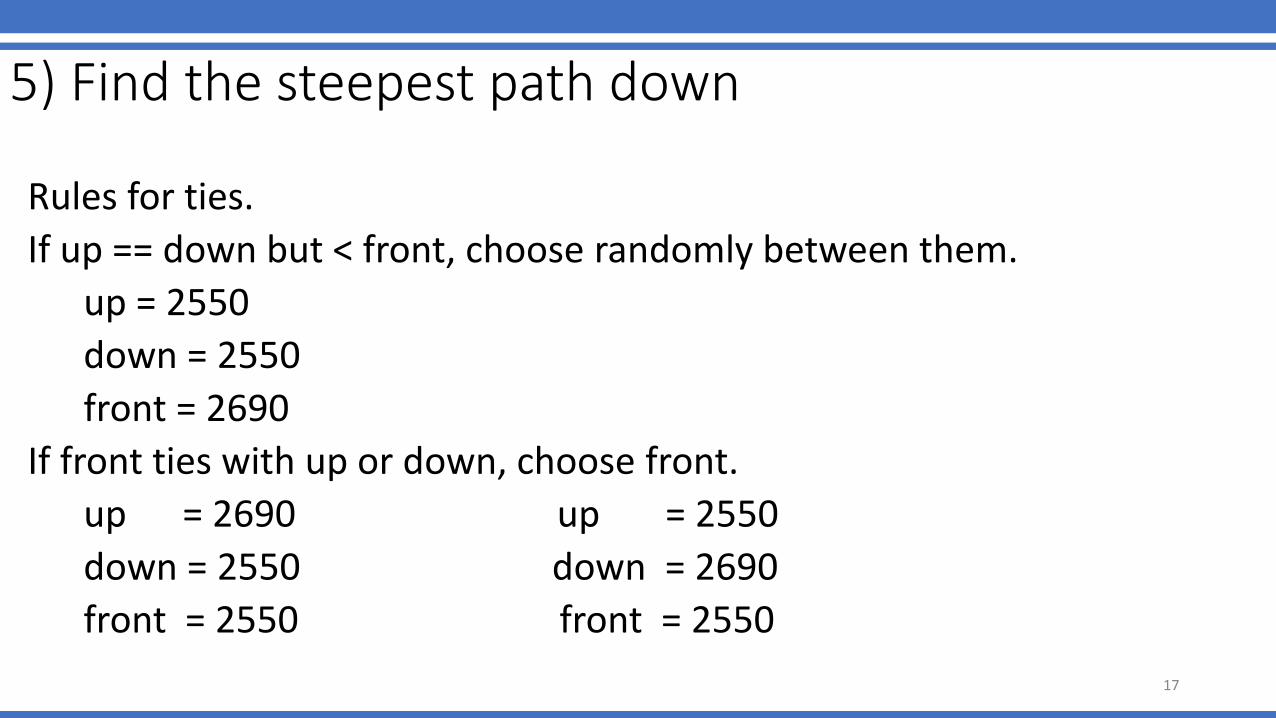
Rules for ties.
If up == down but < front, choose randomly between them.
up = 2550
down = 2550
front = 2690
If front ties with up or down, choose front.
up = 2690 up = 2550
down = 2550 down = 2690
front = 2550 front = 2550
17
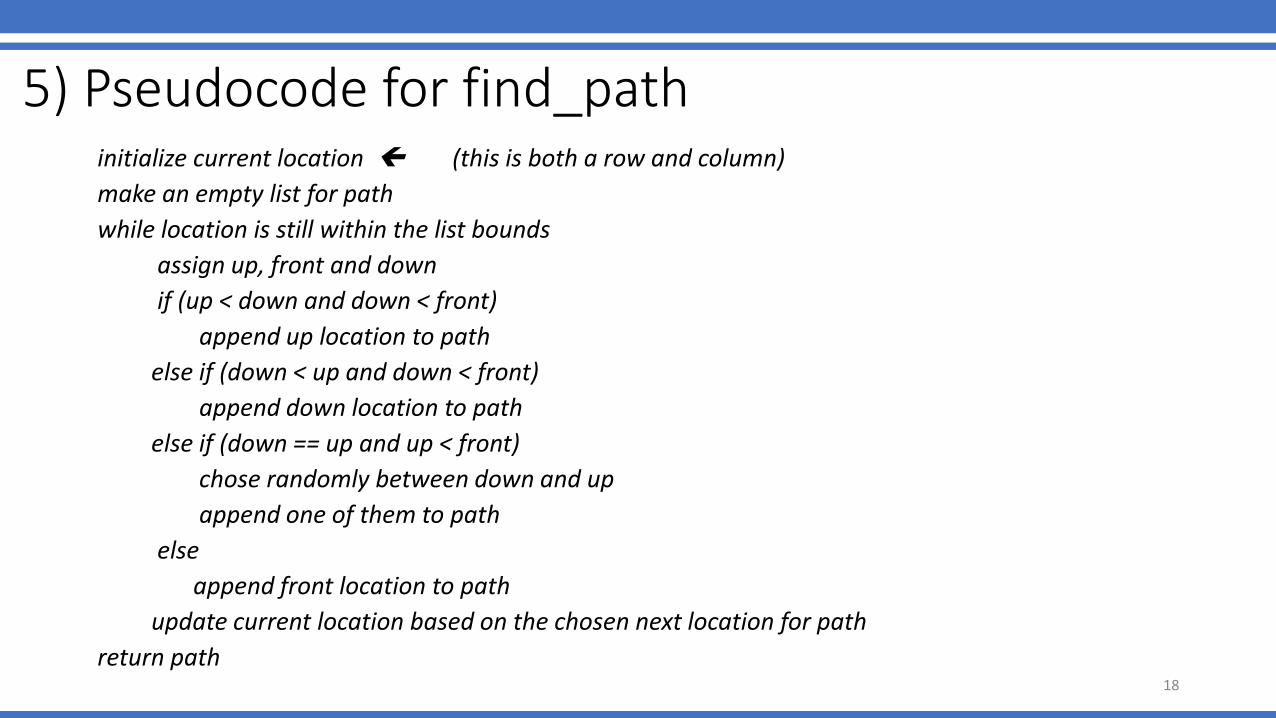
5) Pseudocode for find_pathinitialize current location (this is both a row and column)
make an empty list for path
while location is still within the list bounds
assign up, front and down
if (up < down and down < front)
append up location to path
else if (down < up and down < front)
append down location to path
else if (down == up and up < front)
chose randomly between down and up
append one of them to path
else
append front location to path
update current location based on the chosen next location for path
return path18

6) Pseudocode for draw_path
For each tuple in the path
Using the column and row given in the tuple, draw
a rectangle that is one pixel wide and filled in with yellow
19


![0$55,$*( 0$55,(' /,)( &+,/'5(1 reader_4...325 'LYRUFH ,,, 5 33* NLGQDSSLQJ *** /76 345 L[)Od_edrdoccpn]\i_+@jh`nod^a\^dgdot *** 0.. 35, B\hdgtgda`RU 6\it\nd *** .,1 36, N`opmi\i_N`pidji](https://img.pdfslide.net/doc/110x75/60aece161f81b975594da9b7/055-055-51-reader4-325-lyrufh-5-33-nlgqdsslqj.jpg)


![[Federal Register Volume 76, Number 55 (Tuesday, …services.casa.gov.au/airworth/airwd/ADfiles/over/b737/...1 [Federal Register Volume 76, Number 55 (Tuesday, March 22, 2011)] [Rules](https://img.pdfslide.net/doc/110x75/5e338cdeffd31e3e4d06957e/federal-register-volume-76-number-55-tuesday-1-federal-register-volume.jpg)