Embed Size (px)
Citation preview
CSCE555 BioinformaticsCSCE555 BioinformaticsLecture 18 Network Biology:
Comparison of Networks Across Species
Meeting: MW 4:00PM-5:15PM SWGN2A21
Instructor: Dr. Jianjun Hu
Course page: http://www.scigen.org/csce555
University of South CarolinaDepartment of Computer Science and Engineering
2008 www.cse.sc.edu.
In the beginning there was In the beginning there was DNA…DNA…
Liolios K, Tavernarakis N, Hugenholtz P, Kyrpides, NC. The Genomes On Line Database (GOLD) v.2: a monitor of genome projects worldwide. NAR 34, D332-334
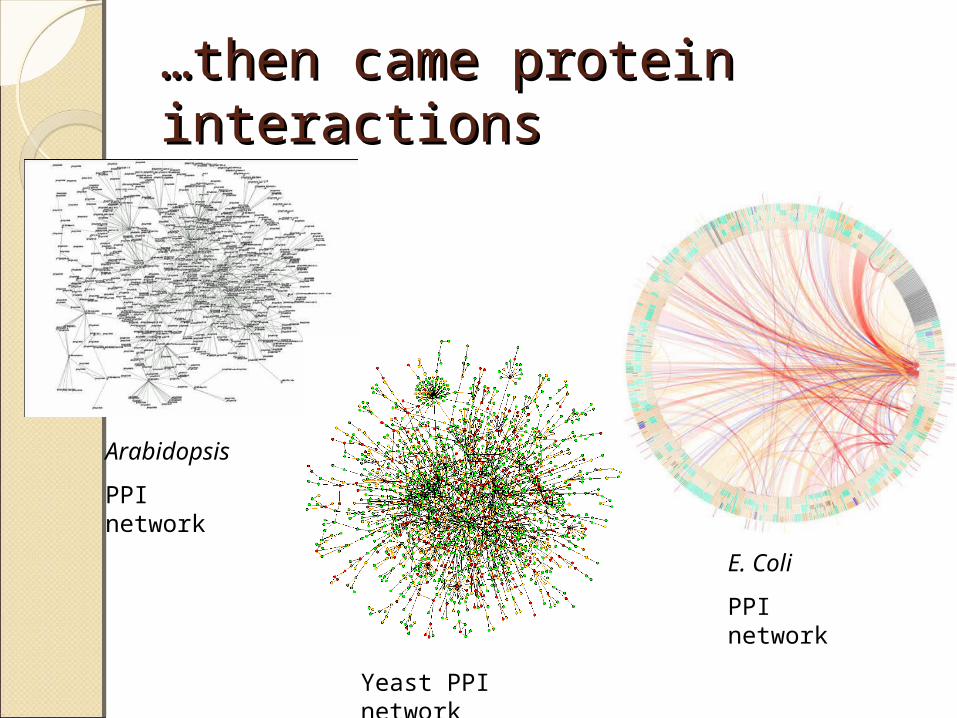
……then came protein then came protein interactionsinteractions
Arabidopsis
PPI network
E. Coli
PPI network
Yeast PPI network
Comparative Genomics to Comparative Genomics to Comparative InteractomicsComparative InteractomicsEvolutionary conservation implies
functional relevance◦ Sequence conservation implies functional
conservation◦ Network conservation implies functional
conservation too!What new insights might we gain from
network comparisons? (Why should we care?)

Network comparisons allow Network comparisons allow us to:us to:Identify conserved functional
modulesQuery for a module, ala BLASTPredict functions of a modulePredict protein functionsValidate protein interactionsPredict protein interactions
Only possible with network comparisons
Possible with existing techniques, but improved with network comparisons
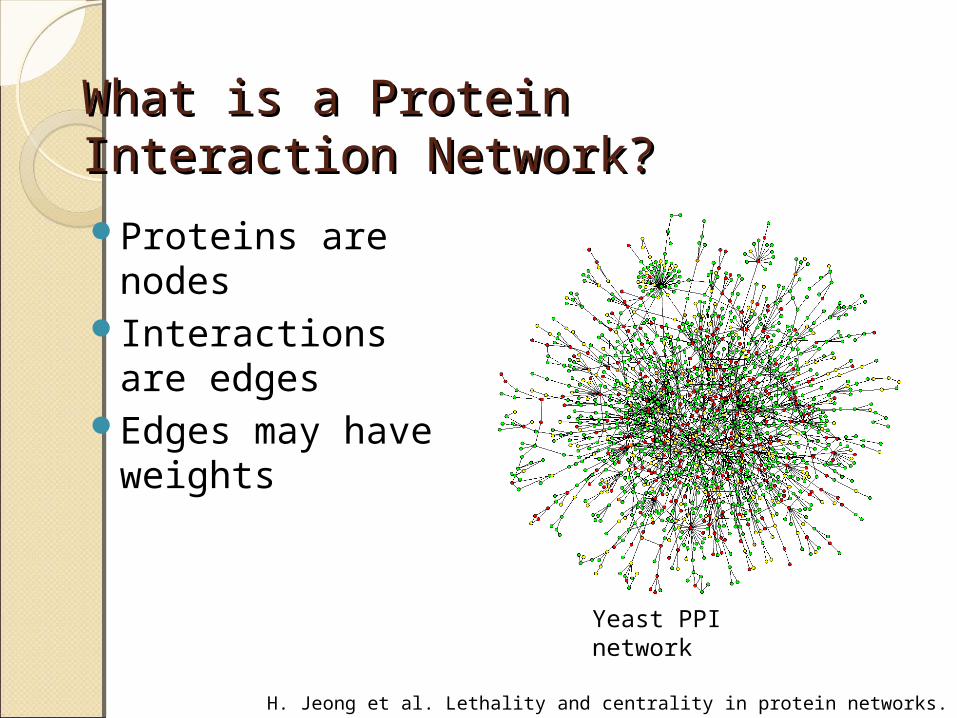
What is a Protein Interaction What is a Protein Interaction Network?Network?
Proteins are nodes
Interactions are edges
Edges may have weights
Yeast PPI network
H. Jeong et al. Lethality and centrality in protein networks. Nature 411, 41 (2001)

The Network Alignment The Network Alignment ProblemProblemGiven k different protein
interaction networks belonging to different species, we wish to find conserved sub-networks within these networks
Conserved in terms of protein sequence similarity (node similarity) and interaction similarity (network topology similarity)
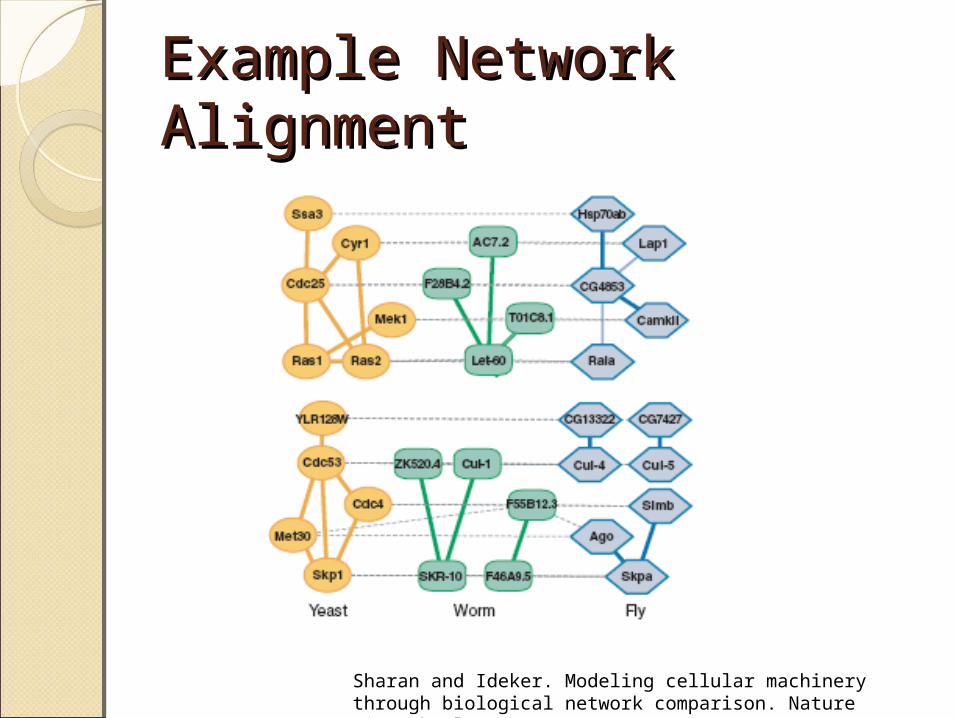
Example Network Example Network AlignmentAlignment
Sharan and Ideker. Modeling cellular machinery through biological network comparison. Nature Biotechnology 24, pp. 427-433, 2006
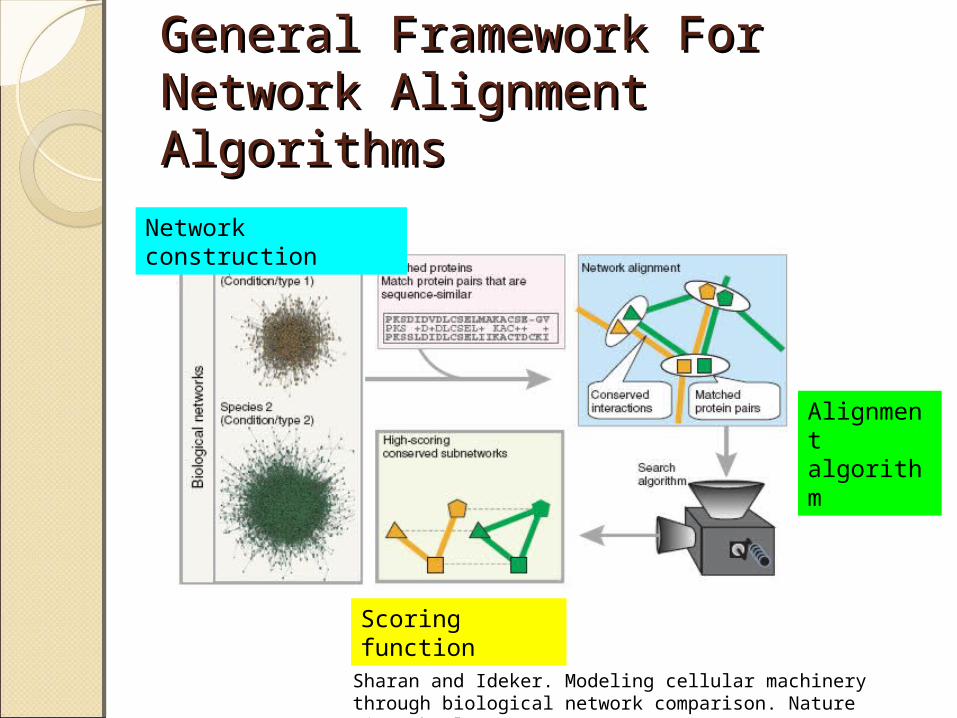
General Framework For General Framework For Network Alignment AlgorithmsNetwork Alignment Algorithms
Sharan and Ideker. Modeling cellular machinery through biological network comparison. Nature Biotechnology 24, pp. 427-433, 2006
Network construction
Scoring function
Alignment algorithm
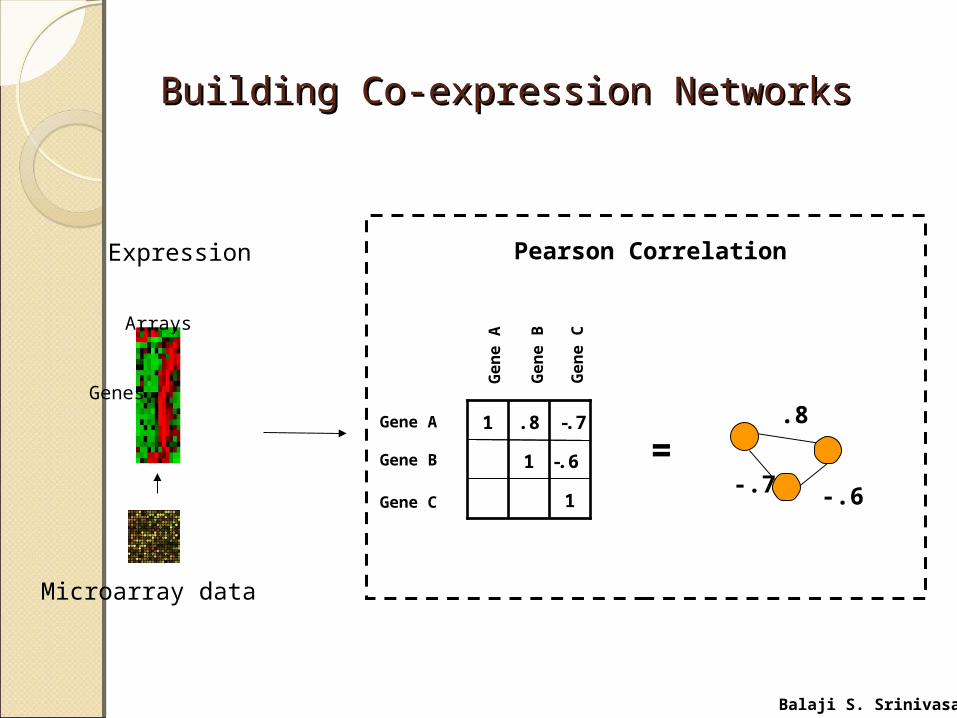
Building Co-expression NetworksBuilding Co-expression Networks
1
.81
1
-.6
-.7Gene A
Gene B
Gene C
Ge
ne
B
Ge
ne
A
Ge
ne
C
Pearson Correlation
=.8
-.7 -.6
Genes
Arrays
Microarray data
Expression
Balaji S. Srinivasan
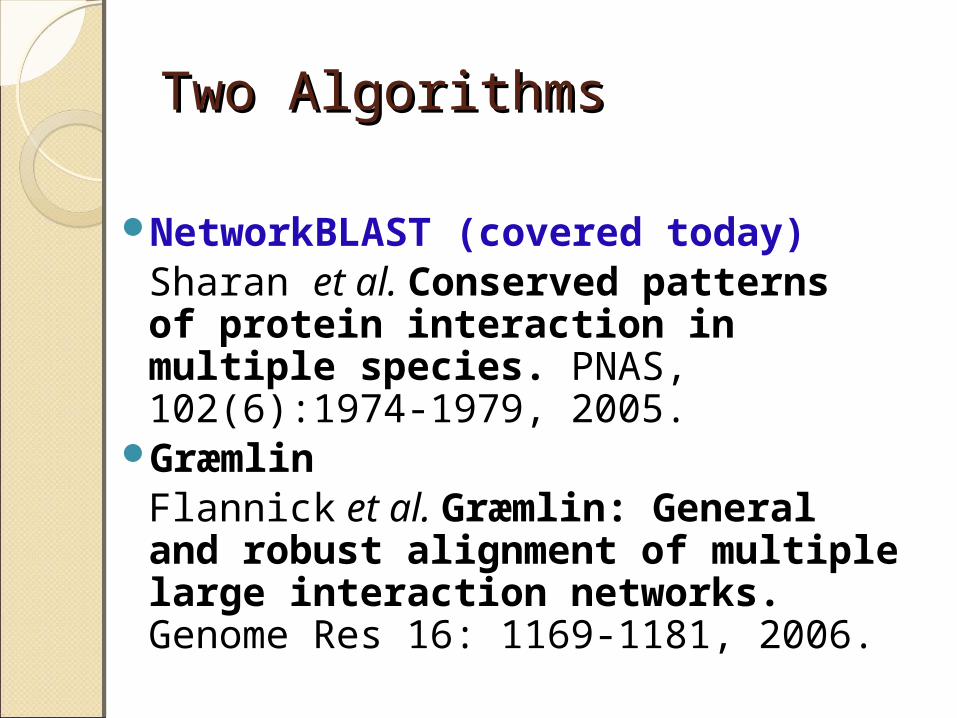
Two AlgorithmsTwo Algorithms
NetworkBLAST (covered today)Sharan et al. Conserved patterns of protein interaction in multiple species. PNAS, 102(6):1974-1979, 2005.
Græmlin Flannick et al. Græmlin: General and robust alignment of multiple large interaction networks. Genome Res 16: 1169-1181, 2006.

Overview ofOverview of
Sharan et al. Conserved patterns of protein interaction in multiple species. PNAS, 102(6):1974-1979, 2005.

Estimation of Interaction Estimation of Interaction ProbabilitiesProbabilities In the preprocessing step, edges in
the network are given a reliability score using a logistic regression model based on three features:
1. Number of times an interaction was observed
2. Pearson correlation coefficient between expression profiles
3. Proteins’ small world clustering coefficient

Network Alignment Network Alignment GraphsGraphs Construct a Network Alignment Graph to
represent the alignment Nodes contain groups of sequence similar
proteins from the k organisms Edges represent conserved interactions. An edge between two nodes is present if:
1. One pair of proteins directly interacts, the rest are distance at most 2 away
2. All protein pairs are of distance exactly 23. At least max(2, k – 1) protein pairs directly
interact Tries to account for interaction deletions

Example Network Alignment Example Network Alignment GraphGraph
Nodes
a
b
c
a’
b’
c’
a’’
b’’
c’’
ab
c
a’
b’
c’
a’’
b’’
c’’
Network alignment graph
Individual species’ PPI network
Species X Species Y Species Z
Scoring FunctionScoring FunctionSharan et al. devise a scoring
scheme based on a likelihood model for the fit of a single sub-network to the given structure
High scoring subgraphs correspond to structured sub-networks (cliques or pathways)
Only network topology is scored, node similarity is not

Log Likelihood Ratio ModelLog Likelihood Ratio ModelMeasures the likelihood that a
subgraph occurs if it is a conserved network vs. that if it were a randomly constructed network
Randomly constructed network preserves degree distribution for nodes
logPr(Subgraph occurs | Conserved Network)
Pr(Subgraph occurs | Random Network)
Log Likelihood Ratio ModelLog Likelihood Ratio Model(i) in a real subnetwork, each interaction should be present independently with high probability, and (ii) in a random subnetwork, the probability of an interaction between any two proteins depends on their total number of connections in the network.

Likelihood Ratio Scoring of a Protein Likelihood Ratio Scoring of a Protein Complex in a Single SpeciesComplex in a Single Species
U : a subset of vertices (proteins) in the PPI graphOU : collection of all observations on vertex pairs in UOuv : interaction between proteins u, v observedMs : conserved network modelMn: random network (null) modelTuv : proteins u, v interactFuv : proteins u, v do not interactβ : probability that proteins u, v interact in conserved modelpuv : probability that edge u, v exists in a random model
Probability of complex being observed in a conserved network model
Probability of subgraph being observed in a random network model
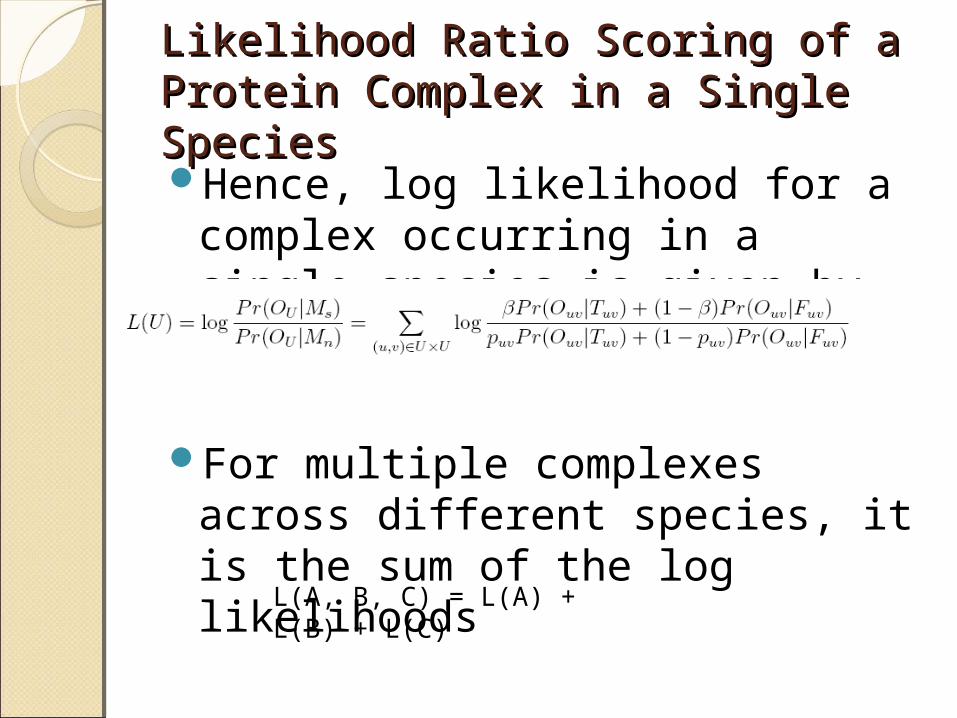
Likelihood Ratio Scoring of a Likelihood Ratio Scoring of a Protein Complex in a Single SpeciesProtein Complex in a Single SpeciesHence, log likelihood for a
complex occurring in a single species is given by
For multiple complexes across different species, it is the sum of the log likelihoods
L(A, B, C) = L(A) + L(B) + L(C)
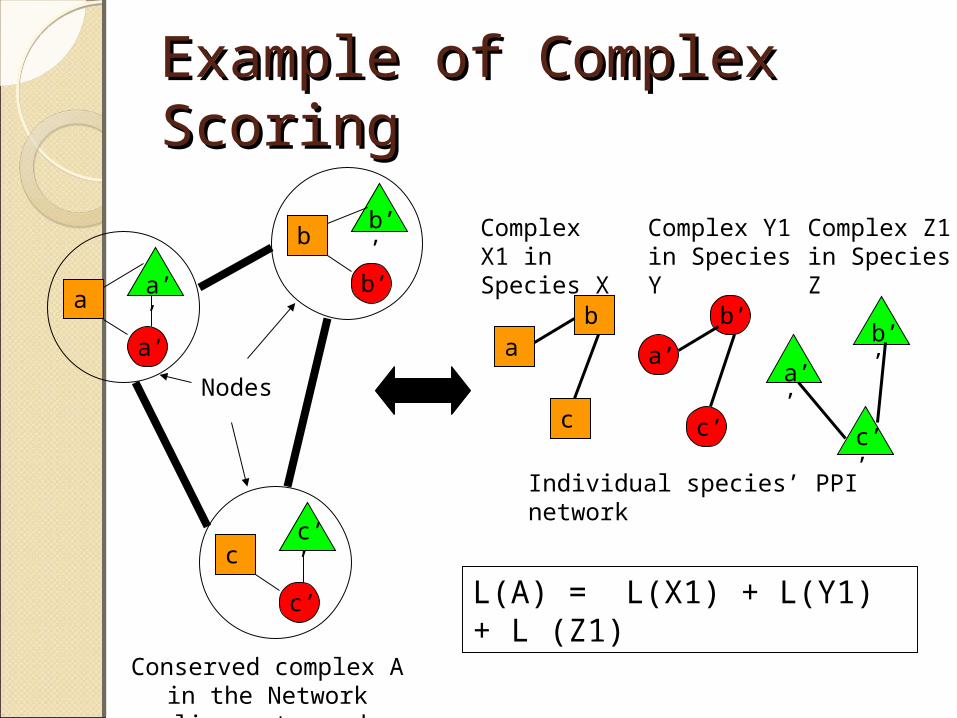
Example of Complex Example of Complex ScoringScoring
Nodes
a
b
c
a’
b’
c’
a’’
b’’
c’’
ab
c
a’
b’
c’
a’’
b’’
c’’
Conserved complex A in the Network alignment graph
Individual species’ PPI network
L(A) = L(X1) + L(Y1) + L (Z1)
Complex X1 in Species X
Complex Y1 in Species Y
Complex Z1 in Species Z

Alignment algorithmAlignment algorithmProblem of identifying conserved
sub-networks reduces to finding high scoring subgraphs
NP-complete problemHeuristic solution:
◦Greedy extension of high scoring seeds
◦(Does this sound familiar? BLAST?)◦Common to both papers discussed
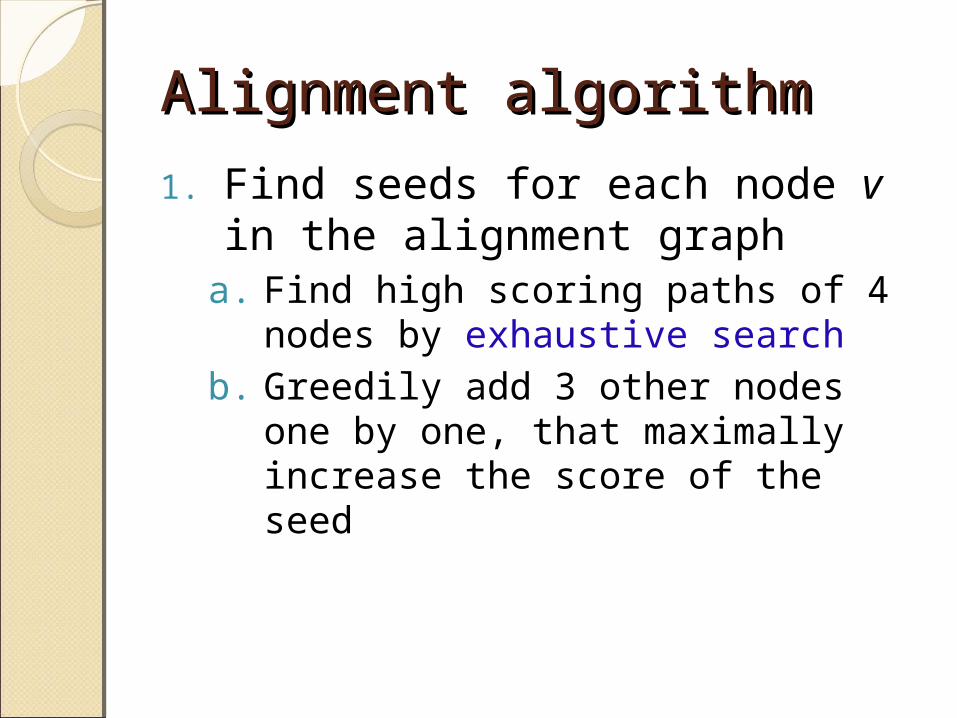
Alignment algorithmAlignment algorithm
1. Find seeds for each node v in the alignment graph
a. Find high scoring paths of 4 nodes by exhaustive search
b. Greedily add 3 other nodes one by one, that maximally increase the score of the seed
Alignment algorithmAlignment algorithm
2. Iteratively add or remove nodes to increase the overall score of the node
Original seeds are preserved Limit size of discovered subgraphs
to 15 nodes Record up to 4 highest scoring
subgraphs discovered around each node

Alignment algorithmAlignment algorithm
3. Filter subgraphs with a high degree of overlap
Iteratively find high scoring subgraph and remove all highly overlapping ones remaining
ResultsResults
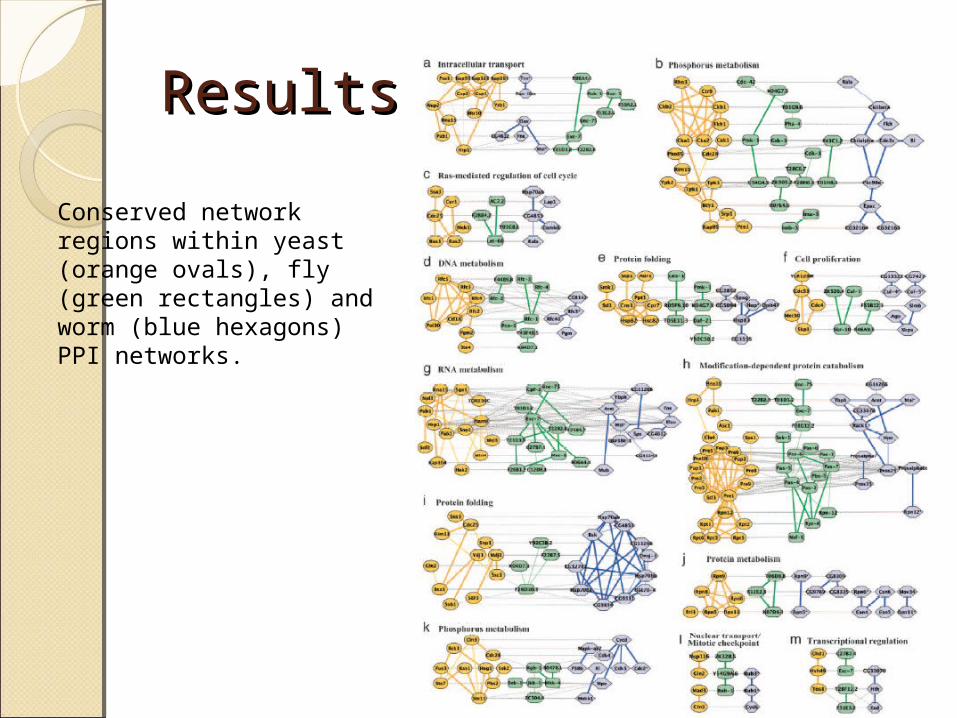
Conserved network regions within yeast (orange ovals), fly (green rectangles) and worm (blue hexagons) PPI networks.
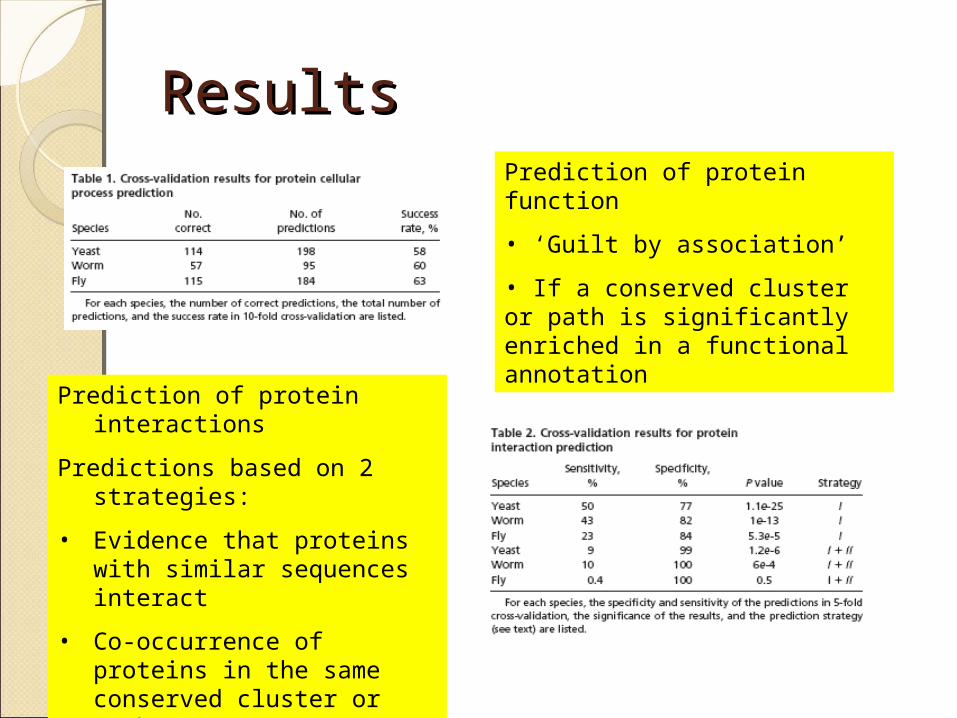
ResultsResultsPrediction of protein function
• ‘Guilt by association’
• If a conserved cluster or path is significantly enriched in a functional annotation
Prediction of protein interactions
Predictions based on 2 strategies:
• Evidence that proteins with similar sequences interact
• Co-occurrence of proteins in the same conserved cluster or path
• Experimental verification of Yeast interactions using Y2H yielded 40-62% success rate
Overview ofOverview ofFast, scalable, network alignment
◦Scales linearly in number of networks compared
◦NetworkBLAST scales exponentiallySupports efficient querying of
modulesSpeed-sensitivity control via user
defined parameter◦Not supported in NetworkBLAST
Input to the AlgorithmInput to the AlgorithmWeighted protein interaction
graphs◦Weights represent probability that
proteins interact◦Constructed via network integration
algorithmA phylogenetic tree relating the
species in the desired alignment◦Used for progressive alignment
Key Ideas of GraiminKey Ideas of GraiminGenerating An Initial Alignment
From The SeedGreedy Seed Extension PhaseProgressive alignment technique
using the phylogenetic tree
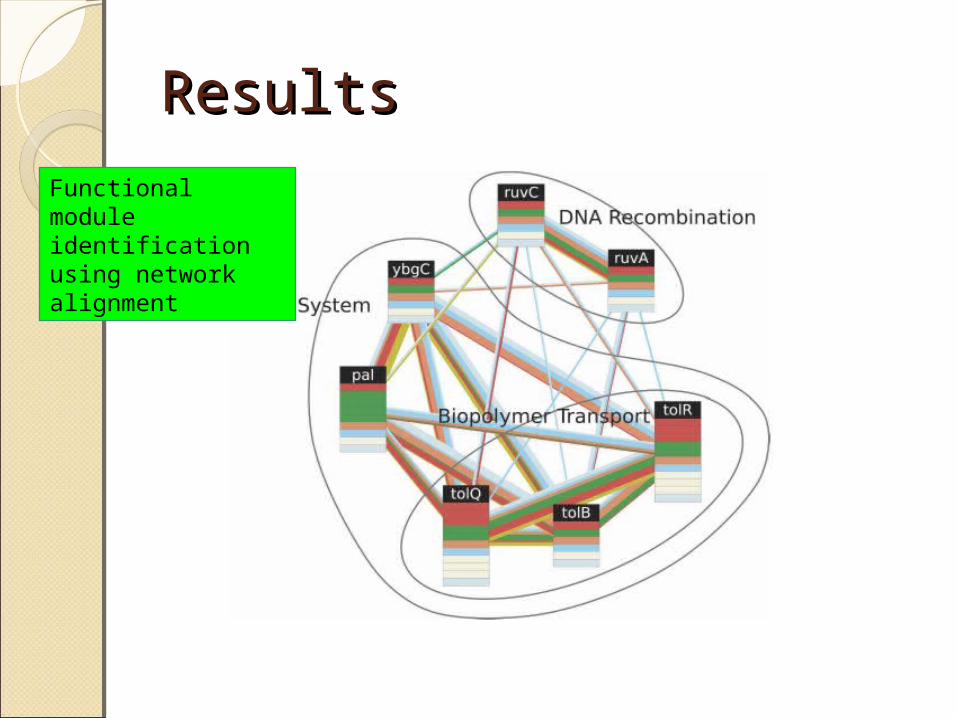
ResultsResults
Functional module identification using network alignment
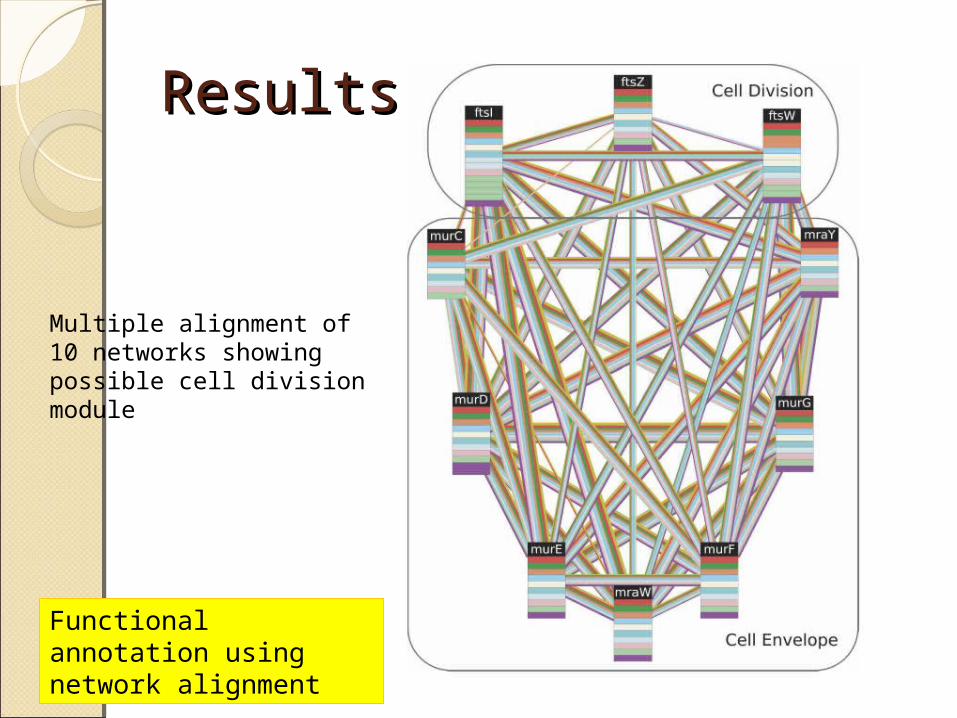
ResultsResults
Multiple alignment of 10 networks showing possible cell division module
Functional annotation using network alignment
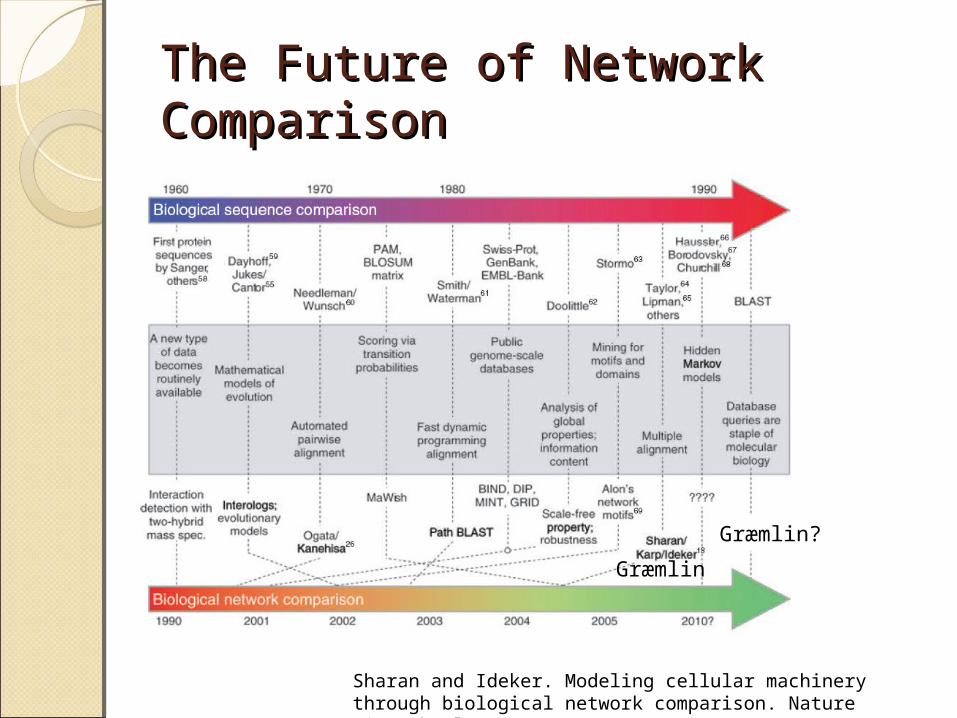
The Future of Network The Future of Network ComparisonComparison
Græmlin
Græmlin?
Sharan and Ideker. Modeling cellular machinery through biological network comparison. Nature Biotechnology 24, pp. 427-433, 2006
SummarySummaryThe problem: Network
comparison/comparative interactomes
NetworkBlast algorithmBrief introduction foThe analogy between sequence
comparison and network comparison
Reference & Reference & AcknowledgementsAcknowledgementsChuan Sheng FooSharan et al. Conserved patterns of protein
interaction in multiple species. PNAS. February 8, 2005 | vol. 102 | no. 6 | 1974-1979