Embed Size (px)
Citation preview

1
CSR ratings: Does more information add more value?
Magali DelmasUCLA
PRI Academic Network Conference2014 Montreal

2
CSR Ratings• $3.74 trillion in assets managed according to
socially responsible criteria/strategies 2010 (SIFF 2012)
• More than 50 different sustainability ratings

3

4

Are green companies managed differently?
The tip of the iceberg?
5

6
Competitive Advantage
H1 H2
Absorptive Capacity
KnowledgeAcquisition
Comparative CostAdvantage
Reputation Advantage
Innovation/ Differentiation
Advantage
Environmental Proactivity
Regulatory Proactivity
Operational Improvement
EnvironmentalPartnerships
Environmental Reporting
KnowledgeAssimilation
KnowledgeTransformation
KnowledgeExploitation
Delmas, M., Hoffmann, V. H., & Kuss, M. (2011).

Corporate Social Responsibility
ISO 14001 standard
Organic Labeling
Fair Trade
Other CSRstandards
EmployeeTraining
Labor Productivity
Interpersonal contacts
Employee positive social identification
with firm
Employee retention
Employee health and Safety
Firm attractivenessto prospective
employees
The adoption of environmental and social practices is associated with greater labor productivity.
EmployeeEngagement
7Delmas, M. A., & Pekovic, S. (2013).

8
Research questions
• What do SRI ratings actually measure?• What aspect of SRI does the market respond to?• When do SRI investments pay?
– Delmas, M., Etzion, D., & Nairn-Birch, N. (2013). Triangulating Environmental Performance: What Do Corporate Social Responsibility Ratings Really Capture?. The Academy of Management Perspectives, amp-2012.
– Delmas, M., Etzion, D., & Nairn-Birch, N. (2014). Temporal Dynamics of Environmental and Financial Performance: The Case of Greenhouse Gas Emissions. Draft

What do EP ratings actually measure?
• Data on 475 companies produced by three widely used ratings agencies from 2004-2007
9
Ratings Variable Name Description
Trucost Total Damage Cost Total environmental damage cost (mUSD)
KLD AnalyticsConcerns Total Total Environmental Concerns
Strengths Total Total Environmental Strengths
Sustainable Asset Management (SAM)
Eco-efficiency Environmental Performance (Eco-Efficiency)
Reporting Environmental Reporting
10
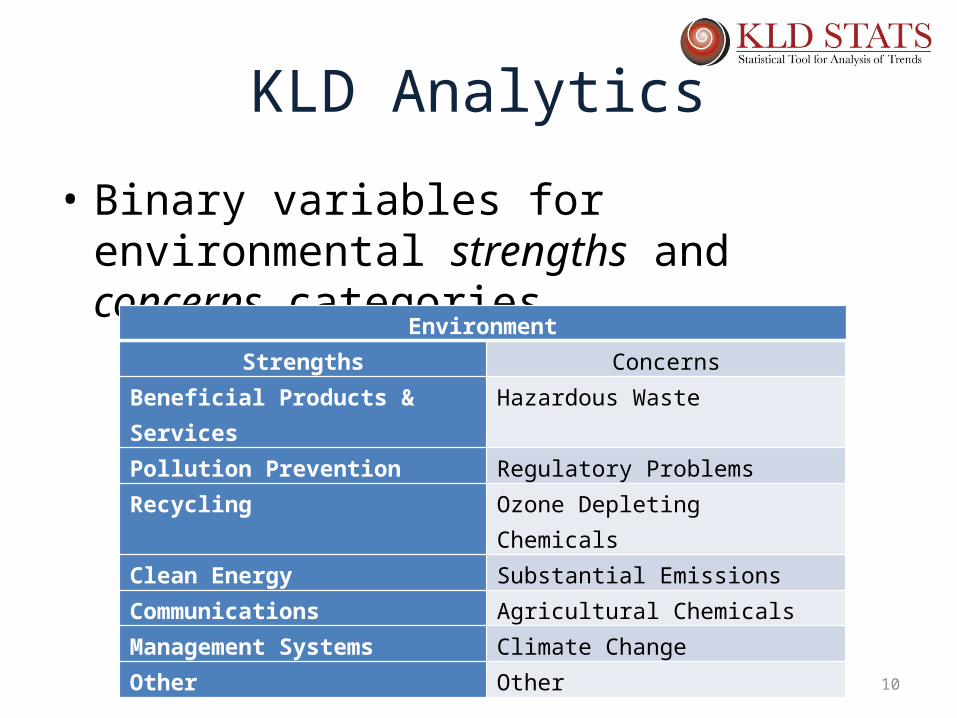
KLD Analytics
• Binary variables for environmental strengths and concerns categories
EnvironmentStrengths Concerns
Beneficial Products & Services Hazardous WastePollution Prevention Regulatory ProblemsRecycling Ozone Depleting ChemicalsClean Energy Substantial EmissionsCommunications Agricultural ChemicalsManagement Systems Climate ChangeOther Other
11
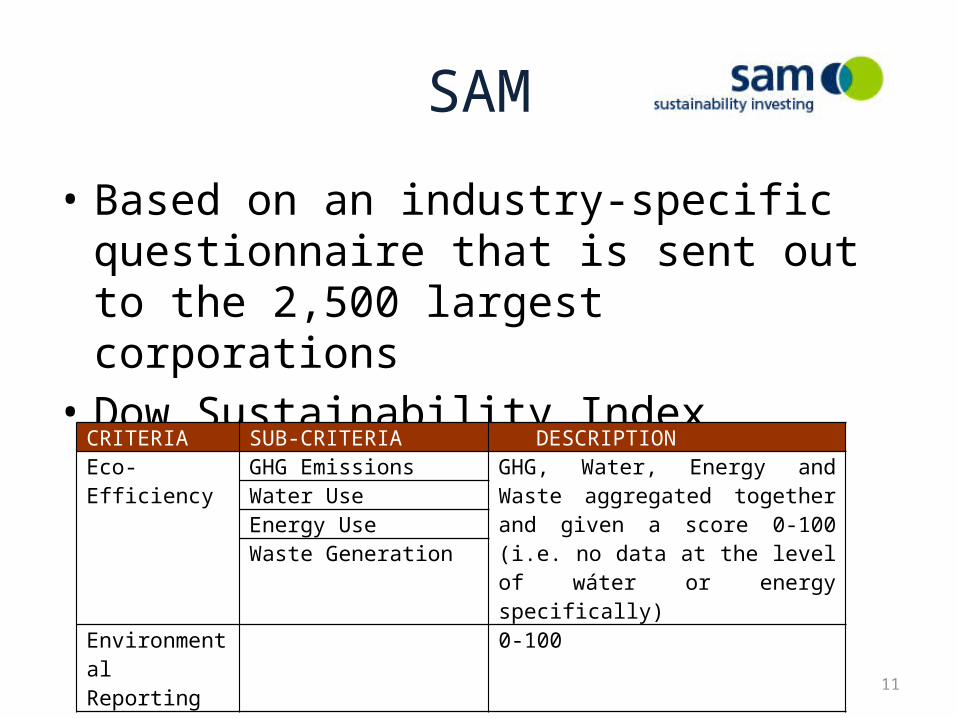
SAM
• Based on an industry-specific questionnaire that is sent out to the 2,500 largest corporations
• Dow Sustainability Index
CRITERIA SUB-CRITERIA DESCRIPTIONEco-Efficiency GHG Emissions GHG, Water, Energy and Waste
aggregated together and given a score 0-100 (i.e. no data at the level of wáter or energy specifically)
Water UseEnergy UseWaste Generation
Environmental Reporting
0-100

12
Natural capital metrics carbon and other Greenhouse Gas (GHG) emissions, water use, resource dependency, air/land/water pollutants, waste.Financial: externality valuation ($), impact ratio (proxy for potential contingent resource liability), profit at risk.

13
CorrelationsData Source
Variable Trucost
KLD SAM SAM KLD
Trucost 1 Total Damage 1.00
KLD 2 Total Concerns 0.61 1.00
SAM 3 Eco-efficiency 0.35 0.46 1.00
SAM 4 Reporting 0.32 0.44 0.76 1.00
KLD 5 Total Strengths 0.23 0.38 0.66 0.58 1.00

14
Principal Component Analysis
• Reduce the dimensionality of a data set• Convert a set of observations of possibly correlated variables
into a set of values of linearly uncorrelated variables called principal components
Data Source Environmental Performance Variable
Component (rotated)
1 2
SAM Eco-efficiency 0.87 0.26SAM Reporting 0.85 0.24KLD Strengths Total 0.85 0.11KLD Concerns Total 0.11 0.92Trucost Total Damage 0.32 0.83
Eigenvalue 2.32 1.66Variation Explained 46.34% 33.17%Cumulative Variation Explained
46.34% 79.50%

15
Two components?
Processes
Outcomes
Envi
ronm
enta
l Rati
ngs
Principal Components80% of original data
Energy and Water UsageGHG emissions
SAM Eco-efficiency
Environmental Reporting SAM Reporting
Beneficial Products & Services, Pollution Prevention, Recycling, Clean Energy, Communication, Mgt Systems
KLD Strengths
Hazardous Waste, Regulatory Problems, Substantial Emissions, Climate Change
KLD Concerns
Total damage to the environment associated with firm activity
Trucost Total Damage

16
What does the market respond to?Variables Tobin’s q
1 2PC environmental processes
0.116
(0.005)**PC environmental outcomes
0.030
(0.568)Trucost Total Damage 0.000 (0.408) KLD Total Concerns -0.051 (0.273) SAM Eco-efficiency 0.004 (0.018)* SAM Reporting 0.002 (0.240) KLD Total Strengths -0.030 (0.518) Leverage -0.042 -0.042 (0.000)** (0.000)**Growth 0.036 0.041 (0.230) (0.162)Capital Intensity 0.090 0.088 (0.043)* (0.050)*Firm Size -0.174 -0.168 (0.000)** (0.000)**Observations 741 741Number of groups 385 385
Market values better environmental processes, but is not concerned with outcomes
Only one of original ratings variables affects financial performance…too much information?

17
Implications
• Process measures may be more easily communicated and assessed – Preferred to outcome performance measures that are
harder to attain, evaluate and rank. – Consistent with Rennekamp (2012): More readable
disclosures lead to stronger reactions from small investors• Performance or output measures might be outdated
– Ex Toxic Releases (2012 releases just out)• If process measures are more abundant and can be
easily fed into ratings methodologies, they will influence market valuation

18
Issue with Disclosure
• Companies may excel at reporting, governance and the utilization of environmental performance systems, yet they may still emit substantial amounts of pollution.
19
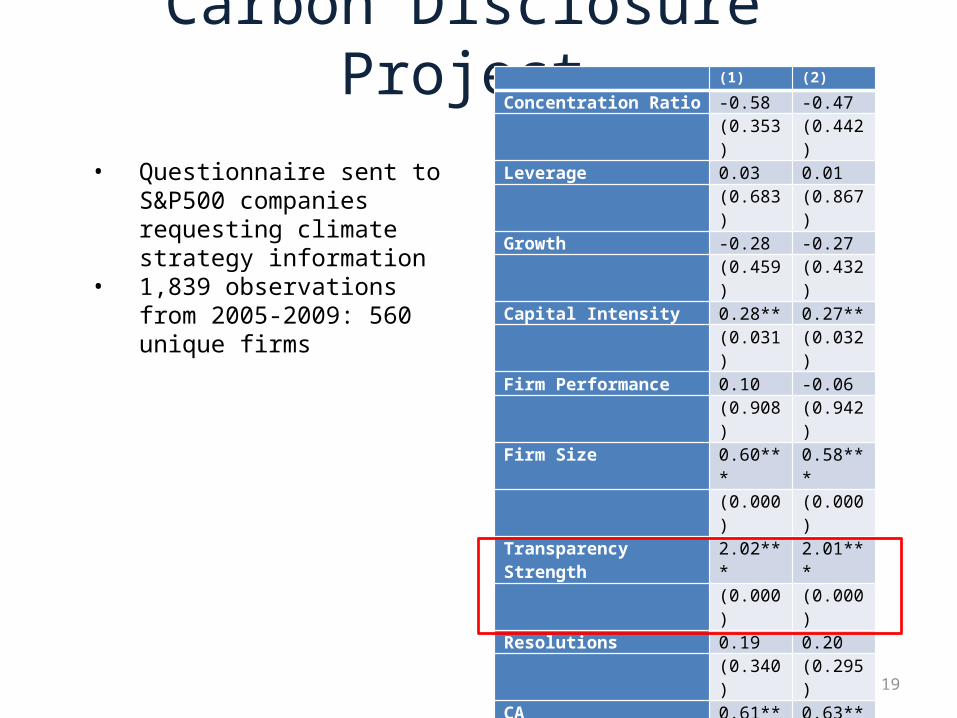
Carbon Disclosure Project (1) (2)
Concentration Ratio -0.58 -0.47 (0.353) (0.442)Leverage 0.03 0.01 (0.683) (0.867)Growth -0.28 -0.27 (0.459) (0.432)Capital Intensity 0.28** 0.27** (0.031) (0.032)Firm Performance 0.10 -0.06 (0.908) (0.942)Firm Size 0.60*** 0.58*** (0.000) (0.000)Transparency Strength 2.02*** 2.01*** (0.000) (0.000)Resolutions 0.19 0.20 (0.340) (0.295)CA 0.61** 0.63** (0.049) (0.043)RGGI -0.01 0.00 (0.962) (0.996)RPS 0.01 -0.03 (0.958) (0.891)GHG Emissions -0.01 0.07 (0.863) (0.304)GHG Emissions2 0.03**
(0.029)
Observations 1839 1839
Firms 549 549McFadden’s R=squared 0.2367 0.2334
Log-likelihood -974.4 -978.6
• Questionnaire sent to S&P500 companies requesting climate strategy information
• 1,839 observations from 2005-2009: 560 unique firms

20
Disclosure vs. GHG Emission
4 6 8 10 12 14 16 18
-0.5
0.0
0.5
1.0
1.5
GHG Emissions (log)
Od
ds
Ra
tio (
log
)
Likelihood of disclosing increases as a firm approaches either end of the environmental performance spectrum.

21
Correlation between KLD Strenghts and KLD concerns:0.413**

22
Investor decision making process
• We need a better understanding of what information is used by investors– For example, would investors favor more accessible,
standardized information on CSR? • Surveys
– Berry and Junkus (2012) 5,000 Individual investors, demographics of investors
– Cohen et al., (2011) 750 retail investors,• Lower use of CSR variables as compared to economic and
governance information• Venue most preferred for investors: third parties and financial
professionals and advisors
23
SRI & Behavior
• Further research should study in more details investors’ responses to different types of CSR data: format, framing and salience– How is the information provided?– What is the source of the information?– How often is it updated?
• Experiments & simulations?– Elliott et al (2014)

24
SRI and Time• Trade-off between social benefits of a healthy environment and private
cost to business: devoting resources to environmental management detracts from profit maximization (Friedman, 1970)
• Firms can generate competitive advantage through proactive environmental strategies (Porter and Van der Linde, 1995; Reinhardt, 1999)– Ability to innovate, market opportunities– Unexploited inefficiencies– Risk mitigation
• The financial effects of firm environmental behavior may be time dependent, thus resolving the conundrum of whether it does or does not pay to be green.

Short-term Long-term
Financial Performance
(ROA) (Tobin’s q)
Reduction of GHG
- +
No cost on carbon emissionsNo hidden efficiency gains
Market anticipates regulationsHigh performing firms are better positioned to minimize future regulatory scrutiny and compliance costs

Data 900 firms -2004-2008
• Environmental performance- Trucost• Total GHG Emissions, Direct GHG Emissions, Supply Chain
GHG Emissions, Water Abstraction, General Waste, Heavy Metals, Natural Resources
• Environmental practices – KLD• Environmental strengths, environmental concerns
• Financials- Compustat• ROA, Tobin’s Q, Log of annual change in sales ratio, Log of total
debt divided by total assets, Log of capital expenditures divided by total sales, Log of total assets
• Tobin’s q– Firm’s market value/ replacement cost of assets (Chung
and Pruitt (1994)).

27
ROA(t+1) Tobin’s q (t+1)
Total GHG Emissions 0.019(0.009)*
-0.750 (0.107)**
Water Abstraction -0.001
(0.001)-0.007 (0.011)
General Waste 0.001 (0.002)
-0.007 (0.041)
VOCs 0.001 (0.001)
0.017 (0.017)
Heavy Metals -0.001 (0.002)
-0.019 (0.033)
Natural Resources 0.001 (0.001)
0.026 (0.016)
KLD Concerns 0.002 (0.003)
0.091 (0.055)
KLD Strengths 0.001 (0.003)
-0.098 (0.049)*
Disclosure 0.001 (0.005)
-0.060 (0.082)
Growth 0.007 (0.002)**
0.045 (0.022)*
Leverage -0.001 (0.001)
-0.010 (0.009)
Capital Intensity 0.000 (0.002)
-0.089 (0.059)
Firm Size -0.047 (0.005)**
-0.568 (0.086)**
n 3316 2678Number of firms 1095 880

28
Implications
• Relationship between environmental and financial performance varies between short- and long-term horizons
• We show the importance of contrasting different measures of performance
• Our results suggest that managers adopting a short-term perspective will eschew proactive strategies in favor of less risky and more immediately profitable investments.
• On the other hand a forward-looking manager who anticipates a shift toward conditions more amenable to proactive environmental behavior will gain competitive advantage over a longer time horizon by developing the necessary resource base and capabilities.

29
Towards a behavioral research approach
• It is important to examine the different ways in which managers as well as investors conceptualize economic value and thereby, indirectly, sustainability and corporate social responsibility.
• Field experiments and simulations to better understand investors’ behavior
• Response to non financial information:– Format, framing and salience– System of investors’ evaluation: rewards and promotion– Demographics (education background, gender etc…)

30
Thank you