Embed Size (px)
Citation preview

Aurora’s Technological & Research Institute Concrete and Highway Engineering Lab
Department of Civil Engineering 1
CTLAB MANUAL
B. Tech III Year - I Semester
NAME: ________________________________________
ROLL NO: _____________________________________
BRANCH: ______________________________________

Aurora’s Technological & Research Institute Concrete and Highway Engineering Lab
Department of Civil Engineering 2
DEPARTMENT OFCIVIL ENGINEERING
Aurora’s Technological & Research InstituteParvathapur, Uppal, Hyderabad-98
Aurora’s Technological & Research Institute Concrete and Highway Engineering Lab
Department of Civil Engineering 3
TESTING ON CEMENT AND CONCRETE
EXPERIMENT 1
STANDARD CONSISTENCY OF CEMENT
AIM: To determine the quantity of water required to produce a cement paste
of standard consistency.
DEFNITION: Standard consistency is defined as that consistency which will permit
the Vicat’s plunger to penetrate to a point 5 to 7 mm from the bottom of the Vicat
mould when the cement is tested.
APPARATUS: 1. Vicat’s apparatus, Mould, Plunger.
2. Standard trowel
3. Stop watch.
4. Weighing balance
DESCRIPTION:
The Vicat’s apparatus consists of a frame and a moving rod weighing 300 gm. The
plunger is kept at the lower end of the rod. It is a cylinder 10 mm. Diameter, A
pointer connected to the rod will move along with it when it is released, over a
graduated scale kept in front of it. The cement paste to be tested is kept in the
Vicat’s mould kept below the rod on a glass plate.
PROCEDURE:
1. Carefully weigh 400 gm of cement and place it on a non-porous surface.
2. Form a crator in the centre in which add about 100 to 120 cc. of water.
3. Thoroughly mix the cement with water and fill, the Vicat’s mould with the
paste.
4. The interval from the moment of adding water to the dry cement to the
moment of commencing to fill the mould is known as the time of gauging
Aurora’s Technological & Research Institute Concrete and Highway Engineering Lab
Department of Civil Engineering 4
and shall not be less than 3 minutes and more than 5 minutes. Lower the
plunger gently and test the penetration.
5. If the penetration is between 5 to 7 mm from the bottom of the mould the
quantity of water added is the required consistency.
6. Otherwise repeat the test with different percentages of water until the
required penetration is obtained. Express the amount of water as a
percentage by weight of the dry cement.
OBSERVATIONS:
S. No.Weight ofCement
W1
Weight ofwater
W2
Reading onscalemm
W2 / W1Standard
consistency
CALCULATIONS: Weight of cement taken = W1.
Weight of water added when the plunger has a penetration of
5 to 7 mm from the bottom of the mould = W2
Percentage of water for standard consistency
p = (W2 / W1) x 100
RESULT: Percentage of water for standard consistency is
INFERENCE:
Aurora’s Technological & Research Institute Concrete and Highway Engineering Lab
Department of Civil Engineering 5
EXPERIMENT 2
SETTING TIME OF CEMENT
AIM: To determine the initial and final setting times of cement.
APPARATUS: The Vicat’s apparatus, Needle, Annular ring, Trays, Balance and
Weights.
PROCEDURE:
1. Preparation of Test Block: Prepare a neat cement paste by gauging the
cement with 0.85 times the water required to give the paste of standard
consistency. Start a stopwatch at the instant when water is added to the
cement. Fill the Vicat’s mould with a cement paste with in three to five
minutes after addition of water. Fill the mould completely and smooth off
the surface of this paste making it level with the top of the mould. The
cement block thus prepared in the mould is test block.
2. Clean appliances shall be used for gauging. The temperature of water and
that of the test room at the time of gauging shall be with in (27 2) 0C.
3. During the test the block shall be kept at a temperature of (27 2)0C and at
least 90% relative humidity.
a) Determination of Initial Setting Time:
Place the test block confined in the mould and resting on the nonporous
plate, under the rod bearing the needle, lower the needle gently in contact with
the surface of the test block and quickly release, allowing it to penetrate into the
test block. In the beginning the needle will completely pierce the test block.
Repeat this procedure until the needle, when brought in contact with the test
block and released as described above, fails to pierce the block for 5 to 7 mm
measured from the bottom of the mould. The period elapsing between the time
when water is added to the cement and this time shall be initial setting time.
Aurora’s Technological & Research Institute Concrete and Highway Engineering Lab
Department of Civil Engineering 6
b) Determination of Final Setting Time:
Replace the needle of the Vicat’s apparatus with the needle with a circular
attachment. The cement shall be considered as finally set, when upon lowering the
needle gently to the surface of the test block the needle makes an impression
there on, while the attachment fails to do so. In other words the paste has
attained such hardness that the centre needle does not pierce through the paste
more than 0.5mm.
The period elapsing between the time when water is added to the cement
and the time at which the needle makes an impression on the surface on the test
block while the attachment fails to do so shall be the final setting time.
OBSERVATIONS:
INITIAL SETTING TIME:
S.No. Time Reading on the scale of Vicat’s apparatus
FINAL SETTING TIME:
S.No. Time Reading on the scale of Vicat’s apparatus
RESULT:
Initial setting time of the cement =
Final setting time of the cement =
SPECIFICATION: As per I.S.: 269 – 1989 the initial setting time should not be less
than 30 minutes and final setting time should not be more than 600 minutes for
ordinary Portland cement.
Aurora’s Technological & Research Institute Concrete and Highway Engineering Lab
Department of Civil Engineering 7
EXPERIMENT 3
SPECIFIC GRAVITY OF CEMENT
REF: I.S 4031 - 1988
AIM: To determine the specific gravity of cement
DEFINITION: Specific gravity of cement is defined as the ratio of weight of a given
volume of cement at a given temperature to the weight of an equal volume of
distilled water at the same temperature both weights being taken in air.
APPARATUS: Specific gravity bottle, weighing balance
MATERIAL: Kerosene free of water, naphtha having a specific gravity not less than
0.7313 shall be used in the specific gravity determination.
PROCEDURE:
1. Wt. of empty dry specific gravity bottle = W1
2. Wt. of bottle + Cement (filled 1/4 to 1/3 ) = W2
3. Wt. of bottle + Cement (Partly filled ) + Kerosene = W3
4. Wt. of bottle + Kerosene (full). = W4
5. Wt. of bottle + water (full) = W5
Specific gravity of kerosene Sk = (W4 – W1) / (W5 – W1)
(W2 –W1) x Sk
Specific gravity of Cement = ---------------------------(W4 – W1) – (W3 – W2)
RESULT: Specific Gravity of cement =
SPECIFICATIONS:
INFERENCE:
Aurora’s Technological & Research Institute Concrete and Highway Engineering Lab
Department of Civil Engineering 8
EXPERIMENT 4
COMPRESSIVE STRENGTH OF CEMENT
AIM: To find the compressive strength of given sample of cement.
APPARATUS: 7.07cm cube moulds (50cm2 c/s area), compression testing machine,
vibrating machine, Balance, Weights and Trays.
PROCEDURE: Measure the given cement and standard sand in the proportion 1:3
by weight.
1. Standard sand: It shall pass the 850 micron I.S. sieve and not more than 10%
by weight shall pass the 600 micron I.S. sieve. Take 200 gms of cement and 600
gms of standard sand in a pan. Mix it dry with a trowel for one minute and then
add water. The quantity of water shall be (0.25 P + 3) percent of combined
weight of cement and sand, where P is the % of water required to produce a
paste of standard consistency determined earlier. Add water and mix it until
the mixture is of uniform colour. The time of mixing shall not be less than 3
minutes and not greater than 4 minutes.
2. Immediately after mixing the mortar place the mortar in the cube mould and
tamp with the help of the tamping rod. The mortar shall be rodded 20times in
about 8 seconds to ensure elimination of entrained air.
3. If vibrator is used the period of vibration shall be two minutes at the specified
speed of 12000 vibration per minutes.
4. Then place the cube moulds in an atmosphere of 270 20c and 90% relative
humidity, submerge in clear fresh water till testing.
5. Take out the cubes from water just before testing. Testing should be done on
their sides with out any packing. The rate of loading should be uniform and of
350kg/cm2/minute.
Aurora’s Technological & Research Institute Concrete and Highway Engineering Lab
Department of Civil Engineering 9
6. Three cubes should be tested and their average should be taken as the test
result. Report the result in Kg/cm2.
OBSERVATIONS: Compressive load at three days =
Compressive load at seven days =
RESULT: Compressive strength of cement at three days =
Compressive strength of cement at seven days =
I.S. Specification: For ordinary Portland cement of grade 33 the crushing strength
shall not be less then 16 MPa at 3 days, 22 MPa at 7 days and 33 MPa at 28 days.
INFERENCE:
Aurora’s Technological & Research Institute Concrete and Highway Engineering Lab
Department of Civil Engineering 10
EXPERIMENT 5
WORAKABILITY OF CONCRETE – SLUMP TEST
AIM: To determine the workability of concrete mix of given proportion by slump
test.
APPARATUS: Iron Pan to mix concrete, weighing machine, trowel, slump cone,
scale and tamping rod.
DESCRIPTION: The slump cone is a hollow frustum made of thin steel sheet with
internal dimensions as, the top diameter 10cm, the bottom diameter 20 cm, and
height 30 cm .It stands on a plane non- porous surface. To facilitate vertical lifting
from molded concrete it is provided with a suitable guide attachment and suitable
foot places and handles. The tamping rod is 16mm dia 60cm long and is bullet
pointed at the lower end.
THEORY:
Unsupported concrete, when it is fresh, will flow to the sides and a sinking
in height will take place. This vertical settlement is called slump. Slump is a
measure indicating the workability of cement concrete and also slump gives an
idea of W/C ratio needed for concrete to be used for different works. Slump
increases with W/C ratio. A concrete is said to be workable if it can be easily
mixed and easily placed compacted and easily finished.
PROCEDURE:
Mixes are prepared with W/C. ratio 0.4, 0.5, 0.55 and 0.6. For each mix take
C.A. = 10 kg, F.A. = 5 kg and Cement = 2.5 kg.
1) Mix the dry constituents to get a uniform color and then add water.
2) The internal surface of the mould is to be thoroughly cleaned and place
on a smooth, horizontal, rigid and non-absorbent surface.
Aurora’s Technological & Research Institute Concrete and Highway Engineering Lab
Department of Civil Engineering 11
3) Place the mixed concrete in the cleaned slump cone in 4 layers each
approximately ¼ in height of the mould . Tamp each layer 25 times with
tamping rod.
4) Remove the cone immediately, rising it slowly and carefully in the
vertical direction.
5) As soon as the concrete settlement comes to a stop, measure the
subsidence of the concrete in mm, which gives the slump.
OBSERVATIONS:
S. No. W/C Ratio Slump Type of Slump
1 0.452 0.53 0.554 0.65 0.65
RESULT:
SPECIFICATIONS:
As per I.S: 456 the degree of workability is classified as follows.
Degree of workability Slump
Very low 0mm to 25mm
Low 25mm to 50mm
Medium 50 mm to 100 mm.
High 100 mm to 175 mm.
INFERENCE:
Aurora’s Technological & Research Institute Concrete and Highway Engineering Lab
Department of Civil Engineering 12
WORKABILITY OF CONCRETE
COMPACTING FACTOR TEST
AIM: To determine the workability of concrete mix of given proportions by
compacting factor test.
APPARATUS: Compacting factor apparatus, Balance, Weights, Trays, Tamping rod
and Trowels.
DESCRIPTION: Compacting factor apparatus consists of two conical hoppers
mounted above a cylindrical mould and fixed to a stand one above the other. The
hoppers are provided with trap doors at the bottom. The dimensions of various
parts are given below.
1. Upper Hopper Dimensions in cm.
Top internal dia. 25.4
Bottom 12.7
Internal height 27.9
2. Lower Hopper Dimension in cm.
Top internal dia. 22.9
Bottom 12.7
Internal height 22.9
3. Cylinder Dimension in cm.
Internal Diameter 15.2
Internal Height 30.5
Distance between bottom of upper hopper and top of lower hopper is 20.3 cm.
Distance between bottom of lower hopper and top of cylinder is 20.3 cm.
Aurora’s Technological & Research Institute Concrete and Highway Engineering Lab
Department of Civil Engineering 13
DEFINITION:
Compacting factor is defined as the ratio of weight of partially compacted
concrete to the weight of fully compacted concrete.
PROCEDURE:
Four mixes are prepared with W/C., ratios 0.4, 0.5, 0.55, 0.6 and 0.65. For
each mix take 2.5 kg of cement, 5 kg of fine aggregate and 10 kg of coarse
aggregate.
1. Mix the dry constituents to get a uniform color and then add water.
2. The internal surfaces of the hoppers and cylinder are thoroughly cleaned.
3. The sample of concrete to be tested is placed gently in the upper hopper.
4. The hopper is filled level with its brim and the trap door is opened so that
the concrete falls into the lower hopper.
5. If concrete has a tendency to stick to the sides of the hopper, the concrete
should be slowly pushed down by inserting the tamping rod into the
concrete.
6. Immediately after the concrete comes to door of the lower hopper, it is
opened and the concrete is allowed to fall into the cylinder.
7. The excess of concrete in the cylinder above the top is cut off and made
level with trowels. The outside of cylinder is wiped clean.
8. The weight of the concrete in the cylinder is then determined. This weight
is known as weight of partially compacted concrete.
9. The cylinder is refilled with concrete from the same sample in six layers and
each is rammed thoroughly.
10.The top of fully compacted concrete should be carefully struck off level
with top cylinder. The outside of the cylinder is wiped a clean and the
weight of fully compacted concrete is found.
Aurora’s Technological & Research Institute Concrete and Highway Engineering Lab
Department of Civil Engineering 14
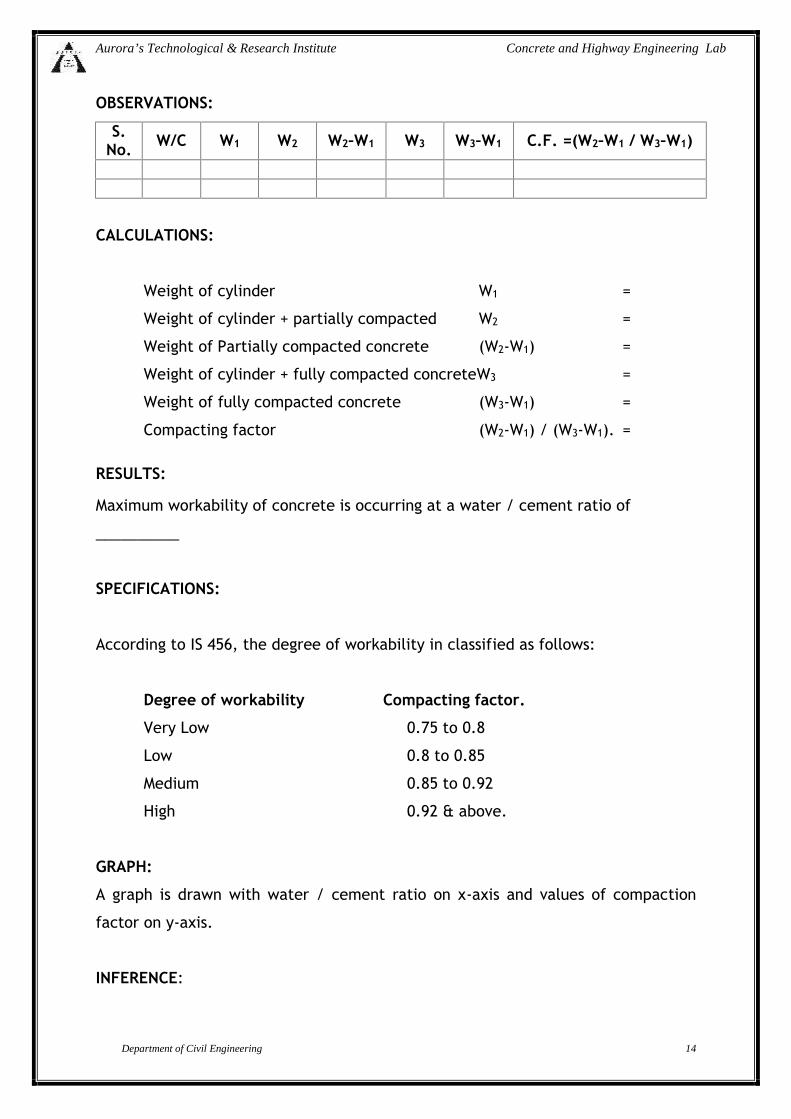
OBSERVATIONS:
S.No. W/C W1 W2 W2–W1 W3 W3–W1 C.F. =(W2–W1 / W3–W1)
CALCULATIONS:
Weight of cylinder W1 =
Weight of cylinder + partially compacted W2 =
Weight of Partially compacted concrete (W2-W1) =
Weight of cylinder + fully compacted concreteW3 =
Weight of fully compacted concrete (W3-W1) =
Compacting factor (W2-W1) / (W3-W1). =
RESULTS:
Maximum workability of concrete is occurring at a water / cement ratio of
__________
SPECIFICATIONS:
According to IS 456, the degree of workability in classified as follows:
Degree of workability Compacting factor.
Very Low 0.75 to 0.8
Low 0.8 to 0.85
Medium 0.85 to 0.92
High 0.92 & above.
GRAPH:
A graph is drawn with water / cement ratio on x-axis and values of compaction
factor on y-axis.
INFERENCE:
Aurora’s Technological & Research Institute Concrete and Highway Engineering Lab
Department of Civil Engineering 15
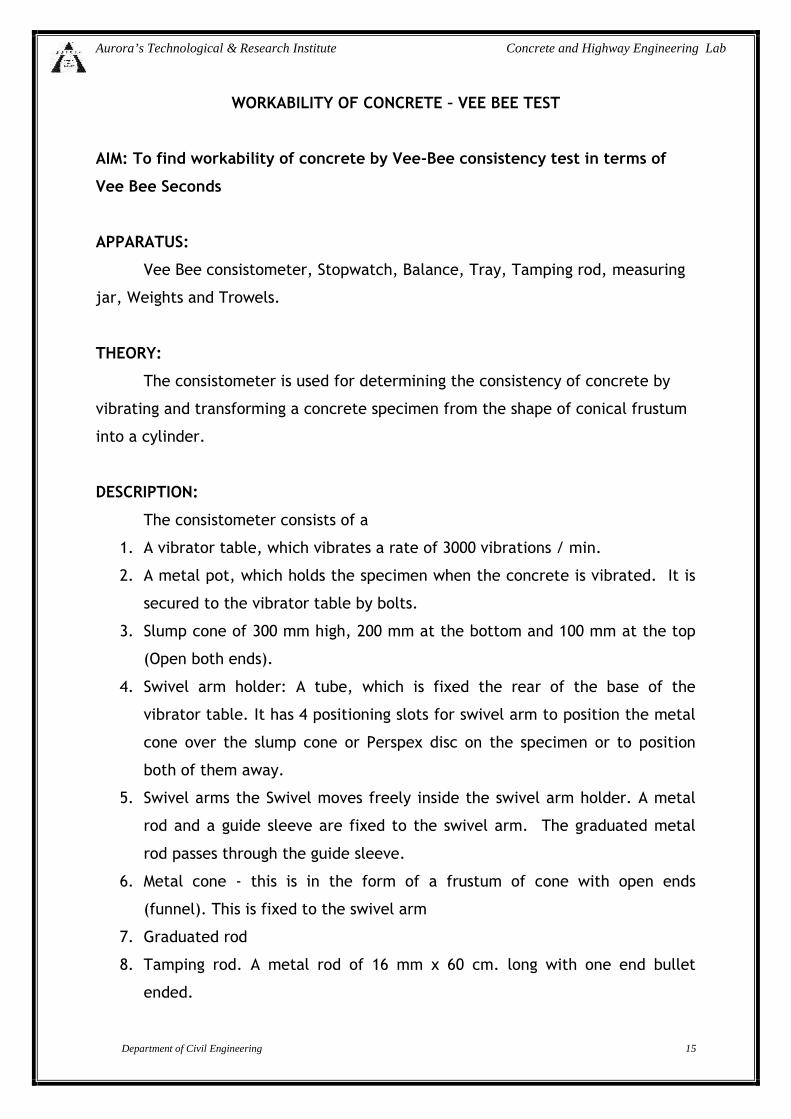
WORKABILITY OF CONCRETE – VEE BEE TEST
AIM: To find workability of concrete by Vee-Bee consistency test in terms of
Vee Bee Seconds
APPARATUS:
Vee Bee consistometer, Stopwatch, Balance, Tray, Tamping rod, measuring
jar, Weights and Trowels.
THEORY:
The consistometer is used for determining the consistency of concrete by
vibrating and transforming a concrete specimen from the shape of conical frustum
into a cylinder.
DESCRIPTION:
The consistometer consists of a
1. A vibrator table, which vibrates a rate of 3000 vibrations / min.
2. A metal pot, which holds the specimen when the concrete is vibrated. It is
secured to the vibrator table by bolts.
3. Slump cone of 300 mm high, 200 mm at the bottom and 100 mm at the top
(Open both ends).
4. Swivel arm holder: A tube, which is fixed the rear of the base of the
vibrator table. It has 4 positioning slots for swivel arm to position the metal
cone over the slump cone or Perspex disc on the specimen or to position
both of them away.
5. Swivel arms the Swivel moves freely inside the swivel arm holder. A metal
rod and a guide sleeve are fixed to the swivel arm. The graduated metal
rod passes through the guide sleeve.
6. Metal cone - this is in the form of a frustum of cone with open ends
(funnel). This is fixed to the swivel arm
7. Graduated rod
8. Tamping rod. A metal rod of 16 mm x 60 cm. long with one end bullet
ended.
Aurora’s Technological & Research Institute Concrete and Highway Engineering Lab
Department of Civil Engineering 16
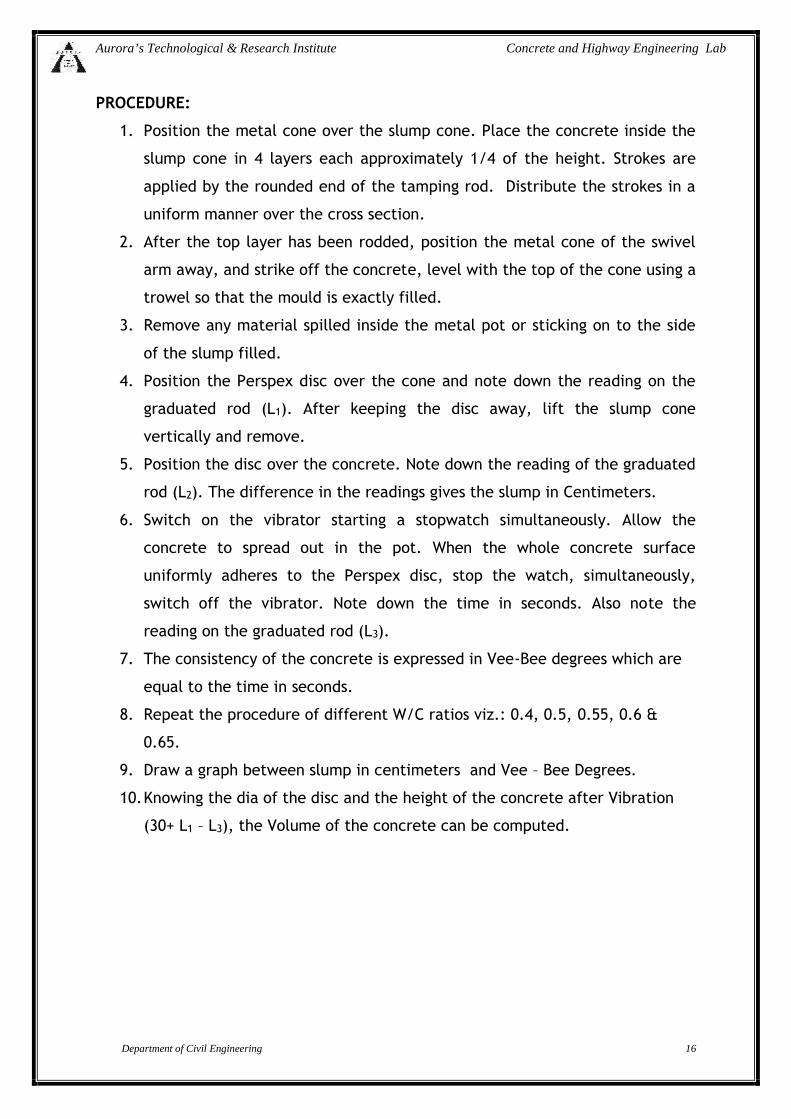
PROCEDURE:
1. Position the metal cone over the slump cone. Place the concrete inside the
slump cone in 4 layers each approximately 1/4 of the height. Strokes are
applied by the rounded end of the tamping rod. Distribute the strokes in a
uniform manner over the cross section.
2. After the top layer has been rodded, position the metal cone of the swivel
arm away, and strike off the concrete, level with the top of the cone using a
trowel so that the mould is exactly filled.
3. Remove any material spilled inside the metal pot or sticking on to the side
of the slump filled.
4. Position the Perspex disc over the cone and note down the reading on the
graduated rod (L1). After keeping the disc away, lift the slump cone
vertically and remove.
5. Position the disc over the concrete. Note down the reading of the graduated
rod (L2). The difference in the readings gives the slump in Centimeters.
6. Switch on the vibrator starting a stopwatch simultaneously. Allow the
concrete to spread out in the pot. When the whole concrete surface
uniformly adheres to the Perspex disc, stop the watch, simultaneously,
switch off the vibrator. Note down the time in seconds. Also note the
reading on the graduated rod (L3).
7. The consistency of the concrete is expressed in Vee-Bee degrees which are
equal to the time in seconds.
8. Repeat the procedure of different W/C ratios viz.: 0.4, 0.5, 0.55, 0.6 &
0.65.
9. Draw a graph between slump in centimeters and Vee – Bee Degrees.
10.Knowing the dia of the disc and the height of the concrete after Vibration
(30+ L1 – L3), the Volume of the concrete can be computed.
Aurora’s Technological & Research Institute Concrete and Highway Engineering Lab
Department of Civil Engineering 17
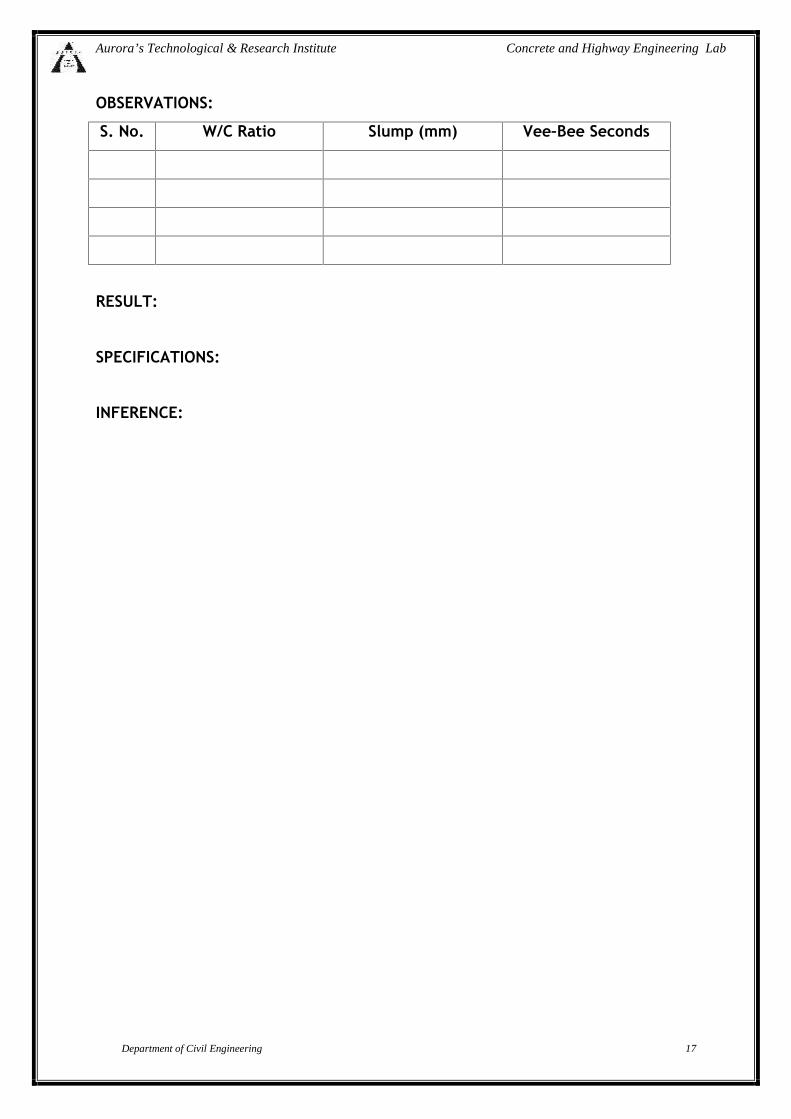
OBSERVATIONS:
S. No. W/C Ratio Slump (mm) Vee–Bee Seconds
RESULT:
SPECIFICATIONS:
INFERENCE:
Aurora’s Technological & Research Institute Concrete and Highway Engineering Lab
Department of Civil Engineering 18
EXPERIMENT 6
CUBE COMPRESSIVE STRENGTH OF CONCRETE
AIM: To determine the compressive strength of concrete using 15 x 15 x 15 cm
concrete cubes.
APPARATUS: Compressive testing machine, Balance, Trays, Weights, Moulds and
Trowels.
PROCEDURE:
1. Place the cube at the centre of the lower platen of the compression testing
machine in such a manner that the load shall be applied to opposite sides of
the cube as cast, that is, not to the top and bottom.
2. The axis of the specimen shall be carefully aligned with the centre of the
thrust of the spherically seated platen. No packing shall be used between
the faces of the test specimen and the steel platen of the testing machine.
3. The load shall be applied without shock and increased continuously at a rate
of approximately 140kg/cm2/min. until the resistance of the specimen to
the increasing load breaks down and no greater load can be sustained.
4. The maximum load applied to the specimen shall then be recorded.
OBSERVATIONS: Measured side of cube = cm
Weight of the cube = kg.
Load at first crack = kg.
Load at ultimate failure = kg.
Aurora’s Technological & Research Institute Concrete and Highway Engineering Lab
Department of Civil Engineering 19
CALCULATIONS:
Initial crack strength of concrete =
Ultimate cube compressive strength of the concrete =
Safe compressive strength of concrete =
=
RESULT:
INFERENCE:
Maximum Loadc/s area of the specimen
Ultimate strengthFactor of safety
Ultimate strength3
Load at first crack__c/s area of the specimen
Aurora’s Technological & Research Institute Concrete and Highway Engineering Lab
Department of Civil Engineering 20
EXPERIMENT 7
BULKING OF SAND by LAB. METHOD
AIM: To ascertain the bulking Phenomena of given sample of sand.
APPARATUS: Special Vessel for unit volume, tray, balance and weights,
THEORY:
Increase in volume of sand due to presence of moisture is known as Bulking
of sand. Bulking is due to the formation of thin film of water around the sand
grains and the interlocking of air in between the sand grains and the film of water.
When more water is added a sand particles got submerged and volume again
becomes equal to dry volume of sand. To compensate the bulking effect extra sand
is added in the concrete so that the ration of coarse to fine aggregate will not
change from the specified value. Fine sands shown greater percentage of bulking
than coarse sands with equal percentage of moisture.
PROCEDURE:
Compact the sand in three layers in the vessel, each layer being given 25
strokes, and strike level at top. Weigh it and dump it into a tray. Add a certain
percent of water by weight (say 2%) of dry compacted tray. Add a certain percent
of water by weight (say 2%) of dry compacted sand. Mix, well till uniformly moist.
Fill the container with the wet sand without any tamping strike tip surface level,
and find weight of the wet loose sand.
Repeat this with moisture contents of 4,6,8,10,12,14,16,18 and 20%.
Aurora’s Technological & Research Institute Concrete and Highway Engineering Lab
Department of Civil Engineering 21
OBSERVATIONS:
S. No.% of water
added(X%)
Wt. of wetsand W2 gm
Wt. of drysand in wet
sand W3 gm.= W2 /
(1+0.01 x)
Bulk Factor=
W1 / W3
Bulking % =(B.F-1) * 100
1 22 43 64 85 106 127 148 169 1810 20
CALCULATIONS:
Weight of unit volume of dry compacted sand = W1
Weight of loose wet sand of unit volume = W2
If moisture content be x% in sand, and if W3 is weight of dry sand in W2 of loose
wet sand,
Then W2 = W3 + (0.01) x W3
W3 = W2/ (1+0.01 X).
Bulking factor (B.F.) = W1 /W3.
Bulking percentage = (W1 – W3) X 100 / W3.
or (B.F. –1) X 100.
GRAPH: Plot graph between B.F. on (Y- axis) and water content on (X- axis).
RESULT:
1. Moisture content at maximum bulking =
2. Percentage of maximum bulking =
SPECIFICATION:
INFERENCE:
Aurora’s Technological & Research Institute Concrete and Highway Engineering Lab
Department of Civil Engineering 22
BULKING OF SAND by FIELD METHOD
AIM: To ascertain the bulking phenomena of given sample of dry sand.
BULKING FACTOR:
The bulking factor is defined as the ratio of the volume of moist sand to volume of
the sand when dry.
BULKING PERCENTAGES:
It is defined as the ratio of increase in volume of moist sand to the volume of sand
when dry.
PROCEDURE:
1. Take about 200gms of dry sand in a 1 liter jar and find its volume (V1)
2. Put the above sand in a mixture pan and add 2% water by weight. Mix it
thoroughly to get uniform color.
3. Fill this moist sand into the 1 liter cylinder and note down the volume (V2)
4. The increase in volume is (V2 -V1) and the percentage of bulking is 2 1
1
V V100
V
5. The bulking factor 2
1
V
V
6. Repeat the experiment with different percentages of water i.e., 4,6,8,12,16%
7. Plot the graph of bulking factor on Y axis v/s moisture content by percentage of
dry mass of sand on X-Axis. This is known as bulking curve.
The field test to find out the percentage of bulking is so simple that this
could be conducted in a very short time interval and the percentage of bulking so
found out could be employed for correcting the volume of fine aggregate to be
used. This can be considered as one of the important methods of field control to
produce quality concrete. Since volume batching is not adopted for controlled
concrete, the determination of the percentage of moisture content is not normally
required. The quality of water could be controlled by visual examination of the
mix and by experience. The percentage free moisture content is required to be
Aurora’s Technological & Research Institute Concrete and Highway Engineering Lab
Department of Civil Engineering 23
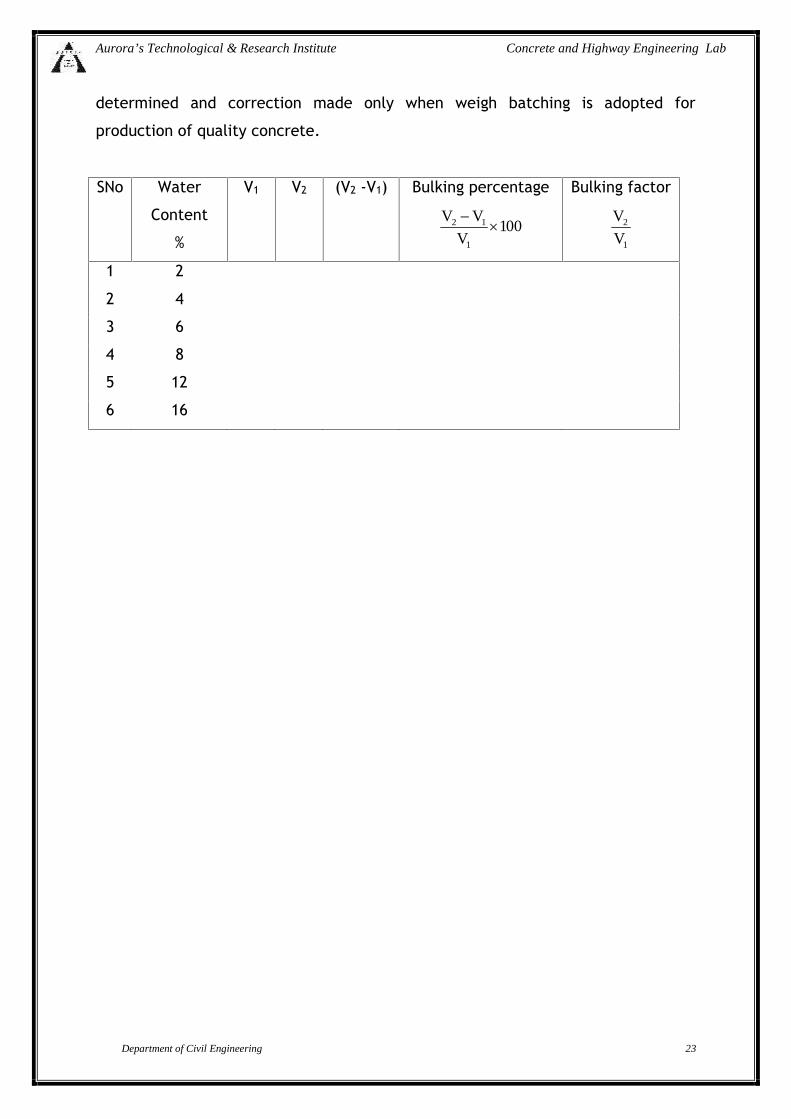
determined and correction made only when weigh batching is adopted for
production of quality concrete.
SNo Water
Content
%
V1 V2 (V2 -V1) Bulking percentage
2 1
1
V V100
V
Bulking factor
2
1
V
V
1 2
2 4
3 6
4 8
5 12
6 16
Aurora’s Technological & Research Institute Concrete and Highway Engineering Lab
Department of Civil Engineering 24
HIGHWAY ENGINEERING LAB - ROAD AGGREGATES
EXPERIMENT 1
AGGREGATE CRUSHING VALUE TEST
AIM: To find Aggregate Crushing value of the given aggregate sample.
APPARATUS:
Steel cylinder, cylindrical measure, Steel temping rod, Balance, Compressions
testing machine
PROCEDURE:
The aggregate passing 12.5 mm sieve and retained on 10 mm IS sieve is selected
for standard test. The aggregate should be in surface dry condition before testing.
The aggregate may be dried by heating at a temperature 100o C for a period of 4
hours and is tested after being cooled to room temperature.
The cylindrical measure is filled by the test sample of aggregate in three layers of
approximately equal depth, each layer being tamped 25 times by the rounded end
of the tamping rod. After the third layer is tamped, the aggregate at the top of the
cylindrical measure is leveled off by using the tamping rod as a straight edge.
About 6.5 kg of aggregate is required for preparing two test samples. The test
sample thus taken is then weighed. The same weight of the sample is taken in the
repeat test.
The cylinder of the test apparatus is placed in position on the base plate; one third
of the test sample is placed in the cylinder and tamped 25 times by the tamping
rod. Similarly, the other two parts of the test specimen are added, each layer
being subjected to 25 blows. The total depth of the material in the cylinder after
tamping shall however be 10 cm. The surface of the aggregate is leveled and the
plunger inserted so that it rests on this surface in level position. The cylinder with
the test sample and plunger in position is placed on compression testing machine.
Load is then applied through the plunger at a uniform rate of 4 tones per minute
until the total load is 40 tones, and then the load is released. Aggregates including
the crushed portion are removed from the cylinder and sieved on a 2.36 mm IS
sieve. The material which passes this sieve is collected.
Aurora’s Technological & Research Institute Concrete and Highway Engineering Lab
Department of Civil Engineering 25
The above crushing test is repeated on second sample of the same weight in
accordance with above test procedure. Thus two tests are made for the same
specimen for taking an average value.
CALCULATION:
Total weight of dry sample taken = W1 gm.
Weight of the portion of crushed material passing 2.36 mm IS sieve = W2 gm
Aggregate crushing value = 100 W2 / W1
RESULT:
The mean of the crushing value obtained in the two tests is reported as the
aggregate crushing value.
APPLICATIONS OF AGGREGATE CRUSHING TEST
The aggregate crushing value is an indirect measure of crushing strength of the
aggregates. Low aggregate crushing value indicates strong aggregates, as the
crushed fraction is low. Thus the test can be used to assess the suitability of
aggregates with reference to the crushing strength for various types of pavement
components. The aggregates used for the surface course of pavements should be
strong enough to withstand the high stresses due to wheel loads, including the
steel tyres of loaded bullock-carts. However as the stresses at the base and sub-
base courses are low aggregates with lesser crushing strength may be used at the
lower layers of the pavement.
Indian Roads Congress and ISI have specified that the aggregate crushing value of
the coarse aggregates used for cement pavement at surface should not exceed 30
percent. For aggregates used for concrete other than for wearing surfaces, the
aggregate crushing value shall not exceed 45 percent, according to the ISS.
However aggregate crushing values have not been specified by the IRC for coarse
aggregates to be used in bituminous pavement construction methods.
Aurora’s Technological & Research Institute Concrete and Highway Engineering Lab
Department of Civil Engineering 26
EXPERIMENT 2
AGGREGATE IMPACT VALUE TEST
AIM: To find Impact value of the given aggregate sample.
APPARATUS
The apparatus consists of an impact-testing machine, a cylindrical measure,
tamping rod, IS sieve, balance, tamping rod and oven.
PROCEDURE
The test sample consists of aggregates passing 12.5 mm sieve and retained on 10
mm sieve and dried in an oven for four hours at a temperature 1000 C to 1100 C and
cooled. The aggregates are filled up to about one-third full in the cylindrical
measure and tamped 25 times with rounded end of the tamping rod. Further
quantity of aggregates are struck off using the tamping rod as straight edge. The
net weight of the aggregates in the measure is determined to the nearest gram and
this weight of the aggregates is used for carrying out duplicate test on the same
material. The impact machine is placed with its bottom plate fiat on the floor so
that the hammer guide columns are vertical. The cup is fixed firmly in position on
the base of the machine and the whole of the test sample from the cylindrical
measure is transferred to the cup and compacted by tamping with 25 strokes.
The hammer is raised until its lower face is 38 cm above the upper surface of the
aggregates in the cup, and allowed to fall freely on the aggregates. The test
sample is subjected to a total of 15 such blows, each being delivered at an interval
of not less than one second. The crushed aggregate is then removed from the cup
and the whole of it sieved on the 2.36 mm sieve until no further significant
amount passes. The fraction passing the sieve is weighed accurate to 0.1 g. The
fraction retained on the sieve is also weighed and if the total weight of the
fractions passing and retained on the sieve is added, it should not be less than the
original weight of the specimen by more than one gram; if the total weight is less
than the original by over one gram, the result should be discarded and a fresh test
made.
Aurora’s Technological & Research Institute Concrete and Highway Engineering Lab
Department of Civil Engineering 27
The above test is repeated on fresh aggregate sample.
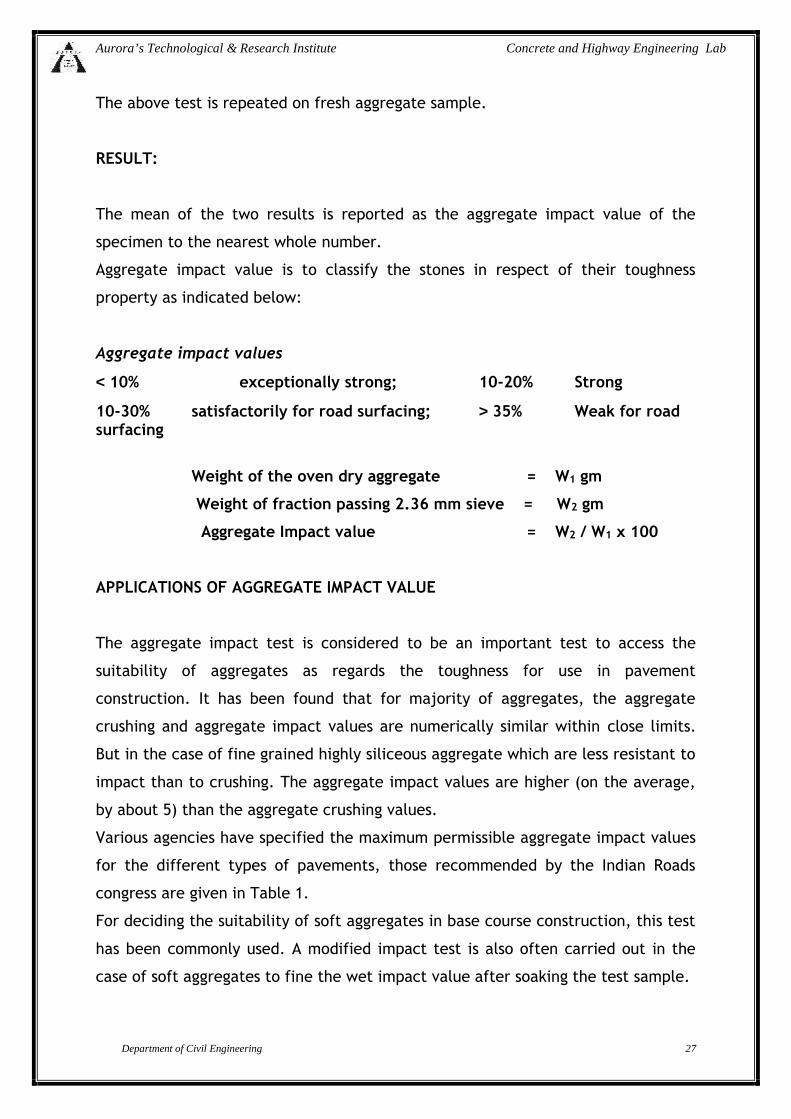
RESULT:
The mean of the two results is reported as the aggregate impact value of the
specimen to the nearest whole number.
Aggregate impact value is to classify the stones in respect of their toughness
property as indicated below:
Aggregate impact values
10% exceptionally strong; 10-20% Strong
10-30% satisfactorily for road surfacing; 35% Weak for roadsurfacing
Weight of the oven dry aggregate = W1 gm
Weight of fraction passing 2.36 mm sieve = W2 gm
Aggregate Impact value = W2 / W1 x 100
APPLICATIONS OF AGGREGATE IMPACT VALUE
The aggregate impact test is considered to be an important test to access the
suitability of aggregates as regards the toughness for use in pavement
construction. It has been found that for majority of aggregates, the aggregate
crushing and aggregate impact values are numerically similar within close limits.
But in the case of fine grained highly siliceous aggregate which are less resistant to
impact than to crushing. The aggregate impact values are higher (on the average,
by about 5) than the aggregate crushing values.
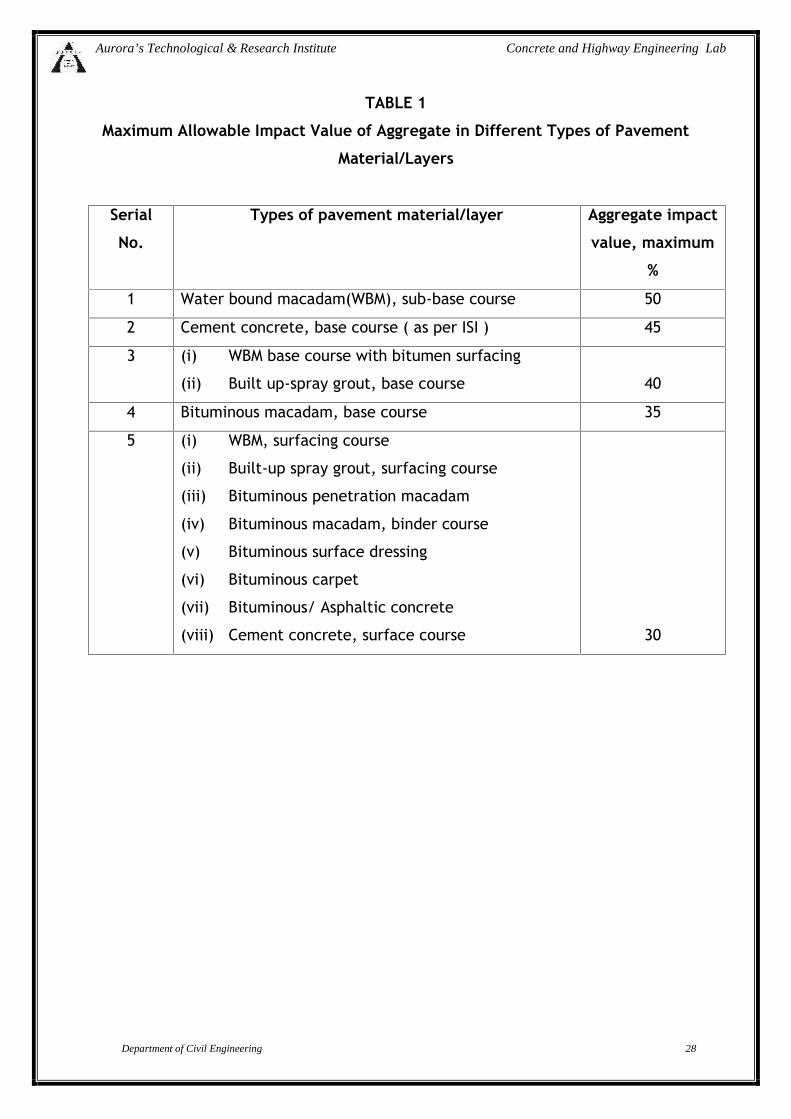
Various agencies have specified the maximum permissible aggregate impact values
for the different types of pavements, those recommended by the Indian Roads
congress are given in Table 1.
For deciding the suitability of soft aggregates in base course construction, this test
has been commonly used. A modified impact test is also often carried out in the
case of soft aggregates to fine the wet impact value after soaking the test sample.
Aurora’s Technological & Research Institute Concrete and Highway Engineering Lab
Department of Civil Engineering 28
TABLE 1
Maximum Allowable Impact Value of Aggregate in Different Types of Pavement
Material/Layers
Serial
No.
Types of pavement material/layer Aggregate impact
value, maximum
%
1 Water bound macadam(WBM), sub-base course 50
2 Cement concrete, base course ( as per ISI ) 45
3 (i) WBM base course with bitumen surfacing
(ii) Built up-spray grout, base course 40
4 Bituminous macadam, base course 35
5 (i) WBM, surfacing course
(ii) Built-up spray grout, surfacing course
(iii) Bituminous penetration macadam
(iv) Bituminous macadam, binder course
(v) Bituminous surface dressing
(vi) Bituminous carpet
(vii) Bituminous/ Asphaltic concrete
(viii) Cement concrete, surface course 30
Aurora’s Technological & Research Institute Concrete and Highway Engineering Lab
Department of Civil Engineering 29
EXPERIMENT 3
SPECIFIC GRAVITY AND WATER ABSORPTION TEST
AIM: To find out the specific gravity and water absorption of the given aggregate
APPARATUS:
1. Balance
2. Oven to maintain temp of 100oC to 110oC
3. Wire basket
4. Container with water
5. Trays
PROCEDURE:
About 2 Kg of the aggregate sample is washed thoroughly and placed in the
wire basket when immersed in distilled water. The basket and the sample are then
weighed (W1) while suspended in water at a temp of 22oC to 32oC. The aggregates
are then placed on the absorbent clothes and should be cleaned. The surface dry
aggregates is then weighed (W2). The aggregate is placed in a shallow tray and
kept in an oven maintained at a temp of 110oC for 24 hours. It is then removed
from the oven, cooled in an air tight container and weighted (W4).
OBSERVATIONS:
Weight of saturated aggregate suspended in water with the basket = W1
Weight of basket above suspended in water = W2
Weight of saturated aggregate in water = (W1-W2)
Weight of saturated surface dry aggregate in air = W3
Weight of Water equal to the volume of the aggregate = W3–W5
CALCULATIONS:
Specific Gravity= dry weight of aggregate/ weight of equal volume of water =
4
3 5
W
W W
Aurora’s Technological & Research Institute Concrete and Highway Engineering Lab
Department of Civil Engineering 30
Water Absorption, % = Percentage by weight of water absorbed in terms of oven
dried weight of aggregate
= 3 4
4
100W W
xW
INTERFERENCE:
The specific gravity of aggregates normally used in road construction ranges from
about 2.5 to 3.0 with an average value of 2.68. Water absorption value ranges from
0.1 to 2.0 % for aggregates normally used in road surfacing IRC has specified the
maximum water absorption valves as 10 percent for aggregate used in bituminous
surface dressing and built up spray grow.
Aurora’s Technological & Research Institute Concrete and Highway Engineering Lab
Department of Civil Engineering 31
EXPERIMENT 4
LOS ANGELES ABRASION TEST
AIM: To find the Los Angeles abrasion value of given aggregate sample
APPARATUS: The apparatus consists of Los Angeles machine, abrasive charge and
sieves.
Los Angeles machine consists of a hollow steel cylinder, closed at both ends,
having an inside diameter 70cm and an inside length of 50 cm, mounted on stub
shafts about which it rotates on a horizontal axis.
An opening is provided in the cylinder for the introduction of the test sample. A
removable cover of the opening is provided in such a way that when closed and
fixed by bolts and nut, it is dust-tight and the interior surface is perfectly
cylindrical. A removable steel shelf projecting radial 8.8 cm into the parallel to
the axis. The shelf is fixed at a distance of 12.5 cm from the opening, measured
along the circumference in the direction of rotation. Abrasive charge, consisting of
cast iron spheres approximately 4.8 cm in diameter and 390 to 445 g in weight are
used. The weight of the sphere of the aggregates tested. The aggregates grading
have been standardized as A, B, C, D, E, F and G for this test and the IS
specifications for the grading and abrasive charge to be used are given in Table
11.1. IS sieve with 1.70 mm opening is used for separating the fines after the
abrasion test.
PROCEDURE:
Clean aggregates dried in an oven at 105-1100 C to constant weight, conforming to
any one of the grading A to G, as per Table 11.1 is used for the test. The grading or
grading’s used in the test should be nearest to the grading to be used in the
construction. Aggregates weighing 5 kg for grading A, B, C or D and 10 kg for
grading E, F or G may be taken as test specimen and placed in the cylinder. The
abrasive charge is also chosen in accordance with Table 1 depending on the
grading of the aggregate and is placed in the cylinder of the machine. The cover is
then fixed dust-tight. The machine is rotated at a speed of 30 to 33 revolutions per
minute. The machine is rotated for 500 revolutions for grading A, B, C and D, for
Aurora’s Technological & Research Institute Concrete and Highway Engineering Lab
Department of Civil Engineering 32
grading’s E, F and G, it shall be rotated for 1,000 revolutions. The machine should
be balanced and driven in such a way as to maintain uniform peripheral speed.
After the desired number of revolutions, the machine is stopped and the material
is discharged from the machine taking care to take out entire stone dust. Using a
sieve of size larger than 1.70 mm IS sieve, 1.7 mm IS sieve. The portion of material
coarser than 1.7 mm size is washed and dried in an oven at 105 to 1100 C to
constant weight and weighed correct to one gram.
CALCULATIONS
The difference between the original and final weights of the sample is expressed
as a percentage of the original weight of the sample is reported as the percentage
wear.
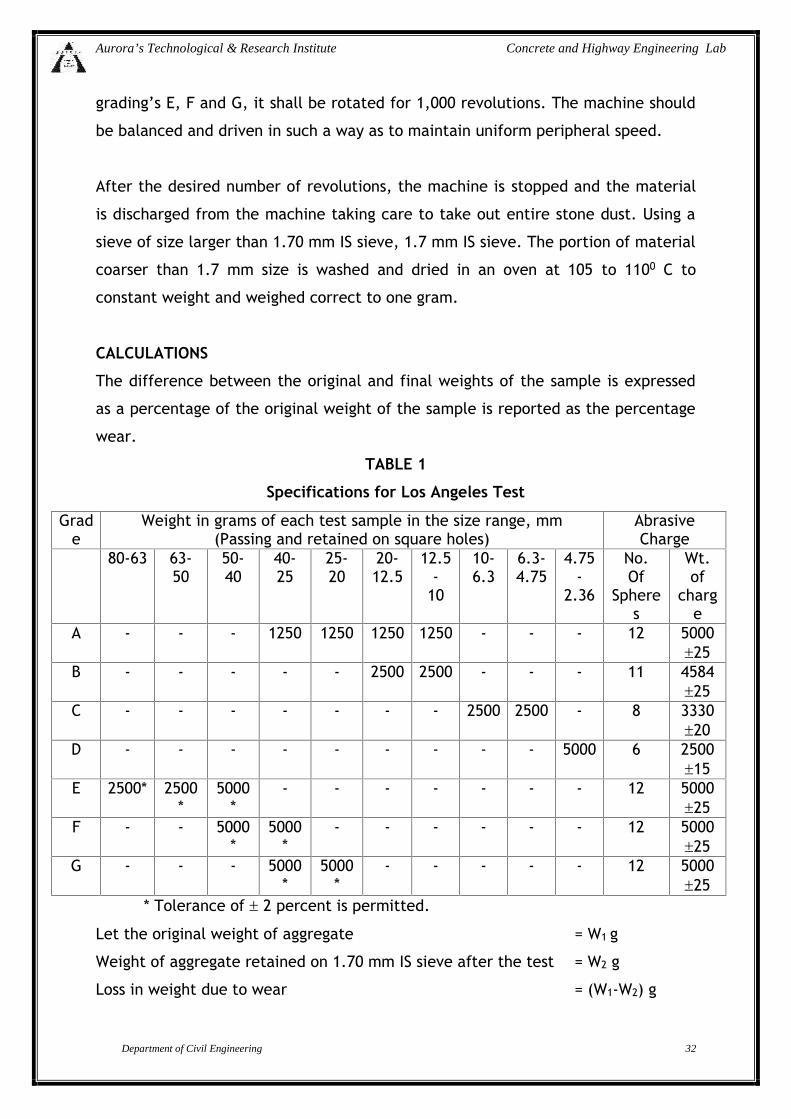
TABLE 1
Specifications for Los Angeles Test
Grade
Weight in grams of each test sample in the size range, mm(Passing and retained on square holes)
AbrasiveCharge
80-63 63-50
50-40
40-25
25-20
20-12.5
12.5-
10
10-6.3
6.3-4.75
4.75-
2.36
No.Of
Spheres
Wt.of
charge
A - - - 1250 1250 1250 1250 - - - 12 500025
B - - - - - 2500 2500 - - - 11 458425
C - - - - - - - 2500 2500 - 8 333020
D - - - - - - - - - 5000 6 250015
E 2500* 2500*
5000*
- - - - - - - 12 500025
F - - 5000*
5000*
- - - - - - 12 500025
G - - - 5000*
5000*
- - - - - 12 500025
* Tolerance of 2 percent is permitted.
Let the original weight of aggregate = W1 g
Weight of aggregate retained on 1.70 mm IS sieve after the test = W2 g
Loss in weight due to wear = (W1-W2) g
Aurora’s Technological & Research Institute Concrete and Highway Engineering Lab
Department of Civil Engineering 33
Los Angeles abrasion value, % = Percentage wear = (W1-W2) x 100
W1
RESULT:
The result of the Los Angeles abrasion test is expressed as a percentage wear and
the average value of two tests may be adopted as the Los Angeles abrasion value.
INTERFERENCE:
Los Angeles Abrasion Test is very widely accepted as a suitable test to assess the
hardness of aggregates used in pavement construction. Many agencies have
specified the desirable limits of the test, for different methods of pavement
construction. The maximum allowable Los Angeles abrasion values of aggregates as
specified by Indian Roads Congress for different methods of construction are given
in Table 1.
TABLE 11.2
Maximum Allowable Los Angeles Values of Aggregates in Different
Types of Pavement Layers
SerialNo.
Types of pavement layer Los Angeles abrasionvalue, maximum %
1 Water Bound Macadam(WBM), sub-base course 602 (i) WBM base course with bituminous surfacing
(ii) Bituminous Macadam base course(iii) Built-up spray grout base course 50
3 (i) WBM surfacing course(ii) Bituminous Macadam binder course(iii) Bituminous penetration Macadam(iv) Built-up spray grout binder course 40
4 (i) Bituminous carpet surface course(ii) Bituminous surface dressing, single or two coats(iii) Bituminous surface dressing, using pre-coated
aggregates.(iv) Cement concrete surface course ( as per IRC ) 35
5 (i) Bituminous/Asphalt concrete surface course(ii) Cement concrete pavement surface course ( as
per ISI )30
Aurora’s Technological & Research Institute Concrete and Highway Engineering Lab
Department of Civil Engineering 34
EXPERIMENT 5
DEVAL ATTRITION TEST
AIM: To determine the coefficient of hardness or resistance to wear of stone
aggregate
APPARATUS: LOS Angeles machine, Deval attrition test machine, sieves, weighing
balance, charges
THEORETICAL BACKGROUND: The aggregate used in pavements is subjected to
huge amounts of wear and tear. Hence it is imported to know the hardness and
resistance offered by the material.
PROCEDURE:
1. Take 5 kg of dried aggregates and 6 steel charges introduce them into two
different cylinders.
2. Rotate the machine at 30 to 33 rpm for 10,000 revolution
3. After completion of revolutions discharges the material from the machine.
4. Sieve the remains through 1.7 mm is sieve
5. Wash and dry the material coarser than 1.7 mm and weigh it.
RESULT: Percentage of wear = 10%
Aurora’s Technological & Research Institute Concrete and Highway Engineering Lab
Department of Civil Engineering 35
EXPERIMENT 6
AGGREGATE SHAPE TEST (FLAKINESS & ELONGATION)
FLAKINESS INDEX
AIM: To find the flakiness index of the given aggregate sample.
APPARATUS:
The apparatus consists of a standard thickness gauge shown in Figure 15.1, IS
sieves of sizes 63,50,40,31,5,25,20,16,12.5,10 and 6.3 mm and a balance to weigh
the samples.
PROCEDURE:
The sample is sieve with the sieves mentioned in Table 1. A minimum of 200 pieces
of each fraction to be tested are taken and weighed = W1 g. In order to separate
flaky materials, each fraction is then gauged for thickness on a thickness gauge
shown in Fig. 15.1 or in bulk on sieves having elongated slots. The width of the slot
should be of the dimensions specified in column (3) of Table 15.1 for the
appropriate size of material. The amount of flaky material passing the gauge is
weighed to an accuracy of at least 0.1 percent of the test sample.
TABLE .1
Dimensions of Thickness and Length Gauges
Size of aggregate (a) Thickness
gauge (0.6 times
the mean sieve),
mm
(b) Length gauge
(1.8 times the
mean sieve), mm
Passing through IS
sieve mm
Retained on IS
sieve, mm
1 2 3 4
63.0
50.0
40.0
31.5
50.0
40.0
25.0
25.0
33.90
27.00
19.50
16.95
-
81.0
58.5
-
Aurora’s Technological & Research Institute Concrete and Highway Engineering Lab
Department of Civil Engineering 36
25.0
20.0
16.0
12.5
10.0
20.0
16.0
12.5
10.0
06.3
13.50
10.80
08.55
06.75
04.89
40.5
32.4
25.6
20.2
14.7
CALCULATION AND RESULT:
In order to calculate the flakiness index of the entire sample of aggregates first
the weight of each fraction of aggregate passing and retained on the specified set
of sieves is noted. As an example let 200 pieces of the aggregate pasing 50 mm
sieve and retained on 50 mm sieve be= W1 g. Each of the particles from this
fraction of aggregate is tried to be passed through the slot of the specified
thickness of the thickness gauge; in this example the width of the appropriate
gauge of the thickness gauge is 27.0 mm gauge.
Let the weight of the flaky material passing this gauge be W1 g. Similarly the
weights of the fractions passing and retained the specified sieves, W1, W2, W3,
etc., are weighed and the total weight W1+ W2 +W3 +… - W g is found. Also the
weights of materials passing each of the specified thickness gauge are found = W1,
W2, W3… and the total weight of material passing the different thickness gauges =
W1+ W2 +W3 + … = W g is found. Then the flakiness index is the total weight of the
flaky material passing the various thickness gauges expressed as a percentage of
the total weight of the sample gauged.
Flakiness Index = (w1 + w2+w3 + …) 100 percent = 100w percent
W1+ W2 +W3 + … W
Aurora’s Technological & Research Institute Concrete and Highway Engineering Lab
Department of Civil Engineering 37
ELONGATION INDEX
The elongation index of an aggregate is the percentage by weight of particles
whose greatest dimension (length) is greater than one and four fifth times (1.8
times) their mean dimension. The elongation test is not applicable to sizes smaller
than 6.3 mm.
APPARATUS
The apparatus consists of the length gauge shown in Figure 15.2, sieves of the sizes
specified in Table 15.1 and a balance.
PROCEDURE
The sample is sieved through the IS sieves specified in Table 15.1. A minimum of
200 pieces of each fraction is taken and weighed. In order to separate elongated
material, each fraction is then gauged individually for length in a length gauge (see
fig. 15.2). The gauge length used should be those specified in column 4 of the
Table for the appropriate material. The pieces of aggregates from each fraction
tested which could not pass through the specified gauge length with its long side
are elongated particles and are collected separately to find the total weight of
aggregate retained on the length gauge from each fraction. The total amounts of
elongated material retained by the length gauge are weighed to an accuracy of at
least 0.1 percent of the weight of the test sample.
CALCULATION AND RESULT
In order to calculate the elongation index of the entire sample of aggregates, the
weight of aggregates which is retained on the specified gauge length from each
fraction is noted. As an example, let 200 pieces of the aggregate passing 40 mm
sieve and retained 25 mm sieve W1 g. Each piece of these are tried to be passed
through the specified gauge length of length gauge, which in this example is
(40+25)/2 x 1.8 = 58.5 mm with its longest side and those elongated pieces which
do not pass the gauge are separated and the total weight determined = w1 g.
Aurora’s Technological & Research Institute Concrete and Highway Engineering Lab
Department of Civil Engineering 38
Similarly the weight of each fraction of aggregate passing and retaining on
specified sieves sizes are found, W1,W2W3… and the total weight sample
determined = W1+ W2 +W3 + … = Wg =. Also the weight of material from each
fraction retained on the specified gauge length are found = x1,x2,x3… and the total
weight retained determined = x1+x2+x3+…= X g..
The elongation index is the total weight of the material retained on the various
length gauges, expressed as a percentage of the total weight of the sample
gauged.
Elongation Index = (x1+x2+x3) 100 = 100 X percent
W1+ W2 +W3 + … W
Aurora’s Technological & Research Institute Concrete and Highway Engineering Lab
Department of Civil Engineering 39
HIGHWAY MATERIALS LAB - BITUMINOUS MATERIALS TESTING
EXPERIMENT 1
PENETRATION TEST
AIM: To find the grade of given bituminous material.
APPARATUS:
It consists of items like container, needle, water bath, penetrometer, stop watch
etc.
PROCEDURE:
The bitumen is softened to a pouring consistency between 750 and 1000 C above
the approximate temperature at which bitumen softens. The sample material is
thoroughly stirred to make it homogenous and free from air bubbles and water.
The sample material is then poured into the container to a depth at least 15 mm
more than the expected penetration. The sample containers are cooled in
atmosphere of temperature not lower than 130C for one hour. Then they are
placed in temperature controlled water bath at a temperature of 250 C for a period
of one hour.
The sample container is placed in the transfer tray with water from the water bath
and placed under the needle of the penetrometer. The weight of needle, shaft and
additional weight are checked. The total weight of this assembly should be 100g.
Using the adjusting screw, the needle assembly is lowered and the tip of the
needle is made to just touch the top surface of the sample; the needle assembly is
clamped in this position. The contact of the tip of the needle is checked using the
mirror placed on the rear of the needle. The initial reading of the penetrometer
dial is either adjusted to zero or the initial reading is taken before releasing the
needle. The needle is released exactly for a period of 5.0 sec by pressing the knob
and the final reading is taken on the dial. At lease three measurements are made
on this sample by testing at distance of not less than 100 mm apart. After each
test the needle is disengaged and cleaned with benzene and carefully dried. The
sample container is also transferred in the water bath before next testing is done
Aurora’s Technological & Research Institute Concrete and Highway Engineering Lab
Department of Civil Engineering 40
so as to maintain a constant temperature of 250 C. The test is repeated with
sample in the other containers.
Results
The difference between the initial and final penetration readings is taken as the
penetration value. The mean value of three penetration measurements is reported
as the penetration value. It is further specified by ISI that results of each
measurement should not vary from the mean value reported below by more than
the following:
Penetration grade Repeatability
0-80
80-225
Above 225
4 percent
5 percent
7 percent
Observations:
Sample Penetration Value
1
2
3
APPLICATIONS OF PENETRATION TEST:
Penetration test is the most commonly adopted test on bitumen to grade the
material in terms of its hardness. Depending up to the climatic condition and type
of construction, bitumen of different penetration grades are used, 80/10 bitumen
denotes that the penetration value ranges between 80 and 100. The penetration
values of various types of bitumen used in pavement construction in this country
range between 0 and 225. For bituminous macadam and penetration macadam
Indian Roads Congress suggests bitumen grades 30/40, 60/70 and 80/100. In
warmer regions lower penetration grades from preferred and in colder regions
bitumen with higher penetration values are used.
Aurora’s Technological & Research Institute Concrete and Highway Engineering Lab
Department of Civil Engineering 41
The penetration test is not intended to estimate the consistency of softer
materials like cutback or tar, which are usually graded by a viscosity test in an
orifice viscometer.
The India Standards Institution has classified paving bitumen available in this
country into the following six categories depending on the penetration values.
Grades designated 'A' (such as A 35) are from Assam Petroleum and those
designated 'S' (such as S 35) are from other sources.
Bitumen
grade
A 25 A 35 &
S 35
A 45 & S
45
A 65 & S
65
A 90 & S
90
A 200 & S
200
Penetratio
n
Value
20 to
30
30 to
40
40 to 50 60 to 70 80 to
100
175 to 225
Aurora’s Technological & Research Institute Concrete and Highway Engineering Lab
Department of Civil Engineering 42
EXPERIMENT 2
Ductility Test
AIM: To find the ductility value of the given bituminous material
APPARATUS:
The ductility test apparatus consists of items like sample (briquette) moulds,
water bath square-end trowel or putty knife sharpened on end and ductility
machine.
(a) Briquette mould: Mould is made of brass metal with shape and
dimensions as indicated. Both ends called clips posses circular holes to grip the
fixed and movable ends of the testing machine. Side pieces when placed together
form the briquette of the following dimensions:
Length : 75 mm
Distance between clips : 30 mm
Width at mouth of clips : 20 mm
Cross section at minimum width : 10 x 10 mm
(b) Ductility machine: It is equipment which functions as constant temperature
water bath and a pulling device at a precalibrated rate. The central rod of the
machine is threaded and through a gear system provides movement to one end
where the clip is fixed during initial placement. The other clip end is hooked at the
fixed end of the machine. Two clips are thus pulled apart horizontally at a uniform
speed of 50 2.5 mm per minute. The machine may have provision to fix two or
more mould so as to test these specimens simultaneously.
PROCEDURE:
The bitumen sample is melted to a temperature of 750 C to 1000 C above the
approximate softening point until it is fluid. It is strained through IS sieve 30,
poured in the mould assembly and placed on a brass plate, after a solution of
glycerin and dextrin is applied at all surfaces of the mould exposed to bitumen.
Aurora’s Technological & Research Institute Concrete and Highway Engineering Lab
Department of Civil Engineering 43
Thirty to forty minutes after the sample is poured into the moulds, the plate
assembly along with the sample is placed in water bath maintained at 270 C for 30
minutes. The sample and mould assembly is removed from water bath and leveling
the surface using hot knife cuts off excess bitumen material. After trimming the
specimen, the mould assembly-containing sample is replaced in water bath
maintained at 270 C for 85 to 90 minutes. The sides of the mould are now removed
and the clips are carefully booked on the machine without causing any initial
strain. Two or more specimens may be prepared in the moulds and clipped to the
machine so as to conduct these tests simultaneously.
The pointer is set to read zero. The machine is started and the two clips are thus
pulled apart horizontally. While the test is in operation, it is checked whether the
sample is immersed in water at depth of at least 10 mm. The distance at which the
bitumen thread of each specimen breaks, is recorded (in cm) to report as ductility
value.
RESULT
The distance stretched by the moving end of the specimen up to the point of
breaking of thread measured in centimeters is recorded as ductility value.
APPLICATIONS OF DUCTILITY TEST
A certain minimum ductility is necessary for a bitumen binder. This is because of
the temperature changes in the bituminous mixes and the repeated deformations
that occur in flexible, pavements due to the traffic loads. If the bitumen has low
ductility value, the bituminous pavement may crack, especially is cold weather.
The ductility values of bitumen vary from 5 to over 100. Several agencies have
specified the minimum ductility for various types of bituminous pavement. Often a
minimum ductility value of 50 cm is specified for bituminous construction.
The minimum ductility values specified by the Indian Standards Institutions for
various grades bitumen available in India are given below:
Aurora’s Technological & Research Institute Concrete and Highway Engineering Lab
Department of Civil Engineering 44
Sources of paving bitumen and
penetration grade
Minimum ductility value, cm
Assam Petroleum A 25
Assam Petroleum A 35
Assam Petroleum A 45
Assam Petroleum A 65, A 90 & A 200
Bituminous from sources other than
Assam Petroleum S 35
S 45, S 65 & S 90
5
10
12
15
50
75
Aurora’s Technological & Research Institute Concrete and Highway Engineering Lab
Department of Civil Engineering 45
EXPERIMENT 3
SOFTENING POINT TEST
AIM: To find the softening point of the given Bituminous material
APPARATUS
It consists of Ring and Ball apparatus
(a) Steel Balls: They are two in number. Each has a diameter of 9.5 mm and weight
2.5 .05 g.
(b) Brass Rings: There are two rings of the following dimensions ,
Depth 6.4 mm Inside diameter at top 17.5 mm
Inside diameter at bottom 15.9 mm Outside diameter 20.6 mm
Brass rings are also placed with ball guides as shown in Fig. 19.2
(c) Support: The metallic support is used for placing pair of rings.
The upper surface of the rings is adjusted to be 50 mm below the surface of water
or liquid contained in the bath. A distance of 25 mm between the bottom of the
rings and top surface of the bottom plate of supported is provided. It has a housing
for a suitable thermometer.
(d) Bath and stirrer: A heat resistant glass container of 85 mm diameter and 120
mm depth is used. Bath liquid is water for material having softening point
below 800 C and glycerin for materials having softening point above 800 C.
Mechanical stirrer is used for ensuring uniform heat distribution at all times
throughout the bath.
Aurora’s Technological & Research Institute Concrete and Highway Engineering Lab
Department of Civil Engineering 46
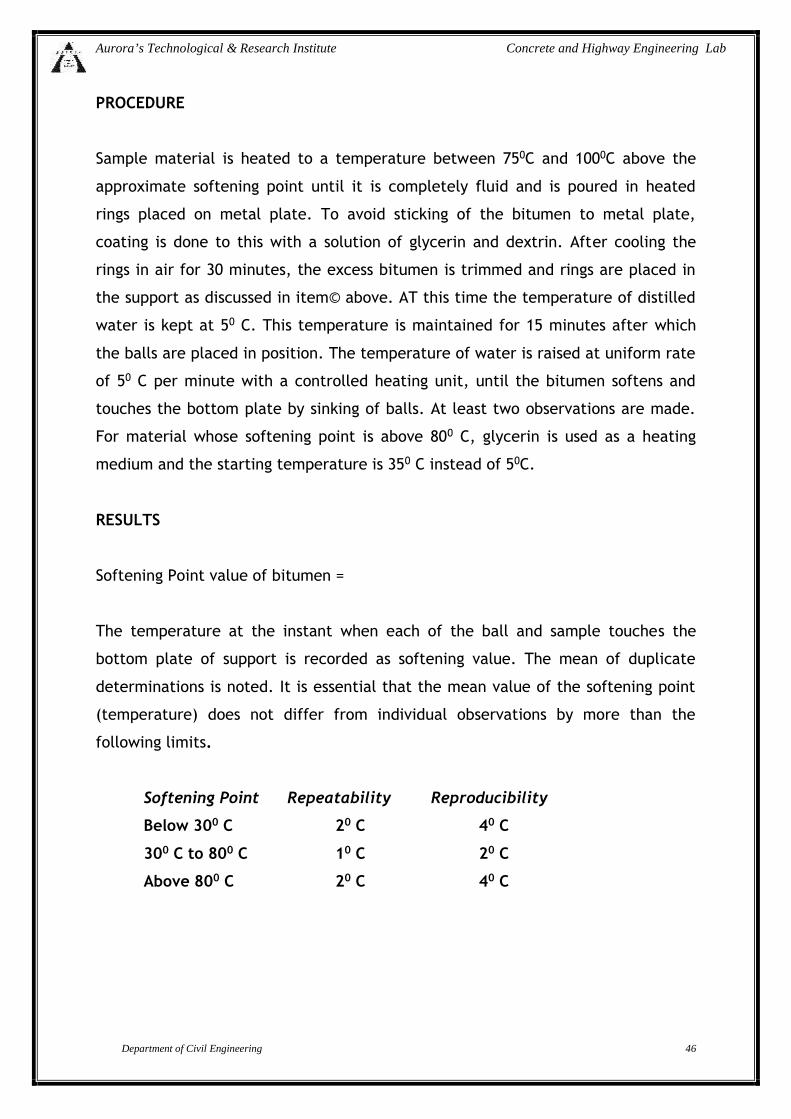
PROCEDURE
Sample material is heated to a temperature between 750C and 1000C above the
approximate softening point until it is completely fluid and is poured in heated
rings placed on metal plate. To avoid sticking of the bitumen to metal plate,
coating is done to this with a solution of glycerin and dextrin. After cooling the
rings in air for 30 minutes, the excess bitumen is trimmed and rings are placed in
the support as discussed in item© above. AT this time the temperature of distilled
water is kept at 50 C. This temperature is maintained for 15 minutes after which
the balls are placed in position. The temperature of water is raised at uniform rate
of 50 C per minute with a controlled heating unit, until the bitumen softens and
touches the bottom plate by sinking of balls. At least two observations are made.
For material whose softening point is above 800 C, glycerin is used as a heating
medium and the starting temperature is 350 C instead of 50C.
RESULTS
Softening Point value of bitumen =
The temperature at the instant when each of the ball and sample touches the
bottom plate of support is recorded as softening value. The mean of duplicate
determinations is noted. It is essential that the mean value of the softening point
(temperature) does not differ from individual observations by more than the
following limits.
Softening Point Repeatability Reproducibility
Below 300 C 20 C 40 C
300 C to 800 C 10 C 20 C
Above 800 C 20 C 40 C
Aurora’s Technological & Research Institute Concrete and Highway Engineering Lab
Department of Civil Engineering 47
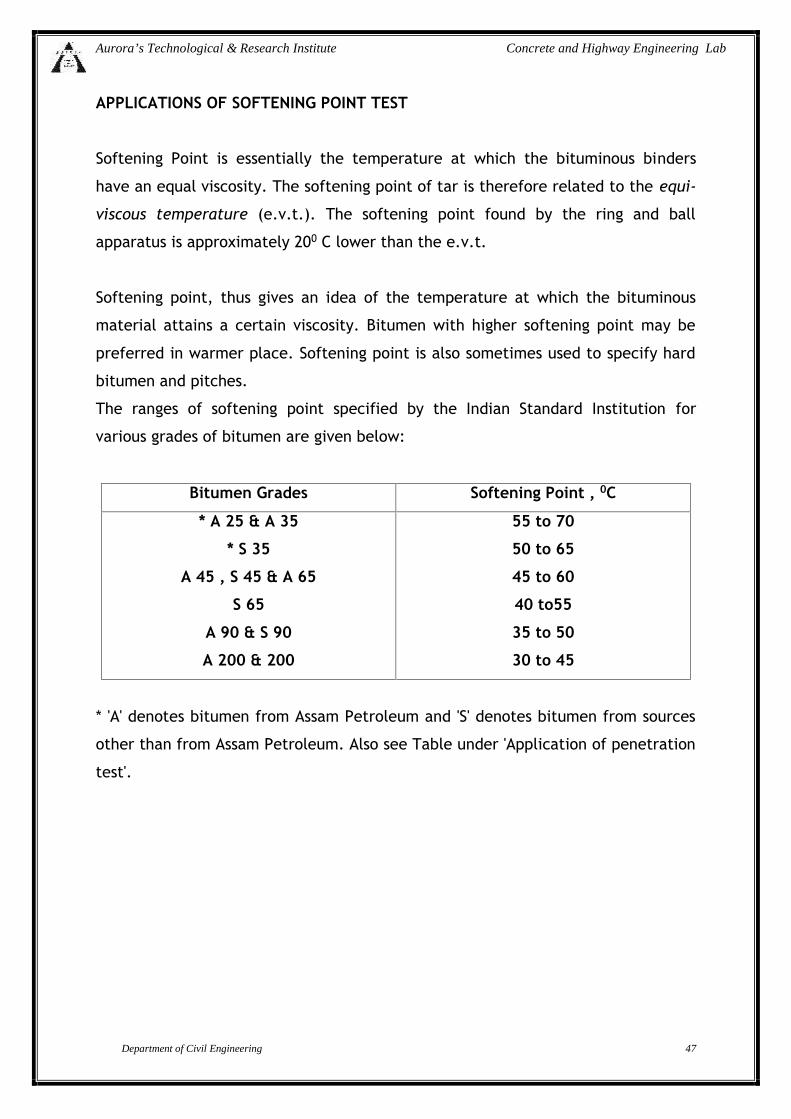
APPLICATIONS OF SOFTENING POINT TEST
Softening Point is essentially the temperature at which the bituminous binders
have an equal viscosity. The softening point of tar is therefore related to the equi-
viscous temperature (e.v.t.). The softening point found by the ring and ball
apparatus is approximately 200 C lower than the e.v.t.
Softening point, thus gives an idea of the temperature at which the bituminous
material attains a certain viscosity. Bitumen with higher softening point may be
preferred in warmer place. Softening point is also sometimes used to specify hard
bitumen and pitches.
The ranges of softening point specified by the Indian Standard Institution for
various grades of bitumen are given below:
Bitumen Grades Softening Point , 0C
* A 25 & A 35
* S 35
A 45 , S 45 & A 65
S 65
A 90 & S 90
A 200 & 200
55 to 70
50 to 65
45 to 60
40 to55
35 to 50
30 to 45
* 'A' denotes bitumen from Assam Petroleum and 'S' denotes bitumen from sources
other than from Assam Petroleum. Also see Table under 'Application of penetration
test'.
Aurora’s Technological & Research Institute Concrete and Highway Engineering Lab
Department of Civil Engineering 48
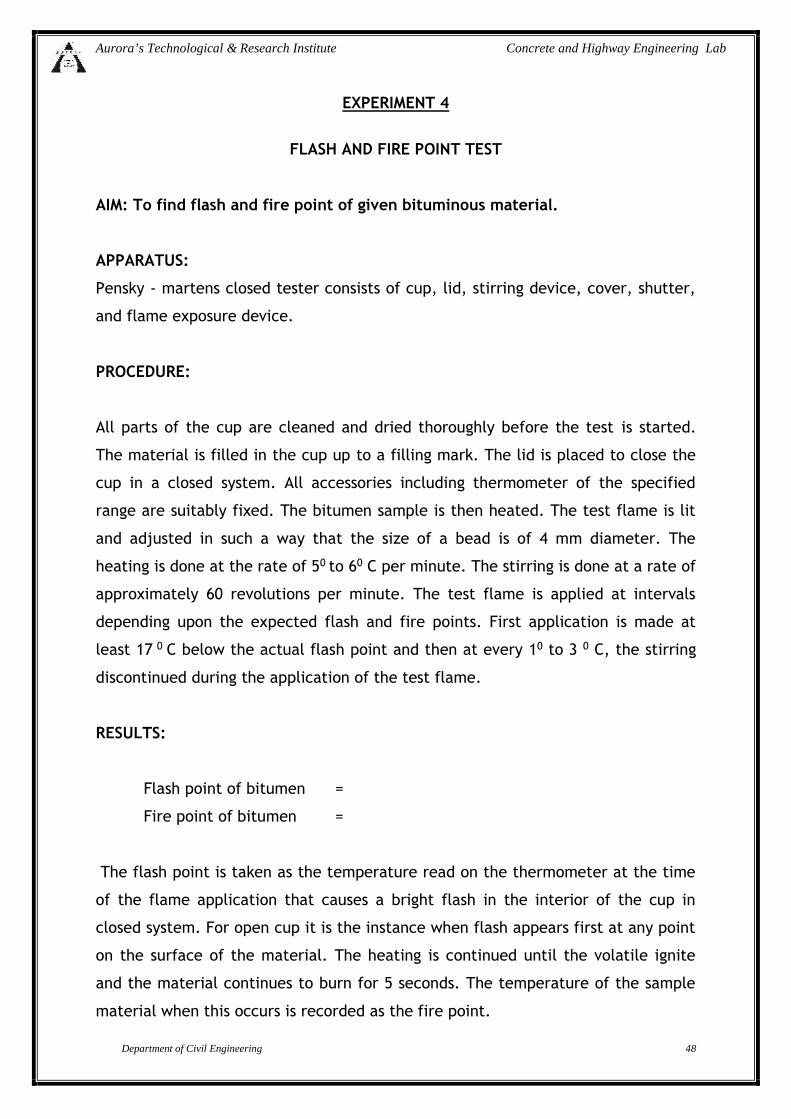
EXPERIMENT 4
FLASH AND FIRE POINT TEST
AIM: To find flash and fire point of given bituminous material.
APPARATUS:
Pensky - martens closed tester consists of cup, lid, stirring device, cover, shutter,
and flame exposure device.
PROCEDURE:
All parts of the cup are cleaned and dried thoroughly before the test is started.
The material is filled in the cup up to a filling mark. The lid is placed to close the
cup in a closed system. All accessories including thermometer of the specified
range are suitably fixed. The bitumen sample is then heated. The test flame is lit
and adjusted in such a way that the size of a bead is of 4 mm diameter. The
heating is done at the rate of 50 to 60 C per minute. The stirring is done at a rate of
approximately 60 revolutions per minute. The test flame is applied at intervals
depending upon the expected flash and fire points. First application is made at
least 17 0 C below the actual flash point and then at every 10 to 3 0 C, the stirring
discontinued during the application of the test flame.
RESULTS:
Flash point of bitumen =
Fire point of bitumen =
The flash point is taken as the temperature read on the thermometer at the time
of the flame application that causes a bright flash in the interior of the cup in
closed system. For open cup it is the instance when flash appears first at any point
on the surface of the material. The heating is continued until the volatile ignite
and the material continues to burn for 5 seconds. The temperature of the sample
material when this occurs is recorded as the fire point.
Aurora’s Technological & Research Institute Concrete and Highway Engineering Lab
Department of Civil Engineering 49
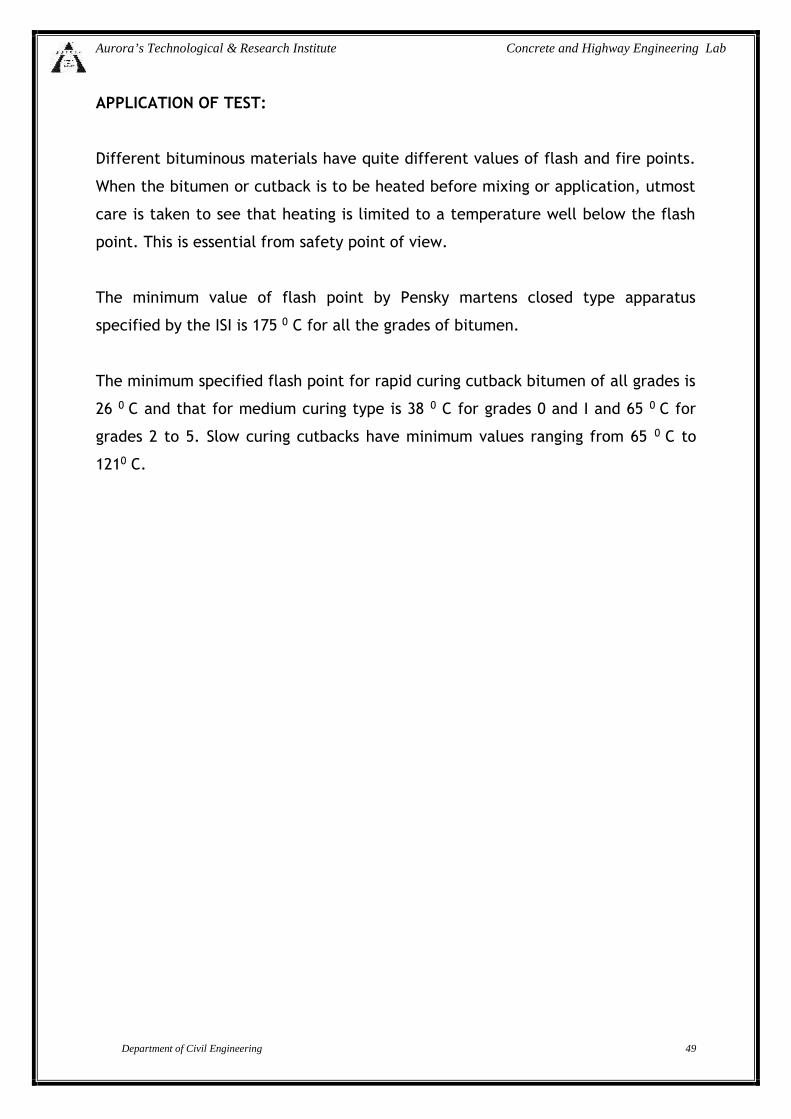
APPLICATION OF TEST:
Different bituminous materials have quite different values of flash and fire points.
When the bitumen or cutback is to be heated before mixing or application, utmost
care is taken to see that heating is limited to a temperature well below the flash
point. This is essential from safety point of view.
The minimum value of flash point by Pensky martens closed type apparatus
specified by the ISI is 175 0 C for all the grades of bitumen.
The minimum specified flash point for rapid curing cutback bitumen of all grades is
26 0 C and that for medium curing type is 38 0 C for grades 0 and I and 65 0 C for
grades 2 to 5. Slow curing cutbacks have minimum values ranging from 65 0 C to
1210 C.


![A. 16 BIT ADDITION - Aurora3/2 ECE- Microprocessors Lab Manual Aurora’s Engineering College 3 20 0013 89 54 02 mov [si+2],dx 21 22 0016 CC int 3 23 24 0017 code endsaurora.ac.in/.../service/mpi-3cse/mpi-lab-manuaL-cse.pdf ·](https://img.pdfslide.net/doc/110x75/5ac9e8267f8b9a7d548d8202/a-16-bit-addition-aurora32-ece-microprocessors-lab-manual-auroras-engineering.jpg)