Embed Size (px)
Citation preview
CT4471 Drinking water I
Dr.ir. S.G.J. Heijmannanofiltration and reverse osmosis
Nan
ofilt
ratio
n an
d re
vers
e os
mos
is
1. Introduction2. Theory3. Membrane modules4. Applications5. Design 6. Fouling control
Contents
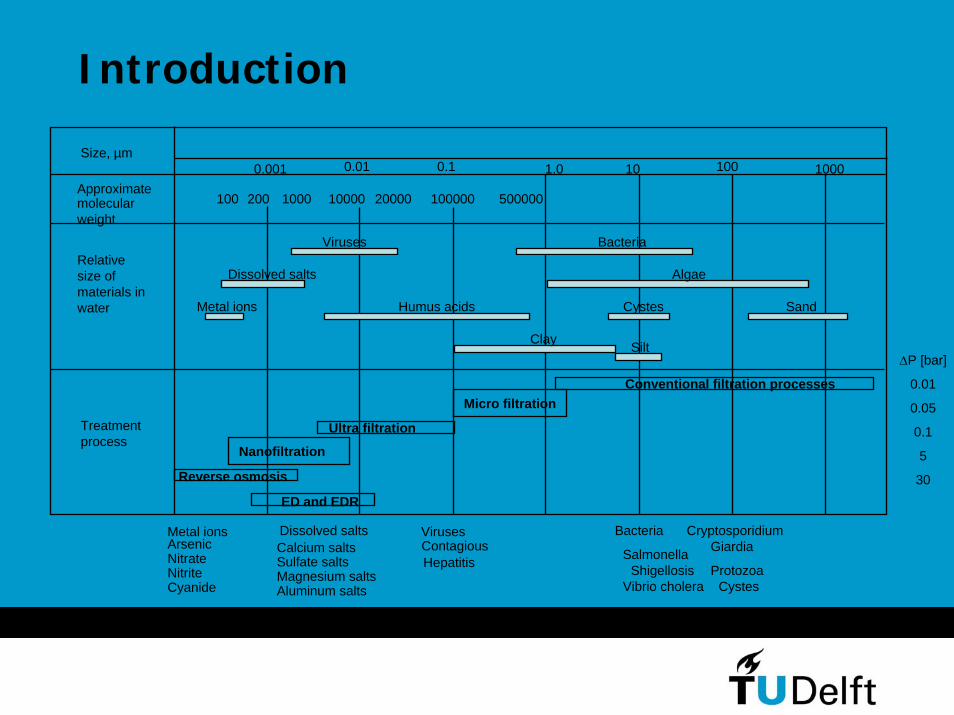
Approximatemolecularweight
Relativesize of materials in water
Treatmentprocess
Size, µm0.001 0.01 0.1 1.0 10 100 1000
100 200 1000 10000 20000 100000 500000
Viruses Bacteria
Dissolved salts Algae
Metal ions Humus acids Cystes Sand
Clay
ED and EDR
Reverse osmosis
Nanofiltration
Ultra filtration
Micro filtrationConventional filtration processes
Metal ionsArsenicNitrateNitriteCyanide
Dissolved saltsCalcium saltsSulfate saltsMagnesium saltsAluminum salts
VirusesContagiousHepatitis
Bacteria
SalmonellaShigellosis
Vibrio cholera CystesProtozoa
GiardiaCryptosporidium
SiltΔP [bar]
0.01
0.05
0.1
5
30
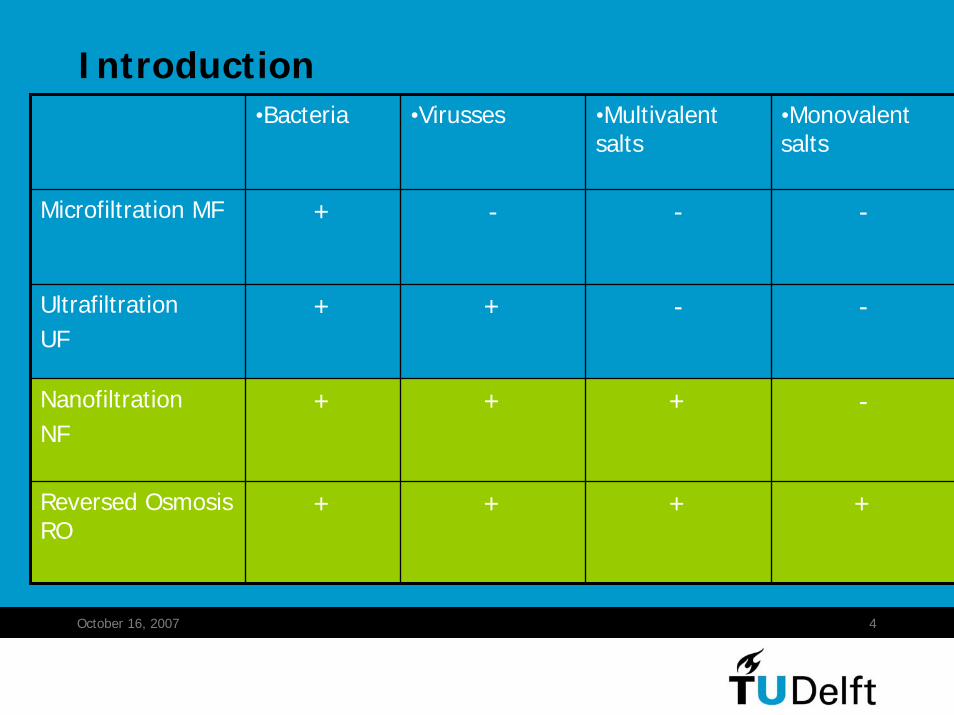
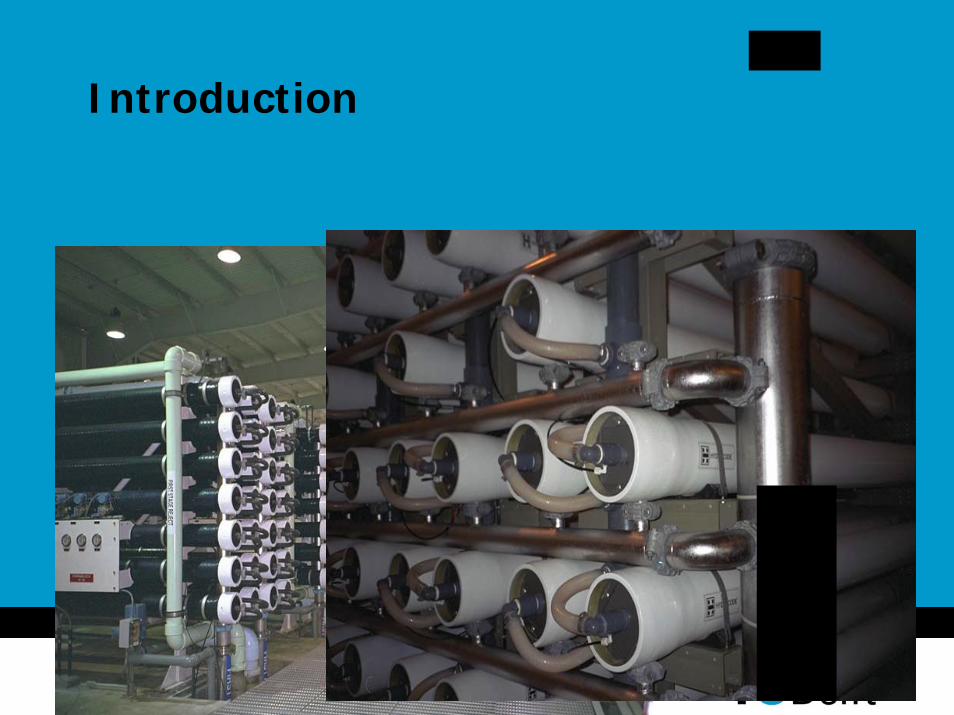
Introduction
October 16, 2007 4
Introduction
+
+
+
-
•Virusses
+
+
-
-
•Multivalentsalts
++Reversed OsmosisRO
-+NanofiltrationNF
-+UltrafiltrationUF
-+Microfiltration MF
•Monovalentsalts
•Bacteria
Introduction
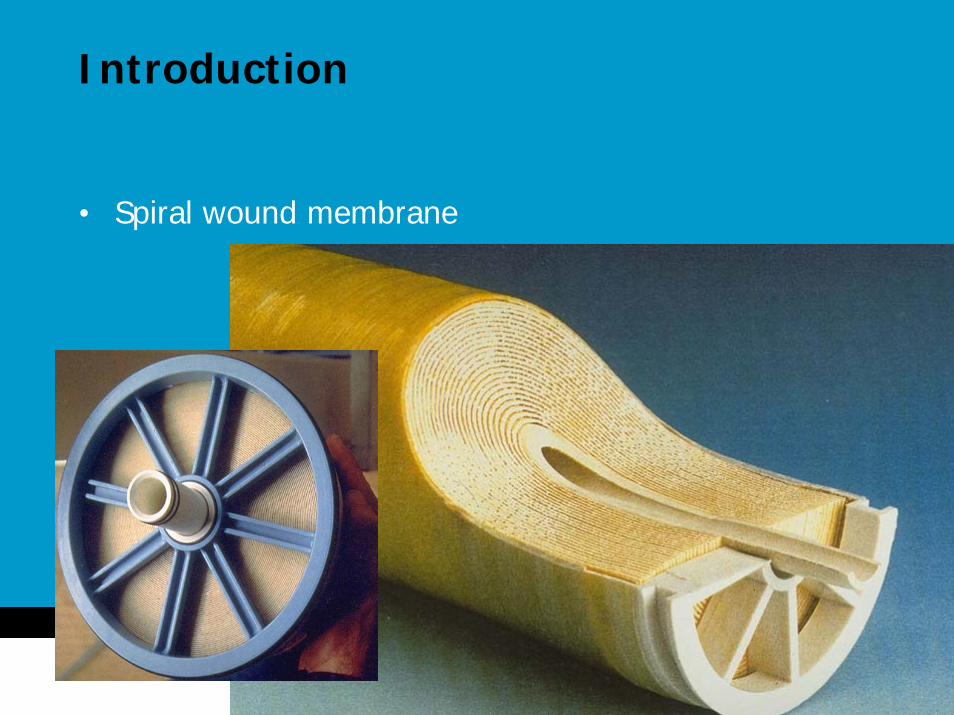
• Spiral wound membrane
Introduction
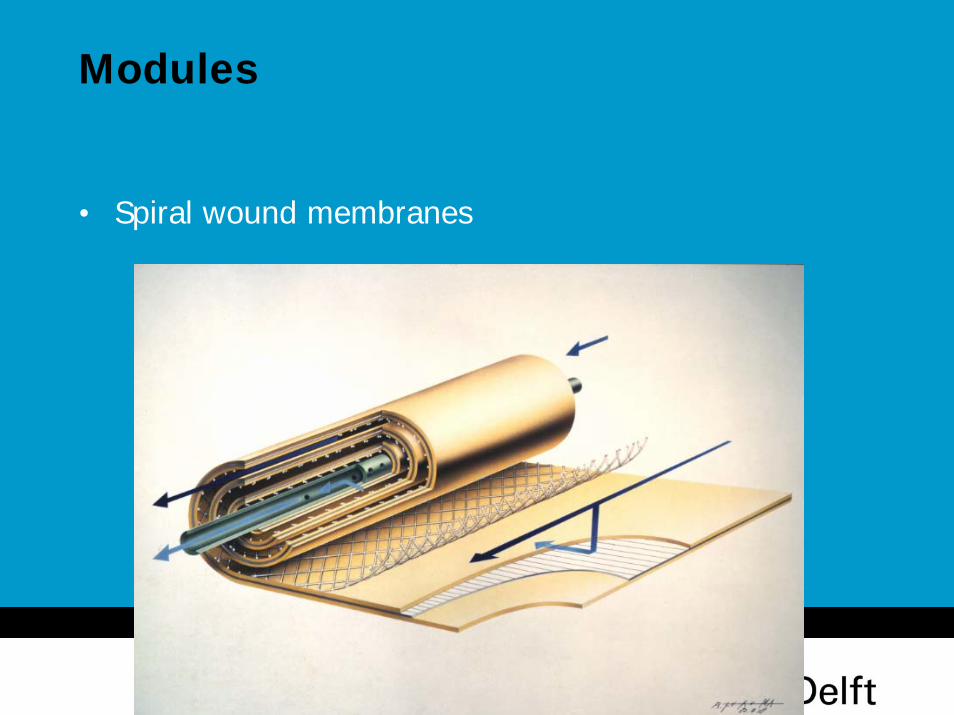
• Spiral wound membranes
Modules
October 16, 2007 8
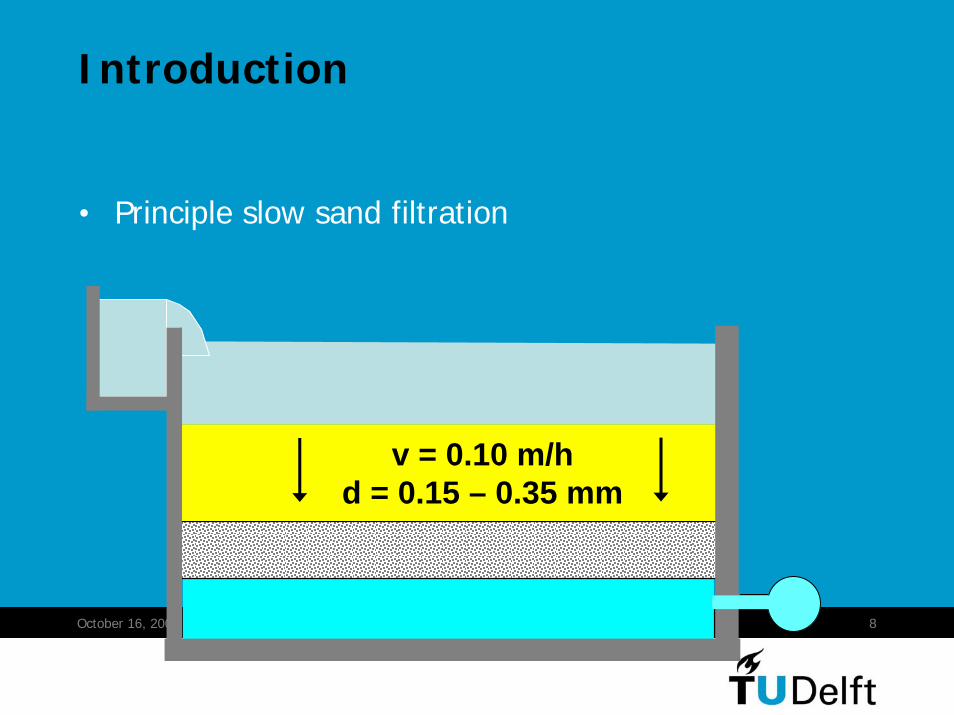
v = 0.10 m/hd = 0.15 – 0.35 mm
Introduction
• Principle slow sand filtration
October 16, 2007 9
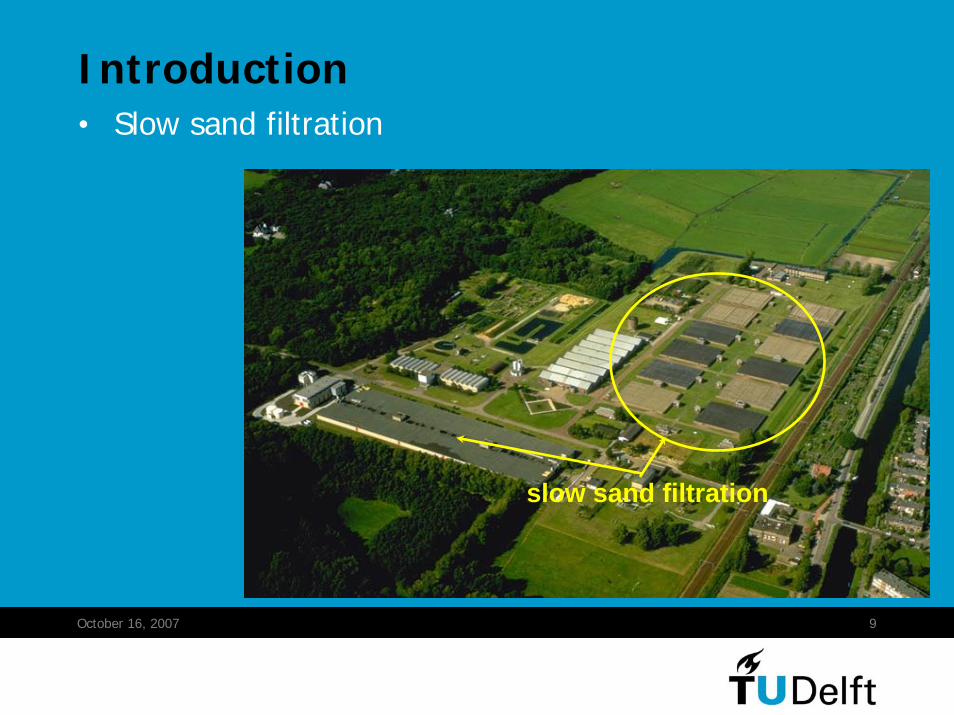
slow sand filtration
• Slow sand filtration
Introduction
October 16, 2007 10
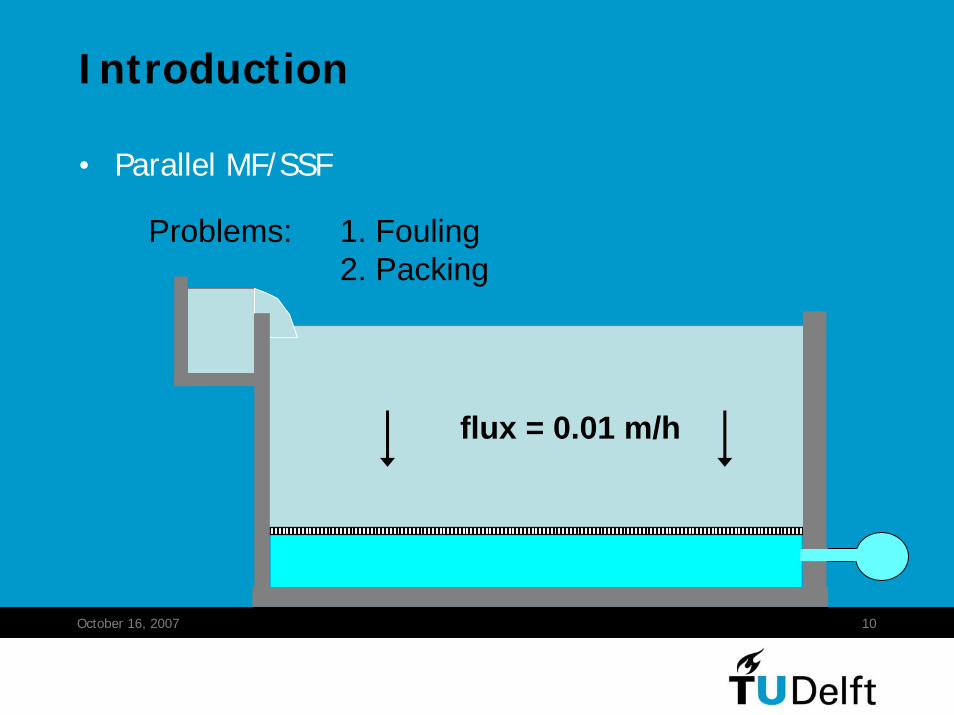
• Parallel MF/SSF
Problems: 1. Fouling2. Packing
flux = 0.01 m/h
Introduction
October 16, 2007 11
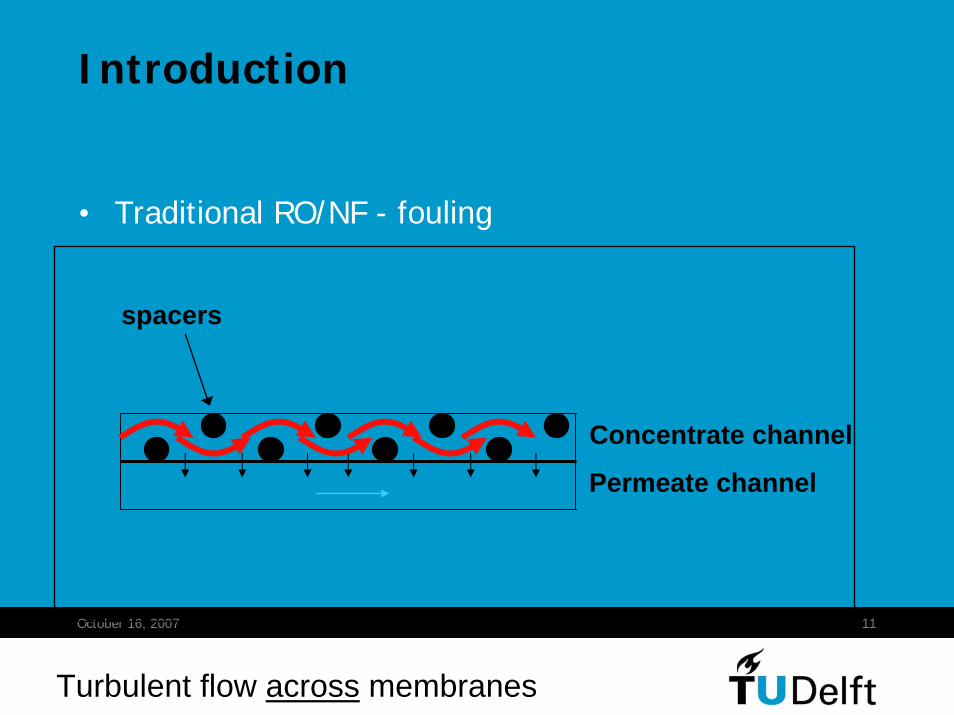
• Traditional RO/NF - fouling
Turbulent flow across membranes
spacers
Concentrate channel
Permeate channel
Introduction
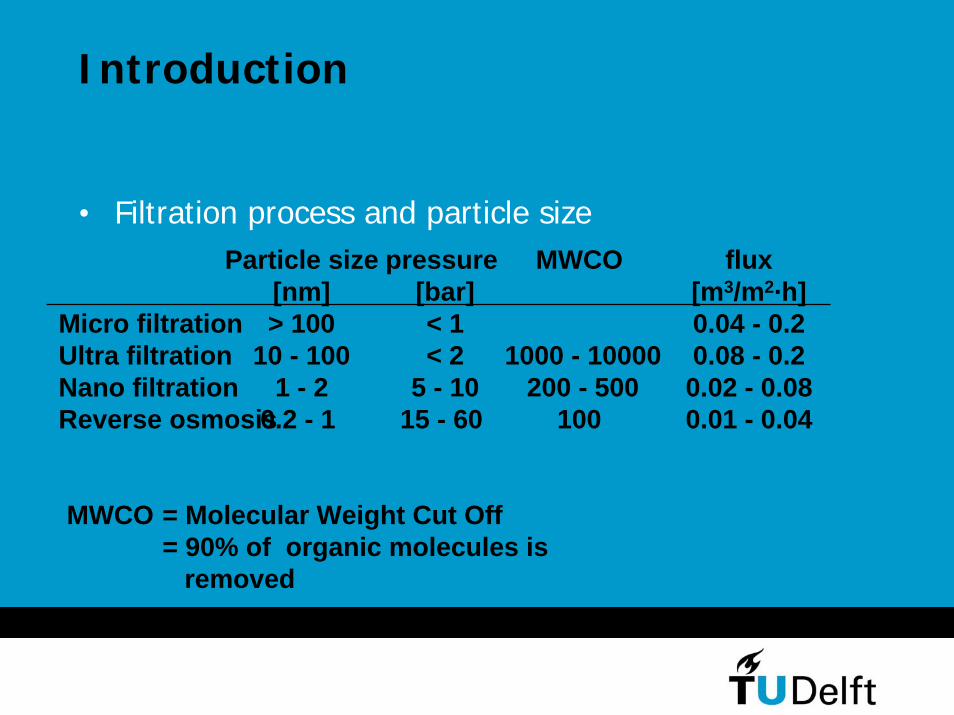
• Filtration process and particle size
Micro filtrationUltra filtrationNano filtrationReverse osmosis
Particle size[nm]> 100
10 - 1001 - 2
0.2 - 1
pressure [bar]< 1< 2
5 - 1015 - 60
MWCO
1000 - 10000200 - 500
100
MWCO = Molecular Weight Cut Off = 90% of organic molecules is
removed
flux[m3/m2·h]0.04 - 0.20.08 - 0.20.02 - 0.080.01 - 0.04
Introduction
1. Introduction2. Theory3. Membrane modules4. Applications5. Design 6. Fouling control
Contents
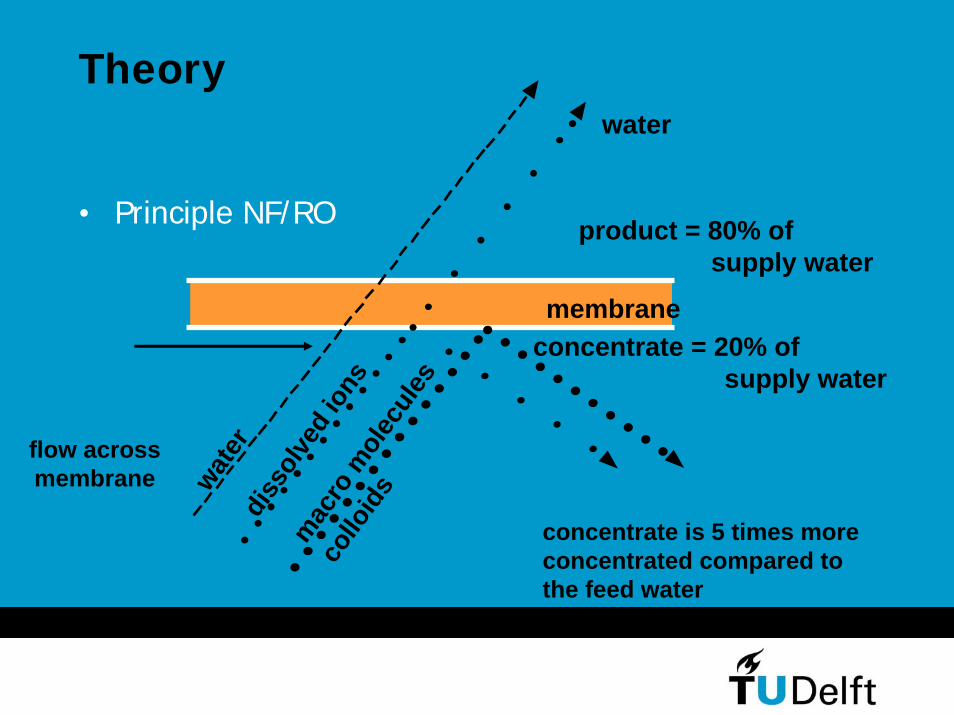
• Principle NF/RO
flow acrossmembrane wat
erdi
ssol
ved
ions
mac
ro m
olec
ules
collo
ids
product = 80% of supply water
membraneconcentrate = 20% of
supply water
water
concentrate is 5 times more concentrated compared to the feed water
Theory
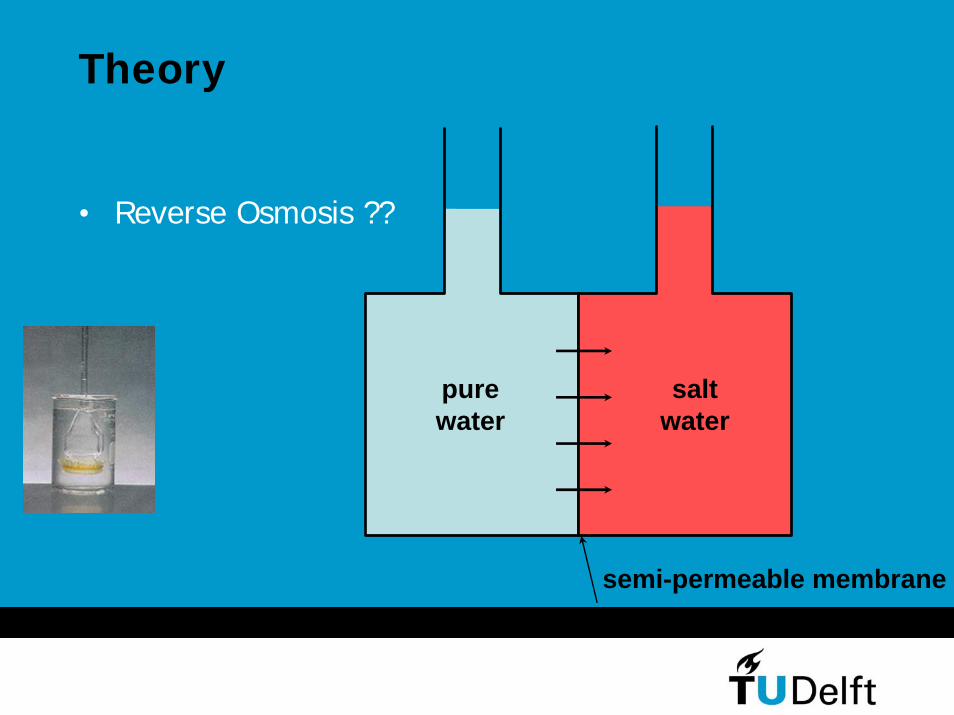
• Reverse Osmosis ??
purewater
saltwater
semi-permeable membrane
Theory
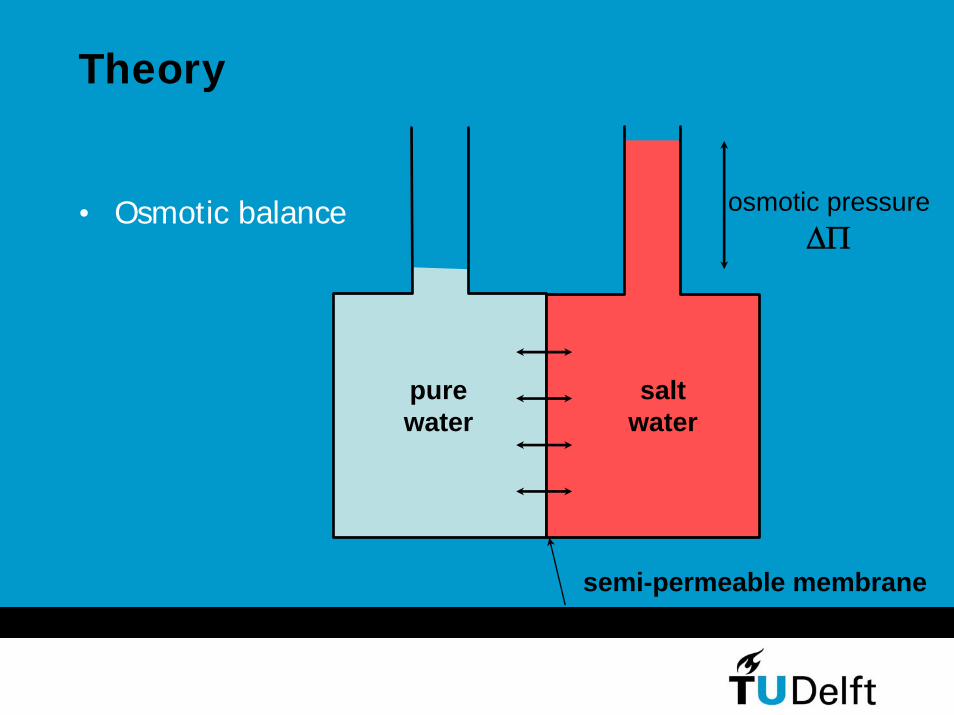
• Osmotic balance
purewater
saltwater
semi-permeable membrane
osmotic pressureΔΠ
Theory
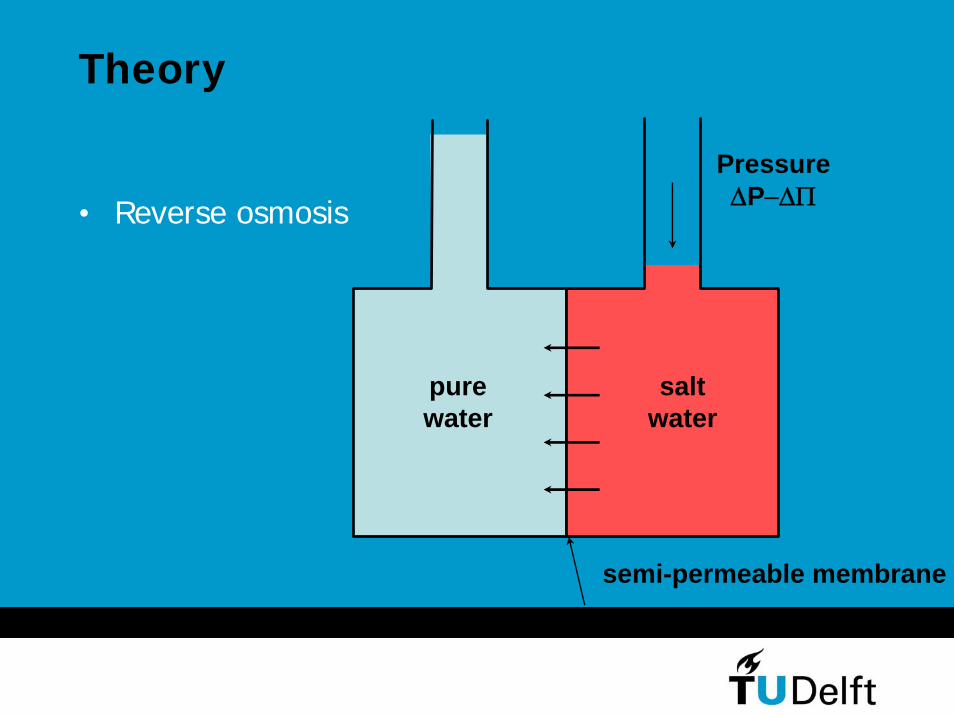
• Reverse osmosis
purewater
saltwater
semi-permeable membrane
PressureΔP−ΔΠ
Theory
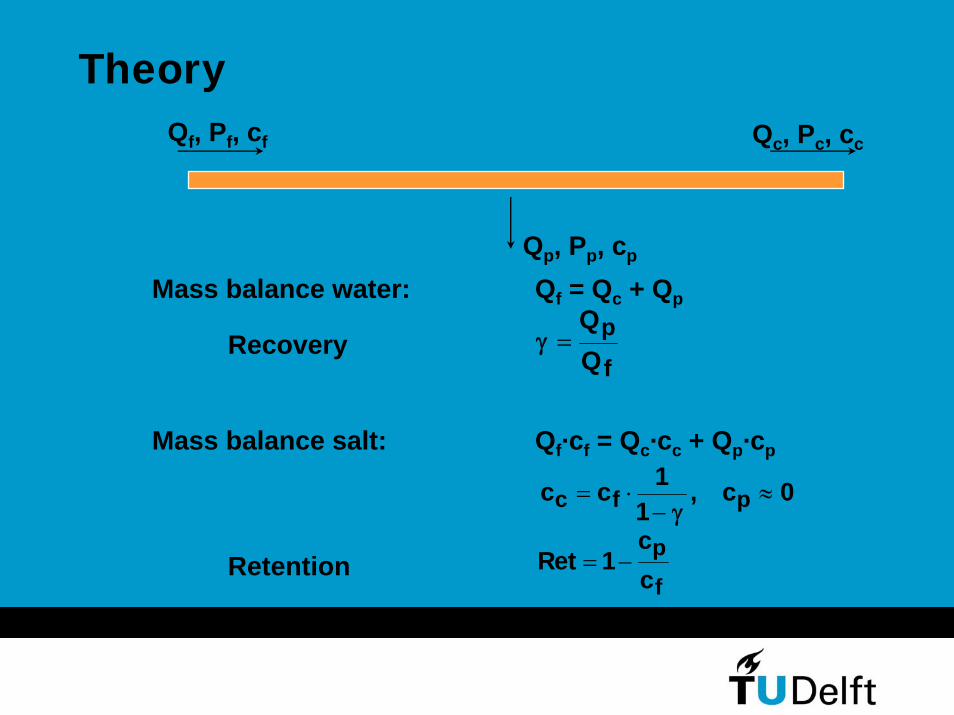
Qf, Pf, cf
Qp, Pp, cp
Qc, Pc, cc
Mass balance water: Qf = Qc + Qp
Recovery γ =QQ
p
f
Mass balance salt: Qf·cf = Qc·cc + Qp·cp
c c 11
, c 0c f p= ⋅−
≈γ
Ret 1ccp
f= −Retention
Theory
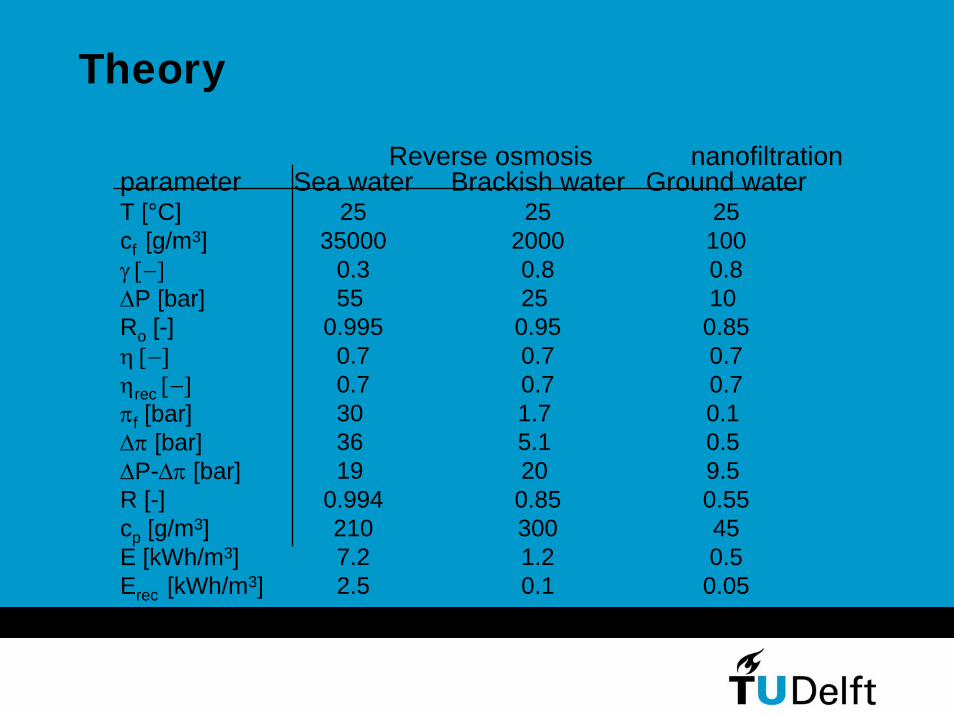
Sea water25
350000.355
0.9950.70.730 36 19
0.9942107.22.5
parameterT [°C]cf [g/m3]γ [−]ΔP [bar]Ro [-]η [−]ηrec [−]πf [bar]Δπ [bar]ΔP-Δπ [bar]R [-]cp [g/m3]E [kWh/m3]Erec [kWh/m3]
Brackish water25
20000.825 0.950.70.71.7 5.1 20 0.853001.20.1
Ground water251000.810 0.850.70.70.1 0.5 9.5 0.55450.50.05
Reverse osmosis nanofiltration
Theory
October 16, 2007 20
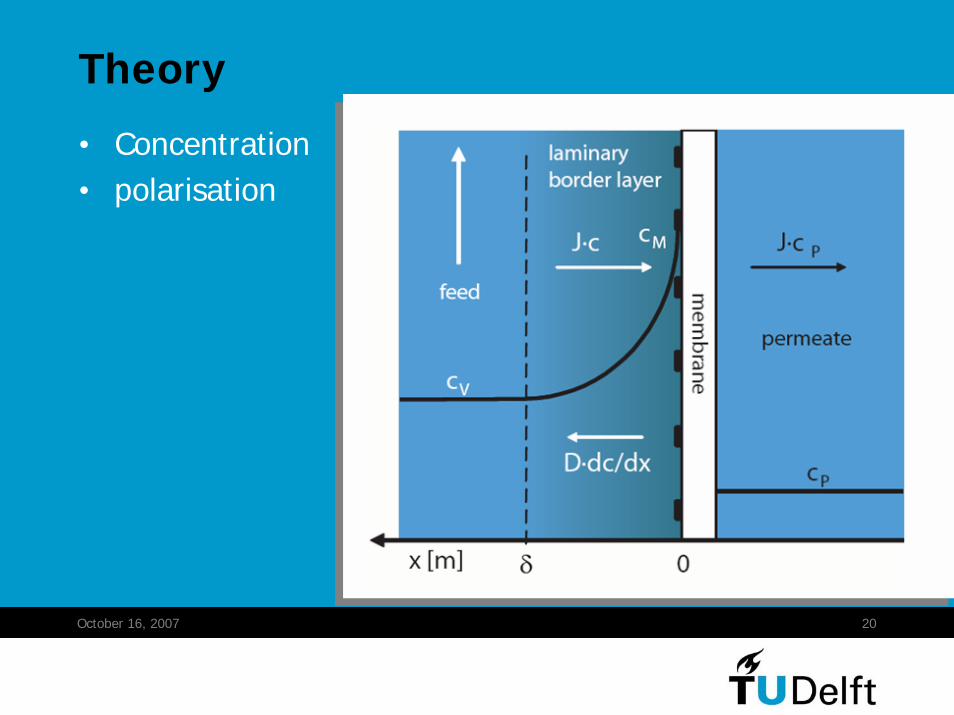
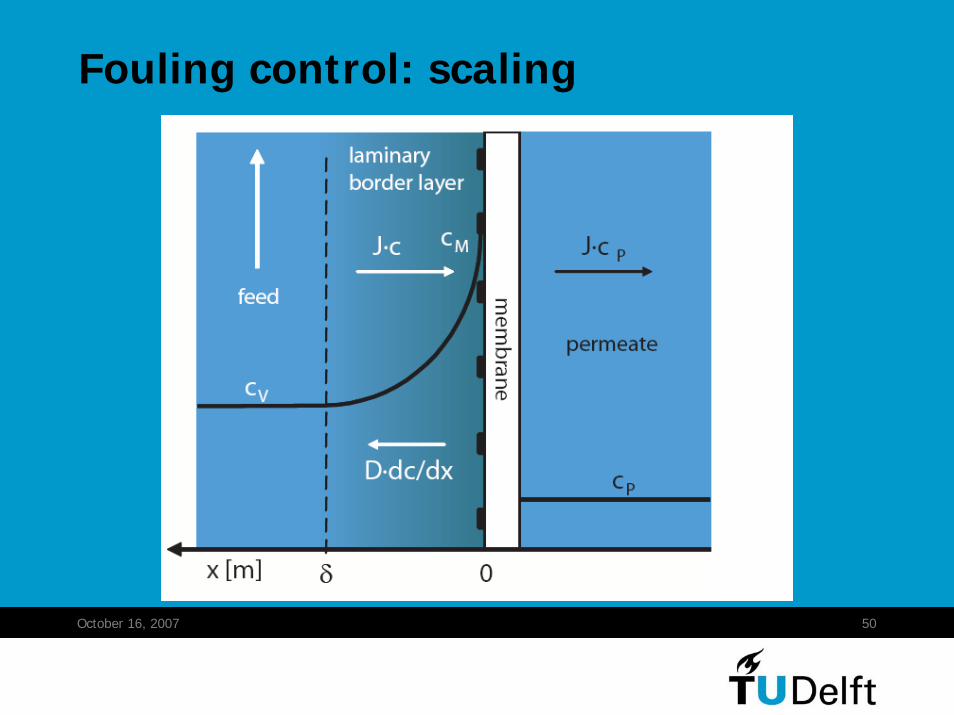
Theory
• Concentration• polarisation
1. Introduction2. Theory3. Membrane modules4. Applications5. Design 6. Fouling control
Contents
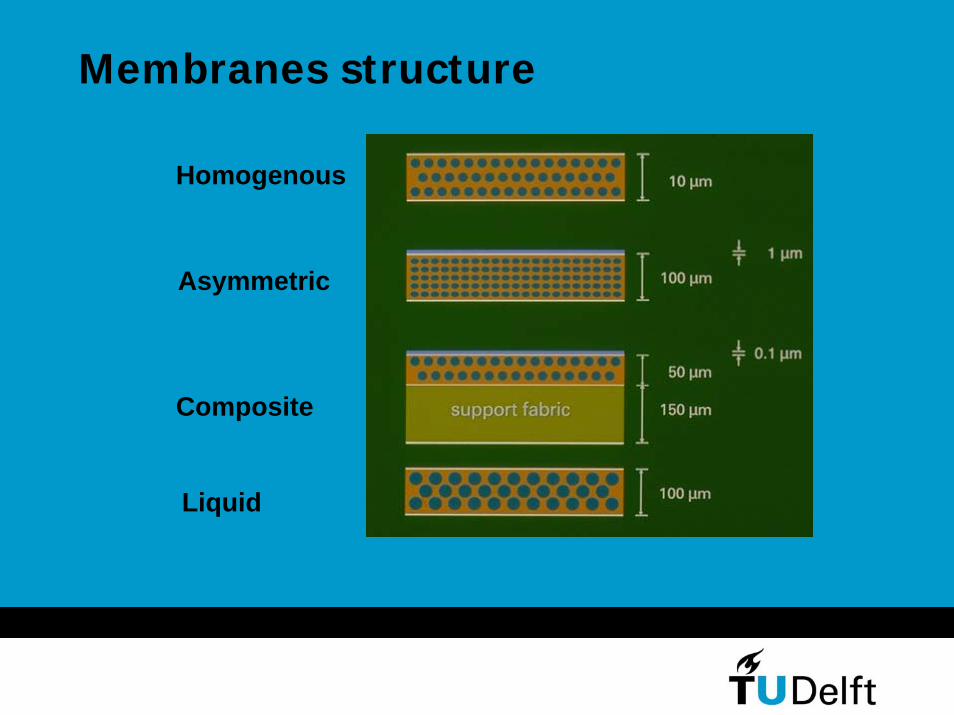
Homogenous
Asymmetric
Composite
Liquid
Membranes structure
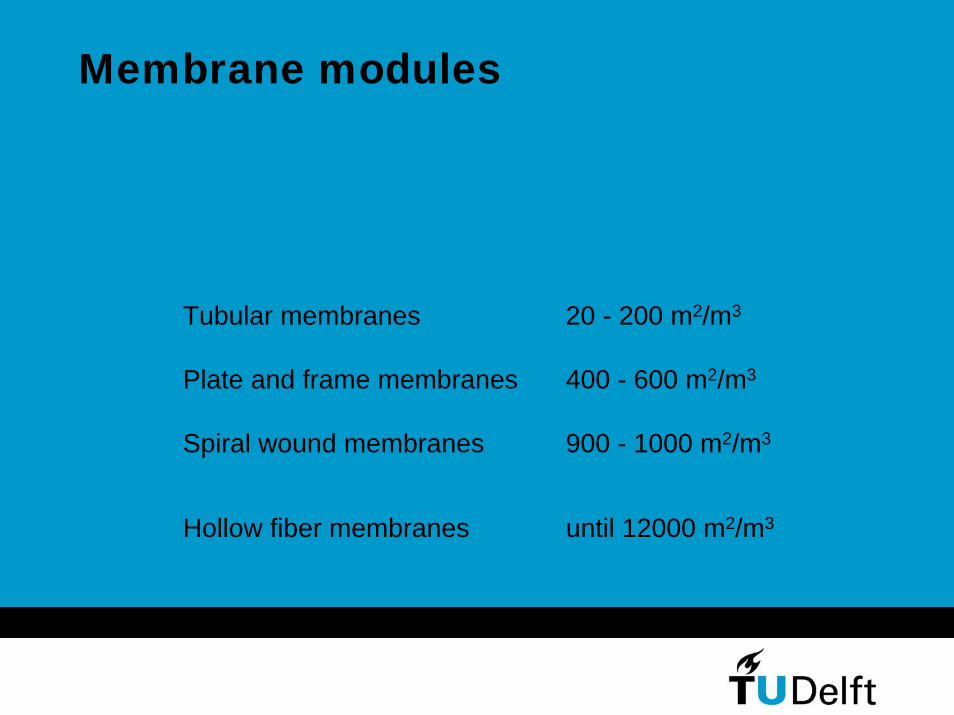
Tubular membranes 20 - 200 m2/m3
Plate and frame membranes 400 - 600 m2/m3
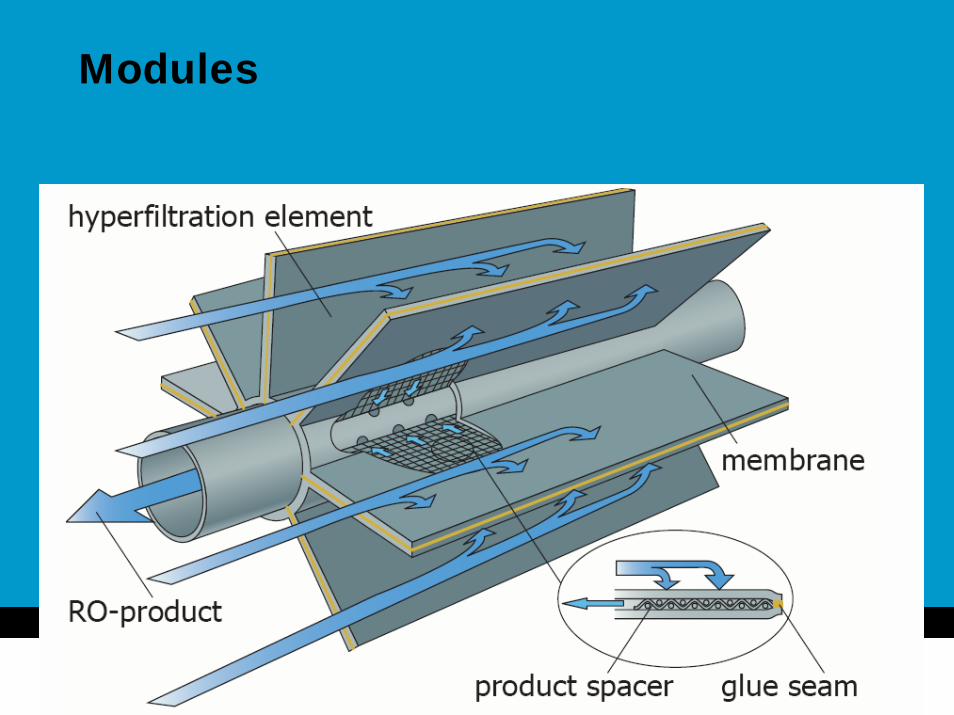
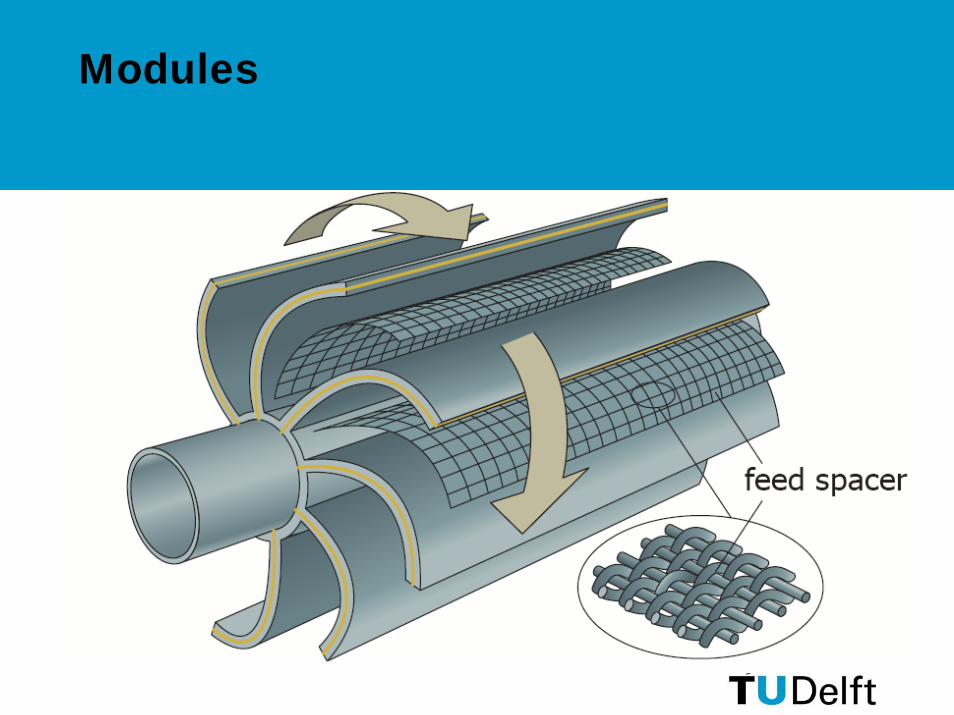
Spiral wound membranes 900 - 1000 m2/m3
Hollow fiber membranes until 12000 m2/m3
Membrane modules
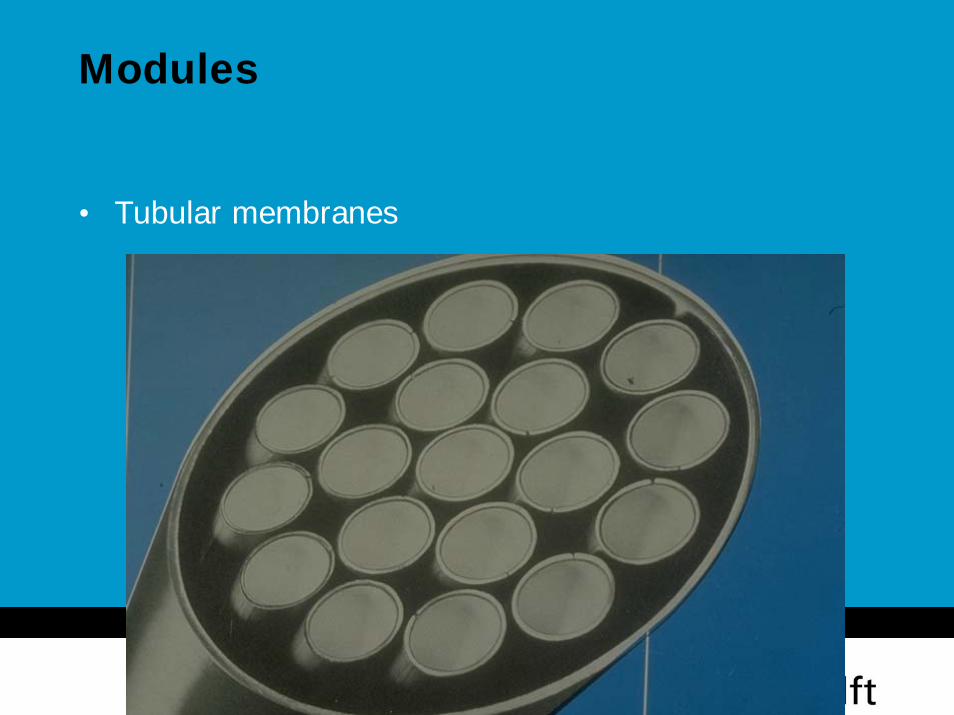
• Tubular membranes
Modules
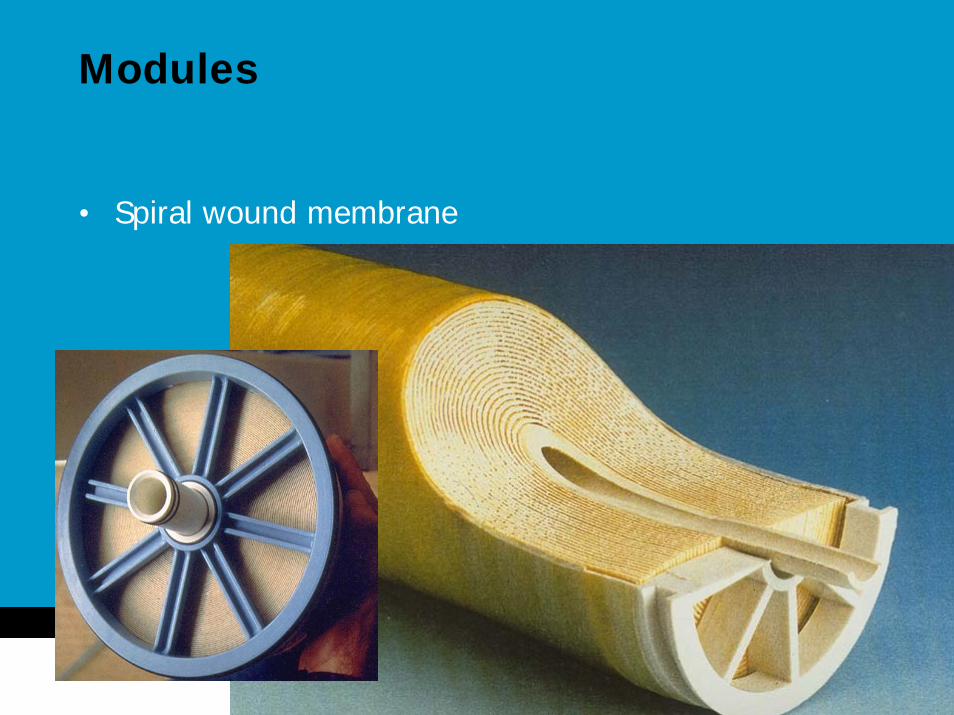
• Spiral wound membrane
Modules
• Hollow fiber membranes
Modules
October 16, 2007 27
Modules
1. Introduction2. Theory3. Membrane modules4. Applications5. Design 6. Fouling control
Contents
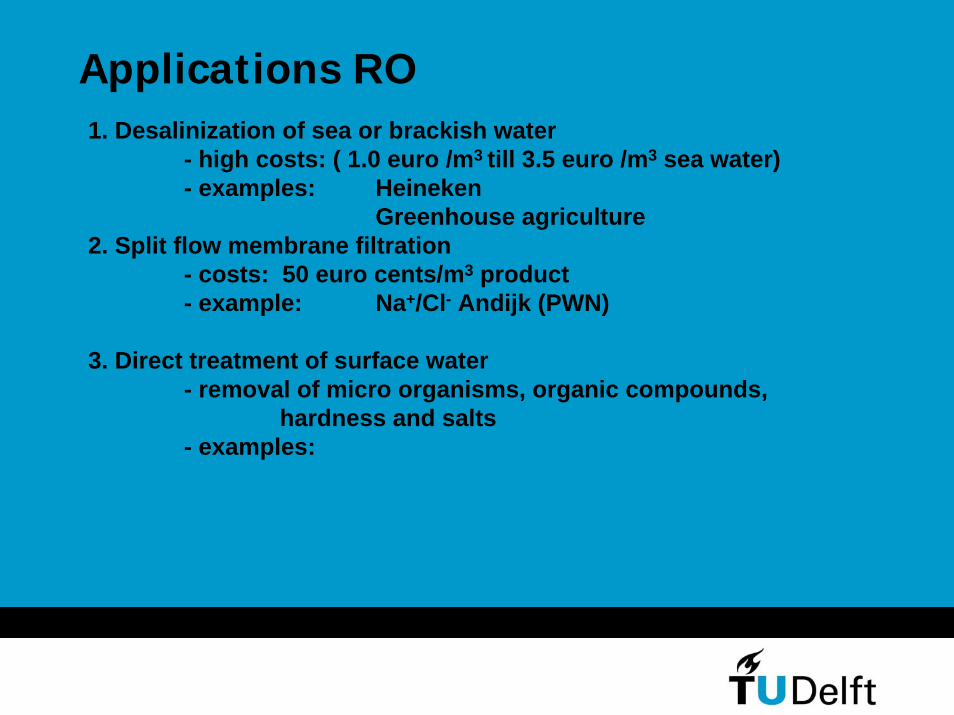
1. Desalinization of sea or brackish water- high costs: ( 1.0 euro /m3 till 3.5 euro /m3 sea water)- examples: Heineken
Greenhouse agriculture2. Split flow membrane filtration
- costs: 50 euro cents/m3 product- example: Na+/Cl- Andijk (PWN)
3. Direct treatment of surface water- removal of micro organisms, organic compounds,
hardness and salts- examples:
Applications RO
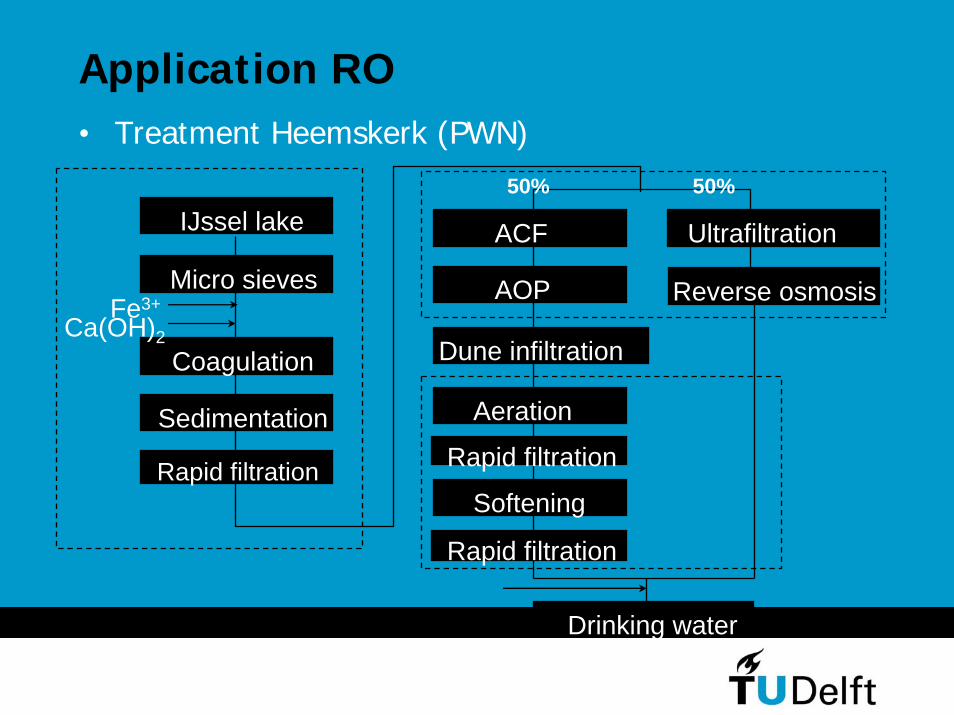
IJssel lake
Coagulation
Sedimentation
Rapid filtration
Micro sievesFe3+
Ca(OH)2 Dune infiltration
Drinking water
Rapid filtration
Softening
Aeration
Rapid filtration
ACF
AOP
Ultrafiltration
Reverse osmosis
50%50%
Application RO• Treatment Heemskerk (PWN)
October 16, 2007 31
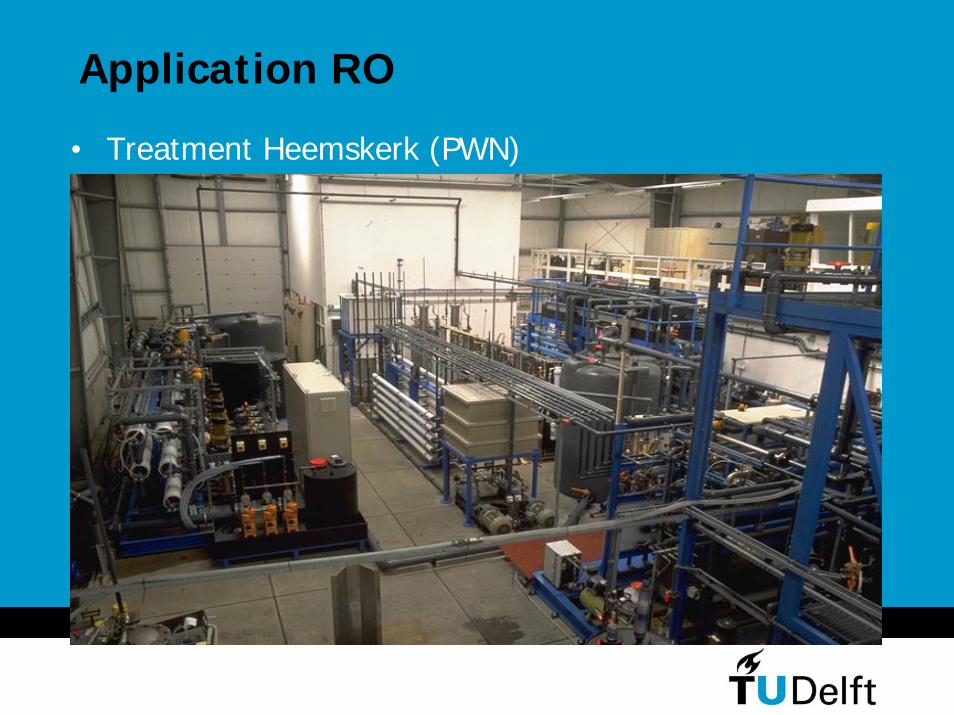
Application RO
• Treatment Heemskerk (PWN)
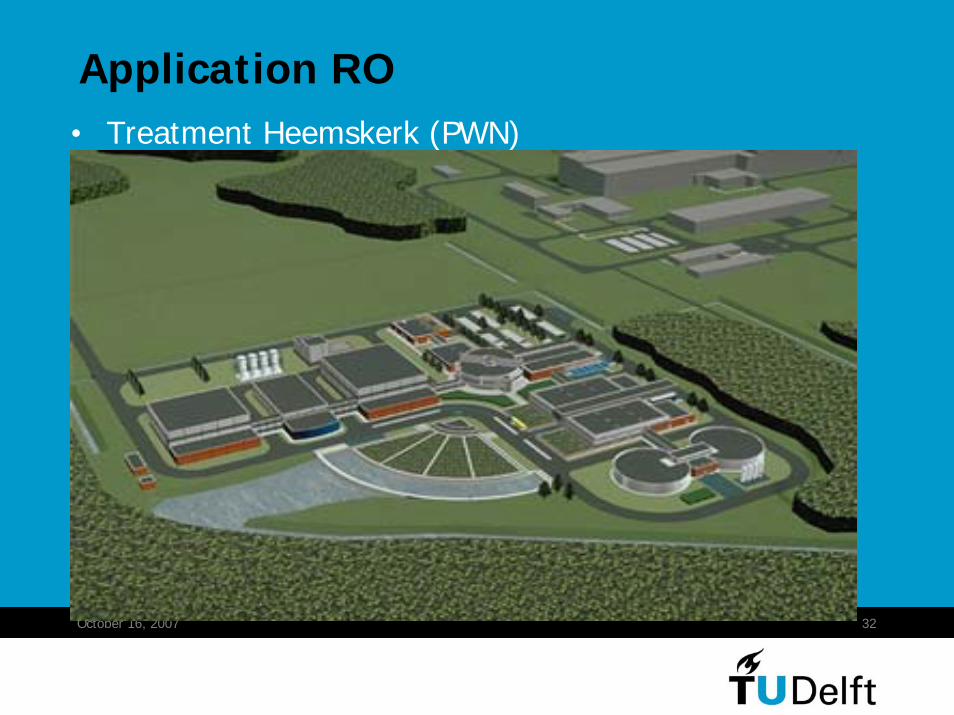
October 16, 2007 32
Application RO• Treatment Heemskerk (PWN)
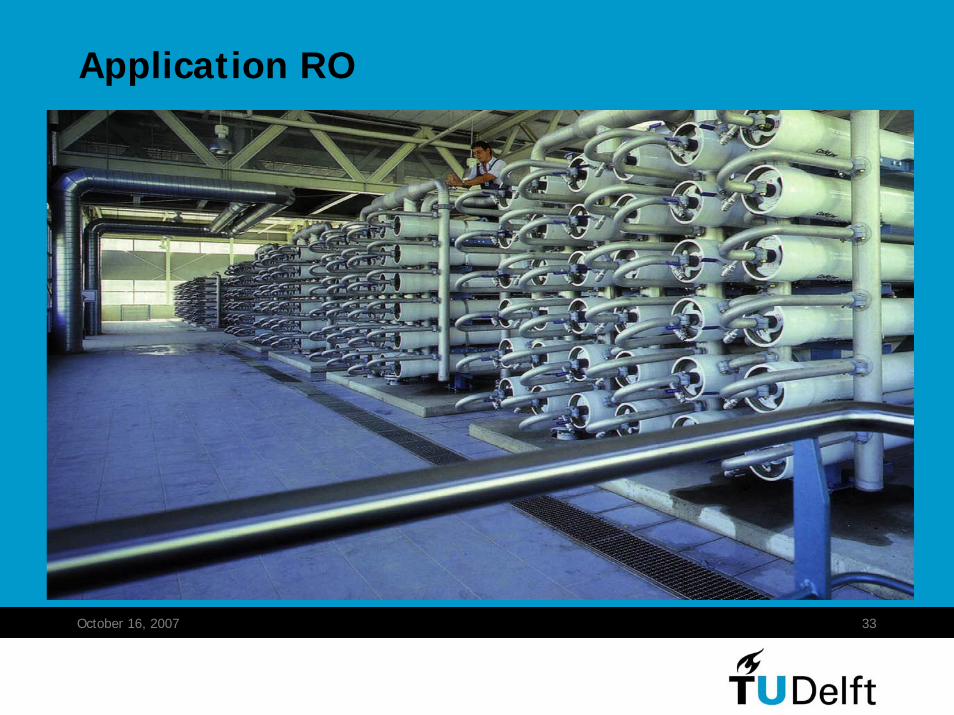
October 16, 2007 33
Application RO
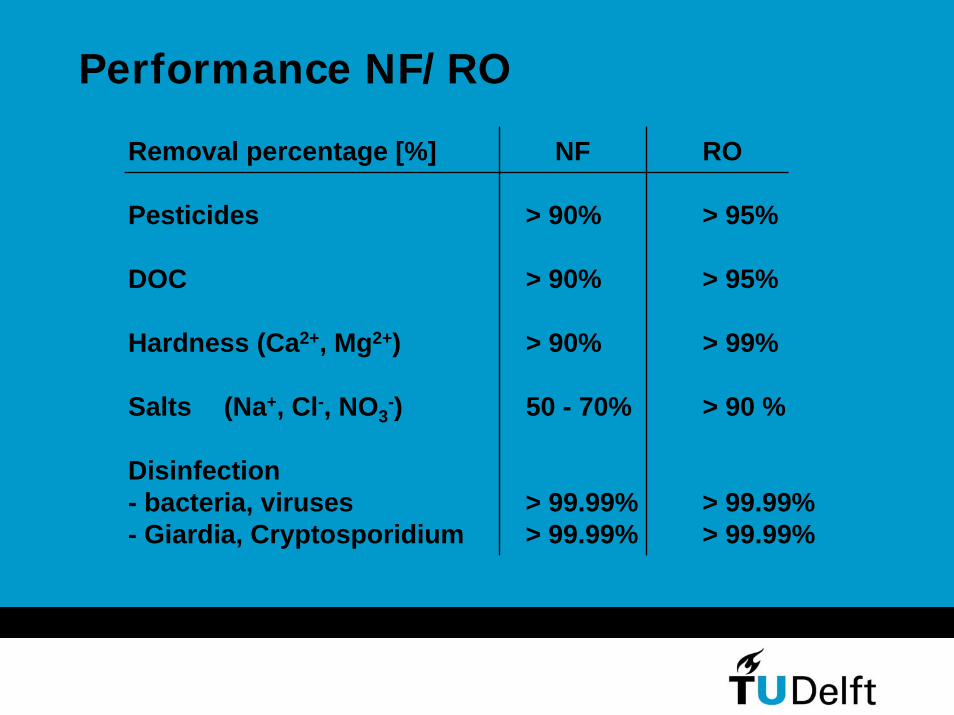
Removal percentage [%] NF RO
Pesticides > 90% > 95%
DOC > 90% > 95%
Hardness (Ca2+, Mg2+) > 90% > 99%
Salts (Na+, Cl-, NO3-) 50 - 70% > 90 %
Disinfection - bacteria, viruses > 99.99% > 99.99%- Giardia, Cryptosporidium > 99.99% > 99.99%
Performance NF/RO
1. Split flow membrane filtration for softening and removal of organic compounds- alternative for softening and activated carbon filtration- examples: colored ground water
bank filtration waterpretreatment for infiltration (IB)
- costs: 35 euro cents/m3 product
2. Direct treatment of surface water- removal of micro organisms, organic compounds
and hardness
Application NF
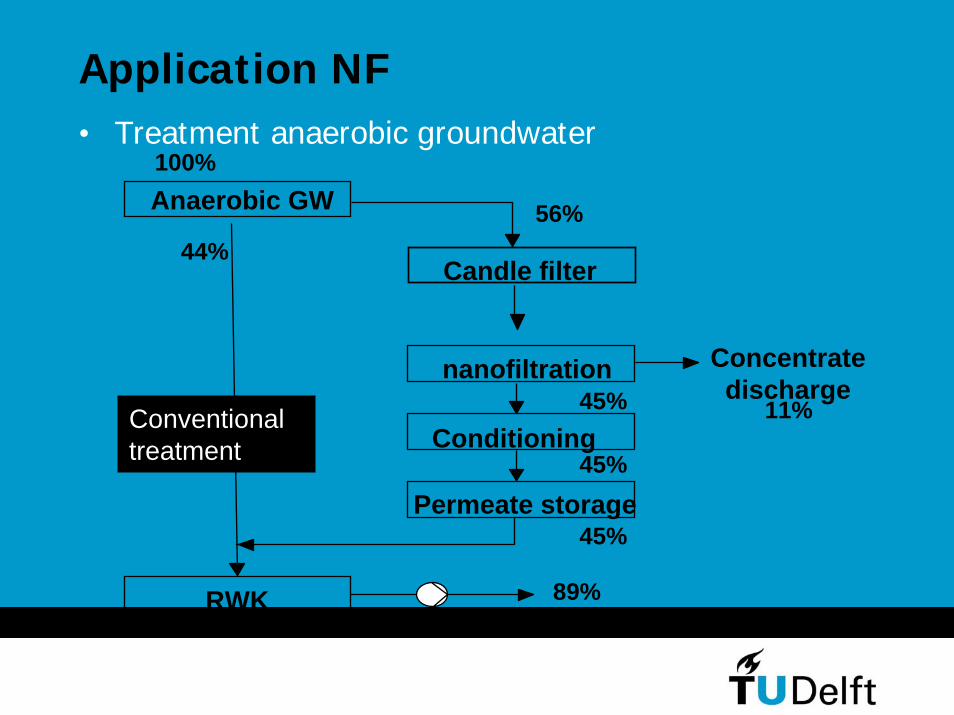
• Treatment anaerobic groundwater
Application NF
Anaerobic GW
RWK
Candle filter
nanofiltration
Conditioning
Permeate storage
Concentratedischarge
100%
44%56%
45%
45%
11%
45%
89%
Conventional treatment
1. Introduction2. Theory3. Membrane modules4. Applications5. Design 6. Fouling control
Contents
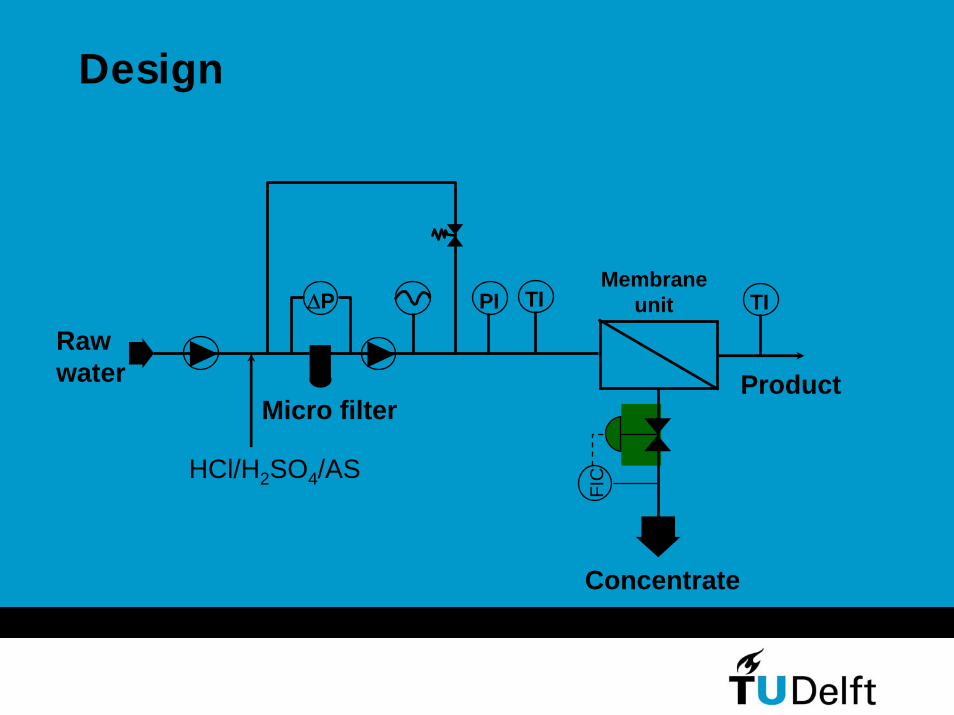
HCl/H2SO4/AS
ΔP
Rawwater
Micro filter
TIPIMembrane
unit TI
FIC
Concentrate
Product
Design
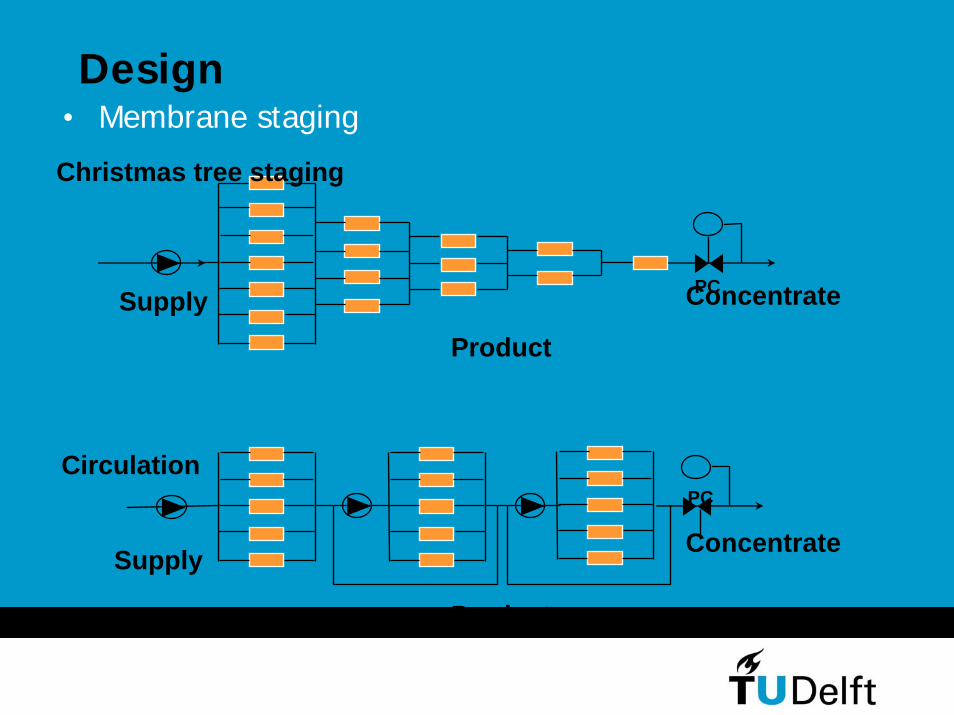
• Membrane staging
Christmas tree staging
Circulation
Product
Product
Concentrate
ConcentrateSupply
Supply
PC
PC
Design
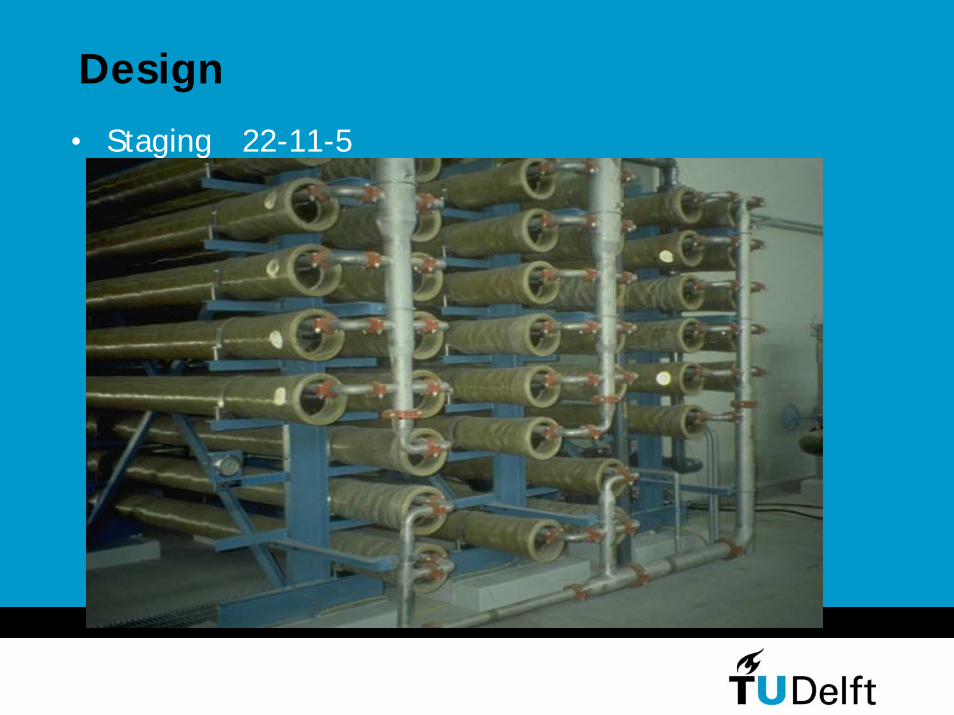
• Staging 22-11-5
Design
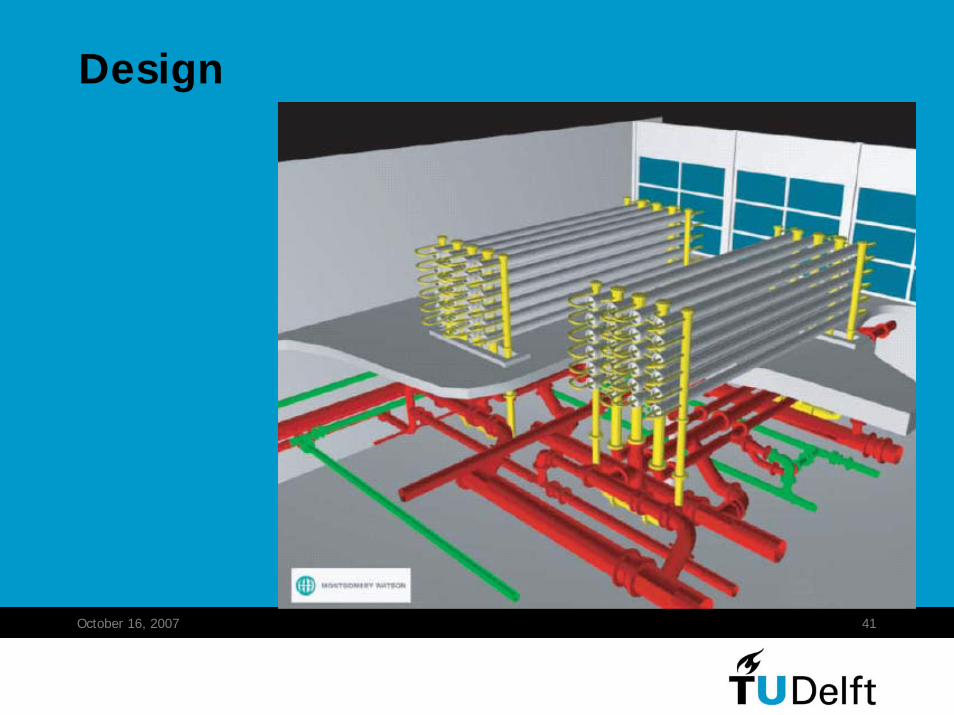
October 16, 2007 41
Design
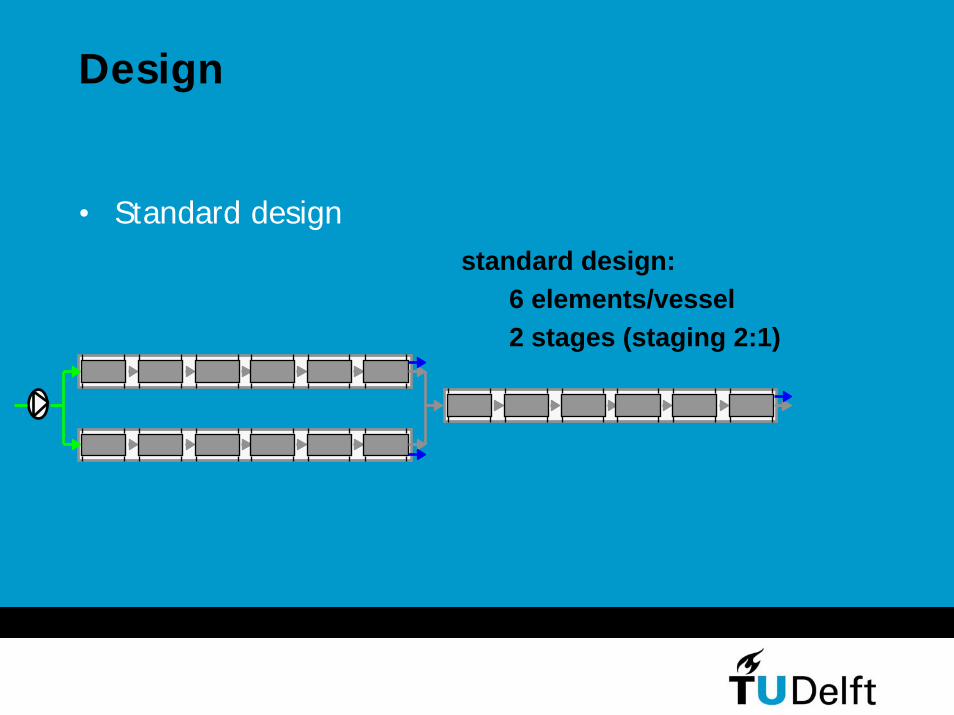
• Standard designstandard design:
6 elements/vessel2 stages (staging 2:1)
Design
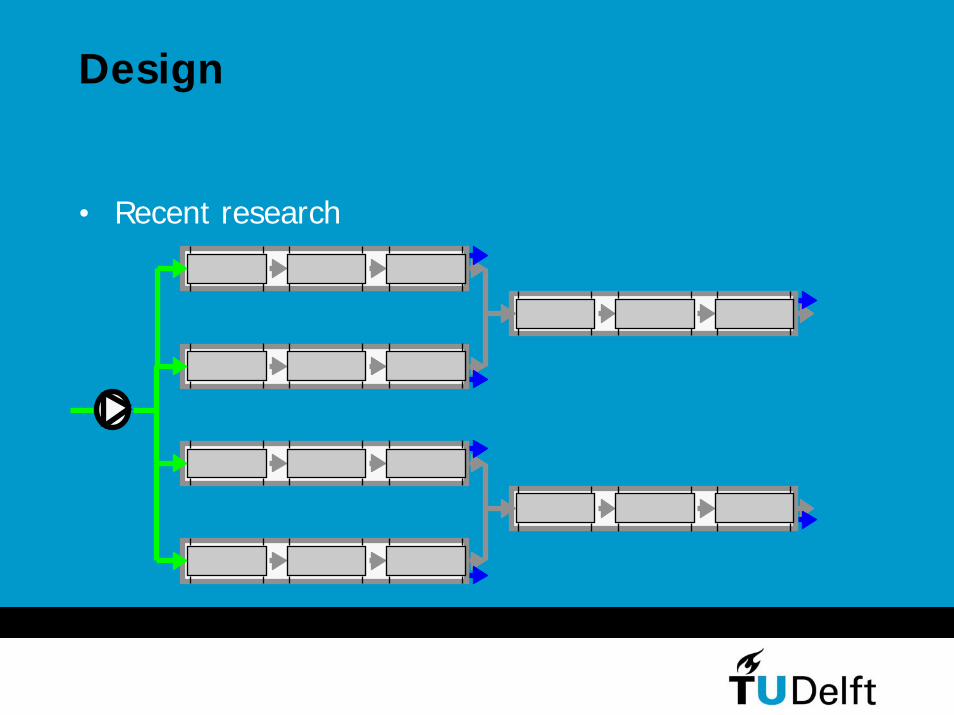
• Recent research
Design
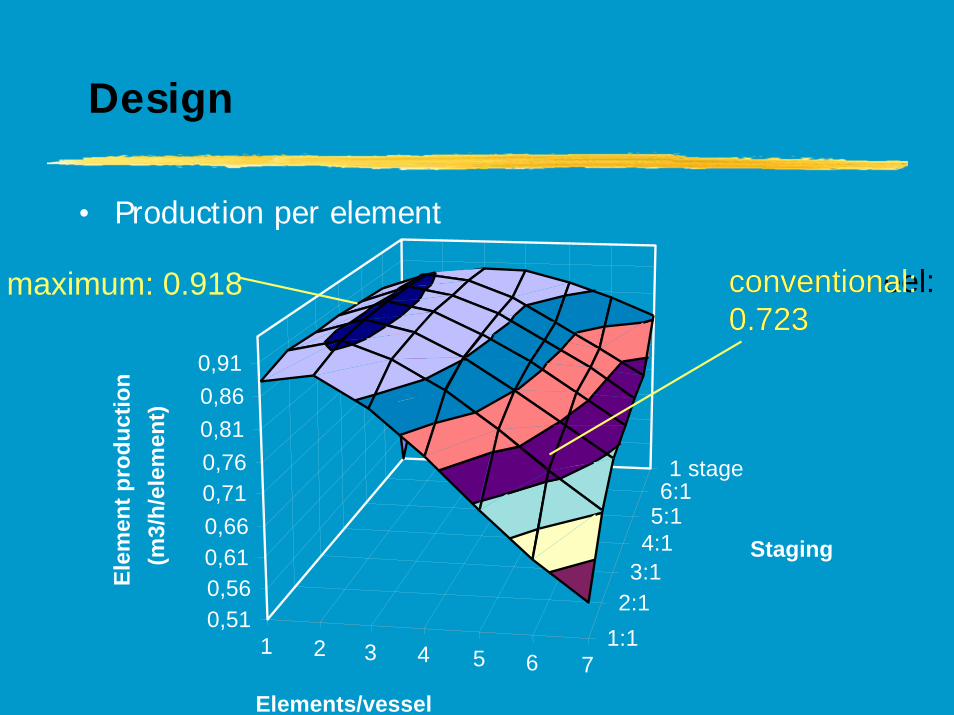
1 2 3 4 5 6 71:12:13:14:15:16:11 stage
0,510,560,610,660,710,760,810,860,91
Elem
ent p
rodu
ctio
n(m
3/h/
elem
ent)
Elements/vessel
Staging
maximum: 0.918 conventioneel:conventional:0.7230.723
• Production per element
Design
October 16, 2007 45
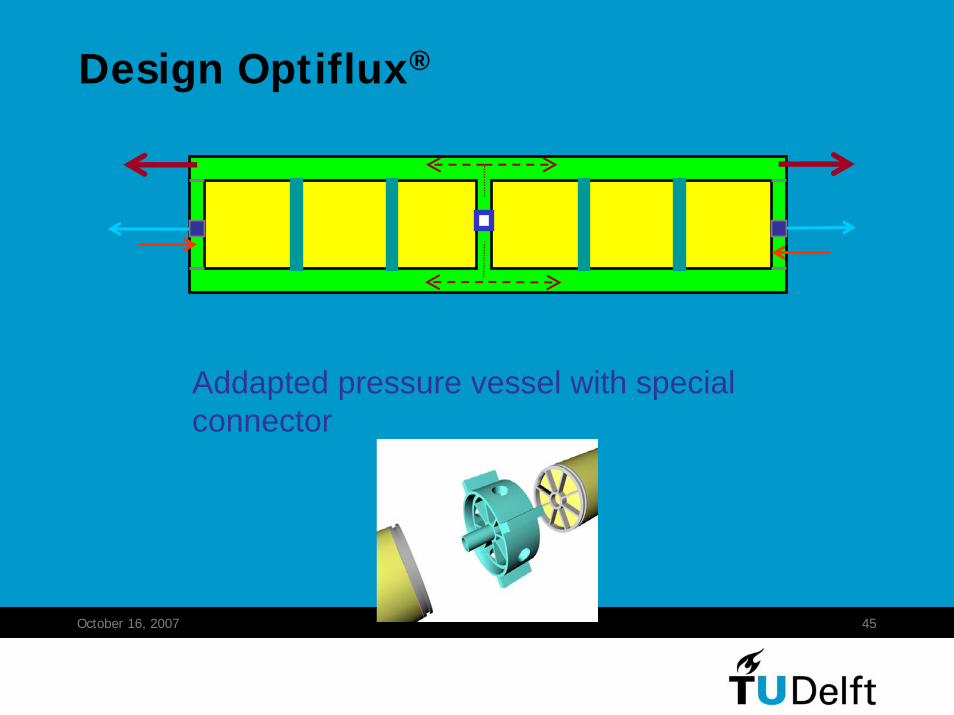
Design Optiflux®
Addapted pressure vessel with special connector
1. Introduction2. Theory3. Membrane modules4. Applications5. Design 6. Fouling control
Contents
October 16, 2007 47
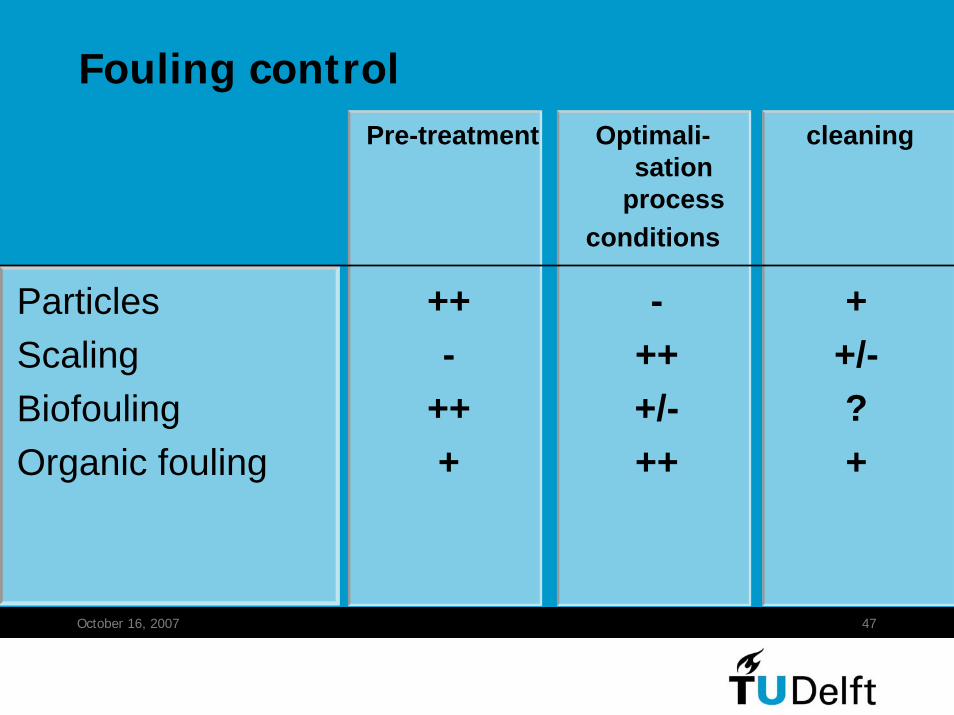
Fouling control
++/-?+
ParticlesScalingBiofoulingOrganic fouling
Optimali-sation
processconditions
-+++/-++
Pre-treatment
++-
+++
cleaning
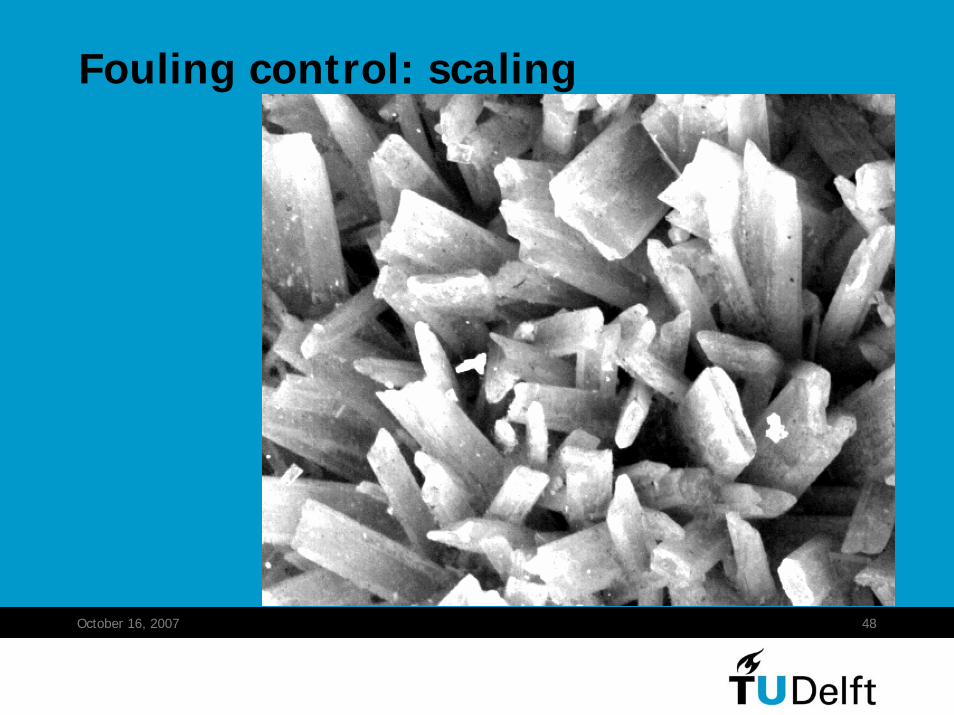
October 16, 2007 48
Fouling control: scaling
October 16, 2007 49
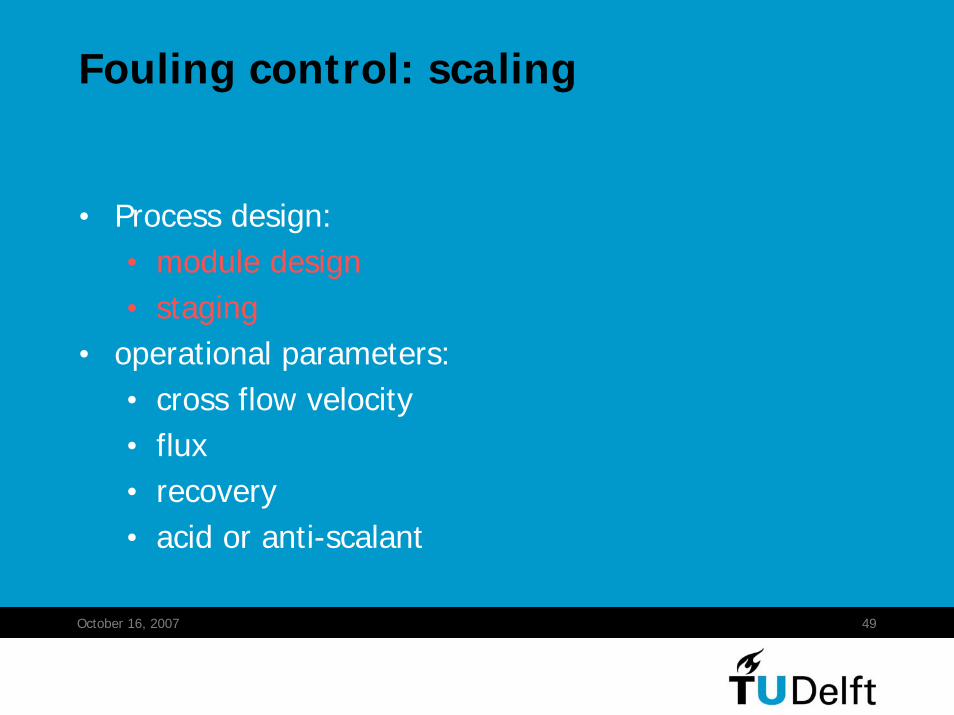
Fouling control: scaling
• Process design:• module design• staging
• operational parameters:• cross flow velocity• flux• recovery• acid or anti-scalant
October 16, 2007 50
Fouling control: scaling
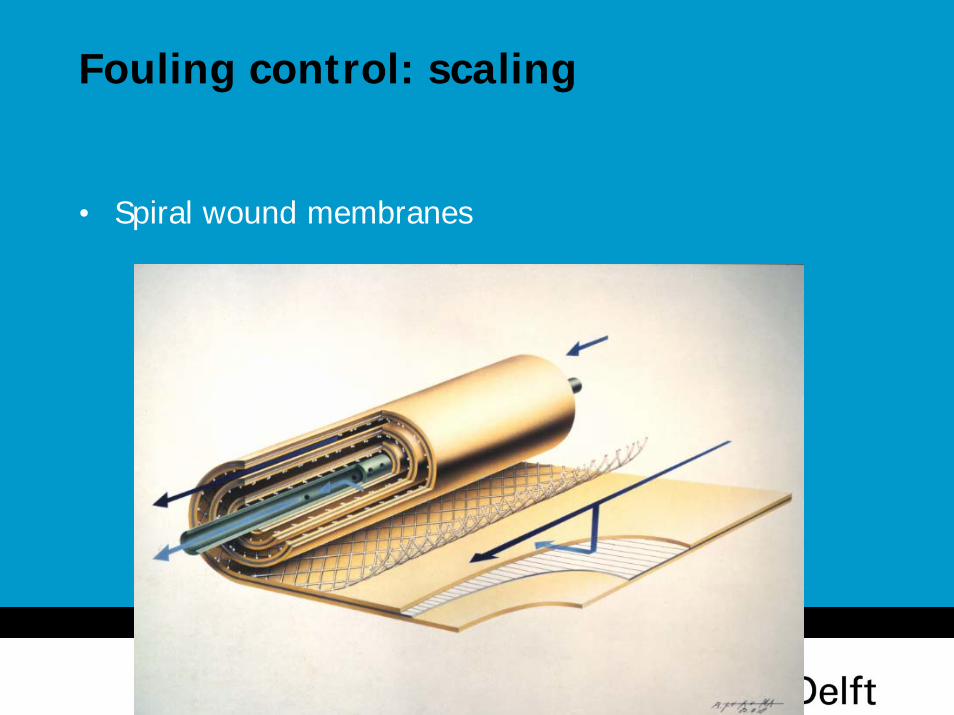
• Spiral wound membranes
Fouling control: scaling
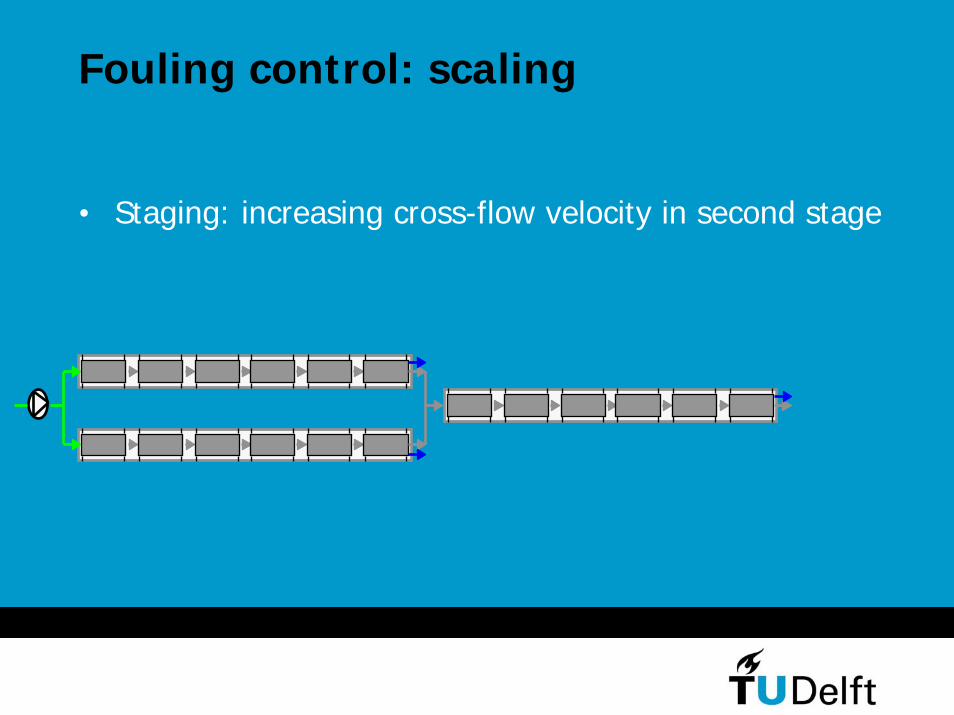
• Staging: increasing cross-flow velocity in second stage
Fouling control: scaling
October 16, 2007 53
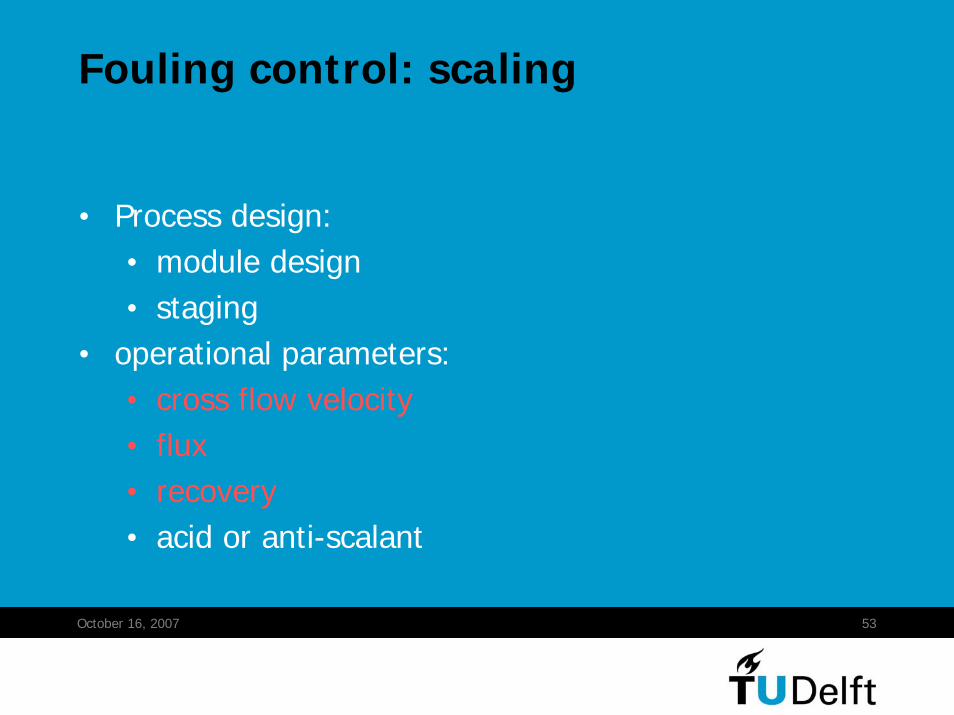
Fouling control: scaling
• Process design:• module design• staging
• operational parameters:• cross flow velocity• flux• recovery• acid or anti-scalant

October 16, 2007 54
Fouling control: scaling
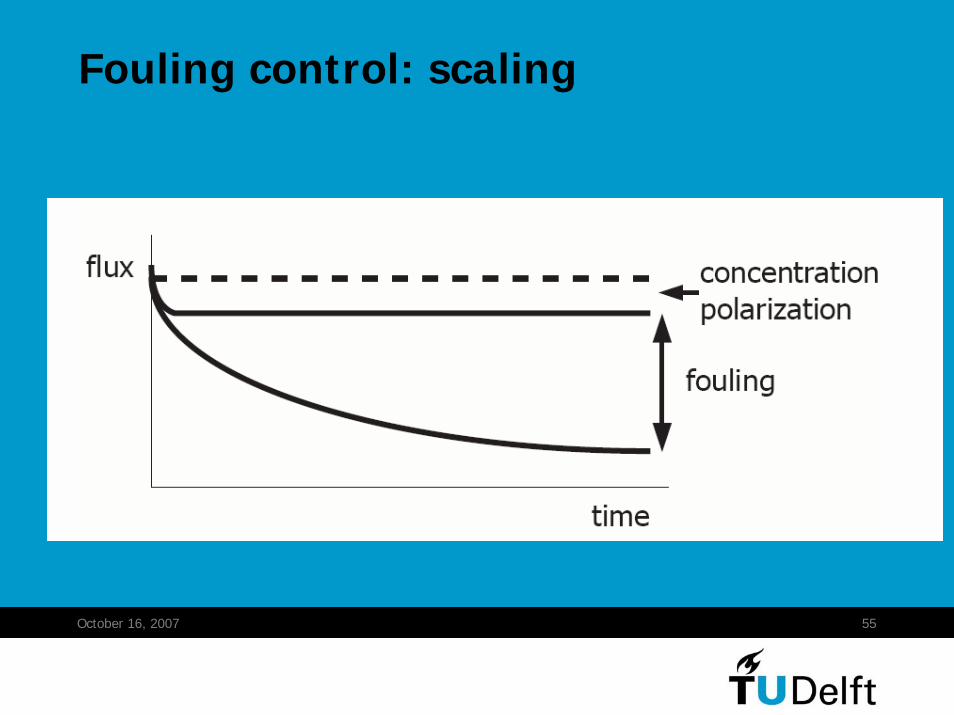
October 16, 2007 55
Fouling control: scaling
October 16, 2007 56
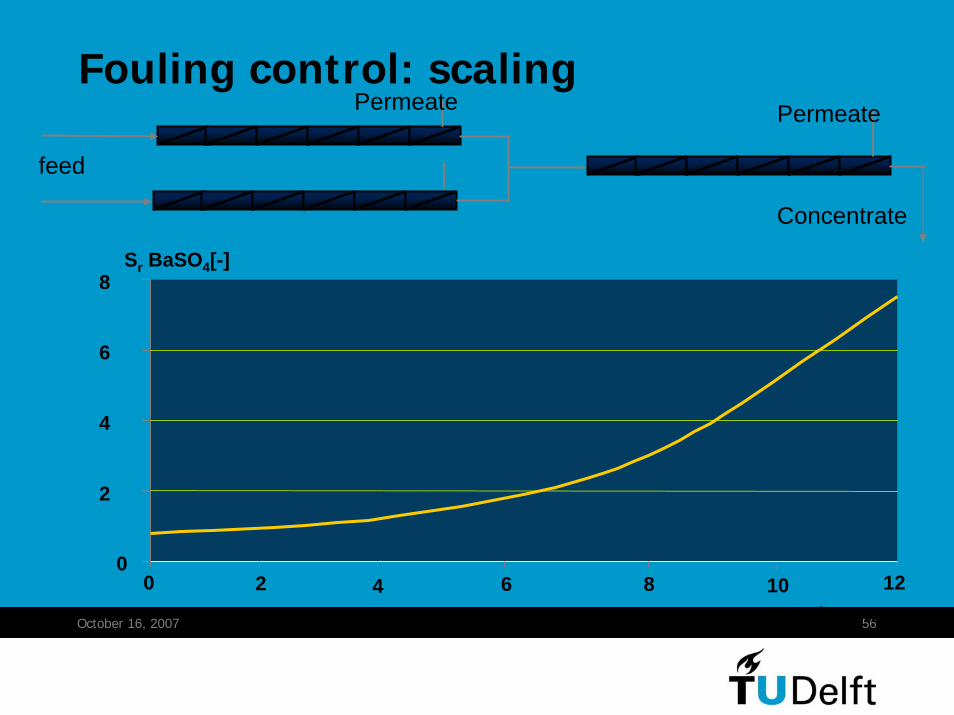
Fouling control: scaling
Sr BaSO4[-]
Element #
0
2
4
6
8
0 2 6 8 10 12
Concentrate
Permeate Permeate
feed
4
October 16, 2007 57
Fouling control: scaling
• Process design:• module design• staging
• operational parameters:• cross flow velocity• flux• recovery• acid or anti-scalant


![[PEGASUS]² Aims, Rules and Procedures 25 September 2015 Dr.ir. Isabelle Verbaeys](https://img.pdfslide.net/doc/110x75/56649ebc5503460f94bc5bc2/pegasus-aims-rules-and-procedures-25-september-2015-drir-isabelle-verbaeys.jpg)