Embed Size (px)
Citation preview

V3 Spring 2018・CTL.SC4x – Technology and Systems・MITx MicroMasters in Supply Chain Management
MIT Center for Transportation & Logistics・Cambridge, MA 02142 USA ・[email protected]
This work is licensed under a Creative Commons Attribution-NonCommercial-ShareAlike 4.0 International License.
1
CTL.SC4x – Technology and Systems
Key Concepts Document This document contains the Key Concepts for the SC4x course.
These are meant to complement, not replace, the lesson videos and slides. They are intended to
be references for you to use going forward and are based on the assumption that you have
learned the concepts and completed the practice problems.
This draft was created by Dr. Alexis Bateman in the spring of 2017. It was updated Spring 2018 by
Dr. David Correll and Mr. Ahmed Bilal.
This is a draft of the material, so please post any suggestions, corrections, or recommendations
to the Discussion Forum under the topic thread “Key Concept Documents Improvements.”
Thanks,
Chris Caplice, Eva Ponce and the SC4x Teaching Community
Spring 2018 v3
V3 Spring 2018・CTL.SC4x – Technology and Systems・MITx MicroMasters in Supply Chain Management
MIT Center for Transportation & Logistics・Cambridge, MA 02142 USA ・[email protected]
This work is licensed under a Creative Commons Attribution-NonCommercial-ShareAlike 4.0 International License.
2
Table of Contents
Introduction to Data Management .....................................................................................................4 Data Management .................................................................................................................................... 4 Querying the Data ..................................................................................................................................... 5
Data Modeling ...................................................................................................................................7 Relational Models ...................................................................................................................................... 7 Designing Data Models ............................................................................................................................. 8 Relationships and Cardinality .................................................................................................................... 8 Keys ............................................................................................................................................................ 9
Database Normalization ................................................................................................................... 11 Objectives of Normalization .................................................................................................................... 11 Summary of five normal forms ................................................................................................................ 12 Client Server Architecture ........................................................................................................................ 13
Database Queries............................................................................................................................. 14 Structured Query Language..................................................................................................................... 14 Creating Databases and Tables ............................................................................................................... 16
Database Conditional, Grouping, and Joins ....................................................................................... 18 Database Conditional Clauses ................................................................................................................. 18 Sorting and Sampling Data...................................................................................................................... 20 Joining Multiple Tables ............................................................................................................................ 21
Topics in Databases .......................................................................................................................... 23
Introduction to Machine Learning .................................................................................................... 29 Overview of Machine Learning Algorithms ............................................................................................. 29 Model Quality .......................................................................................................................................... 30
Machine Learning Algorithms ........................................................................................................... 32 Dimensionality reduction......................................................................................................................... 32 Principal component analysis (PCA) ........................................................................................................ 32 Clustering ................................................................................................................................................. 33 Classifications .......................................................................................................................................... 33 Comparing predictor accuracy ................................................................................................................ 35 Sensitivity and specificity ......................................................................................................................... 35
Supply Chain Systems - ERP .............................................................................................................. 38 Supply Chain IT Systems .......................................................................................................................... 38 Enterprise Resource Planning .................................................................................................................. 38 ERP Communication ................................................................................................................................ 40 The Value of ERP for SCM ........................................................................................................................ 41
Supply Chain Systems - Supply Chain Modules .................................................................................. 43 Advanced Planning Systems .................................................................................................................... 44 Transportation Management Systems (TMS) ......................................................................................... 45 Manufacturing Execution Systems .......................................................................................................... 48

V3 Spring 2018・CTL.SC4x – Technology and Systems・MITx MicroMasters in Supply Chain Management
MIT Center for Transportation & Logistics・Cambridge, MA 02142 USA ・[email protected]
This work is licensed under a Creative Commons Attribution-NonCommercial-ShareAlike 4.0 International License.
3
Supply Chain Systems - Supply Chain Visibility .................................................................................. 49 Tracking and Tracing ............................................................................................................................... 50 Technologies for Supply Chain Visibility .................................................................................................. 50
Supply Chain Systems - Software Selection & Implementation .......................................................... 54 Architecture ............................................................................................................................................. 54 Cloud Computing ..................................................................................................................................... 54 Software Vendor Selection ...................................................................................................................... 57 Implementation ....................................................................................................................................... 58

V3 Spring 2018・CTL.SC4x – Technology and Systems・MITx MicroMasters in Supply Chain Management
MIT Center for Transportation & Logistics・Cambridge, MA 02142 USA ・[email protected]
This work is licensed under a Creative Commons Attribution-NonCommercial-ShareAlike 4.0 International License.
4
Introduction to Data Management
Summary
Supply chains are moving at ever-faster rates with technology and systems supporting this movement. Data management plays a critical role in enabling supply chains to move at the speed and precision they do today, and the need for advanced data management will only continue.
In recent years there has been an explosion of information and this is especially true in supply chains. A few examples introduced include Amazon’s massive supply chains selling 480 million unique items to 244 million customers while UPS is delivering 20 million packages to 8.4 million delivery points. This information is coming from multiple sources, in addition to sensors, the “internet of things”, and regulations requiring increasing amounts of information.
All of this information is commonly referred to as the “Big Data” challenge. Data is driving our modern world, but how can we be sure of it and use it most effectively? As we will review – data is messy, it requires cleaning and programming. Data is frequently trapped in siloes coming from different sources, which makes working with it more challenging. In addition, data is big and getting even bigger daily. The tools we have all become comfortable with (spreadsheets) can no longer handle that amount of data, so we must use different tools to enable greater analysis.
To better understand the role of data and how to manage it, the following summaries cover an introduction to data management, data modeling, and data normalization – to get us started on a solid ground with handling large data sets – an absolute essential in supply chain management.
Data Management In data management supply chain managers will be faced with immense complexity. This complexity is influenced by the volume (how much), velocity (pace), variety (spread), and veracity (accuracy). Each of these components will influence how data is treated and used in the supply chain.
There are several reoccurring issues that supply chain managers must be aware of as they are working with data:
• Is the data clean? • Is the data complete? • What assumptions are you making about the data? • Are the results making sense? How can I check?
V3 Spring 2018・CTL.SC4x – Technology and Systems・MITx MicroMasters in Supply Chain Management
MIT Center for Transportation & Logistics・Cambridge, MA 02142 USA ・[email protected]
This work is licensed under a Creative Commons Attribution-NonCommercial-ShareAlike 4.0 International License.
5
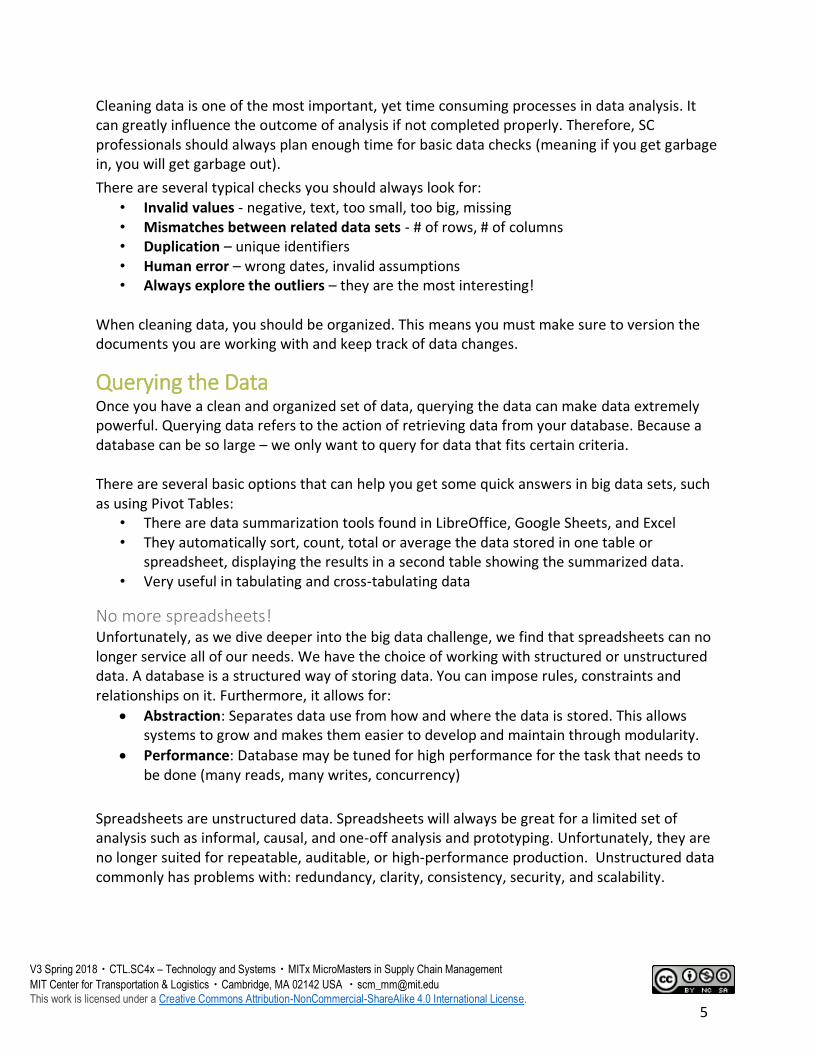
Cleaning data is one of the most important, yet time consuming processes in data analysis. It can greatly influence the outcome of analysis if not completed properly. Therefore, SC professionals should always plan enough time for basic data checks (meaning if you get garbage in, you will get garbage out).
There are several typical checks you should always look for: • Invalid values - negative, text, too small, too big, missing • Mismatches between related data sets - # of rows, # of columns • Duplication – unique identifiers • Human error – wrong dates, invalid assumptions • Always explore the outliers – they are the most interesting!
When cleaning data, you should be organized. This means you must make sure to version the documents you are working with and keep track of data changes.
Querying the Data Once you have a clean and organized set of data, querying the data can make data extremely powerful. Querying data refers to the action of retrieving data from your database. Because a database can be so large – we only want to query for data that fits certain criteria. There are several basic options that can help you get some quick answers in big data sets, such as using Pivot Tables:
• There are data summarization tools found in LibreOffice, Google Sheets, and Excel • They automatically sort, count, total or average the data stored in one table or
spreadsheet, displaying the results in a second table showing the summarized data. • Very useful in tabulating and cross-tabulating data
No more spreadsheets! Unfortunately, as we dive deeper into the big data challenge, we find that spreadsheets can no longer service all of our needs. We have the choice of working with structured or unstructured data. A database is a structured way of storing data. You can impose rules, constraints and relationships on it. Furthermore, it allows for:
• Abstraction: Separates data use from how and where the data is stored. This allows systems to grow and makes them easier to develop and maintain through modularity.
• Performance: Database may be tuned for high performance for the task that needs to be done (many reads, many writes, concurrency)
Spreadsheets are unstructured data. Spreadsheets will always be great for a limited set of analysis such as informal, causal, and one-off analysis and prototyping. Unfortunately, they are no longer suited for repeatable, auditable, or high-performance production. Unstructured data commonly has problems with: redundancy, clarity, consistency, security, and scalability.

V3 Spring 2018・CTL.SC4x – Technology and Systems・MITx MicroMasters in Supply Chain Management
MIT Center for Transportation & Logistics・Cambridge, MA 02142 USA ・[email protected]
This work is licensed under a Creative Commons Attribution-NonCommercial-ShareAlike 4.0 International License.
6
Learning Objectives
• Understand the importance of data in supply chain management.
• Review the importance of high quality and clean databases.
• Recognize the power of querying data.
• Differentiate between unstructured and structured data and the need for tools beyond spreadsheets.

V3 Spring 2018・CTL.SC4x – Technology and Systems・MITx MicroMasters in Supply Chain Management
MIT Center for Transportation & Logistics・Cambridge, MA 02142 USA ・[email protected]
This work is licensed under a Creative Commons Attribution-NonCommercial-ShareAlike 4.0 International License.
7
Data Modeling
Summary Now that we have been introduced to data management and the issue of big data, we now deep drive into data modeling and learn how to design databases. Data modeling is the first step in database. Data modeling is the process of transitioning a logical model into a physical schema. To understand the process of data modeling, we review several components including relational databases, data organization, data models for designing databases, and what constitutes a good data model. A data model consists of several parts including: entities and attributes, primary keys, foreign keys, and relationships and cardinality.
Relational Models The relational model is an approach to managing data that uses structure and language where all data is grouped into relations. A relational model provides a method for specifying data and queries. It is based on first-order predicate logic, which was described by Edgar F. Codd in 1969. This logic defines that all data is represented in terms of tuples, grouped into relations. There are several definitions to be familiar with as we reviewed previously with relational models:
• Entity: object, concept or event • Attribute (column): a characteristic of an entity • Record or tuple (row): the specific characteristics or attribute values for one example of
an entity • Entry: the value of an attribute for a specific record • Table: a collection of records • Database: a collection of tables
Tables and Attributes Data in relational tables are organized into tables, which represent entities. Single tables within a database can be seen as similar to a spreadsheet. However, we use different words to refer to “rows” and “columns”. Attributes are the characteristics of an entity. Tables
• Tables represent entities, which are usually plural nouns
• Tables are often named as what they represent (typically plural nouns, without spaces): e.g. Companies, Customers, Vehicles, Orders, etc.
Attributes
• Characteristics of an entity (table), typically nouns
• Examples in the form of: Table (Attr1, Attr2, ... AttrN), Vehicles (VIN, Color, Make, Model, Mileage)

V3 Spring 2018・CTL.SC4x – Technology and Systems・MITx MicroMasters in Supply Chain Management
MIT Center for Transportation & Logistics・Cambridge, MA 02142 USA ・[email protected]
This work is licensed under a Creative Commons Attribution-NonCommercial-ShareAlike 4.0 International License.
8
Entity Types and Entity occurrence: an entity is any object in the system we want to model and store. An entity occurrence is a uniquely identifiable object belonging to an entity type.
Designing Data Models There are several steps to designing a database to store and analyze data.
1. Develop a data model that describes the data in the database and how to access it 2. Define tables and attributes in the database (each important concept/noun in the data
is defined as a table in the database)
Data models help specify each entity in a table in a standardized way. They allow the user to impose rules, constraints and relationships on the data that is stored. It also allows users to understand business rules and process and analyze data.
Rules for a Relational Data Model There are several rules for relational data model:
• Acts as a schematic for building the database • Each attribute (column) has a unique name within a table • All entries or values in the attribute are examples of that attribute • Each record (row) is unique in a good database • Ordering of records and attributes is unimportant
What makes a good relational data model? A good relational model should be complete with all the necessary data represented. There should be no redundancy. Business rules should be effectively enforced. Models should also be reusable for different applications. And finally, it should be flexible and be able to cope with changes to business rules or data requirements.
Relationships and Cardinality When we begin to work with the data, we have to understand how data relates to each other and how unique are the attributes. Some of this can be managed through entity types and attributes. Relationships + cardinality = business rules.
Entity and Attributes An entity is a person, place, thing, or concept that can be described by different data. Each entity is made of a number of attributes. Entity types should be described as part of the data modeling process, this will help with the documentation and determination of business rules. How to draw and entity-relationship diagram: An ERD is a graphical representation of an information system that visualizes the relationship between the entities within that system.
• ERD or entity-relationship diagram is a schematic of the database • Entities are drawn as boxes • Relationships between entities are indicated by lines between these entities

V3 Spring 2018・CTL.SC4x – Technology and Systems・MITx MicroMasters in Supply Chain Management
MIT Center for Transportation & Logistics・Cambridge, MA 02142 USA ・[email protected]
This work is licensed under a Creative Commons Attribution-NonCommercial-ShareAlike 4.0 International License.
9
• Cardinality describes the expected number of related occurrences between the two entities in a relationship and is shown using crow's foot notation (see figures below)
Cardinality – crow’s foot notation
General Meanings Mandatory | Optional O
Domain Validation Entities: Also known as “pick lists” or “validation lists”. Domain validation entities are used to standardize data in a database, they restrict entries to a set of specified values. They are tables with a single attribute that enforces values of attribute in related table(s).
Keys Primary keys are attributes used to uniquely identify a record while foreign keys are attributes stored in a dependent entity, which show how records in the dependent entity are related to an independent entity. Primary key: one or more attributes that uniquely identify a record. The attribute has be uniquely suited. Foreign Key: Primary key of the independent or parent entity type is maintained as a non-key attribute in the related, dependent or child entity type, this is known as the foreign key Composite key: is a primary key that consists of more than one attribute, ex: charter airline, every flight has a different number. Many to Many Relationships: A many-to-many relationship refers to a relationship between tables in a database when a parent entity contains several child entity types in the second table. ex- Vehicle can be driven by many drivers, drivers can drive many vehicles. In this case an associative table (entity), aka junction table is appropriate where the primary key of parent is used in primary key of child.

V3 Spring 2018・CTL.SC4x – Technology and Systems・MITx MicroMasters in Supply Chain Management
MIT Center for Transportation & Logistics・Cambridge, MA 02142 USA ・[email protected]
This work is licensed under a Creative Commons Attribution-NonCommercial-ShareAlike 4.0 International License.
10
Referential integrity Referential integrity maintains the validity of foreign keys when the primary key in the parent table changes. Every foreign key either matches a primary key (or is null).
Cascade rules: choose among delete options
• Cascade restrict: Rows in the primary key table can’t be deleted unless all corresponding rows in the foreign key tables have been deleted
• Cascade delete: When rows in the primary key table are deleted, associated rows in foreign key tables are also deleted
Learning Objectives • The data model describes the data that is stored in the database and how to access it. • Data models enable users to understand business rules and effectively process and
analyze data. • Understand that business rules are imposed on the database through relationships and
cardinality. • Recognize that data models may vary for a given dataset as business logic evolves. • Remember that the data modeling process may reveal inconsistencies or errors in the
data, which will have to be corrected before importing into a database. • Selection of entities and associated attributes from a flat file is not always obvious.

V3 Spring 2018・CTL.SC4x – Technology and Systems・MITx MicroMasters in Supply Chain Management
MIT Center for Transportation & Logistics・Cambridge, MA 02142 USA ・[email protected]
This work is licensed under a Creative Commons Attribution-NonCommercial-ShareAlike 4.0 International License.
11
Database Normalization
Summary Database normalization, or normalization, is an important step in database management. Normalization is intrinsic to relational databases and is the process of organizing attributes into relations (or tables). This process is vital in reducing data redundancy and improving data integrity. In addition, normalization helps organize information around specific topics that can be used to digest the massive amount of information in databases into something digestible. When SC professionals are presented with large amounts of raw data, that raw data may be stored in a single table, containing redundant information or information about several different concepts. The data can be separated into tables and normalized to allow for better data handling and comprehension. To get to this place, updating a data model can be done collaboratively during meetings and discussions to define the business rules. During updates, normalization prevents mistakes and data inconsistencies. Normalization helps prevent redundancy, confusion, improper keys, wasted storage, and incorrect or outdated data.
Objectives of Normalization 1. To free the collection of [tables] from undesirable insertion, update and deletion
dependencies. 2. To reduce the need for restructuring the collection of [tables], as new types of data are
introduced, and thus increase the life span of application programs. 3. To make the relational model more informative to users. 4. To make the collection of [tables] neutral to the query statistics, where these statistics
are liable to change as time goes by. **Remember our relational model definitions
• Entity: object, concept or event • Attribute (column): a characteristic of an entity • Record or tuple (row): the specific characteristics or attribute values for one example of
an entity • Entry: the value of an attribute for a specific record • Table: a collection of records • Database: a collection of tables
V3 Spring 2018・CTL.SC4x – Technology and Systems・MITx MicroMasters in Supply Chain Management
MIT Center for Transportation & Logistics・Cambridge, MA 02142 USA ・[email protected]
This work is licensed under a Creative Commons Attribution-NonCommercial-ShareAlike 4.0 International License.
12
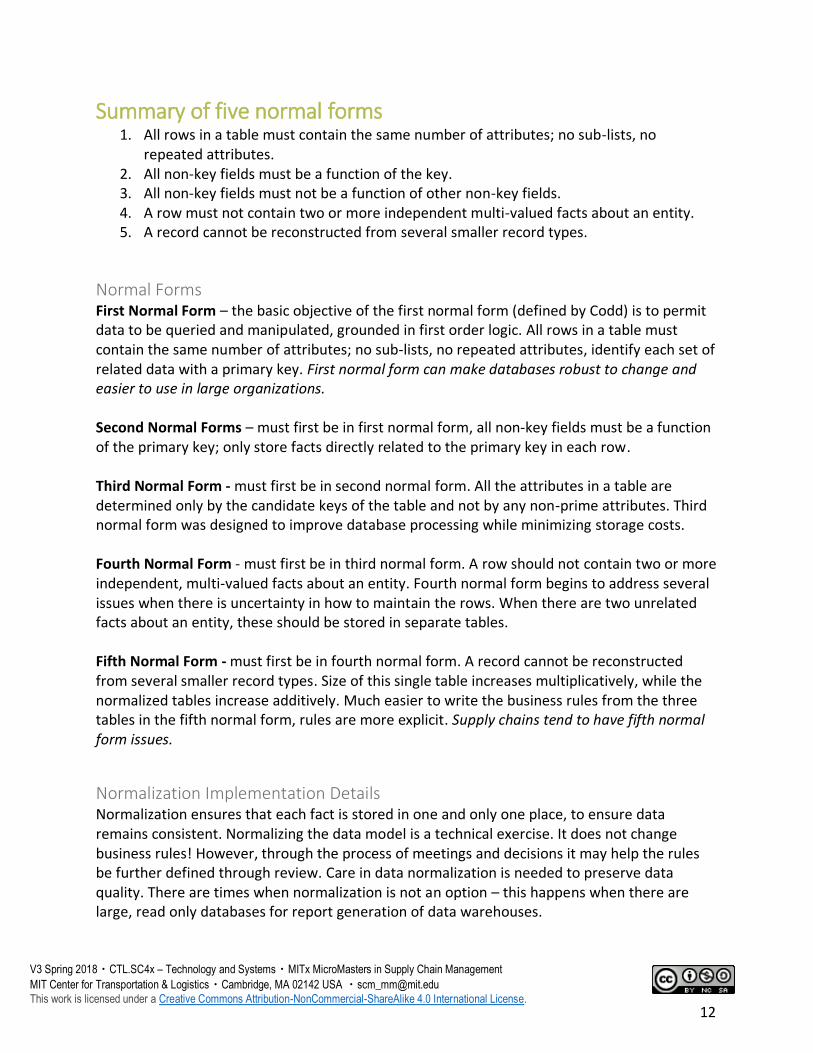
Summary of five normal forms 1. All rows in a table must contain the same number of attributes; no sub-lists, no
repeated attributes. 2. All non-key fields must be a function of the key. 3. All non-key fields must not be a function of other non-key fields. 4. A row must not contain two or more independent multi-valued facts about an entity. 5. A record cannot be reconstructed from several smaller record types.
Normal Forms First Normal Form – the basic objective of the first normal form (defined by Codd) is to permit data to be queried and manipulated, grounded in first order logic. All rows in a table must contain the same number of attributes; no sub-lists, no repeated attributes, identify each set of related data with a primary key. First normal form can make databases robust to change and easier to use in large organizations. Second Normal Forms – must first be in first normal form, all non-key fields must be a function of the primary key; only store facts directly related to the primary key in each row. Third Normal Form - must first be in second normal form. All the attributes in a table are determined only by the candidate keys of the table and not by any non-prime attributes. Third normal form was designed to improve database processing while minimizing storage costs. Fourth Normal Form - must first be in third normal form. A row should not contain two or more independent, multi-valued facts about an entity. Fourth normal form begins to address several issues when there is uncertainty in how to maintain the rows. When there are two unrelated facts about an entity, these should be stored in separate tables. Fifth Normal Form - must first be in fourth normal form. A record cannot be reconstructed from several smaller record types. Size of this single table increases multiplicatively, while the normalized tables increase additively. Much easier to write the business rules from the three tables in the fifth normal form, rules are more explicit. Supply chains tend to have fifth normal form issues.
Normalization Implementation Details Normalization ensures that each fact is stored in one and only one place, to ensure data remains consistent. Normalizing the data model is a technical exercise. It does not change business rules! However, through the process of meetings and decisions it may help the rules be further defined through review. Care in data normalization is needed to preserve data quality. There are times when normalization is not an option – this happens when there are large, read only databases for report generation of data warehouses.

V3 Spring 2018・CTL.SC4x – Technology and Systems・MITx MicroMasters in Supply Chain Management
MIT Center for Transportation & Logistics・Cambridge, MA 02142 USA ・[email protected]
This work is licensed under a Creative Commons Attribution-NonCommercial-ShareAlike 4.0 International License.
13
Client Server Architecture
Client Server Model Clients can connect to servers to access a specific service using a standardized protocol, see figure below.
Database Servers Databases are hosted on a server and not usually accessible through a file system or directory structure. The main options for hosting a database is: on a single server, in a database cluster, or as a cloud service. All of these systems are designed to abstract the implementation details. A client has software that allows it to connect and communicate with the database server using a standardized protocol. There are many different user interfaces for many databases. Databases can be accessed remotely via the Internet.
Learning Objectives • Identify and understand database normalization. • Review why we normalize our data models. • Understand the step-by-step process of data normalization and forms. • Learn and apply how we normalize a relational data model. • Recognize the drawbacks of normalization.
Client-servermodel
• Clientscanconnecttoserverstoaccessaspecificserviceusingastandardizedprotocol
WebApplica9on
Client
MySQLDatabaseServer
DatabaseUserInterfaceClient
Analy9csClient
46

V3 Spring 2018・CTL.SC4x – Technology and Systems・MITx MicroMasters in Supply Chain Management
MIT Center for Transportation & Logistics・Cambridge, MA 02142 USA ・[email protected]
This work is licensed under a Creative Commons Attribution-NonCommercial-ShareAlike 4.0 International License.
14
Database Queries
Summary As we continue our discussion of database management, we dive into the issue of database queries. The ability to make effective queries in a large database enables us to harness the power of big data sets. SQL (Structured Query Language) is a language and contains the commands we use to create, manage, and query relational databases. As in all technology and systems applications, there are a multitude of vendors who offer SQL variations, but in general they have a common set of data types and commands. SQL is portable across operating systems and in general, portable among vendors. Having covered the commonly used data types in previous lessons, in this next section we will cover very commonly used queries.
Structured Query Language SQL is used to query, insert, update, and modify data. Unlike Java, Visual Basic, or C++, SQL is not a complete programming language; it is a sub-language of approximately 30 statement types. It is generally embedded in another language or tool to enable database access. A few definitions we need to be aware of as we explore SQL are:
• Data definition: Operations to build tables and views (virtual tables)
• Data manipulation: INSERT, DELETE, UPDATE or retrieve (SELECT) data
• Data integrity: Referential integrity and transactions enforce primary and foreign keys
• Access control: Security for multiple types of users
• Data sharing: Database accessed by concurrent users
A few issues to make note of as you work with SQL is that it has several inconsistencies. For example, NULLs can be problematic and we will explore that later. In addition, when working with SQL it is important to recognize that it is a declarative language, not procedural language. This means that you write the command in such a way that describes what you want to do, not HOW you want to do it. It is left up to the application to figure it out.
Variations among SQL Implementation Because different databases use SQL, there can be variation in how SQL is implemented. The variations include:
• Error codes
• Data types supported (dates/times, currency, string/text variations)
• Whether case matters (upper, lower case)
• System tables (the structure of the database itself)
• Programming interface (no vendor follows the standard)
• Report and query generation tools
• Implementer-defined variations within the standard
• Database initialization, opening and connection

V3 Spring 2018・CTL.SC4x – Technology and Systems・MITx MicroMasters in Supply Chain Management
MIT Center for Transportation & Logistics・Cambridge, MA 02142 USA ・[email protected]
This work is licensed under a Creative Commons Attribution-NonCommercial-ShareAlike 4.0 International License.
15
As we have already learned, a data type defines what kind of value a column can contain. However, because there is variation across databases – we will use the data types for MySQL for the purpose of this discussion. MySQL has three main data types: numeric, strings (text), and dates/times. See the following figures: Core My SQL Data Types - Numeric
Core MySQL Data Types – Strings (Text)
CoreMySQLDataTypes– Strings(Text)
String Type Description
CHAR Afixed-length,non-binarystring(character)
VARCHAR Avariable-length,non-binarystring
NCHAR Sameasabove +UnicodeSupport
NVARCHAR Sameasabove +UnicodeSupport
BINARY Afixed-length,binarystring
VARBINARY Avariable-length,binarystring
TINYBLOB AverysmallBLOB(binarylargeobject)
BLOB AsmallBLOB
TEXT Asmall,non-binarystring
8
CoreMySQLDataTypes– Numeric
NumericType Description
INT Astandardinteger
BIGINT Alargeinteger
DECIMAL Afixed-pointnumber
FLOAT Asingle-precision,floating-pointnumber
DOUBLE Adouble-precision,floating-point number
BIT Abitfield
7

V3 Spring 2018・CTL.SC4x – Technology and Systems・MITx MicroMasters in Supply Chain Management
MIT Center for Transportation & Logistics・Cambridge, MA 02142 USA ・[email protected]
This work is licensed under a Creative Commons Attribution-NonCommercial-ShareAlike 4.0 International License.
16
Core MySQL Data Types – Dates/Times
Creating Databases and Tables To get started, we will need to know how to create databases and tables. While MySQL can be an intimidating program, but once you master some of the basics, you will be able to work effectively with large data sets.
• To create a Database, we use the CREATE DATABASE command • Once you have created the database, you will now apply the USE command to tell the
system which database to use
Once you have created a database, you will want to create tables within the larger database:
• New tables are declared using the CREATE TABLE command
• We can also set the name and data type of each attribute • When creating new tables, we can specify primary keys and foreign key relationships
• We can also decide whether or not NULL or empty values are allowed
Inserting Data into a new Database Once you have created a new database, you are ready to insert data. The data model will act a guide to load data into a new database. If the database builds well, it may mean that you have found the real business rules. Or, if you have some errors, you may have the real business rules, but the data may be messy. Finally, if it builds with many errors – this may be the case that the business rules are not accurate. In many cases, it is useful to get sample data and browse it during the process of building the model.
SQL Select Queries SQL SELECT query is used to fetch the data from a database table, which returns data in the form of a result table. SELECT returns a set of attributes in a query. In most applications, SELECT is the most commonly used data manipulation language command. SELECT statements are constructed from a series clauses to get records from one or more tables or views. Clauses must be in order; only SELECT and FROM are required:
• SELECT attributes/columns • INTO new table
CoreMySQLDataTypes– Dates/Times
Date /TimeType Description
DATE Adatevaluein'CCYY-MM-DD' format
TIME Atimevaluein'hh:mm:ss' format
DATETIME Date/Timein'CCYY-MM-DDhh:mm:ss’format
TIMESTAMP Timestampin'CCYY-MM-DDhh:mm:ss’format
YEAR AyearvalueinCCYYorYYformat
9

V3 Spring 2018・CTL.SC4x – Technology and Systems・MITx MicroMasters in Supply Chain Management
MIT Center for Transportation & Logistics・Cambridge, MA 02142 USA ・[email protected]
This work is licensed under a Creative Commons Attribution-NonCommercial-ShareAlike 4.0 International License.
17
• FROM table or view • WHERE specific records or a join is created • GROUP BY grouping conditions (attributes) • HAVING group-property (specific records) • ORDER BY ordering criterion ASC | DESC • DISTINCT return distinct values
Wildcards in SQL Most database implementations offer additional regular expressions – wildcards. A wildcard character can be used to substitute for any other character(s) in a string. Regular expressions can be used to find records, which match complex string patterns. For instance, MySQL has:
• [list] match any single character in list, e.g. [a-f] • [^list] match any single character not in list, e.g. [^h-m]
Editing a Table In some cases you will be faced with the need to edit a table. In this case you will use the following:
• INSERT is used to add a new record to a table that contains specific values for a set of attributes in that table
• The UPDATE keyword is used to modify a specific value or set of values for a set of records in a table
• DELETE is used to remove records from a table that meet a specific condition
Learning Objectives • Become more familiar with SQL.
• Recognize different implementations of SQL have differences of which to be aware.
• Review the different data types.
• Learn how to create new databases and tables.
• Understand how to use a SELECT query.
• Be familiar with wildcards and when to use them.
• Review how to edit a table.

V3 Spring 2018・CTL.SC4x – Technology and Systems・MITx MicroMasters in Supply Chain Management
MIT Center for Transportation & Logistics・Cambridge, MA 02142 USA ・[email protected]
This work is licensed under a Creative Commons Attribution-NonCommercial-ShareAlike 4.0 International License.
18
Database Conditional, Grouping, and Joins
Summary In the next section, we examine how to deal with database conditional, grouping, and joins. As we get further into SQL, we will need to refine our approach to make our actions more effective. For example, we will need to narrow the set of records that get returned from a query. We will also need to make statistical queries across different groupings or records. In addition, we will need to sample or order our output results. Another challenge will include integrating data from other sources within our database. The following review will cover these challenges and others as we continue to work with SQL.
Database Conditional Clauses A conditional clause is a part of a query that restricts rows matched by certain conditions. You can narrow SELECT statements with conditional clauses such as WHERE IN, or the BETWEEN keyword. WHERE IN statements are used to identify records in a table with an attribute matching a value from a specified set of values. The BETWEEN keywords are used to identify records that have values for a particular attribute that fall within a specified range WHERE IN: WHERE attribute IN is used to select rows that are satisfied by a set of WHERE conditions on the same attribute. Example: SELECT * FROM Offices WHERE State IN ('CO', 'UT', 'TX'); is equivalent to: SELECT * FROM Offices WHERE State = 'CO' OR State = 'UT' OR State = 'TX' BETWEEN Keyword: Select records where the attribute value is between two numbers using BETWEEN, range is inclusive and also works with time and date data.
V3 Spring 2018・CTL.SC4x – Technology and Systems・MITx MicroMasters in Supply Chain Management
MIT Center for Transportation & Logistics・Cambridge, MA 02142 USA ・[email protected]
This work is licensed under a Creative Commons Attribution-NonCommercial-ShareAlike 4.0 International License.
19
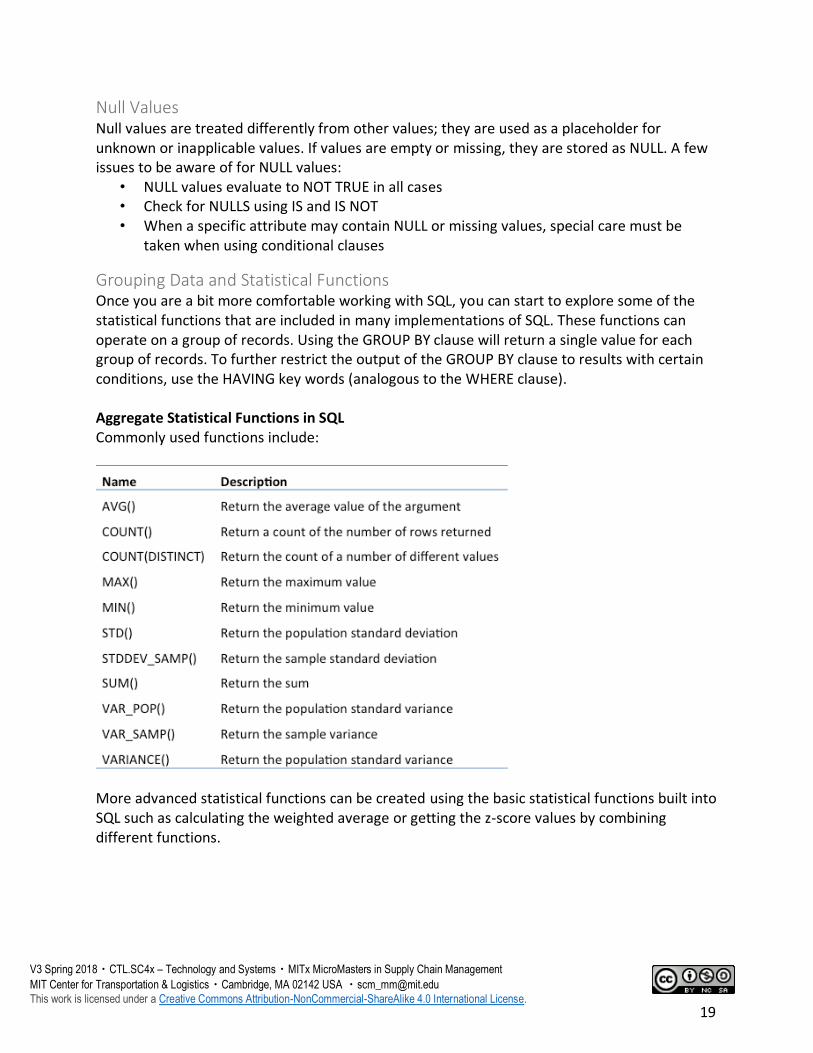
Null Values Null values are treated differently from other values; they are used as a placeholder for unknown or inapplicable values. If values are empty or missing, they are stored as NULL. A few issues to be aware of for NULL values:
• NULL values evaluate to NOT TRUE in all cases • Check for NULLS using IS and IS NOT • When a specific attribute may contain NULL or missing values, special care must be
taken when using conditional clauses
Grouping Data and Statistical Functions Once you are a bit more comfortable working with SQL, you can start to explore some of the statistical functions that are included in many implementations of SQL. These functions can operate on a group of records. Using the GROUP BY clause will return a single value for each group of records. To further restrict the output of the GROUP BY clause to results with certain conditions, use the HAVING key words (analogous to the WHERE clause). Aggregate Statistical Functions in SQL Commonly used functions include:
More advanced statistical functions can be created using the basic statistical functions built into SQL such as calculating the weighted average or getting the z-score values by combining different functions.

V3 Spring 2018・CTL.SC4x – Technology and Systems・MITx MicroMasters in Supply Chain Management
MIT Center for Transportation & Logistics・Cambridge, MA 02142 USA ・[email protected]
This work is licensed under a Creative Commons Attribution-NonCommercial-ShareAlike 4.0 International License.
20
Sorting and Sampling Data You will also be faced with the need to sort and sample the data. Several clauses will help you will that including ORDER BY, LIMIT, and RAND. ORDER BY: The ORDER BY clause specifies that the results from a query should be returned in ascending or descending order LIMIT the number of returned records: A LIMIT clause restricts the number of records that would be returned to a subset, which can be convenient for inspection or efficiency Randomly select and order records: The RAND() function can be used to generate random values in the output or to randomly sample or randomly order the results of a query. For instance: Reorder the entire table: SELECT * FROM table ORDER BY RAND(); Randomly select a single record: SELECT * FROM table ORDER BY RAND() LIMIT 1; Generate a random number in the output results: SELECT id, RAND() FROM table;
Creating New Tables and Aliases AS Keyword (Aliases): The AS keyword creates an alias for an attribute or result of a function that is returned in a query
CREATE TABLE AS: Use CREATE TABLE with AS to create a new table in the database using a select query. It matches columns and data types based on the results in the select statement. Results from a query can be inserted into a new table using the CREATE TABLE with the AS keyword. As seen in the following: CREATE TABLE new_table AS ( SELECT column_name(s) FROM old_table);

V3 Spring 2018・CTL.SC4x – Technology and Systems・MITx MicroMasters in Supply Chain Management
MIT Center for Transportation & Logistics・Cambridge, MA 02142 USA ・[email protected]
This work is licensed under a Creative Commons Attribution-NonCommercial-ShareAlike 4.0 International License.
21
SELECT INTO: Results from a query can be inserted into an existing table using a SELECT INTO clause if the table with the appropriate structure already exists.Take the results of a select statement and put them in an existing table or database: SELECT column_name(s) INTO newtable [IN externaldb] FROM table1;
Joining Multiple Tables The relational database model allows us join multiple tables to build new and unanticipated relationships. The columns in a join must be of matching types and also must represent the same concept in two different tables. This can help us to contextualize or integrate a table in our database with data from an external source. We want to learn how to take data from different tables and combine it together. This may include data from other data sources that complement our own, such as demographic information for a zip code or price structure for shipping zones for a carrier. The process of merging two separate tables is called “joining”. Joins may be done on any columns in two tables, as long as the merge operation makes logical sense. See below for a visual representation of joining:
Columns in a JOIN
• They don’t need to be keys, though they usually are • Join columns must have compatible data types • Join column is usually key column: Either primary or foreign • NULLs will never join
Joins-visually
Twotableswithsharedfield/data
SELECT *
FROM tb1, tb2;
SELECT *
FROM tb1, tb2
WHERE tb1.bg = tb2.bg;
SELECT grey, pink
FROM tb1, tb2
WHERE tb1.bg = tb2.bg; 36

V3 Spring 2018・CTL.SC4x – Technology and Systems・MITx MicroMasters in Supply Chain Management
MIT Center for Transportation & Logistics・Cambridge, MA 02142 USA ・[email protected]
This work is licensed under a Creative Commons Attribution-NonCommercial-ShareAlike 4.0 International License.
22
Types of Joins and Views Join from 3 Tables: Joining three tables together just involves one additional join between two already joined tables and a third table. Join Types Different types of joins can be used to merge two tables together that always include every row in the left table, right table, or in both tables. The following are different types of JOIN:
• INNER JOIN: returns only the records with matching keys (joins common column values) • LEFT JOIN: returns all rows from LEFT (first) table, whether or not they match a record in
the second table • RIGHT JOIN: returns all rows from RIGHT (second) table, whether or not they match a
record in the first table • OUTER JOIN: Returns all rows from both tables, whether or not they match (Microsoft
SQL, not MySQL) • In MySQL, JOIN and INNER JOIN are equivalent
Views Views are virtual tables that do not change the underlying data but can be helpful to generate reports and simplify complicated queries. They are virtual tables that present data in a denormalized form to users. They do not create separate copies of the data (they reference the data in the underlying tables). The database stores a definition of a view and the data is updated each time the VIEW is invoked. There are several advantages to VIEWS. User queries are simpler on views constructed for them. They offers a layer of security that can restrict access to data in views for users. They also provide greater independence, meaning that the user or program is not affected by small changes in underlying tables.
Learning Objectives • Learn how to work with SELECT for conditional clauses. • Recognize the role and use of NULL values. • Review how to group data with the GROUP BY clause. • Introduce the existence of statistical functions in all SQL functions. • Recognize how to apply aggregate statistical functions. • Review sorting and sampling techniques such as ORDER BY, LIMIT and RAND. • Learn how to create new tables and aliases using the AS keyword. • Becoming familiar with joining multiple tables. • Recognize the types of JOINs. • Identify when and how to use VIEWs.

V3 Spring 2018・CTL.SC4x – Technology and Systems・MITx MicroMasters in Supply Chain Management
MIT Center for Transportation & Logistics・Cambridge, MA 02142 USA ・[email protected]
This work is licensed under a Creative Commons Attribution-NonCommercial-ShareAlike 4.0 International License.
23
Topics in Databases
Summary In this section, we will be covering some additional database topics. These topics are going to help SC professional apply databases in the real world. To learn on how to optimize performance in relationship database, this section will introduce you to indexing and its impact on performance. Then, you will learn another type of database that is recommended for cases where analytics and reporting need to be performed to help make data driven decisions. We will then move away from relationship database and explore NoSQL database. NoSQL database can offer flexibility and superiors performance for some type of applications especially in cases where data is unstructured. The next topic that we'll look at is what are the benefits of storing data and processing data on the cloud. Finally, we'll think about how to preprocess and clean our data sets before we put them into databases. This skill will be essential for us to make sure that we actually store and retrieve reasonable data every time we use our database.
Indexes and Performance The best way to improve the performance of SELECT operations is to create indexes on one or more of the columns that are tested in the query. The index entries act like pointers to the table rows, allowing the query to quickly determine which rows match a condition in the WHERE clause, and retrieve the other column values for those rows. All MySQL data types can be indexed. Primary and Foreign Keys are automatically indexed by SQL to allow them to be searched faster. Although it can be tempting to create an index for every possible column used in a query, unnecessary indexes waste space and waste time for MySQL to determine which indexes to use. Indexes also add to the cost of inserts, updates, and deletes because each index must be updated. You must find the right balance to achieve fast queries using the optimal set of indexes.
Example of Indexing Consider a Customer table that contains the following columns: Customer ID, Customer name, City, state, Postal (zip) code and Address. Customer_ID, here, is the primary key. Let us assume that we want to index State and City so that one can quickly narrow down the lists of customers in a particular state and city. This can be done by using the below syntax where IX_City_State is just the name of the index that will be created on the table “Customer” and the attributes are “State” and “City” CREATE INDEX IX_City_State ON Customer (State, City)

V3 Spring 2018・CTL.SC4x – Technology and Systems・MITx MicroMasters in Supply Chain Management
MIT Center for Transportation & Logistics・Cambridge, MA 02142 USA ・[email protected]
This work is licensed under a Creative Commons Attribution-NonCommercial-ShareAlike 4.0 International License.
24
Databases and Data Warehouses So far, we have looked at one type of databases that are known as online transaction processing, or OLTP. There is another class of database that you should be familiar with. These are known as online analytical processing or OLAP. OLTP and OLAP, each have different use case and purpose. The below tables list down the common use case and key differences between these databases:
Table: Use Cases
Table: Key Differences
Usecases
11
OLTP OLAP
Managereal-time businessoperations Perform analytics andreporting
Supportsimplementationofbusinesstasks
Supports datadrivendecisionmaking
e.g.Transactionsinanonlinestore e.g.Dataminingandmachinelearning
e.g.Dashboardshowinghealth ofbusinessoverthelastfewdays/hours
e.g.Forecastingbasedonhistoricdata
Concurrency isparamount Concurrency maynotbeimportantKeydifferences
12
OLTP OLAP
Optimized forwrites(updatesandinserts)
Optimized forreads
Normalizedusingnormalforms,fewduplicates
Denormalized,manyduplicates
Fewindexes,manytables Manyindexes,fewertables
Optimizedforsimplequeries Usedforcomplexqueries
Uncommontostore metricswhichcanbederivedfromexistingdata
Commontostorederivedmetrics
Overall performance:Designedtobevery fastforsmallwritesandsimplereads
Overallperformance:Designed tobeveryfastforreadsandlargewrites,howeverrelativelyslowerbecausedatatendstobemuchlarger

V3 Spring 2018・CTL.SC4x – Technology and Systems・MITx MicroMasters in Supply Chain Management
MIT Center for Transportation & Logistics・Cambridge, MA 02142 USA ・[email protected]
This work is licensed under a Creative Commons Attribution-NonCommercial-ShareAlike 4.0 International License.
25
NoSQL Database A NoSQL database provides a mechanism for storage and retrieval of data that is modeled in means other than the tabular relations used in relational databases. Unlike SQL, the data in NoSQL database is unstructured and is not stored in tables. NoSQL databases uses other mechanisms to store data, some of which are discussed in the next section. A NoSQL database offers the following benefits over a SQL database:
• NoSQL may be faster in some use cases. Simple reads and writes are very fast with NoSQL solutions
• NoSQL databases are flexible compared to SQL database sand allow storage of data when the relationship between many of entities is not clear.
• NoSQL databases are easy to scale because of their simplified structure. Transactional business data is still commonly stored in relational databases due to consistency and how reads and writes are handled
Types of NoSQL database Key-value database
• The least complex NoSQL option, which stores data in a schema-less way that consists of indexed keys and values.
• Each record may have different data fields or attributes, which are stored together with a unique key
• Data model is not predefined, empty fields are not stored
Document-Oriented database
• Similar to key-value concept but adds more complexity. • sEach document (grouping of key value pairs, also known as collection)
in this type of database has its own data, and its own unique key, which is used to retrieve it.
CommontypesofNoSQLdatabases
• Key-valuedatabase– "look-uptable"or"dictionary"
n SimplestexamplescanbemademorecomplexwithformatslikeJSON
n Eachrecordmayhavedifferentdatafieldsorattributes,whicharestoredtogetherwithauniquekey
n Datamodelisnotpredefined,emptyfieldsarenotstored
17
Key Value
1000 Chris
1001 Julie
1002 Clark
1003 MA
Key Value
1000 {name:"Chris", language:"English",city:"Boston",state:"MA"}
1001 {name:"Julie",state:"NY"}
1002 {name: "Clark",language:"French",language:"Spanish"}

V3 Spring 2018・CTL.SC4x – Technology and Systems・MITx MicroMasters in Supply Chain Management
MIT Center for Transportation & Logistics・Cambridge, MA 02142 USA ・[email protected]
This work is licensed under a Creative Commons Attribution-NonCommercial-ShareAlike 4.0 International License.
26
Column-oriented database
• Stores data tables as columns rather than rows. Each row is indexed and thus has “RowID”
• "RowID" acts as the "key" and the attribute acts as the "value" • Now information about each column is stored more efficiently for
some queries, allowing for excellent scalability and high performance.
Graph database • Stores data that’s interconnected and best represented as a graph
• This method is capable of lots of complexity
CommontypesofNoSQLdatabases
• Graphdatabase
n Connectionsexist,andarenotcreatedduringquerylikearelationaldatabase,efficientforhighlyconnectedsystems
20https://neo4j.com/developer/graph-database/

V3 Spring 2018・CTL.SC4x – Technology and Systems・MITx MicroMasters in Supply Chain Management
MIT Center for Transportation & Logistics・Cambridge, MA 02142 USA ・[email protected]
This work is licensed under a Creative Commons Attribution-NonCommercial-ShareAlike 4.0 International License.
27
Cloud Computing Cloud computing enables users and enterprises to access shared pools of resources (such as computer networks, servers, storage, applications and services) over the internet. Cloud computing offers various benefits over traditional systems, including:
• Low start-up cost • Low risk development and testing • Managed hardware (and software) • Global reach • Highly available and highly durable • Scale on demand, pay for what you use • In some cases, can work with local infrastructure if needed
Types of Cloud Computing
Infrastructure as a service (IaaS)
• Outsource hardware • User provides operating system, database, app, etc. • Most flexible, higher upfront total IT cost • Example: Rackspace
Platform as a service (PaaS) • Outsource operating environment • Cloud platform provides OS, database, etc. • Examples: Amazon, Microsoft, Google
Software as a service (SaaS) • Outsource software • Configure the third party app • Examples: Salesforce, HubSpot • Least flexible, lower upfront total IT cost
Data Cleaning Data must be cleaned or pre-processed before it can be inserted into a database. This is a time consuming but a mandatory exercise, as the quality of the database depends on the integrity of the data.
Types of data cleaning solutions Data cleaning can be performed with free software and tools, however the learning curve for these can be steeper than that of commercial software. These options are listed below:

V3 Spring 2018・CTL.SC4x – Technology and Systems・MITx MicroMasters in Supply Chain Management
MIT Center for Transportation & Logistics・Cambridge, MA 02142 USA ・[email protected]
This work is licensed under a Creative Commons Attribution-NonCommercial-ShareAlike 4.0 International License.
28
Off the shelf software • Graphical user interfaces, no programming required, enables collaboration with non-programmers
• Offer various advance features including capability to operate on large data set, reproducible workflow and version control
• Software is not free • Examples: Trifacta, Paxata, Alteryx, SAS
Open-source programming languages
• Working in data frames and data dictionaries, requires some programming skills, but languages are relatively google- friendly
• Offers the same benefits as “Off the shelf software” but requires programming experience and can be sometime time consuming.
• Software is free
Unix command line tools
• Not as user friendly as previous options, but very fast and versatile
• Excellent for breaking up large datasets that would crash other software
• Software is free and often built in the OS.
Learning Objectives • Understand Indexing and its impact on performance. • Introduce online transaction Processing(OLTP) and online analytical processing (OLAP) • Review use cases and key differences of OLTP and OLAP • Introduce NoSQL database • Review various types of NoSQL databases. • Introduce Cloud computing and review types of services offered through cloud. • Become familiar with advantages of cloud computing. • Recognize importance of data cleaning

V3 Spring 2018・CTL.SC4x – Technology and Systems・MITx MicroMasters in Supply Chain Management
MIT Center for Transportation & Logistics・Cambridge, MA 02142 USA ・[email protected]
This work is licensed under a Creative Commons Attribution-NonCommercial-ShareAlike 4.0 International License.
29
Introduction to Machine Learning
Summary In this lesson, we explore machine learning. This includes identifying when we need machine learning instead of other techniques such as regression. We break down the different classes of machine learning algorithms. In addition, we identify how to use machine-learning approaches to make inferences about new data.
Review of Regression Linear regression uses the value of one or more variables to make a prediction about the value of an outcome variable. Input variables are called independent variables and the output variable is known as the dependent variable.
• Linear regression output includes coefficients for each independent variable. o This is a measure of how much an independent variable contributes to the
prediction of the dependent variable. o The output also includes metrics to be able to assess how the model fits the
data. The better fit of the model, the better you are able to make accurate predictions about new data.
• Using coefficients calculated from historic data, a regression model can be used to make predictions about the value of the outcome variable for new records.
Overview of Machine Learning Algorithms Machine learning algorithms are primarily use to make predictions or learn about new, unlabeled data. There are several classes of algorithms:
• Classification: assigning records to pre-defined discrete groups
• Clustering: splitting records into discrete groups based on similarity; groups are not known a priori
• Regression: predicting value of a continuous or discrete variable
• Associate learning: observing which values appear together frequently
Supervised vs. Unsupervised Machine Learning Supervised learning uses outcome variables, known as labels, for each record to identify patterns in the input variables or features related to the outcome variable.
• Correct answer, label is known in the training data
• Label is applied by a person or already exists
• Labeled data are used to train an algorithm using feedback
• Apply or test the trained model on new, unseen data to predict the label

V3 Spring 2018・CTL.SC4x – Technology and Systems・MITx MicroMasters in Supply Chain Management
MIT Center for Transportation & Logistics・Cambridge, MA 02142 USA ・[email protected]
This work is licensed under a Creative Commons Attribution-NonCommercial-ShareAlike 4.0 International License.
30
Learning Flow
In unsupervised learning, the outcome variable values are unknown, therefore relationships among the input variables are used to identify patterns of clusters of records.
• Finds previously unknown patterns in the data without labels or guidance
• No training/testing/validating process because correct answer is unknown
Model Quality Machine learning models should be trained on an unbiased set of data that is representative of the variance in the overall dataset. Bias quantifies the lack of ability of a model to capture underlying trend in the data. More complex models decrease bias but tend to increase variance. Variance quantifies a model’s sensitivity to small changes in the underlying dataset.
• Ideally we want low bias and low variance, but there is a tradeoff between the two quantities
• If there is a bias in the training data or if too many features are included in a model, the model is at risk of being overfit. In overfit models, the coefficients, known as parameters, will not be generalizable enough to make good predictions for new records.
• A large and representative sample of the labeled data should be used to train the model, the remainder is used for testing.
Supervisedlearningworkflow
16
RawData
Algorithm(Training)
Labels
Model
EvaluaBon
UnlabeledData
Model
PredicBon
Training MakingPredicBons
Supervisedlearningworkflow
16
RawData
Algorithm(Training)
Labels
Model
EvaluaBon
UnlabeledData
Model
PredicBon
Training MakingPredicBons
Unsupervisedlearningworkflow
RawData
Algorithm
Model
Produc<on
17
Learning Flow

V3 Spring 2018・CTL.SC4x – Technology and Systems・MITx MicroMasters in Supply Chain Management
MIT Center for Transportation & Logistics・Cambridge, MA 02142 USA ・[email protected]
This work is licensed under a Creative Commons Attribution-NonCommercial-ShareAlike 4.0 International License.
31
Overfitting vs underfitting • Underfitting – model is too simple, high bias and low variance
• Overfitting – model is too complex, low bias and high variance o Overfitting is a more common pitfall o Tempting to make models fit better by adding more features o Results in a model that is incapable of generalizing beyond the training data
Learning Objectives • Be introduced to machine learning
• Become familiar with different types of machine learning algorithms
• Be able to differentiate supervised and unsupervised learning and their processes
• Recognize model quality and the tradeoffs between bias and variance
• Learn how to identify when a model is over or underfit

V3 Spring 2018・CTL.SC4x – Technology and Systems・MITx MicroMasters in Supply Chain Management
MIT Center for Transportation & Logistics・Cambridge, MA 02142 USA ・[email protected]
This work is licensed under a Creative Commons Attribution-NonCommercial-ShareAlike 4.0 International License.
32
Machine Learning Algorithms
Summary In this lesson, we are going to dive deeper into machine learning algorithms. Each model has different properties and is best for different types of tasks. We review how to compare them with performance metrics. We need to be able to group records together without labels to inform prediction using unsupervised classification. In addition, we review capability to confidently reduce the number of features included in an analysis without losing information. The lesson also introduces how to compare predictor accuracy and test for sensitivity and specificity.
Dimensionality reduction Dimensionality reduction is a term for reducing features included in analysis. It is often needed for analysis with many features. Trying to reduce dimensionality randomly or manually leads to poor results
• Results need to be interpreted by humans, should be tractable
• Increasing the number of features included increases the required sample size
• Features should not be included or discarded from analysis based on instinct o Dimensionality reduction techniques should be employed, such as principal
component analysis.
• Summary statistics are a means of dimensionality reduction
Principal component analysis (PCA) PCA is a mathematical approach to reduce dimensionality for analysis or visualization. It exploits correlations to transform the data such that the first few dimension or features contain a majority of the information of variance in the dataset. PCA determines which variables are most informative based on the distribution of data and calculates the most informative combinations of existing variables within the dataset. PCA works well for datasets with high dimensionality.
• No information is lost, first few components hold much of the information
• Same premise as linear regression except without a dependent variable o Linear regression solution is the first principal component o Disregarding the information describing the principal component, PCA calculates
the second most informative component, then the third, and so on
• Linear combinations form a set of variables that can be used to view the data – new axes
• Components are ranked by importance, so all but the first few can be discarded, leaving only the most important information with very few components
• The coefficients in the table give the proportion of each of the original variables that went into each component

V3 Spring 2018・CTL.SC4x – Technology and Systems・MITx MicroMasters in Supply Chain Management
MIT Center for Transportation & Logistics・Cambridge, MA 02142 USA ・[email protected]
This work is licensed under a Creative Commons Attribution-NonCommercial-ShareAlike 4.0 International License.
33
• Relative signs +/- indicate that two variables are positively negatively correlated in that particular component
• The components are difficult to interpret using only the coefficient values, plotting often improves understanding
PC1 = (a*var1 + b*var2 + c*var3 + …) PC2 = (d*var1 + e*var2 + f*var3 + …) PC3 = (g*var1 + h*var2 + i*var3 + …)
Clustering Another way of thinking about dimensionality reduction is how close each point is to other points. The idea is to separate data points into a number of clusters that have less distance between the points internally than to other clusters. Clustering can be helpful to identify groups of records that have similar characteristics to one another. When data is unlabeled, clustering can be used to group records together for deeper inspection. Upon deeper inspection of the records in each cluster, users can understand the patterns that lead to records being grouped together, and also identify reasons for records being grouped separately.
K-means clustering k-means clustering starts with selecting the number of clusters, k. k cluster-centers are placed randomly in the data space and then the following stages are performed repeatedly until convergence. K-means does not determine the appropriate number of clusters, this is set by the user based on intuition or previous knowledge of the data The algorithm can terminate with multiple solutions depending on initial random positions of cluster-centers and some solutions are better than others.
• Data points are classified by the center to which they are nearest
• The centroid of each cluster is calculated
• Centers are updated to the centroid location
Classifications • Clustering and PCA allow users to see patterns in the data, which is the best that can be
done because there are no labels to guide the analysis
• With supervised learning, the label is included in the learning process: o Unsupervised: what features are most important or interesting? o Supervised: what features are most informative about the differences between
these groups?
• Classification methods: each record falls into some category or class, predict the category of a new record based on values of other features in the record
• Regression methods: one variable depends on some or all of others, predict the value of the dependent variable based on the values of the independent variables

V3 Spring 2018・CTL.SC4x – Technology and Systems・MITx MicroMasters in Supply Chain Management
MIT Center for Transportation & Logistics・Cambridge, MA 02142 USA ・[email protected]
This work is licensed under a Creative Commons Attribution-NonCommercial-ShareAlike 4.0 International License.
34
Classification Trees Classification trees split data to find optimal values for features, used to split data by class. Tree diagrams show the class makeup of each node, and the relative number of data points that reach each node
• Tree pruning o Tree pruning removes rules associated with overfitting from the tree o The new tree misses a few points classified correctly, but contains only meaningful
rules, more generalizable to new data
Naïve Bayes classifier • The Naïve Bayes algorithm considers the value of each feature independently, for each
record, and computes the probability that a record falls into each category
• Next, the probabilities associated with each feature are combined for each class according to Bayes' rule to determine the most likely category for each new record
• Almost completely immune to overfitting - Individual points have minimal influence; Very few assumptions are made about the data
Random forest Random forest is an ensemble classifier that uses multiple different classification trees. Trees are generated using random samples of records in the original training set. Accuracy and information about variable importance is provided with the result.
• No pruning necessary
• Trees can be grown until each node contains very few observations
• Better prediction than classification
• No parameter tuning necessary

V3 Spring 2018・CTL.SC4x – Technology and Systems・MITx MicroMasters in Supply Chain Management
MIT Center for Transportation & Logistics・Cambridge, MA 02142 USA ・[email protected]
This work is licensed under a Creative Commons Attribution-NonCommercial-ShareAlike 4.0 International License.
35
Comparing predictor accuracy Cross - validation
• Models should be good at making classifications of unlabeled data, not describing data that is already classified.
• Randomly divide data into a training set and a test set o Hide test set while building the tree o Hide training set while calculating accuracy o Computed accuracy represents accuracy on unseen data
• Techniques are available to do this multiple times, ensuring each record is in the test set exactly once, e.g. k-folds
Comparing models • Several standard measures of performance exist, can run multiple models and compare
metrics: o Accuracy o Precision o Recall o And more
• Application drives which performance metrics are most important for a given task
Sensitivity and specificity Sensitivity and specificity are statistical measures of the performance of a classification test. Sensitivity measures the proportion of positives results that are categorized correctly. Specificity measures the proportion of negatives results that are categorized correctly. So for example, if you needed to measure, say, the ability of a test to always detect a problem, you would look at sensitivity. Or if you need to look at the performance of those classifiers at not generating false positive classifications, then specificity. See example below:

V3 Spring 2018・CTL.SC4x – Technology and Systems・MITx MicroMasters in Supply Chain Management
MIT Center for Transportation & Logistics・Cambridge, MA 02142 USA ・[email protected]
This work is licensed under a Creative Commons Attribution-NonCommercial-ShareAlike 4.0 International License.
36
The ROC Curve • The Receiver Operating Characteristic (ROC) curve plots the true positive rate
(Sensitivity) versus the false positive rate (100 - Specificity) for different cut-off points • Each point on the curve represents a pair of sensitivity/specificity values corresponding
to a particular decision threshold • A test with perfect discrimination (no overlap in the two distributions) has an ROC curve
that passes through the upper left corner (100% sensitivity, 100% specificity) • The closer the ROC curve is to the upper left corner, the higher the overall accuracy of
the test
Confusion Matrix A confusion matrix is a table that is often used to describe the performance of a machine learning algorithms on a set of test data for which the true values are known. Below is an example confusion matrix:
Predicted High Predicted Low Actual High 100 20
Actual low 10 200
The table tells us the below about the classifier: • There are two possible predicted classes: "high" and "low". If we were predicting the
average spending by a user then a “high” will imply these customers are high spender, and “low” will mean they are low spender.
• The classifier made a total of 330 predictions • Out of those 330 cases, the classifier predicted "high" 110 times, and "low" 220 times. • In reality, 100 patients in the sample are high spenders, and 200 are low spenders.

V3 Spring 2018・CTL.SC4x – Technology and Systems・MITx MicroMasters in Supply Chain Management
MIT Center for Transportation & Logistics・Cambridge, MA 02142 USA ・[email protected]
This work is licensed under a Creative Commons Attribution-NonCommercial-ShareAlike 4.0 International License.
37
Learning Objectives • Be further introduced to machine learning algorithms and how to work with them
• Become familiar with dimensionality reduction and when and how to use it
• Recognize when to use clustering as an approach to dimensionality reduction
• Review different classification methods such as classification tress and random forest
• Learn how to compare predictor accuracy
• Become familiar with sensitivity and specificity as indicators of a binary classification test

V3 Spring 2018・CTL.SC4x – Technology and Systems・MITx MicroMasters in Supply Chain Management
MIT Center for Transportation & Logistics・Cambridge, MA 02142 USA ・[email protected]
This work is licensed under a Creative Commons Attribution-NonCommercial-ShareAlike 4.0 International License.
38
Supply Chain Systems - ERP
Summary In this next segment, we explore supply chain IT systems. Supply chains are essentially made up of three flows: information, material, and money. IT systems support the information flow. For example, in a supermarket, the systems have to deal with different types of supply chain data such as supplier inventory, facility management and payroll, sales, and expired and obsolete inventory. There are many daily transactions in a supermarket that need to be captured and ensured for consistency and timeliness. That information needs to be somehow translated into usable information for business decisions, and then these objectives need to be efficiently achieved. The amount of information for transactions per week in a single supermarket can number in the millions. This is for a single store. On an enterprise level, companies need systems that help them manage and organize this information for use. While supply chains are always portrayed as neat and linear systems, the reality is much different, as we have learned over the previous courses. Flows move up and down the chain and through many partners until they reach their final destination. Supply chains need IT systems because while teams may sit in different functional units they frequently need to share information. In addition, many different firms interact in the supply chain, they need systems to carry that information between them, this helps de-silo the supply chain. There needs to be coordination across functions, which is the essence of supply chain management and can be facilitated with systems like Enterprise Resource Planning (ERP).
Supply Chain IT Systems Supply chains need IT systems because they are large, complex and involve many players. They often become intertwined and individual actors impact others. Decision-making is based on common data and interaction with other functions in a firm. IT systems because supply chains enable B2B, B2C, M2M and many other interactions. (B2B = business to business, B2C = Business to Consumer, M2M = machine to machine) Enterprise Resource Planning (ERP) systems serve as a general ledger and central database for all firm activity. The next are Supply Chain Planning Systems. These systems are primarily for production planning and scheduling, demand planning and product lifecycle management. The last are for Supply Chain Execution; which are transportation and warehouse management systems and manufacturing systems. The first we will tackle are Enterprise Resource Planning systems.
Enterprise Resource Planning In the following section we cover why firms use ERPs; the core functions of ERPs; data needed; communications of the systems; and strategic benefits of an ERP. Most firms have an ERP because many functions in a firm such as sales, inventory, production, finance, distribution, and

V3 Spring 2018・CTL.SC4x – Technology and Systems・MITx MicroMasters in Supply Chain Management
MIT Center for Transportation & Logistics・Cambridge, MA 02142 USA ・[email protected]
This work is licensed under a Creative Commons Attribution-NonCommercial-ShareAlike 4.0 International License.
39
human resources have siloed databases. With a centralized ERP, these databases can more easily be exchanged and shared. Benefits of ERPs allow enterprises to organize processes and data structure, integrate information into a unified repository, make data available for many users, eliminate redundant systems and data, reduce non-value-added tasks, standardize process designs, as well as be more flexible. But there are significant drawbacks to using ERP too. These include: significant implementation time and maintenance that come at a cost, data errors ripple through systems, competitive advantage can be dampened, firm reliance on a single vendor, shortage of personnel with technical knowledge of system, and high impact of down time of said system.
ERP Core Functions Most ERP Systems share the same core functions. They tie together and automate enterprise-wide basic business processes: Customer Management is the face to consumers and serves the following functions:
• enables order entry, order promising, open order status
• allows marketing to set pricing schemes, promotions, and discounts
• provides real-time profitability analysis,
• permits order configuration, customer delivery schedules, customer returns, tax management, currency conversion, etc.
Manufacturing is the face to production and serves the following functions:
• includes MRP processing, manufacturing order release, WIP management, cost reporting, shop floor control etc.,
• provides real time linkage of demand to supply management enabling real time Available-to-Promise (ATP) & Capable-to-Promise (CTP),
• serves as primary interface to “bolt-on” advanced planning and scheduling optimization modules.
Procurement is the face to suppliers and serves the following functions:
• integrates procurement with supplier management,
• facilitates purchase order processing, delivery scheduling, open order tracking, receiving, inspection, and supplier performance reporting, and
• creates requests for quotation (RFQ)
• manages negotiation and pricing capabilities. Logistics is the face to internal and external supply chain and serves the following functions:
• runs the internal supply chain for enterprise,
• provides connectivity to remote trading partners (3PLs, carriers, etc.),
• handles distribution channel configuration, warehouse activity management, channel replenishment, planning, distribution order management, etc., and
• serves as primary interface to “bolt-on” warehouse and transportation management systems (WMS and TMS).
Product Data is the face to all material and serves the following functions:
• describes products manufacturer and/or distributor,
V3 Spring 2018・CTL.SC4x – Technology and Systems・MITx MicroMasters in Supply Chain Management
MIT Center for Transportation & Logistics・Cambridge, MA 02142 USA ・[email protected]
This work is licensed under a Creative Commons Attribution-NonCommercial-ShareAlike 4.0 International License.
40
• contains proprietary data on costs, sources, engineering details, dimensions, weight, packaging, etc.,
• interfaces with inventory, manufacturing, and product lifecycle management, and
• sometimes included in partner collaborations in order to compress time to market of new products.
Finance is the face to the CFO and serves the following functions:
• provides real-time reporting of all transactions resulting from inventory movement, accounts receivable, accounts payable, taxes, foreign currency conversions, and any other log entries, and
• supports detailed reporting and budgeting capabilities. Asset Management is the component that controls key assets.
• controls enterprise’s fixed assets
• established and maintains equipment profiles, diagnostics and preventive maintenance activities, and depreciation activities.
Human Resources is the face to employees.
• manages all aspects of human capital with enterprise
• monitors performance of transaction activities to include time, payroll, compensation, expenses, recruitment, etc.
• supports employee profiles, skill development, career planning, performance evaluations, and retention.
ERP Data There are three types of ERP Data: Organization data: represents and captures the structure of an enterprise. Master data: represents entities (customers, vendors) with processes. It is the most commonly used. But because specific processes use materials differently and specific data needs differ by processes – this adds to complexity of master data needs. Material types can be in different states and can be grouped differently based on firm needs. Transaction data: reflects the outcome of executing process steps. It comes in organizational, master and situational data. Transaction documents include purchase orders, invoices, etc.
ERP Communication Business-to-Business (B2B): Commerce transactions between manufacturers, wholesalers, retailers. Each business represents a link in the supply chain. Business-to-Consumer (B2C): Sale transactions between firms and end-consumers. The volume of B2B transactions is much greater than B2C. Accelerating and validating B2B and B2C transactions: For B2B this is achieved through Electronic Data Interchange (EDI). For B2C this is achieved through a website and email.

V3 Spring 2018・CTL.SC4x – Technology and Systems・MITx MicroMasters in Supply Chain Management
MIT Center for Transportation & Logistics・Cambridge, MA 02142 USA ・[email protected]
This work is licensed under a Creative Commons Attribution-NonCommercial-ShareAlike 4.0 International License.
41
Electronic Data Interchange (EDI): “The computer-to-computer interchange of strictly formatted messages that represent documents other than monetary instruments.” There is no human intervention in the process. ERP systems can “communicate” via EDI, sharing near real-time information. See figure below.
The Value of ERP for SCM There are three important values of ERP for supply chain management: reduction of the bullwhip effect, enabling widespread analytics, and extending the enterprise.
Reducing the Impact of Bullwhip Effect One of the key values of an ERP system is reducing or preventing the Bullwhip Effect. The Bullwhip Effect is phenomenon where information distortion leads to increasing order fluctuations in the upstream supply chain (forecast-driven supply chains). It is driven by several behavioral causes like overreaction to backlogs and lack of transparency. There are also many operational errors such as forecasting errors, lead-time variability, and promotions. ERP can reduce the impact of the Bullwhip Effect by extending visibility downstream to customer demand and upstream to participants enabling collaboration and information sharing. It also facilitates point of sale capturing and helps reduce batch size and demand variability through smaller and more frequent orders.
Enabling Analytics ERP systems play a key role in enabling analytics. They are primarily retrospective, serve as the ledger of the firm, and provide the CFO with financial snapshots. They also enable other forms of analytics for Business Intelligence (BI): which transforms raw data into meaningful information to improve business decision-making. These can be descriptive, predictive, and prescriptive.
MIT Center for
Transportation & Logistics
§ B2BEDIexample:
§
§
§
§

V3 Spring 2018・CTL.SC4x – Technology and Systems・MITx MicroMasters in Supply Chain Management
MIT Center for Transportation & Logistics・Cambridge, MA 02142 USA ・[email protected]
This work is licensed under a Creative Commons Attribution-NonCommercial-ShareAlike 4.0 International License.
42
Extending Enterprise While ERP systems are primarily used in intra-firm process management to connect various departments and provide access to data, they also serve an extending function for better connection with partners. ERPs serve a value in connecting End to End Supply Chains with better connections across SC participants, providing shared understanding, reducing coordination and monitoring costs, and responding quickly to market feedback.
Learning Objectives • Introduction to supply chain IT systems, their value, application, and constraints.
• Review ERP, its setup functionality, and applications.
• Recognize core functions of ERP.
• Review how that data is used to facilitate communication.
• Understand some of the value of ERP systems for supply chains.

V3 Spring 2018・CTL.SC4x – Technology and Systems・MITx MicroMasters in Supply Chain Management
MIT Center for Transportation & Logistics・Cambridge, MA 02142 USA ・[email protected]
This work is licensed under a Creative Commons Attribution-NonCommercial-ShareAlike 4.0 International License.
43
Supply Chain Systems - Supply Chain Modules
Summary In this next segment we review different supply chain modules as a subset of supply chain IT systems. To understand where we are now with supply chain IT systems we need to review the evolution of supply chain tools. We journey from the 1960-70’s with the Bill of Materials Processor, mainframes based database systems, and material requirements planning (MRP) to the 1980’s with the second coming of MRP that added finance and marketing, Just-In-Time manufacturing methodology, expansion to other functions, and the precursor to the ERP systems of today. In the 1990s, most MRP systems were absorbed into ERP suites; there was the introduction of Advance Planning Systems (APS), and wider adoption of ERP systems. In the 2000s, many of these systems adopted web-based interfaces, improved communication, and adopted shared or cloud based solutions. There was also a major consolidation of supply chain software vendors and expansion of ERP systems to include SCM. Now as we explore how to further extend the enterprise and its ability to adequately manage its information on its own and together with other companies, many firms use a series of IT modules. These systems are sometimes a part of ERP, may be standalone applications, or can be part of a larger supply chain ecosystem. We will review two main functionalities including Advance Planning Systems (APS) and Execution Applications. Advanced Planning Systems (APS) are long range, optimization based decision support tools while execution applications include Warehouse Management Systems (WMS), Transportation Management Systems (TMS), and Manufacturing Execution Systems (MES).
Planning vs. Execution Although planning modules seek to enable future planning and enabling efficient processes, there is often a gap between the planning and execution tasks. The figure below illustrates this gap.
MIT Center for
Transportation & Logistics
Planning vs. Execution
ROA Impact
Fleet Routing/ Scheduling
Shipment Consolidation
& Carrier
Selection
Tactical Transportation Modeling
Supply Chain
Strategy/ Network
Design
Transportation Procurement
Planning Tasks
Execution Tasks
Consists of a continuum of tasks, but . . .
. . . there is a gap!

V3 Spring 2018・CTL.SC4x – Technology and Systems・MITx MicroMasters in Supply Chain Management
MIT Center for Transportation & Logistics・Cambridge, MA 02142 USA ・[email protected]
This work is licensed under a Creative Commons Attribution-NonCommercial-ShareAlike 4.0 International License.
44
Questions, Approaches, and Technologies Change based on timeframe Questions can be strategic such as: “What carriers should I partner with and how?” “How should I flow my products?” or they can be tactical such as: “How can I quickly secure rates for a new DC/plant/lane?” “What lanes are having performance problems?” or operational: “Which carrier should I tender this load to?” “How can I collaboratively source this weeks’ loads?” The timeframe also drives the approach. For instance in the strategic face – a company will be establishing a plan and strategy, have event based enablement and complete non-routine analysis. In an operational timeframe they will be executing the strategic plan, operate on transaction based rules and processes, and have automated actions. And technologies also align with timeframes. For instance, strategic timeline will allow for analysis engines tools like optimization, simulation and data analysis and communication via the web, file exchange and remote access. The tactical timeline allows for the same analysis and communication technologies while the operational timeline allows for communication but also workflow software such as compliance tracking, rules, and transaction processing.
Advanced Planning Systems We now take a closer look at advanced planning systems that are primarily used as decision support systems. They typically include functionality for network design, demand planning, production planning, production scheduling, distribution planning, and transportation planning. Advanced Planning Systems utilize large scale mixed integer linear programs (MILPs) and sometimes simulation.
Planning Horizons Advance Planning Systems help with planning horizons. The following provide a rough guideline but each firm differs and it is unique to specific industries.:
• 3 months out – Master Production Schedule (MRP, DRP) o <4 weeks out - Frozen MPS o 5 to 8 weeks out – Slush MPS – some changes allowed (+- 10%) o >8 weeks out – Water MPS – more changes are allowed (+- 30%)
• 3-18 months out – Aggregated Planning
• >18 months out – Long Range Planning – Network Design, etc.
Flow Inputs (from ERP or other systems): Current costs, manufacturing and storage capacities, consensus forecast, sales orders, production status, purchase orders, and inventory policy recommendations, etc. Decision Process: Large scale optimization (MILP) across multiple facilities and time horizons in a single planning run; unconstrained, constrained, and optimal plans

V3 Spring 2018・CTL.SC4x – Technology and Systems・MITx MicroMasters in Supply Chain Management
MIT Center for Transportation & Logistics・Cambridge, MA 02142 USA ・[email protected]
This work is licensed under a Creative Commons Attribution-NonCommercial-ShareAlike 4.0 International License.
45
Outputs: Demand forecast and plan for meeting demand; a feasible production plan for future periods to include allocation of production to plants; allocation of orders to suppliers; identification of bottlenecks; Root Cause Analysis.
Transportation Management Systems (TMS) TMS is software that facilitates procurement of transportation services, short-term planning and optimization of transportation activities, assets, and resources, and execution of transportation plans (Gonzalez 2009). It is often geographic and mode specific. The core functions of TMS are: transportation procurement; mode and carrier selection; carrier communication; routing guide generation and maintenance; fleet management; audit, payment, and claims; appointment scheduling; yard management; and route planning.
Transportation Execution The TMS serves as the interface to the carriers while connecting the Order Management System (OMS), Payment Systems, and the ERP. Its main objective is to: move products from initial origin to final destination cost effectively while meeting the level of service standards and executing the plan using the procured carriers. This is broken down in phases below: PLAN: Create Shipments from Orders EXECUTE: Select and tender to Carriers MONITOR: Visibility of the status of Shipments RECONCILE: Audit invoices and pay for Transportation There are many considerations to be made in TMS such as:
▪ How do orders drop? Batched vs Continuous? ▪ How much time is allowed between drop and must-ship? Weeks? Days? Hours?
Minutes? ▪ What percentage of orders change after release? ▪ How do they change? Quantity? Mix? Destinations? Timing? ▪ What is the length of haul? ▪ How many orders are “in play” at any time?
There are also key decisions like carrier selection and load building.
TMS Carrier Communication & Selection Useful EDI Transaction Sets
• 204 – Motor Carrier Load Tender: Used by shippers to tender an offer for a shipment to a full truckload motor carrier. It may be used for creating, updating or replacing, or canceling a shipment.
• 990 - Response to a Load Tender: Used by motor carriers to indicate whether it will pick up a shipment offered by the shipper
• 214 - Transportation Carrier Shipment Status Message: Used by carriers to provide shippers and consignees with the status of their shipments.

V3 Spring 2018・CTL.SC4x – Technology and Systems・MITx MicroMasters in Supply Chain Management
MIT Center for Transportation & Logistics・Cambridge, MA 02142 USA ・[email protected]
This work is licensed under a Creative Commons Attribution-NonCommercial-ShareAlike 4.0 International License.
46
Example of carrier selection
Linking Approaches
Warehouse Management Systems & Automation WMS is a software system that facilitates all aspects of operations within a warehouse or distribution center and integrates with other systems. It is not the same as inventory management systems; WMS complements IMS. Examples of the benefits of a WMS include: real-time stock visibility and traceability, improved labor productivity, and improved customer
MIT Center for
Transportation & Logistics
Approaches Must Be Linked
26
Contract Dynamic
Static
Dynamic
Ho
w d
o I
sele
ct
ea
ch
ca
rrie
r?
How do I price each load?
I
III
II
IV
Strategic Lane Assmt
Strategic Lane Assmt
w/ Tier Pricing
Dynamic Pricing in Private Exchange
Flexible Assmt Dynamic Carrier
Selection
Tier I Uses strategic routing guide
Tier III Spot execution – highly variable Tier II
Increased flexibility in execution
V3 Spring 2018・CTL.SC4x – Technology and Systems・MITx MicroMasters in Supply Chain Management
MIT Center for Transportation & Logistics・Cambridge, MA 02142 USA ・[email protected]
This work is licensed under a Creative Commons Attribution-NonCommercial-ShareAlike 4.0 International License.
47
service. Some of these benefits are closely tied to automation of material handling and paperless device interfaces. Examples of Warehouse Automation include: Automatic identification technologies: Bar codes and bar code scanners, radio frequency tags (RFID) and antennae, smart cards and magnetic stripes, vision systems. Automatic communication technologies: Radio frequency data communications, synthesized voice, virtual displays, pick to light / voice systems Automated material handling technologies: Carousels, conveyors/robotics, flow racks, AS/AR Systems
WMS Software Components Order Processing
• Order checking & batching
• Allocation
• Auto-replenishment Receiving
• ASN planning
• In-bound tracking
• Delivery appointment scheduling
• PO verification
• Returns processing Put-Away
• Palletizing
• Zoning and slotting
• Random/directed put away
• Routing for putaway & replenishment Picking
• Batch/Wave/Zone/Directed picking
• Carton/pallet select
• Assembly/kitting
• Pick-to-light/voice Shipping
• Pallet sequencing & Load planning
• Pallet layering
• Trailer management Labor Management
• Individual/team performance mgmt
• Labor scheduling
• Time standards Equipment Support
• Interface to automated equipment
• Equipment maintenance

V3 Spring 2018・CTL.SC4x – Technology and Systems・MITx MicroMasters in Supply Chain Management
MIT Center for Transportation & Logistics・Cambridge, MA 02142 USA ・[email protected]
This work is licensed under a Creative Commons Attribution-NonCommercial-ShareAlike 4.0 International License.
48
Manufacturing Execution Systems MES is a software system that manages and monitors all work-in-process (WIP) in the production process. It is integrated with the ERP to manage the execution of release of production orders to finished goods delivery, trigger supply chain replenishments, and enhance product traceability through manufacturing. The functionality of a MES includes:
• Machine scheduling
• Process management
• Document control
• Labor management
• Inventory management
• Product (WIP) tracking
• Performance analysis
• Labor management
• Quality management
• Production reporting
Learning Objectives
• Become familiar with systems that are common in supply chains that extend the enterprise.
• Differentiate between Advanced Planning Systems and Execution Systems.
• Recognize the gaps in planning vs. execution and the timeframes embedded in both.
• Review Advanced Planning Systems, their use and application.
• Become familiar with the main execution systems in SC such as TMS, WMS, and MES.
V3 Spring 2018・CTL.SC4x – Technology and Systems・MITx MicroMasters in Supply Chain Management
MIT Center for Transportation & Logistics・Cambridge, MA 02142 USA ・[email protected]
This work is licensed under a Creative Commons Attribution-NonCommercial-ShareAlike 4.0 International License.
49
Supply Chain Systems - Supply Chain Visibility
Summary In this next segment, we will introduce the concept of supply chain visibility. Supply chain visibility provide us with a process of determining the current and past locations (and other information) of an item within the supply chain. The two major components of a supply chain visibility are track and trace. Tracking gives us the capability to follow the route of an object as it goes downstream throughout the supply chain from the start to finish. Tracing, on the other hand, enables us to identify the source of an object or group of objects, within records, upstream in the supply chain. Track and trace requires three different types of technologies: Capture, Transmit and Access. ‘Capture’ transforms physical data such as location, time, temperature, status, etc. into digital data. ‘Transmit’ enables movement of digital data from a local source to global or cloud system and/or databases. ‘Access’ allow companies to handle, manage and analyze data that gets generated throughout the supply chain.
Supply Chain Visibility Supply chain visibility is the ability to track and trace the path and status of all parts, components, and products from original source to final use. Examples of questions that can be answered includes: Where is order #12345 right now? How long, on average, does it take to get through the IB port? Where are all of the items from lot #1299 located right now? Etc. Supply Chain Visibility can be hard to achieve because of the following reasons:
1. Multiple parties involved in every shipment 2. Form of the product/conveyance can change
• Level of aggregation (conveyance, container, pallet, SKU, item, etc.)
• Consolidation/Deconsolidation (shipment, order, etc.) 3. Firms have different needs for visibility
• Real Time vs Near Real Time vs Post Hoc
• Tracking vs Tracing 4. Requires three different types of technology
• Data Capture & Translation
• Data Transmission & Upload
• Data Access & Actionability

V3 Spring 2018・CTL.SC4x – Technology and Systems・MITx MicroMasters in Supply Chain Management
MIT Center for Transportation & Logistics・Cambridge, MA 02142 USA ・[email protected]
This work is licensed under a Creative Commons Attribution-NonCommercial-ShareAlike 4.0 International License.
50
Tracking and Tracing
Tracking The capability to follow the route of an object as it goes downstream throughout the supply chain from the start to finish. Tracking enables supply chain professionals to answer questions such as:
• Where is it now?
• Where will it be?
• When will it get there?
Tracing The capability to identify the source of an object or group of objects, within records, upstream in the supply chain. Tracing enables supply chain professionals to answer questions such as:
• Where did it come from?
• Where has it been?
• Where are all the similar ones?
Technologies for Supply Chain Visibility

V3 Spring 2018・CTL.SC4x – Technology and Systems・MITx MicroMasters in Supply Chain Management
MIT Center for Transportation & Logistics・Cambridge, MA 02142 USA ・[email protected]
This work is licensed under a Creative Commons Attribution-NonCommercial-ShareAlike 4.0 International License.
51
Broadly speaking, there are three types of technologies that are required to implement track and trace within a supply chain These includes:
1. Capture & Translation 2. Transmission & Upload 3. Access & Actionability
Capture & Translation These transform physical data such as location, time, temperature, status, etc. into digital data. Examples includes Barcodes, Scanners, RFID, Smartphone, Internet of Things. Let’s look at the top two commonly used technologies for capture and translation:
Barcode RFID
An optical, machine-readable, representation of data usually describing something about the object that carries the barcode.
System that uses electromagnetic fields to automatically identify and track tags attached to objects. The tags contain electronically stored information and can be passive (does not require power) or active (requires power).
Benefits
• Enables accurate and efficient data collection all along the supply chain
• Easily track movements by SKU to identify fast/slow movers, monitor promotions, etc
• Enables the profiling of individual consumers
• Relatively low cost and extremely accurate compared to key-entry.
• Passive labeling – requires no power.
Benefits
• Can be read without line of sight and from a greater distance
• Tags are highly durable and are reusable. Multiple tags can be read simultaneously and so are faster than barcodes.
• Tags can have read/write capabilities - information can be updated or added. Tags can potentially contain highly detailed data Difficult to replicate or counterfeit and data can be password protected.
Limitations
• Require line of sight within ~15 feet (~4.6 meters) in order to be read.
• Items must be scanned individually – labor intensive.
• Barcodes can be easily counterfeited or replicated.
• Typically, only the type of item is contained, not an individual unique code
• Read only and information cannot be updated or added.
• Limitations
• More expensive than barcodes
• Does not work well with metal or liquids – interference for radio waves
• Requires assembling and inserting a computerized chip.
• RFID still has two separate chips (read only and readable/writable), which cannot be read by the same machine or scanner.
Transmission & Upload These enable movement of digital data from a local source to global or cloud system and/or database. Data can be transferred when the items reach a certain milestone, also known as milestone reporting or can be transferred in real time using GPS. Examples are Electronic Data Interchange, Application Programming Interface, Global Positioning Systems. The below table summarizes the comparison between different transmission technologies:

V3 Spring 2018・CTL.SC4x – Technology and Systems・MITx MicroMasters in Supply Chain Management
MIT Center for Transportation & Logistics・Cambridge, MA 02142 USA ・[email protected]
This work is licensed under a Creative Commons Attribution-NonCommercial-ShareAlike 4.0 International License.
52
Electronic Data Interchange (EDI) Application Programming Interfaces (API)
Real time GPS
Computer-to-computer exchange of business documents in a standard electronic format between business partners (technology is over 30 years old).
Similar to EDIs but uses APIs to exchange information over the internet. APIs are set of subroutine definitions, protocols, and tools for building application software.
Transmits real-time location information from vehicles to a common platform.
Benefits:
• Simplification of information flows that require human interaction and paper documents,
• Elimination of sorting, distributing, organizing, and searching paper documents,
• More efficient storage and ease of manipulation of electronic records,
• Eradication of manual re-entry or data – which reduces data errors,
• Greater trading speed and reduced cycle times, which leads to
• Total cost reductions of 20% to 35% when replacing a paper based system.
Benefits:
• Provide “real” real-time data and can interact with multiple systems via their universal nature.
• Cloud-based technology, so it can be maintained and updated without disrupting shipping operations.
• Lower implementation and maintenance costs (perhaps) than EDI.
• Extremely flexible in terms of what and how to communicate.
• Enables two-way communication – able to send responses to data calls with success or error messages
• Able to request additional data on demand from API endpoints
• The standard for data transmission in almost all industries besides logistics
Benefits:
• Able to track every asset in real time
• Enables the continuous monitoring of assets
• Many technologies are now available – smartphones, ELDs, etc.
• Able to implement contingency plans in real-time (re-routing, diversion, etc.)
• Able to ensure driver adherence to routes and other requirements.
• Creates tremendous data that is amenable to machine learning and other big- data analysis techniques
Limitation:
• Latency – EDI messages typically held and released in batches using timer- based processing
• Implementation – Establishing EDI direct connections between partners is cumbersome and time consuming (months)
• Expensive - Can be very expensive, especially when using a 3rd party to translate the data
• Not Interactive – EDI only operates in one direction – there is no ability to respond with a “received” message
• Rigidity –EDI can sometimes require changing an established business process. It’s not very flexible: scheduled transmissions, cannot request data on demand, set milestones.
Limitation:
• APIs are not generally compatible with legacy systems
• Not standard practice in the Logistics industry and no current standards n Testing during implementation can cause systems to crash.
• Requires development resources to implement
• Potential security ramifications.
Limitation:
• Can be expensive to operate • Requires power and active
connectivity throughout
• Not available for all moves – ocean moves are problematic
• Not fully integrated into TMS or other systems
• Inundation of data does not always lead to elucidation – almost forces adoption of some data analytics tools
• Data received is context free (latitude, longitude, time)
• Data timing is difficult to merge with other milestone based data

V3 Spring 2018・CTL.SC4x – Technology and Systems・MITx MicroMasters in Supply Chain Management
MIT Center for Transportation & Logistics・Cambridge, MA 02142 USA ・[email protected]
This work is licensed under a Creative Commons Attribution-NonCommercial-ShareAlike 4.0 International License.
53
Data Access and Actionability Technology These technologies enable companies to handle, manage and analyze data that gets generated throughout the supply chain. Common technologies to make it happen includes:
• Integration into Existing Systems
• Supply Chain Event Management (SCEM) Systems
• Supply Chain Control Towers The table summarizes each of these technologies:
Integration into Existing Systems Supply Chain Event Management (SCEM) Systems
Supply Chain Control Towers
• Extended Transportation Management Systems (TMS)
• Add-ons to Enterprise Resource Planning (ERP) tool
• Challenges with merging real-time and milestone status data.
• Exception based tools with “If-Then” rules
• Screens out the non-necessary status updates and only alerts if needed.
• Follows the ”Sense-Alert-Respond-Learn” methodology
• Central hub or platform that captures data along supply chain
• Requires expert staffing and allows for end-to-end visibility
• Becoming common offering by 3PLs
Learning Objectives • Become familiar with the concept of Supply chain visibility.
• Differentiate between Tracing and Tracking.
• Review the three technology requirements for supply chain visibility.
• Understand the benefits and limitation of various technologies used within supply chain visibility.

V3 Spring 2018・CTL.SC4x – Technology and Systems・MITx MicroMasters in Supply Chain Management
MIT Center for Transportation & Logistics・Cambridge, MA 02142 USA ・[email protected]
This work is licensed under a Creative Commons Attribution-NonCommercial-ShareAlike 4.0 International License.
54
Supply Chain Systems - Software Selection & Implementation
Summary As we have journeyed through various types of supply chain systems, we will now cover the process of software selection and implementation. As firms are in the process of selecting their supply chain systems they will need to be aware of various factors that will guide their decision of whether to select the system or not. So we now discuss the process of software selection and evaluation criteria. While selecting the appropriate software system can be challenging, implementation is far more difficult. The process of implementation can be long and costly, using additional resources. In this lesson, we cover general guidelines on what to be prepared for when implementing software systems.
Architecture
Evolution of Architecture To understand where supply chain systems stand now, it is helpful to understand the evolution of the architecture starting in the 1970’s. The following are the various forms of architecture for the last fifty years:
• Mainframe (1970s)
• Personal Computers (mid-1980s)
• Client-Server (late 80s to early 90s)
• Wide Web and Web 2.0 (mid-90s to present)
• Cloud or Post-PC (today and beyond) Today there are a variety of software systems available to businesses. In terms of architectural format, they can choose between “On Location” or “On Premise” – meaning that the firms host the software in their own facilities or on their hardware and within their own firewall. However, companies are increasingly opting for cloud computing options. This means that they have several deployment models available to them.
Cloud Computing As cloud computing becomes increasingly more popular, there are a variety of offerings that can be tailored to firm needs. They are Infrastructure as a Service (IaaS), Platform as a Service (Paas), and Software as a Service (Saas), third party management increases from IaaS to SaaS. We discuss each format as well as benefits below: Infrastructure as a Service (IaaS): In this format, the third party provides the firm with the computing infrastructure, physical or virtual machines and other resources. Firm owns and manages the software application. The benefits of this are:

V3 Spring 2018・CTL.SC4x – Technology and Systems・MITx MicroMasters in Supply Chain Management
MIT Center for Transportation & Logistics・Cambridge, MA 02142 USA ・[email protected]
This work is licensed under a Creative Commons Attribution-NonCommercial-ShareAlike 4.0 International License.
55
• No need to invest in your own hardware
• Infrastructure scales on demand to support dynamic workloads
• Flexible, innovative services available on demand Platform as a Service (PaaS): In this format, the third party provides firm computing platforms to include operating system, database, web server etc. Firm owns and manages the software application. The benefits of this are:
• Develop applications and get to market faster
• Deploy new web applications to the cloud in minutes
• Reduce complexity with middleware as a service Software as a Service (SaaS): In this case, the third party provides firm with access to the application software and handles installation, setup, maintenance, and running. Firm is charged by use. Benefits include:
• You can sign up and rapidly start using innovative business apps
• Apps and data are accessible from any connected computer
• No data is lost if your computer breaks, as data is in the cloud
• The service is able to dynamically scale to usage needs
While there are many benefits to cloud computing, there are widespread disadvantages of cloud computing that include but are not limited to: vendor outages, unrestricted government access, security & privacy risks, and key data and processes require network access.

V3 Spring 2018・CTL.SC4x – Technology and Systems・MITx MicroMasters in Supply Chain Management
MIT Center for Transportation & Logistics・Cambridge, MA 02142 USA ・[email protected]
This work is licensed under a Creative Commons Attribution-NonCommercial-ShareAlike 4.0 International License.
56
Software Selection Sources There are different sources of software that firms need to be aware of. These include a customized in-house system designed for a business, an ERP expanded system with additional bells and whistles tailored for a company, best of breed solutions (of market solutions), and best of breed platforms. These are discussed in further detail in the chart below:
Outsourcing There is also the option of outsourcing some of these systems to different providers. For instance, in logistics, 3PLs or Third Party Logistics Providers, serve as an organization that can run the software as well as perform all of the business processes. Having a 3PL run your logistics eliminates the need for hardware and software. 3PLs can possibly replace personnel within the firm. The use of 3PLs is most common with smaller firms. The main reasons to outsource are to reduce capital expenditure for software and hardware. It may also reduce costs as a result of partner’s economies of scale; they often have the ability to do it faster and better as well as be more flexibile and agile. It may also be an opportunity to increase levels of service at reasonable costs. Firm can focus on core business and bring in expertise that is not affordable in-house. There are myriad other reasons to outsource, but there are also many not to, discussed below. At the top of the reasons not to outsource are security and privacy concerns; someone else has access to the firm’s data. There are also worries of vendor dependency and lock-in. The firm may lose in-house expertise to a core function. There are also high-migration costs as well as concerns over availability, performance, and reliability. There are additional reasons not to

V3 Spring 2018・CTL.SC4x – Technology and Systems・MITx MicroMasters in Supply Chain Management
MIT Center for Transportation & Logistics・Cambridge, MA 02142 USA ・[email protected]
This work is licensed under a Creative Commons Attribution-NonCommercial-ShareAlike 4.0 International License.
57
outsource. Firms need to weigh the pros and cons of outsourcing matched with business objectives to decide which is suitable for them.
Software Vendor Selection In the end, a firm must select its vendor. Typically, an organized and formalized fashion to select a vendor and in general it goes as follows:
1. Form a Project Team (Internal and/or External) & Objectives 2. Understand the Business and Needs: review current business processes, prioritize
needs/functionality, create Request for Information (RFI) 3. Create Initial Short List of Potential Solutions & Vendors 4. In-depth Review of Short Listed Vendors: have vendors conduct realistic product
demonstrations, references from current users. 5. Create and Distribute Final Request for Proposal (RFP) 6. Make the Decision: negotiate contract, price, and service level agreements (SLAs) and
establish an implementation plan. While cost is one of the primary factors in decision-making, there are many other criteria that need to be evaluated on top of cost. They are:
• Functionality – does the system features fit the firm’s processes and needs?
• Ease of Use – how fast is the initial learning curve and on-going use?
• Performance – what are the processing speeds?
• Scalability – how well can the system expand and grow with the firm?
• Interoperability – how well does the system integrate with other systems?
• Extendibility – how easily can the system be extended or customized?
• Stability – how reliable is the system in terms of bugs and up-time?
• Security – how well does the system restrict access, control confidential data, and prevent cyber hacking?
• Support – how is the quality of the vendor in terms of implementation, support, training, thought leadership etc.?
• Vendor Viability – how is the vendor’s financial strength and willingness to supply updates and enhancements? Will they be here in 3 years??
Because there are a variety of criteria that firms will be evaluating vendors on, a scorecard is a popular way to capture financial and non-financial attributes. The criteria can be scored as rank, ratings, and grades. Scorecards tend to be very detailed and can even be broken down by specific features. The selection can be made between vendors or between alternative hosting platforms.
Total Cost of Ownership Software License: Direct cost of the software system itself – assuming ownership. Maintenance: Ongoing annual costs to guarantee upgrades and bug fixes. Platform/Hardware: Cost of needed hardware to run the new software.

V3 Spring 2018・CTL.SC4x – Technology and Systems・MITx MicroMasters in Supply Chain Management
MIT Center for Transportation & Logistics・Cambridge, MA 02142 USA ・[email protected]
This work is licensed under a Creative Commons Attribution-NonCommercial-ShareAlike 4.0 International License.
58
Training: Cost of training initial and ongoing personnel Implementation: Cost of getting the system to go live. These vary widely between systems and firms. Customization: Cost of modifying the system itself to fit the firm’s processes. Nothing in SCM is used straight out of the box (vanilla). System Integration Cost of interfacing this system with other modules and modifying existing systems to fit.
Implementation While selecting a vendor can be difficult and time consuming, the actual process of implementation can take an even more significant amount of time and consume a lot of resources. There are a few different approaches to implementation. They include Direct (or Big Bang), Parallel, Pilot, and Phased (or Rolling). Each of these has its own positives and negatives, but the approach must suit the needs of the business.
There are a few best practices to keep in mind when going about implementation. They include:
1. Secure senior executive commitment: ability to gather and use resources, empower team.
2. Form interdisciplinary team(s) 3. Create a clear and specific scope document 4. Build extensive testing into the project plan (you can’t test too much) 5. Include extensive user training into the project plan

V3 Spring 2018・CTL.SC4x – Technology and Systems・MITx MicroMasters in Supply Chain Management
MIT Center for Transportation & Logistics・Cambridge, MA 02142 USA ・[email protected]
This work is licensed under a Creative Commons Attribution-NonCommercial-ShareAlike 4.0 International License.
59
Learning Objectives
• Recognize selecting a software vendor is an intertwined decision between architecture and source.
• Understand tradeoffs between On-Premise and Cloud based systems.
• Know the differences between In-House, Best of Breed, ERP Extensions, and Outsourced forms of software systems.
• Review the selection process, recognizing there are multiple attributes, and the total cost of ownership is complex.
• Understand the challenge of implementation and the various approaches to implementing systems within a firm.
• Review best practices of implementation.