Embed Size (px)
Citation preview
CTS130 CTS130 SpreadsheetSpreadsheet
Lesson 19Using What-If
Analysis
Creating a Scenario
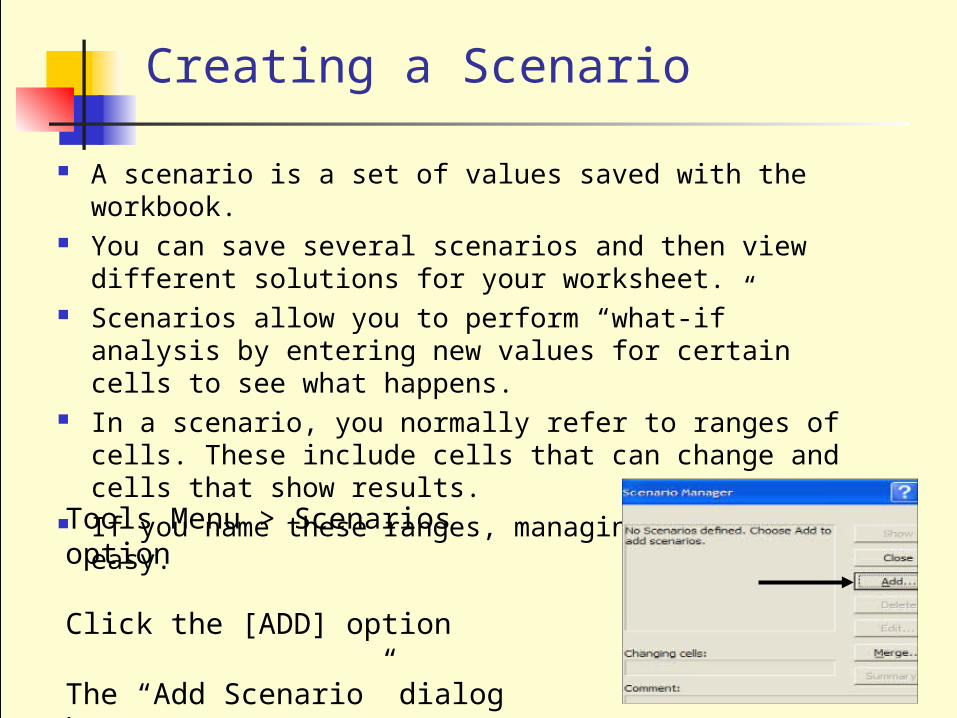
A scenario is a set of values saved with the workbook. You can save several scenarios and then view different
solutions for your worksheet. Scenarios allow you to perform “what-if” analysis by
entering new values for certain cells to see what happens.
In a scenario, you normally refer to ranges of cells. These include cells that can change and cells that show results.
If you name these ranges, managing scenarios is easy.Tools Menu > Scenarios option
Click the [ADD] option
The “Add Scenario” dialog box opens.
“Add Scenario” Dialog Box
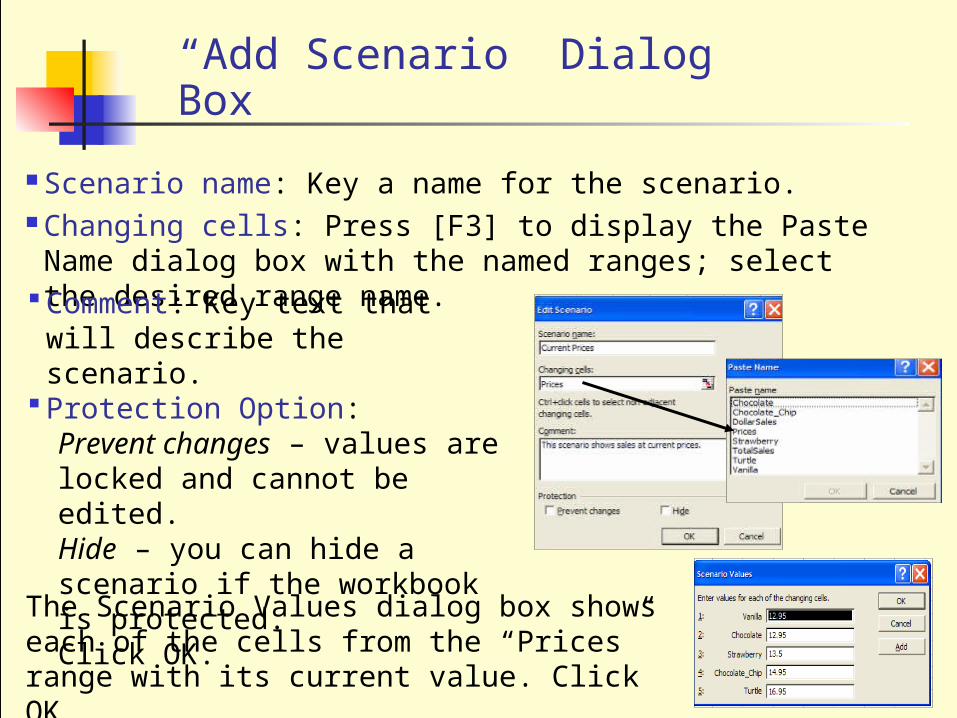
Scenario name: Key a name for the scenario. Changing cells: Press [F3] to display the Paste Name dialog box with the named ranges; select the desired range name.Comment: Key text that will describe the scenario.
Protection Option: Prevent changes – values are locked and cannot be edited.Hide – you can hide a scenario if the workbook is protected.Click OK.
The Scenario Values dialog box shows each of the cells from the “Prices” range with its current value. Click OK.
Adding A Second Scenario
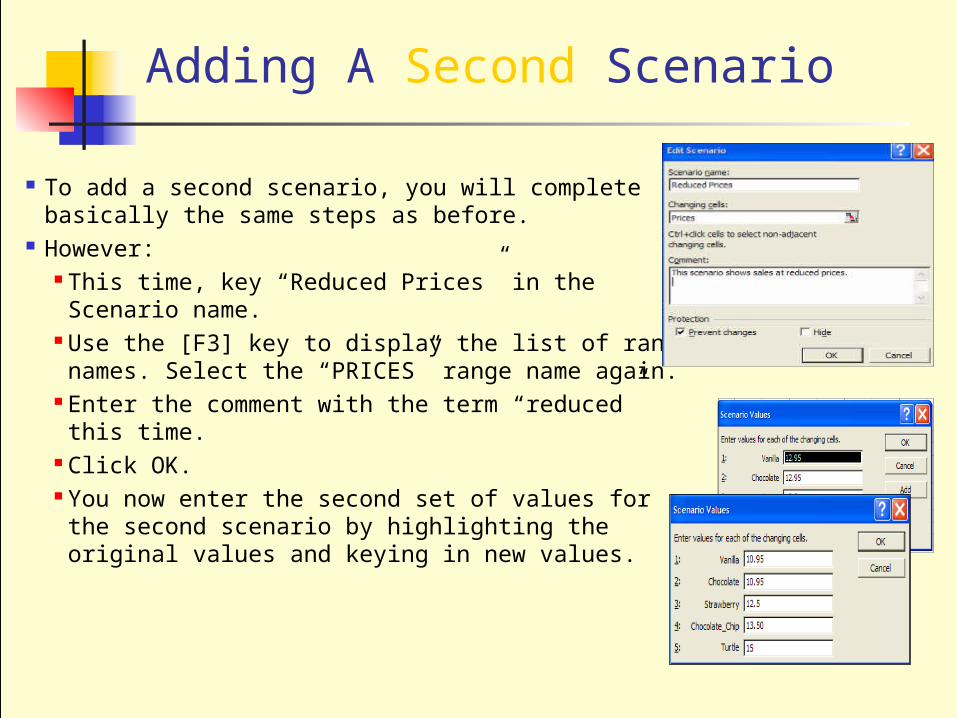
To add a second scenario, you will complete basically the same steps as before.
However: This time, key “Reduced Prices” in theScenario name.
Use the [F3] key to display the list of range names. Select the “PRICES” range name again.
Enter the comment with the term “reduced” this time.
Click OK. You now enter the second set of values forthe second scenario by highlighting theoriginal values and keying in new values.
Adding A Third Scenario
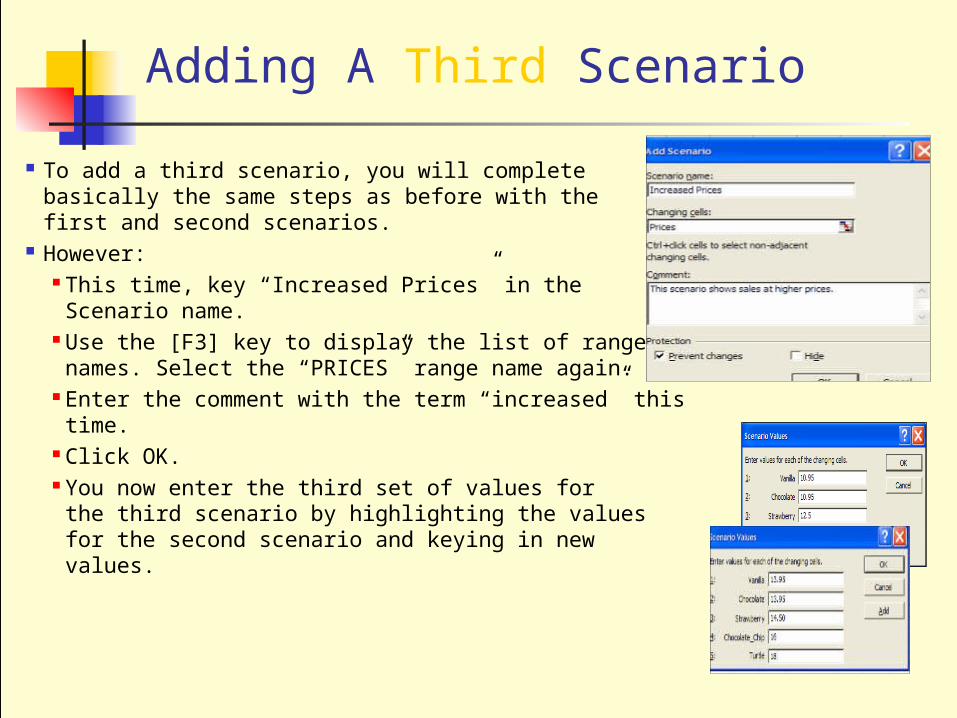
To add a third scenario, you will complete basically the same steps as before with thefirst and second scenarios.
However: This time, key “Increased Prices” in theScenario name.
Use the [F3] key to display the list of range names. Select the “PRICES” range name again.
Enter the comment with the term “increased” this time.
Click OK. You now enter the third set of values forthe third scenario by highlighting the values for the second scenario and keying in new values.
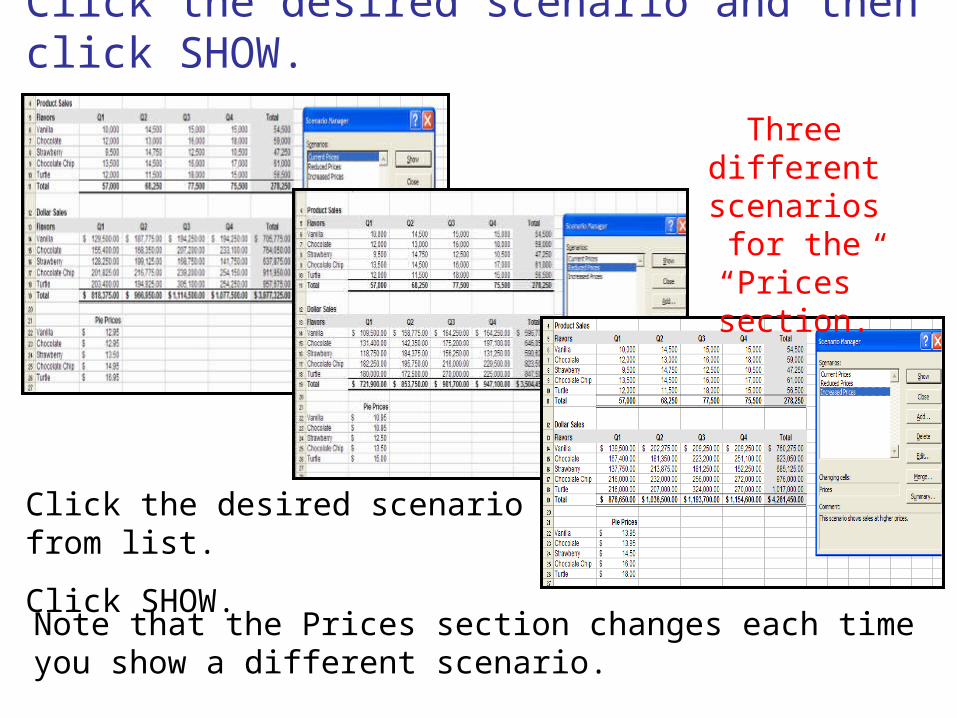
Click the desired scenario and then click SHOW.
Click the desired scenario from list.
Click SHOW. Note that the Prices section changes each time you show a different scenario.
Three different
scenarios for the “Prices”
section.
Managing Scenarios
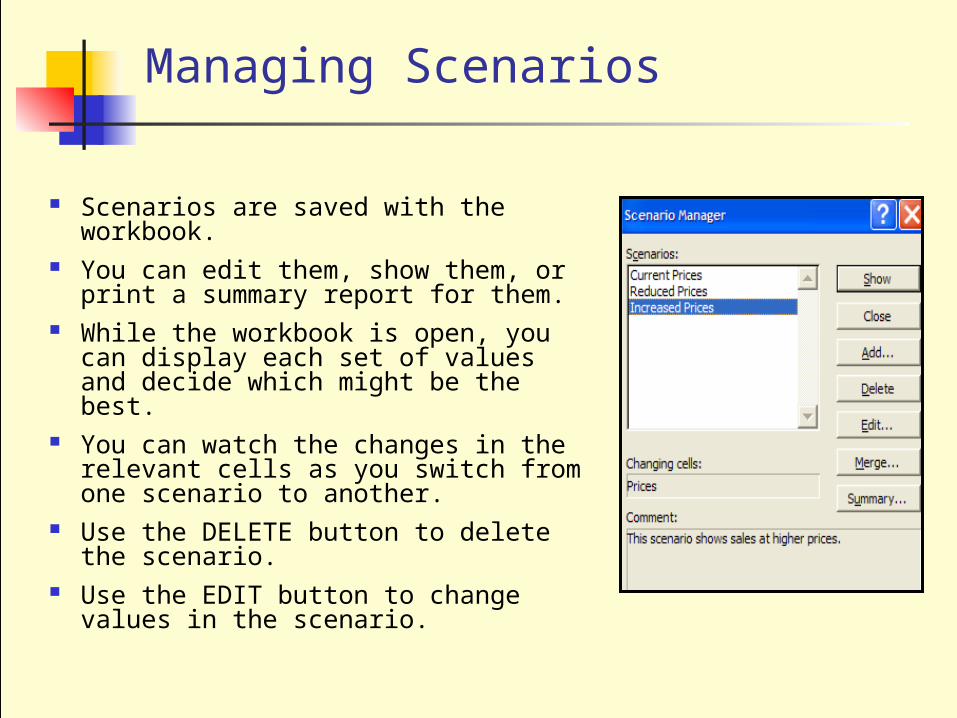
Scenarios are saved with the workbook.
You can edit them, show them, or print a summary report for them.
While the workbook is open, you can display each set of values and decide which might be the best.
You can watch the changes in the relevant cells as you switch from one scenario to another.
Use the DELETE button to delete the scenario.
Use the EDIT button to change values in the scenario.
Managing Scenarios (cont’d)
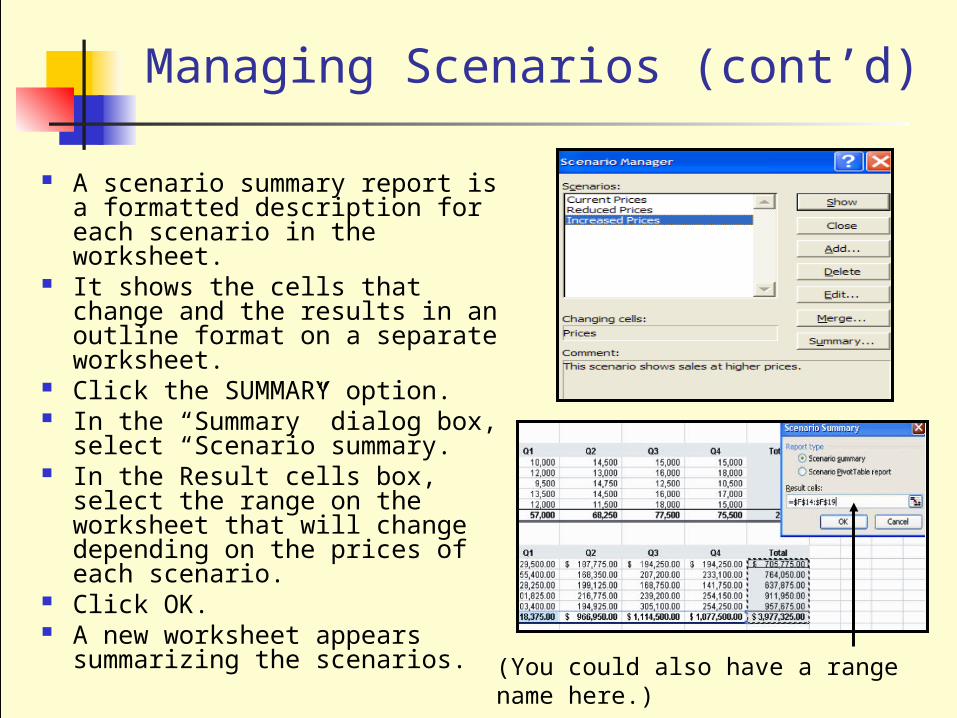
A scenario summary report is a formatted description for each scenario in the worksheet.
It shows the cells that change and the results in an outline format on a separate worksheet.
Click the SUMMARY option. In the “Summary” dialog box,
select “Scenario summary. In the Result cells box, select
the range on the worksheet that will change depending on the prices of each scenario.
Click OK. A new worksheet appears
summarizing the scenarios. (You could also have a range name here.)
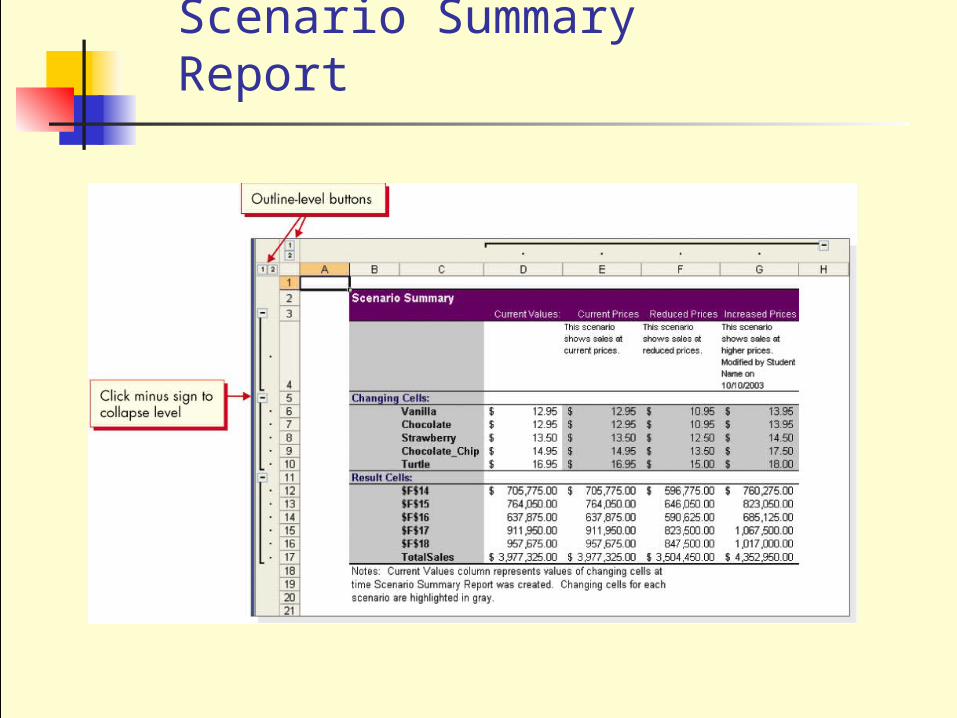
Scenario Summary Report
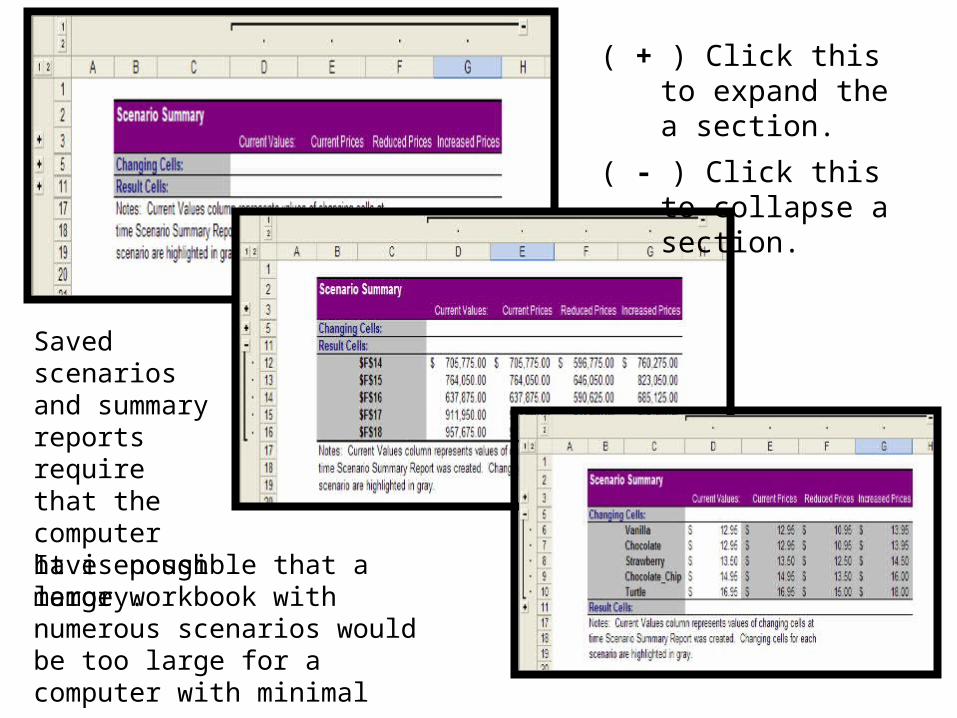
It is possible that a large workbook with numerous scenarios would be too large for a computer with minimal memory.
( + ) Click this to expand the a section.
( - ) Click this to collapse a section.
Saved scenarios and summary reports require that the computer have enough memory.
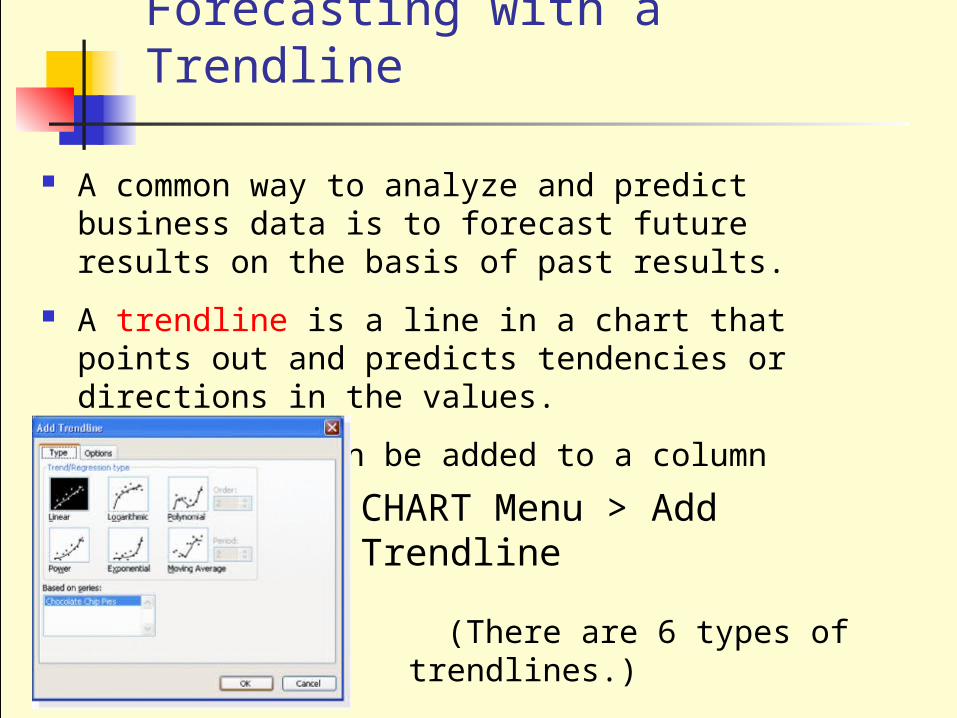
Forecasting with a Trendline
A common way to analyze and predict business data is to forecast future results on the basis of past results.
A trendline is a line in a chart that points out and predicts tendencies or directions in the values.
A trendline can be added to a column chart.
CHART Menu > Add Trendline
(There are 6 types of trendlines.)
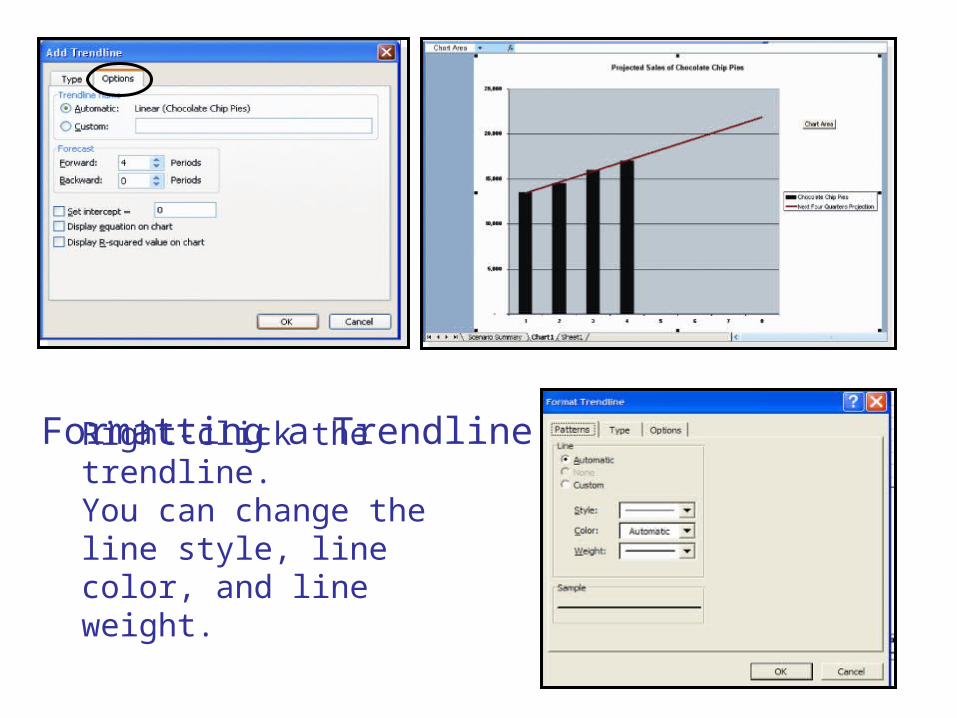
Formatting a TrendlineRight-click the trendline.You can change the line style, line color, and line weight.
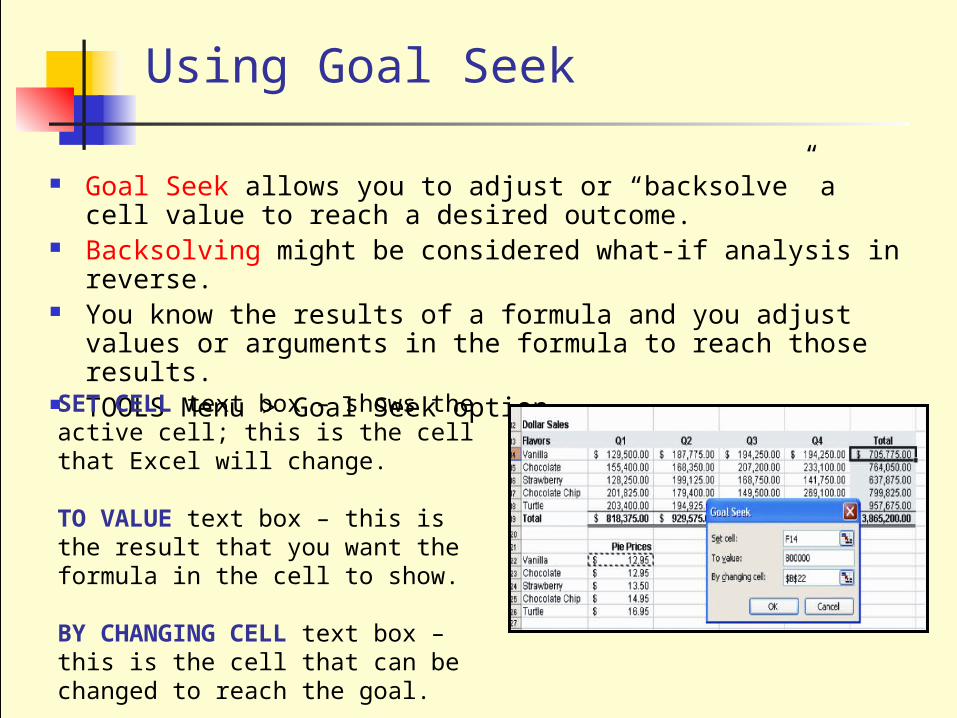
Using Goal Seek
Goal Seek allows you to adjust or “backsolve” a cell value to reach a desired outcome.
Backsolving might be considered what-if analysis in reverse. You know the results of a formula and you adjust values or
arguments in the formula to reach those results. TOOLS Menu > Goal Seek option
SET CELL text box – shows the active cell; this is the cell that Excel will change.
TO VALUE text box – this is the result that you want the formula in the cell to show.
BY CHANGING CELL text box – this is the cell that can be changed to reach the goal.
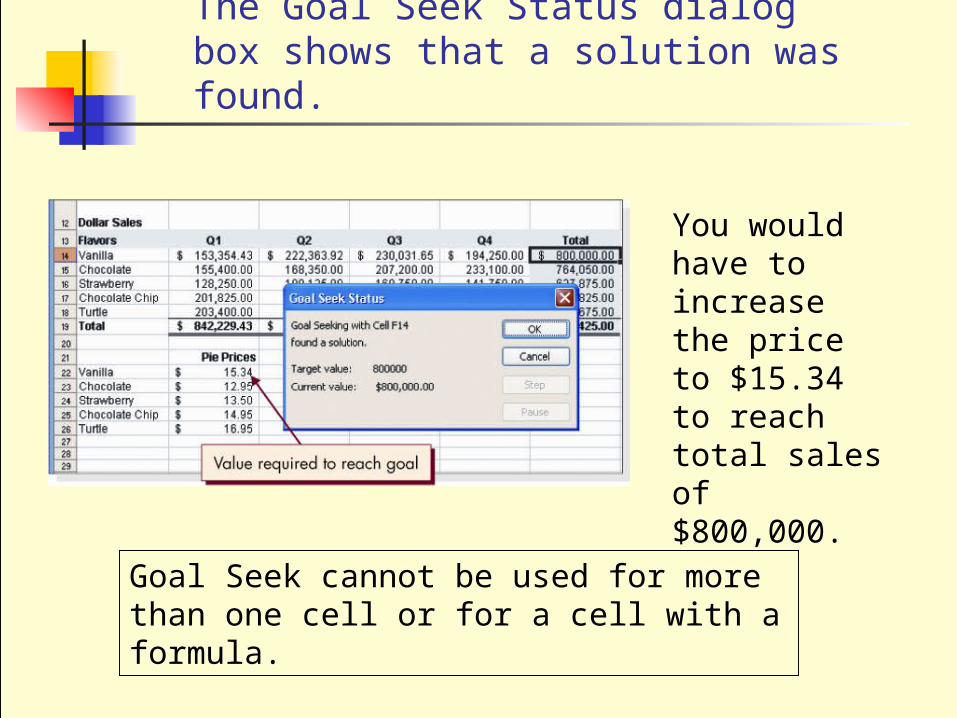
The Goal Seek Status dialog box shows that a solution was found.
You would have to increase the price to $15.34 to reach total sales of $800,000.
Goal Seek cannot be used for more than one cell or for a cell with a formula.
Solver
A solver is an Excel add-in for what-if analysis. An add-in is a feature added to the program that
makes the program easier to uses or supplies additional functionality.
Solver backsolves the value for a cell with a formula. It is useful for more complex backsolving problems.
Solver uses parameters in its dialog box. A parameter is the data or information that Solver needs to determine a solution. It is similar to the arguments in a function.
If Solver does not appear in the Tools menu, choose Add-Ins from the menu to install it.
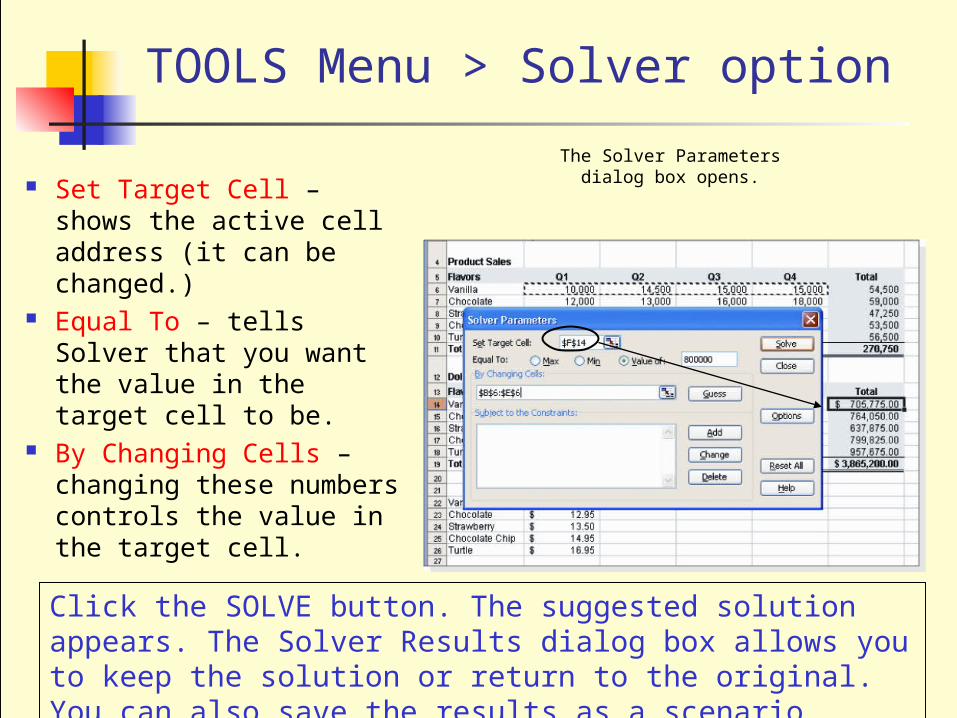
TOOLS Menu > Solver option
The Solver Parametersdialog box opens. Set Target Cell – shows
the active cell address (it can be changed.)
Equal To – tells Solver that you want the value in the target cell to be.
By Changing Cells – changing these numbers controls the value in the target cell.
Click the SOLVE button. The suggested solution appears. The Solver Results dialog box allows you to keep the solution or return to the original. You can also save the results as a scenario.
Add Solver Constraints
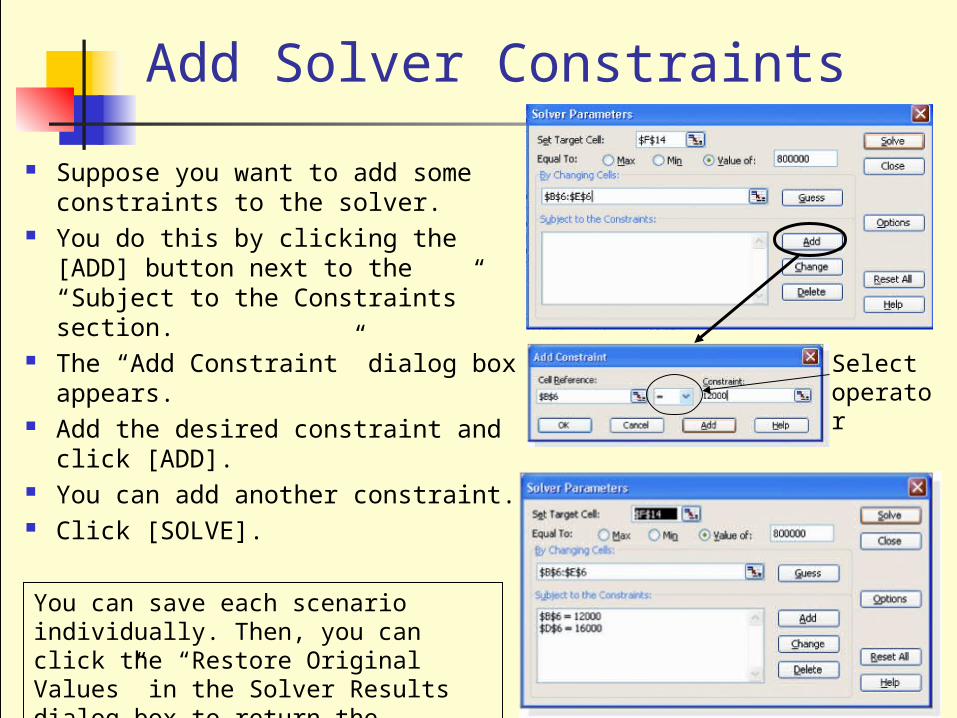
Suppose you want to add some constraints to the solver.
You do this by clicking the [ADD] button next to the “Subject to the Constraints” section.
The “Add Constraint” dialog box appears.
Add the desired constraint and click [ADD].
You can add another constraint. Click [SOLVE].
Select operator
You can save each scenario individually. Then, you can click the “Restore Original Values” in the Solver Results dialog box to return the worksheet to its original values.
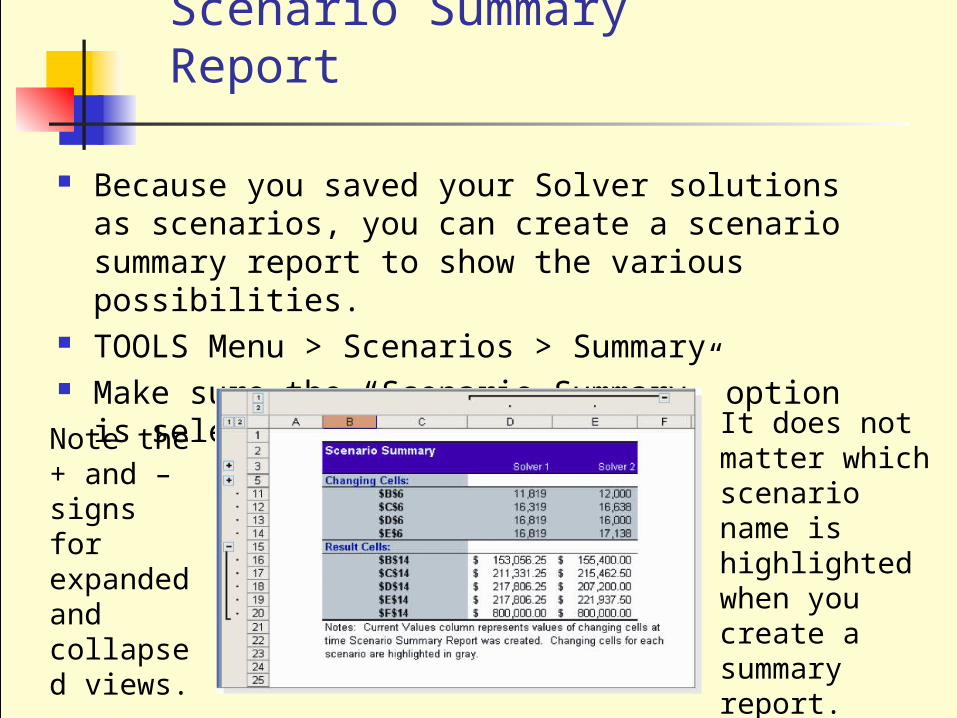
Because you saved your Solver solutions as scenarios, you can create a scenario summary report to show the various possibilities.
TOOLS Menu > Scenarios > Summary Make sure the “Scenario Summary” option is
selected.
Scenario Summary Report
It does not matter which scenario name is highlighted when you create a summary report.
Note the + and – signs for expanded and collapsed views.


![CTS130 Spreadsheet Lesson 13 Working with Lists. Copying Data between Workbooks Use the [Copy ]and [Paste] Buttons Use the CTRL+[C] and CTRL + [V]](https://img.pdfslide.net/doc/110x75/56649d965503460f94a7f177/cts130-spreadsheet-lesson-13-working-with-lists-copying-data-between-workbooks.jpg)