Embed Size (px)
Citation preview

1 CTU Monthly Economic Bulletin –October 2020
CTU Monthly Economic Bulletin No. 223 (October 2020)
Minimum Wage (and Gender Wage Gap)
Discussion of the arguments for increasing the minimum wage as well as an updating of the wage
gap graphs by gender and ethnicity following the release of the Labour Market Statistics (Income)
for the June 2020 year. A finding that the reduction in employment in women, discussed in the
August Bulletin, seems to predominately effect Auckland.1
Share and bond markets at record levels with house prices continuing to rise and income support
recipients slightly declining. Rent and now food continue to rise at levels higher than the CPI
although the food index declined in September. A new graph comparing house prices increases to
average hourly earnings increases – spoiler alert – they are higher.
Introduction
This month is the minimum wage (with a wage gap supplementary).
Going into the election it was all pretty binary. Labour (and the Greens) were going to increase
the minimum wage to $20/hour – National/Act weren’t and weren’t again for a while.
The CTU’s long held policy has been that the minimum wage should be 2/3 of the average wage -
$22.292. This is because such a rate:
• Explicitly values the work of many of our essential workers under Alert Level 4.
• Provides a wage floor for the labour market as a whole and helps address the leftward
skew of the wage and salary distribution. ie our low wage economy.
• Does not necessarily increase unemployment and to the extent it does Government
needs to provide alternative socially productive employment.
1 https://www.union.org.nz/wp-content/uploads/2020/09/CTU-Economic-Bulletin-221-August-2020.pdf 2 Two-thirds of the average wage at March 2020 ($33.14) increased by the Treasury PREFU forecast of a 0.9% increase in the average ordinary time hourly wage in the year to June 2021.

2 CTU Monthly Economic Bulletin –October 2020
• Promotes productivity and provides incentives for businesses to innovate and invest in
capital.
Explicitly values work
The rate of remuneration for employment, in a market-based economy, is the key way of
indicating society and the economy’s view of the value and worth to it for the work provided by
the individual concerned.
However, as we saw during Alert Level 4 the workers who were truly essential to the functioning
of our economy and society; cleaners, supermarket workers, security guards and bus drivers
were also some of the lowest paid. Many were on about the minimum wage with very few even
on the Living Wage.
This disconnect between value and pay is not sustainable in a functioning society. Such a
disconnect is all the more stark given that MBIE have shown that women are disproportionately
represented among minimum wage workers indicating a structural disrespect for the paid work
of women in these areas.3
Wage Floor
Currently wages and salaries have a left skewed distribution indicating that many more people
earn below the average wage than above it. In general two-thirds of employees (65-67%) have
earned below the average hourly wage since 1998 according to the HLFS/NZIS income survey.
For that reason, the CTU’s first preference is a minimum wage set at 2/3 of the average wage;
pushing the distribution rightwards.
3 https://www.mbie.govt.nz/assets/Uploads/minimum-wage-review-december-2019.pdf Page 32

3 CTU Monthly Economic Bulletin –October 2020
In the CTU’s view the leftward skewed distribution is a combination of low levels - albeit recently
increasing - of membership of collective agreements4,
combined with wages not keeping up with labour productivity since the early 1980’s, meaning
that workers have not been receiving the benefits from their increased productivity. 5 That is,
there is some way to go for wages to catch up.
4 Collective agreements which currently are primarily in the State Sector which cover the incomes of people above the average wage. 5 https://www.mbie.govt.nz/assets/695e21c9c3/working-group-report.pdf
12.0
14.0
16.0
18.0
20.0
22.0
24.0
26.0
%
Source:Stats NZ HLF266AA
Collective Agreement Membership proportion of all employees
Male Female Total

4 CTU Monthly Economic Bulletin –October 2020
All of which means that it is a regulated minimum wage, and not other features of the labour
market, which provides the structural floor for wages and is the only mechanism the government
currently has to address this misallocation of resources.
In future:
• Fair Pay Agreements; which the CTU hopes will initially cover sectors such as supermarket
workers, cleaners, security guards and bus drivers,
• more widespread collective bargaining including outside the State Sector;
• the rollout of the Living Wage to contractors to the government; and
• the rise of pay equity claims to address the historical and current undervaluation of the
paid work of women –
- the minimum wage may no longer be as structurally important as a wage floor.
However, we are still many years from this being the case and so the minimum wage should be
set at 2/3 average wage in the interim or at a minimum the signalled $20 rate.
Won’t it increase unemployment?
In very simple models of the (labour) market with a downward sloping demand curve; an
increase in the price of labour would reduce the demand for it – all things being equal. Then on
the basis that there was also static supply of labour, or a supply of labour that proportionately
increased as wages increase; this would cause unemployment.
In the diagram below, unemployment is represented by the difference between L1 which is the
number of people being prepared to work for wage – w1 – and L2 which is the actual number of
people hired at the w1.
Although arguably at the ‘equilibrium wage’ everyone to the right of L0 is unemployed or
underemployed as it is clear they would take up paid work if wages were higher.

5 CTU Monthly Economic Bulletin –October 2020
The potential ‘real’ unemployment in my view is really only the difference between L0 and L2.
As this is a very simplistic model, the supply side might factor in the general life decisions people
make in this environment: staying in education longer, returning to education; going overseas6 or
prioritising unpaid work such as care for family or volunteering. But it doesn’t factor in people
feeling they have sufficient to make ends meet and reducing their hours or participation – aka a
‘backward bending labour supply curve’.7
Or the key issue that people need income from their labour to live and that people are in the
work force or they are not. The idea that the workforce increases as pay increases isn’t how
people actually behave.
But key in the labour supply discussion is migration. With reduced migration, we should see the
labour supply curve shift left, thereby reducing the level of people who are unable to get paid
work if they want it.
This is also acknowledged by MBIE when they said [there is] no consensus in the international
literature of the disemployment effects of minimum wage increases.8 The CTU has a stronger
view on this which is outlined in section 5 of our Minimum Wage review submission in 2015.9
6 In a pre-pandemic world. 7 https://en.wikipedia.org/wiki/Backward_bending_supply_curve_of_labour#:~:text=In%20economics%2C%20a%20backward%2Dbending,higher%20wages%20lead%20to%20a 8 https://www.mbie.govt.nz/assets/impact-statement-increasing-the-minimum-wage.pdf Page 8 9 https://www.union.org.nz/wp-content/uploads/2017/10/151019-Minimum-Wage-Review.pdf

6 CTU Monthly Economic Bulletin –October 2020
On the demand side, nothing in this analysis allows for firms’ ability to increase prices - the
Wellington bureaucrat’s coffee addition is pretty strong - or depending on how well capitalised
the firm is - absorb the additional costs. And all this is before the impact of the most recent
increase having been signalled up to 3 years in advance of it coming into effect giving firms time
to plan and adjust.
To be fair, this was our analysis pre- Covid and pre-lockdown. Post- Covid, it is true
unemployment, or underutilisation, is increasing but the CTU’s view is that this as a result of the
large scale impact of the borders being closed and global pandemic affecting the economies of
our trading partners rather than any current or signalled increase in the minimum wage.
We note that the Government has, and is, providing significant support to business in the form of
low interest loans, enhanced tax settings and previously the wage subsidy to help counter the
impacts and allow for a transition for vulnerable firms.10
To the extent, with labour supply being more fixed than previously, there is an increase in
unemployment our view is that this is then the place for governmental intervention. The CTU
has also been calling on the government to invest in areas that support job creation in areas that
support high quality, skilled, well paid jobs that move us to a zero carbon future. We would also
like to see an acceleration of active labour market policies to match people with the jobs that do
exist such as horticulture – many of which would normally be in the category that would pay the
minimum wage; and creative ways such as increasing eligibility and length of paid parental leave
to temporarily reduce labour supply.
In our view these initiatives would have a far greater impact on reducing unemployment than
deferring or cancelling the previously signalled increase to the minimum wage.
Effect on productivity
The received wisdom is that wages are low because productivity is low – putting aside the fact
that wages have not increased consistent with the even low levels of labour productivity.
The CTU’s view however is the converse. Productivity is low because wages are low, thereby
giving firms no incentive to innovate or invest in capital which would increase productivity. The
CTU’s detailed analysis of the role of increased wages in enhancing productivity can be found in
section 7 of our 2015 submission.
10 https://www.business.govt.nz/covid-19/financial-support-for-businesses/

7 CTU Monthly Economic Bulletin –October 2020
But what about inflation?
Given that the Reserve Bank is undertaking quantitative easing and signalling negative interest
rates due to the deflationary pressures in the economy, the CTU is of the view that a 5.8%
increase to the lowest paid workers will help the Reserve Bank resist deflationary pressures. We
also note that as 61% of the businesses surveyed by Business NZ, were looking to pay their staff
at least the living wage in any case.
Won’t this be expensive for the government too?
The CTU expects any increase to the minimum wage to be fiscally positive for the government.
This is because the Government has already agreed to pay all directly engaged and contractors in
the Public Sector a Living Wage. As the Living Wage is currently higher than the signalled increase
of $20 there would be no additional fiscal cost to the Government.
The fiscal positivity will arise because any increase in the pay of minimum wage recipients will be
clawed back by the Government at a rate between 17.5% and 79.5% depending on whether the
person concerned receives Working for Families, accommodation supplement or has a student
loan.
For this reason, the CTU supports a raising of the thresholds and abatement rates to lessen this
transfer from low income workers to the government.
Aren’t there easier or better ways to reduce poverty?
The thing is that poverty is a multidimensional phenomenon that requires many things to fix.
One factor is increasing the minimum wage. Other factors include:
• Raising benefit levels so that no one lives in hardship
• Increasing the Working for Families thresholds and abatement levels
• Decreasing barriers – cost and otherwise – to early childhood education
• Reducing rents so that everyone has a warm dry home without breaking the bank
• Providing universal basic services such as healthcare, education and internet connectivity.
All factors are equally important. As discussed above, for people with children, much of any
minimum wage increase can be clawed back. Therefore, there a lot to be said for increasing
thresholds or reducing abatement levels, or having rents fall. These options have merit
independent of any minimum wage increase and should be also be advanced. However, we do
not see such initiatives as alternatives to increasing the minimum wage for all the reasons
previously discussed.
8 CTU Monthly Economic Bulletin –October 2020
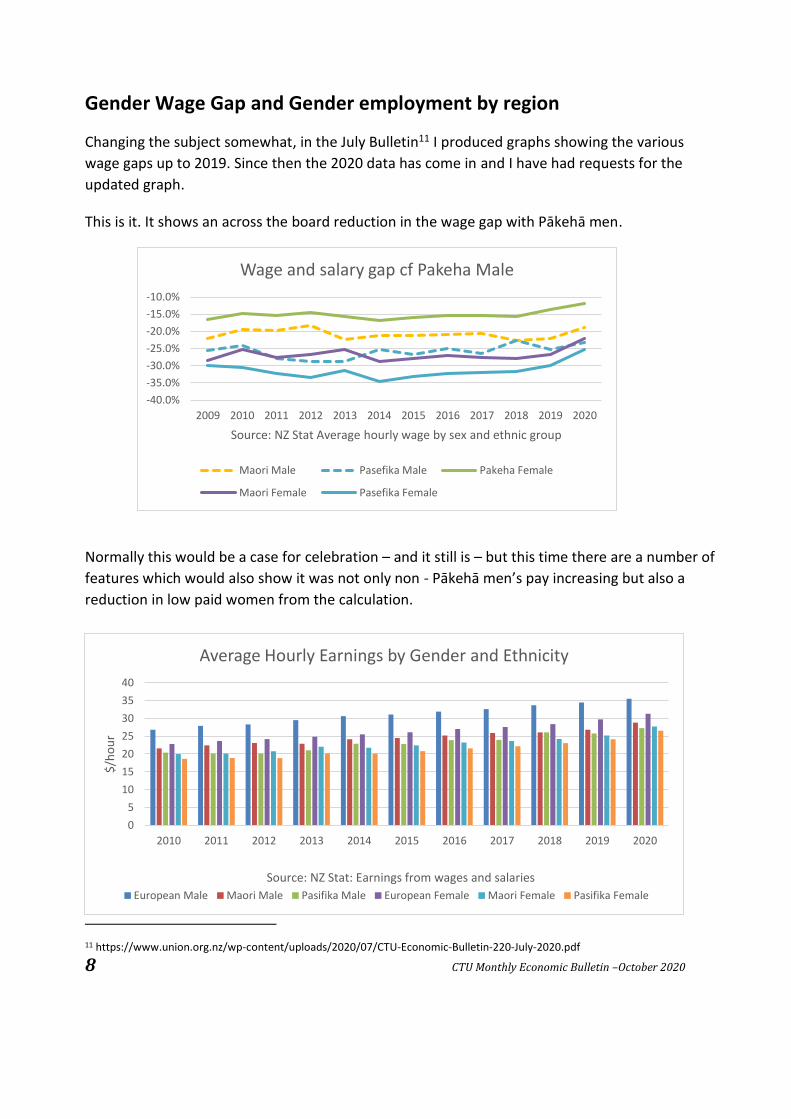
Gender Wage Gap and Gender employment by region
Changing the subject somewhat, in the July Bulletin11 I produced graphs showing the various
wage gaps up to 2019. Since then the 2020 data has come in and I have had requests for the
updated graph.
This is it. It shows an across the board reduction in the wage gap with Pākehā men.
Normally this would be a case for celebration – and it still is – but this time there are a number of
features which would also show it was not only non - Pākehā men’s pay increasing but also a
reduction in low paid women from the calculation.
11 https://www.union.org.nz/wp-content/uploads/2020/07/CTU-Economic-Bulletin-220-July-2020.pdf
-40.0%
-35.0%
-30.0%
-25.0%
-20.0%
-15.0%
-10.0%
2009 2010 2011 2012 2013 2014 2015 2016 2017 2018 2019 2020
Source: NZ Stat Average hourly wage by sex and ethnic group
Wage and salary gap cf Pakeha Male
Maori Male Pasefika Male Pakeha Female
Maori Female Pasefika Female
0
5
10
15
20
25
30
35
40
2010 2011 2012 2013 2014 2015 2016 2017 2018 2019 2020
$/h
ou
r
Source: NZ Stat: Earnings from wages and salaries
Average Hourly Earnings by Gender and Ethnicity
European Male Maori Male Pasifika Male European Female Maori Female Pasifika Female

9 CTU Monthly Economic Bulletin –October 2020
As discussed in the August bulletin12, there was a reduction in women’s full and part time
employment which disproportionately impacted those employed in Retail and Accommodation
and Food Services.
And finally, this month I was asked about the regional breakdown of the fall in women’s employment in the year to June 2020.
12 https://www.union.org.nz/wp-content/uploads/2020/09/CTU-Economic-Bulletin-221-August-2020.pdf
-7000-5000-3000-10001000300050007000
Fore
stry
an
d M
inin
g
Man
ufa
ctu
rin
g
Elec
tric
ity,
Gas
,W
ater
an
d W
aste
…
Co
nst
ruct
ion
Wh
ole
sale
Tra
de
Ret
ail T
rad
e
Acc
om
mo
dat
ion
an
dFo
od
Se
rvic
es
Tran
spo
rt, P
ost
alan
d W
areh
ou
sin
g
Info
rmat
ion
Med
iaan
d…
Fin
anci
al a
nd
Insu
ran
ce S
ervi
ces
Ren
tal,
Hir
ing
and
Rea
l Est
ate
Ser
vice
s
Pro
fess
ion
al,
Scie
nti
fic,
…
Pu
blic
Ad
min
istr
atio
n a
nd
…
Edu
cati
on
an
dTr
ain
ing
Hea
lth
Car
e an
dSo
cial
Ass
ista
nce
Art
s, R
ecr
eati
on
an
dO
the
r Se
rvic
es
Nu
mb
er o
f p
aid
em
plo
yees
Source: Stats NZ QEX016AA
Change in wage/salary full and part-time employment Year to June 2020
Male Part-Time Paid Employee Male Full-Time Paid Employee
Female Part-Time Paid Employee Female Full-Time Paid Employee

10 CTU Monthly Economic Bulletin –October 2020
Here is the graph I introduced in August which compares male and female employment:
And here it is broken down by region. It appears that the fall in women’s employment is predominately in the Auckland region which is not something I had previously been aware of.
-20
-15
-10
-5
0
5
Nu
mb
er (
00
0)
Source: Stats NZ Earnings from Wages and Salaries by sex and region
Change in wage/salary employment2019-2020
Male Female
1,050.00
1,055.00
1,060.00
1,065.00
1,070.00
1,075.00
1,080.00
1,085.00
1,090.00
2019Q2 2019Q3 2019Q4 2020Q1 2020Q2
(00
0)
Source: Stats NZ HLF267AA
Male v Female Employment
Total male employees Total female employees

11 CTU Monthly Economic Bulletin –October 2020
As always, I welcome feedback to [email protected].
Kia Kaha
Andrea
The NZIER consensus forecast was released on 14 September 2020
Annual Percentage Change (March Year) 2019/20 2020/21 2021/22 2022/23
GDP 1.7 -7.2 6.7 3.5
CPI 2.5 0.4 0.9 1.6
Private Sector average hourly wage 3.4 1.8 1.4 1.9
Employment 1.5 -5.2 3.1 2.8
Unemployment rate (% of labour force) 4.2 7.8 6.8 5.8

12 CTU Monthly Economic Bulletin –October 2020
Economic Indicators – October 2020
This month the total number of people receiving income support from the Government slightly
declines alongside a wind down of the wage subsidy.
The House market continued to rise as did the share and bond markets. On a cumulative basis
house price increases have outstripped wage increases since at least 2015. Rent continue to rise
with a decline in food but with both their indexes now exceeding the CPI.
1) Jobseeker Support and Covid-19 Income Relief Payment13
Compared to a month ago – 18 September – the total number of people on Jobseeker Support or
the Covid Income Relief Payment has fallen slightly by approximately 2,200 people.
13 https://www.msd.govt.nz/documents/about-msd-and-our-work/publications-resources/statistics/benefit/2020/income-support-and-wage-subsidy-weekly-update/income-support-and-wage-subsidy-weekly-update-16-october-2020.pdf

13 CTU Monthly Economic Bulletin –October 2020
2) Wage Subsidy
As the wage subsidy winds down, at 16 October there were 52K jobs supported by the subsidy
down from a peak of 1.7 million.
3) Rent, Food and CPI.
Rent – stock – is up 0.2% for the month of September and up 3.25% for the year to September
2020. Food has declined by 1% in the month but increased by 3.1% in the year. The consumer
price index (CPI) has increased by 1.4% in the year to September 2020 and 0.7% in the
September quarter. This was driven by higher vegetable, rates and public transport prices.
100
105
110
115
120
125
130
135
140
20
10
M0
9
20
11
M0
9
20
12
M0
9
20
13
M0
9
20
14
M0
9
20
15
M0
9
20
16
M0
9
20
17
M0
9
20
18
M0
9
20
19
M0
9
20
20
M0
9
Ind
ex R
ebas
ed M
arch
20
10
= 1
00
Source: Stats NZ CPI009AA, CPI045AA and CPI004AA rebased to 2010
Rent and Food Indexes v. CPI
Rent - stock
Food
CPI

14 CTU Monthly Economic Bulletin –October 2020
4) The sharemarket
At 27 October the sharemarket at 12,305 was higher than its late February 2020 peak of
12,073.14
14 https://www.bloomberg.com/quote/NZSE50FG:IND
-2%
0%
2%
4%
6%
8%
20
10
M0
9
20
11
M0
9
20
12
M0
9
20
13
M0
9
20
14
M0
9
20
15
M0
9
20
16
M0
9
20
17
M0
9
20
18
M0
9
20
19
M0
9
20
20
M0
9
Per
cen
tage
Ch
ange
on
Sam
e M
on
th P
revi
ou
s Ye
ar
Source: Stats NZ CPI009AA, CPI045AA and CPI004AA rebased to 2010
Annual Change in Cost of Rent and Food v. CPI
Rent- flow
Food
CPI
15 CTU Monthly Economic Bulletin –October 2020
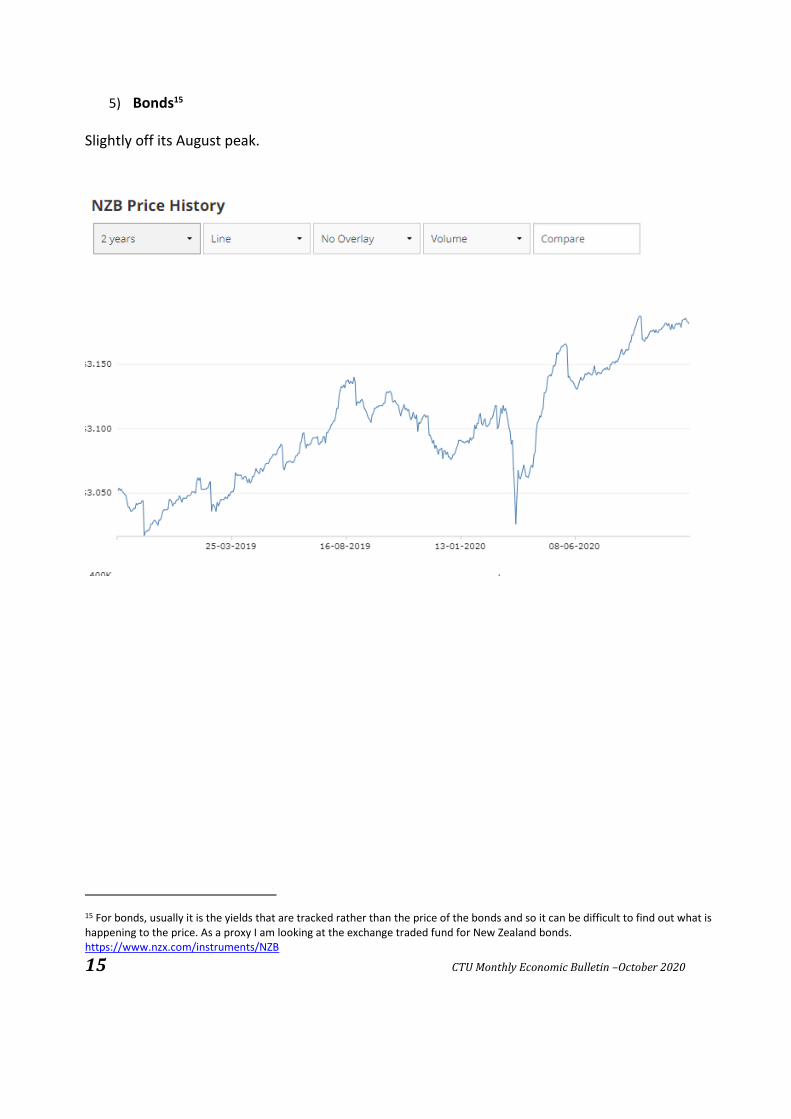
5) Bonds15
Slightly off its August peak.
15 For bonds, usually it is the yields that are tracked rather than the price of the bonds and so it can be difficult to find out what is happening to the price. As a proxy I am looking at the exchange traded fund for New Zealand bonds. https://www.nzx.com/instruments/NZB

16 CTU Monthly Economic Bulletin –October 2020
6) House prices16
The brief Lockdown 1.0 price drop is now over and house prices as at September continue to
increase steadily. The decline I has hoped for in March continues as a memory.
The Treasury at the Pre-election Fiscal Update provided a file of the House price index back to
200617 so, just for kicks, I rebased it and wages to 2006 and plotted the trajectory. As expected,
house price rises have been outstripping wage increases since at least 2015.
16 https://www.reinz.co.nz/Media/Default/Statistic%20Documents/2020/July/REINZ%20Monthly%20HPI%20Report%20-%20July%202020.pdf https://treasury.govt.nz/publications/weu/weekly-economic-update-17-july-2020-html 17 https://www.treasury.govt.nz/publications/efu/pre-election-economic-and-fiscal-update-2020 Figure 1.7 Charts and Data.
80
100
120
140
160
180
200
Reb
ased
to
10
0 Q
22
00
6
Source:Stats NZ QEX003AA and Core Logic/Treasury Prefu 2020
House prices v Average Hourly EarningsCumulative effect
Changes in hourly earnings Changes in house prices
17 CTU Monthly Economic Bulletin –October 2020
Notes This bulletin is available online at http://www.union.org.nz/economicbulletin223. For further information
contact Andrea Black

Parliamentary Library, Research and Information February 2020 (latest data as at 11 February 2020)
18
July 2020 (latest data as at 6 July 2020) 8