Embed Size (px)
Citation preview
ABN 45 066 383 971
ASX Market Announcements ASX Limited Exchange Centre Level 4, 20 Bridge Street Sydney NSW 2000 Annual Report 2015/16 Attached please find Cue Energy Resources Limited’s release with respect to the above mentioned. Yours faithfully
Andrew M Knox Chief Financial Officer
20 October 2016 PAGES (including this page): 89
CUE ENERGY OVERVIEW Cue is an Australian based oil and gas company with activities in Australia, New Zealand, Indonesia and the USA. THE COMPANY HAS: Long life production A strong balance sheet An active exploration programme
CUE ENERGY DIRECTORS Grant Worner (Executive Chairman) Koh Ban Heng Duncan Saville Brian Smith
CUE ENERGY MANAGEMENT Andrew Knox (CFO) Jeffrey Schrull (Exp Man)
OFFICE
Level 19 357 Collins Street Melbourne Vic 3000
CONTACT DETAILS Tel: +613 8610 4000 Fax: +613 9614 2142
EMAIL [email protected]
WEBSITE www.cuenrg.com.au
LISTINGS ASX: CUE ADR/OTC: CUEYY
For
per
sona
l use
onl
y

Annual Report 2015/16
For
per
sona
l use
onl
y

CUE
ENER
GY R
ESOU
RCES
LIM
ITED:
ANN
UAL R
EPOR
T 201
5/16
Contents1 About
2 Snapshot of 2015/16
3 Activity Overview
4 Joint Ventures
5 Corporate Directory
6 Executive Chairman’s Overview
13 Reserves and Resources
18 Directors’ Report
33 Auditor’s Independence Declaration
34 Directors’ Declaration
35 Financial Statements
36 Consolidated Statement of Profit or Loss and Other Comprehensive Income
38 Consolidated Statement of Financial Position
39 Consolidated Statement of Changes in Equity
40 Consolidated Statement of Cash Flows
41 Notes to the Financial Statements
81 Independent Auditor’s Report
83 Shareholder Information
For
per
sona
l use
onl
y
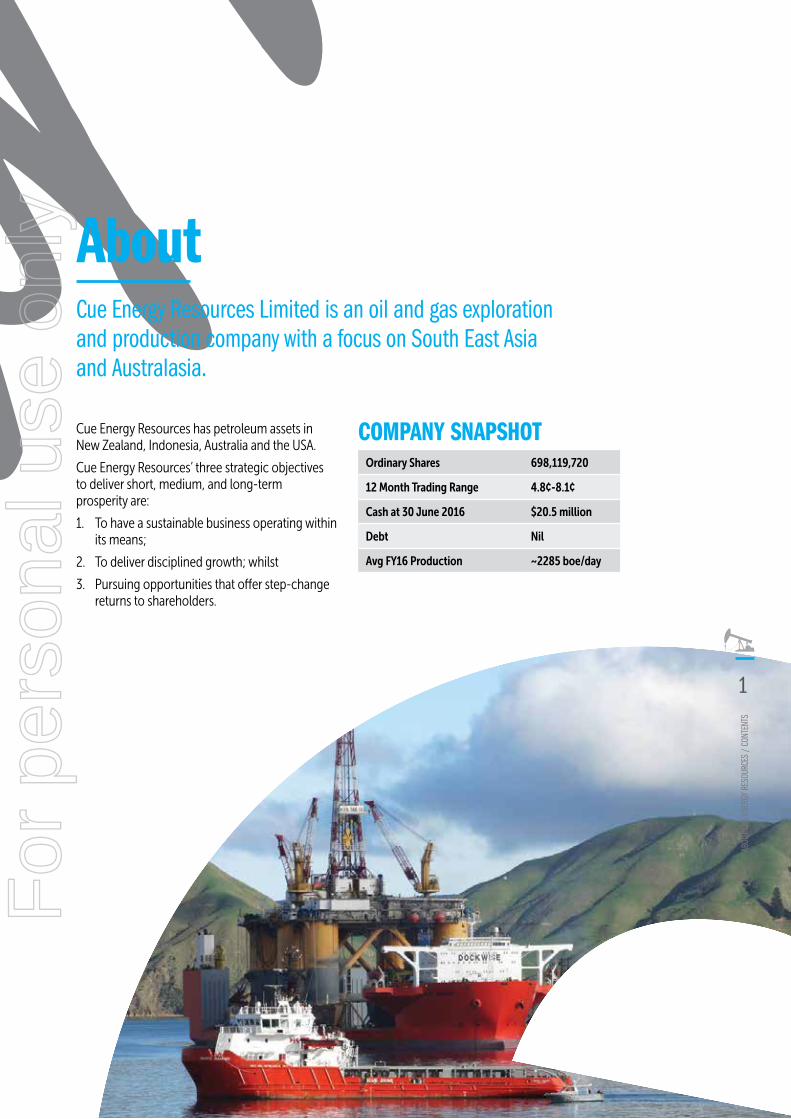
Cue Energy Resources Limited is an oil and gas exploration and production company with a focus on South East Asia and Australasia.
Cue Energy Resources has petroleum assets in New Zealand, Indonesia, Australia and the USA.
Cue Energy Resources’ three strategic objectives to deliver short, medium, and long-term prosperity are:
1. To have a sustainable business operating within its means;
2. To deliver disciplined growth; whilst
3. Pursuing opportunities that offer step-change returns to shareholders.
COMPANY SNAPSHOTOrdinary Shares 698,119,720
12 Month Trading Range 4.8¢-8.1¢
Cash at 30 June 2016 $20.5 million
Debt Nil
Avg FY16 Production ~2285 boe/day
About
ABOU
T CUE
ENE
RGY R
ESOU
RCES
/ C
ONTE
NTS
1
For
per
sona
l use
onl
y

Snapshot 2015/16
GROSS PROFITFROM
PRODUCTION2016: $14.83 million2015: $12.92 million
CUE HASRATIONALISEDEXPLORATION
PORTFOLIO
2 WELLS DRILLED
CUE ENERGY HAS $20.5M CASH ANDNO DEBT
15% INCREASE
PRODUCTIONREVENUE
2016: $45.41 million2015: $36.70 million
24% INCREASE
BARRELS OF OIL EQUIVALENTPRODUCED2016: 0.83 million2015: 0.66 million
24% INCREASE
The Company achieved significant growth in production and revenues from continuing operations that enabled gross profit to grow by 15% to $14.83 million from a 24% increase in production revenue to $45.41 million. However as a result of non-cash impairments of exploration and production assets and a change in accounting policy from full cost to successful efforts for exploration and evaluation expenditure, Cue delivered a net loss after tax of $87.46 million.
CUE
ENER
GY R
ESOU
RCES
LIM
ITED:
ANN
UAL R
EPOR
T 201
5/16
2
For
per
sona
l use
onl
y

ACTIV
ITY O
VERV
IEW
/ SN
APSH
OT 2
015/
16
3
Australia• Cue has identified and matured the
world class Ironbark gas prospect which straddles the WA-359-P and WA-409-P permits offshore Western Australia (Cue 100% and operator). Cue received an extension of the drilling commitment in WA-359-P until April 2018 and have received an offer for renewal of WA-409-P. A farm-out process was initiated in September 2015 to find a suitable partner(s) to participate in the Ironbark-1 exploration well. Discussions are still underway and Cue are hopeful a Joint Venture will be formed in the second half of 2016.
New Zealand• The Maari Field Growth drilling
campaign in New Zealand was completed in July 2015. The Field now has 10 producing wells and 1 injection well. An intervention was completed on schedule and budget in early 2016 to fully repair and upgrade the mooring system which should now last beyond 2023. A project is planned for late 2016 to repair the water injection line, which was suspended during the year, and restart the critical pressure maintenance for the field. The Operator (OMV) is now focused on implementing a production optimization strategy along with appropriate cost reduction measures.
USA• Cue operated the Pine Mills field in East
Texas during the year and through a number of projects stabilized production at ~100 bopd. There were no Lost Time Injuries or safety incidents during the year. Due to a strategic change in direction the company announced it expects to sell the field in the second half of 2016.
Indonesia• The Sampang PSC benefitted from
very consistent gas production from Oyong and Wortel of ~65-70 mmcfd and also the previously announced improved terms of the new Oyong Gas Sales Agreement which started in July 2015. Oil production continued to decline to ~1,000 bopd and the Operator (Santos) has proposed a Sampang Sustainability Project which would switch the operations to gas only, significantly reducing operating costs and extending field life beyond 2020. The Joint Venture also evaluated the remaining exploration potential in the PSC, upgrading the Paus prospect to a possible drill candidate.
• The Naga Selatan-2 well (Mahakam Hilir PSC) was drilled and suspended with no Lost Time Injuries or safety incidents. The well encountered numerous hydrocarbon shows and recovered both oil and gas samples to the surface. The well data and additional G&G studies were progressed to develop an appropriate appraisal programme which is planned for 2017. The company is also considering farming down from the current 100% equity as a possible means for funding future drilling and testing.
• Final terms of the Joint Operating agreement are being negotiated in the Mahato PSC in Indonesia.
Activity Overview
For
per
sona
l use
onl
y

Head OfficeMelbourne
INDONESIA
AUSTRALIA
NEW ZEALAND
UNITED STATES
CANADA
MEXICO
Joint Ventures
INDONESIAMahakam Hilir PSC*Cue ......................................................100%Sampang PSC*Santos ................................................... 45%SPC .......................................................... 40%Cue(i) .........................................................15%Mahato PSC*Texcal Central Sumatra ............. 62.50%Bukit Energy ........................................ 25%Cue .....................................................12.50%
AUSTRALIACarnarvon Basin PermitsWA-359-P*Cue ......................................................100%WA-389-P*BHP Billiton ......................................... 60%Cue .......................................................... 40%WA-409-P*Cue ......................................................100%
NEW ZEALANDMaari and Manaia Oil FieldsPMP 38160*OMV ...................................................... 69%Todd .........................................................16%Horizon ...................................................10%Cue .............................................................5%
UNITED STATESPine Mills Permit*Cue ........................................................80%Gale Force Petroleum ........................ 20%
Additional Information(i) 8.181878% in the Jeruk field
* Operator
CUE
ENER
GY R
ESOU
RCES
LIM
ITED:
ANN
UAL R
EPOR
T 201
5/16
4
For
per
sona
l use
onl
y

UNITED STATES
CANADA
MEXICO
Corporate Directory
DirectorsGrant A. Worner (Executive Chairman) BE(Chemical Ist Hons), MBA, GAICD
Koh Ban Heng BSc, GDipBA
Duncan P. Saville BCom. (Hons), BSc (Hons), FCA, F Fin, FAICD
Brian L. Smith
Chief Financial Officer/ Company SecretaryA.M. Knox BCom, CA, CPA, FAICD
Co-Company SecretaryP.M. Moffatt BCom, FGIA, AAICD
Registered OfficeLevel 19, 357 Collins Street Melbourne Victoria 3000 Australia
Telephone: + 61 3 8610 4000 Facsimile: + 61 3 9614 2142 Website: www.cuenrg.com.au Email: [email protected]
ABN 45 066 383 971
Stock Exchange ListingsAUSTRALIA Australian Securities Exchange Ltd 525 Collins Street Melbourne, Victoria 3000 Australia
UNITED STATES OF AMERICA OTC OTC Markets 304 Hudson Street 3rd Floor New York, NY 10013 USA
AuditorBDO East Coast Partnership Level 14, 140 William Street Melbourne Victoria 3000 Australia
BankersANZ Banking Group Limited 91 William Street Melbourne Victoria 3000 Australia
National Australia Bank Limited Level 4, 330 Collins Street Melbourne Victoria 3000 Australia
Green Bank 2900 North Loop West Houston TX 77092 US
PT. Bank Mandiri (Persero) Tbk Corporate Banking V Group Plaza Mandiri, 1st Floor Jl. Jend. Gatot Soebroto Kav 36-38 Jakarta 12190, Indonesia
Share RegistryAUSTRALIAComputershare Investor Services Pty LtdYarra Falls, 452 Johnston Street Abbotsford, Victoria 3067 Australia
GPO Box 2975 Melbourne, Victoria 3000 Australia
Telephone: 1300 850 505 (within Australia) or +61 3 9415 4000 (outside Australia) Email: [email protected] Website: www.computershare.com.au
JOIN
T VEN
TURE
S /
CORP
ORAT
E DI
RECT
ORY
5
For
per
sona
l use
onl
y

CUE
ENER
GY R
ESOU
RCES
LIM
ITED:
ANN
UAL R
EPOR
T 201
5/16
6 Cue has a solid cash position, earns significant free cash flow from its production of oil in New Zealand and gas in Indonesia, is debt free, retains an attractive portfolio of assets and opportunities.
The outcome from these exploration and production growth initiatives have been mixed. The Sampang field life has successfully been extended and the Maari Growth Project has delivered additional production, though less than expected. Four non-operated exploration wells were drilled in New Zealand and Indonesia and all have been unsuccessful or uncommercial. A fifth operated well, the Naga-Selatan-2 in Indonesia, was drilled in the first quarter of 2016 and its results are under technical review. To date, the returns and value accretion from the asset acquisitions in the USA and Indonesia have been disappointing. Unfortunately Cue’s implementation of the strategy of growing reserves and production coincided with a significant decline in oil prices, contributing to disappointing financial returns. The Company’s cash balance declined for a third consecutive year and at the end of June 2016 was $20.5 million compared with $58.8 million at the end of June 2013.
Dear shareholder,
I am pleased to provide my first report to shareholders as Chairman of the Board. At the outset I wish to acknowledge and thank Cue’s staff for their efforts over the last twelve months and assistance since my arrival.
Since 2013, Cue has operated under a strategy of aiming to increase production and reserves in Asia, Australia, and New Zealand with a goal of adding 5 million barrels of reserves by the end of calendar year 2018. At that time the Company declared its only measures of success would be material increases to production and reserves. In attempting to achieve these stated goals over the last three years Cue used a large portion of their cash balance and revenues earned to fund exploration, development and asset acquisitions.
Executive Chairman’s Overview
For
per
sona
l use
onl
y

7
As shareholders you would be aware that the mixed results from growth initiatives, a declining cash balance, and lower oil prices have resulted in a diminished valuation of Cue over the last three years.
In the 2015/16 year shareholders exercised their rights and chose to refresh the Company’s Board of Directors. On the back of these appointments the new Board reset Cue’s strategy, setting three objectives for Cue:
1. To have a sustainable business operating within its means;
2. To deliver disciplined growth; whilst
3. Pursuing opportunities that offer step-change returns to shareholders.
2015/2016 PERFORMANCEProductionCue’s share of sales production for the year from our New Zealand and Indonesian fields was 0.833 million barrels of oil equivalent (mmboe), a 24% increase from the previous year.
Growth Initiatives a. The Sampang joint venture in Indonesia focused on
extending field life until at least 2018 and evaluating the remaining exploration potential in the permit. The extension of the predominantly gas production from the Oyong and Wortel fields and the gas sales on long-term contracted prices provides a level of financial protection against weak crude oil prices. The Oyong and Wortel Fields produced approximately 1,000 barrels of oil per day (bopd) and 60-65 million cubic feet per day (mmcf/d), equivalent to 10 to 11 thousand barrels of oil per day, with no major capex projects or planned shut-downs required. The Sampang Sustainability Project was launched aiming to extend the field life of the Oyong and Wortel fields from 2018 to 2020 or beyond;
b. The Maari joint venture in New Zealand focused on ensuring the asset integrity of the Floating Production Storage Offloading (FPSO) vessel and well-head platform while maximising current and ultimate recovery from the field. A major intervention was planned for the first half of 2016 to fully repair the mooring system and repair the damaged water injection line. The mooring repair was achieved on schedule and budget but due to weather constraints the water injection line is now scheduled to be completed in December 2016. Daily production from the Maari field varied during the fiscal year between about 9,000 – 16,000 bopd as a function of well work-overs and natural decline of the reservoirs with the rate at end June 2016 of circa 12,000 bopd;
c. Production at Pine Mills has been disappointing. The expected production growth did not eventuate because attention and investment was required to ensure the integrity of the assets. By the end of June 2016 production had stabilized at a little over 100 bopd. Cue has recently announced a plan to exit the USA.
d. Drilling results have been a disappointment
• The non-operated onshore Te Kiri North -1 well in the Taranaki Basin in New Zealand was drilled and abandoned as a dry hole in late January 2016;
• The 100% owned and operated Naga-Selatan-2 well in the Mahakam Hilir PSC onshore Kutei Basin in Indonesia encountered oil shows and high background gas. Cue subsequently received a 4-year extension of the exploration permit in May 2016;
• Two wells were expected to be drilled in the first half of 2016 in the Mahato PSC in onshore central Sumatra in Indonesia but progress stalled as the joint venture partners have not signed a legally binding Joint Venture agreement; and
e. Farming out the highly significant Ironbark prospect in offshore Western Australia commenced with major oil companies accessing the data room and reviewing the opportunity. Pleasingly, the Company received an extension for the drilling of the Ironbark well in WA-359-P from NOPTA in the first half of 2016 which allows for an exploration well to be deferred to April 2018.
FinancialsIn the 2015/16 year, the Company’s production revenues, from continuing operations, grew by circa 24% supporting a 15% gross profit growth. However when taking account of overheads and exploration expenses, but before insurance proceeds ($3.7 million), tax ($4.9 million expense) and impairments ($76.3 million) are taken into account, Cue operated at a loss of $10.0 million for the year.
As declared in the Preliminary Financial Report, at the end of the 2015/16 year Cue impaired a number of exploration and production assets and in addition, changed its accounting policy from capitalising full cost to successful efforts for exploration and evaluation expenditure. As a result of these changes Cue’s net loss after tax in 2015/16 was $87.5 million.
At year end Cue’s cash balance was $20.5 million, down from $27.6 million the previous year. A key short-term objective of Cue’s new strategy is to limit further cash erosion by continuing to reduce overheads and manage exploration expenses carefully.
ExEC
UTIV
E CH
AIRM
AN'S
OVE
RVIE
w
7
For
per
sona
l use
onl
y

2016/17 EXPECTATIONSShareholders should expect to see progress in all three strategic objectives in the 2016/17 year.
Sustainable businessIf the current economic conditions persist approximately two-thirds of Cue’s revenues will continue to emanate from gas sales that are independent of oil price, meaning the Company is substantially protected from any further declines in oil prices and has the potential for revenue upside if oil prices rise. The historic investment in development project initiatives at Maari and Sampang, barring any production interruptions, should enable consistent production in 2016/17.
Historic overheads were too high for a Company of Cue’s size and actions were taken to reduce corporate overheads and administration expenses by 40% on a cash basis from approximately $7.2 million each calendar year to a run rate of $4.4 million per annum by the end of December 2016.
The Company will have a more focused portfolio and will reduce overheads further with a view to becoming cash flow positive. Consistent with this objective, Cue’s Directors have agreed to an additional reduction in remuneration such that after the Annual General Meeting the cumulative Board fees will be $160k per annum compared with the 2015 fees of $466k and $481k in 2016.
Disciplined growthThere are minimal interventions or major capital projects anticipated for either Maari or Sampang in the 2016/17 year. Sampang’s field life extension to 2020 or beyond will require minimal capital and will largely be funded within operating expenses. The project to convert the Oyong and Wortel fields to produce and process only gas and cease uneconomic oil production should reduce production costs by approximately 50% per annum, increase 2P reserves by 37%, and increase operating margins by 34%.
The Sampang joint venture has identified near term exploration potential that if successful, could further extend the gas production from the Sampang PSC beyond 2020. The Paus prospect is believed to be a low risk opportunity and a potential drilling candidate for the 2017/18 year. The joint venture should make a decision on whether to proceed within the next 12 months.
Additional geology and geophysics activities are planned in the Mahakam Hilir PSC in 2016/17 to assess the Naga-Selatan prospect and have a firmly defined appraisal strategy for the licence. The Company will consider obtaining funding for future drilling in the Mahakam Hilir permit by seeking a suitable industry partner(s).
Cue will limit its exploration expenditure in the Mahato licence until the Company’s legal rights are protected.
Furthermore, Pine Mills in the USA is expected to be sold and the remaining exploration acreage in New Zealand will be surrendered.
Consequently, Cue should have a more focused production and exploration portfolio in the next 12 months. Following the portfolio changes mentioned above Cue will continue to receive revenues from oil production in Maari and mainly gas production in Sampang with near-term reserve growth opportunities in Indonesia.
Step-change OpportunitiesCue completed a comprehensive regional study using 15,000km2 of 3D and 2D seismic data and 17 well ties to map the Triassic intra-Mungaroo sands (as encountered at the Gorgon gas field) and identified a drillable target within the Ironbark prospect which straddles the 100% owned WA-359-P and WA-409-P in moderate water depths.
Ironbark is a giant Mungaroo Formation prospect that is mapped with an area of up to 400km with a best technical estimate of 15 Trillion cubic feet (Tcf) of recoverable gas resource based on an internal technical assessment performed by Cue. To put this into perspective, if Cue’s assessment is proven to be correct, Ironbark would be three times the size of the Scarborough, Wheatstone, or Pluto fields. The Ironbark prospect is only about 60km from the North Rankin platform and Wood Mackenzie forecast that the associated Northwest shelf LNG plants and infrastructure will have spare capacity from 2021.
Having de-risked the opportunity as much as it could afford, Cue recognised it needed partners that have the credibility, balance sheet and technical expertise to drill an exploration well and subsequently began a farm-out process in 2015/16. The Company is hopeful that it will have a joint venture formed with a suitable major industry partner(s) in the next financial year. To aid in the attractiveness of the opportunity Cue applied for a renewal of WA-409-P to ensure sufficient tenure of the licence.
In summary, Cue has a solid cash position, earns significant free cash flow from its production of oil in New Zealand and gas in Indonesia, is debt free, retains an attractive portfolio of assets and opportunities, and is strongly supported by shareholders who have taken large stakes in the Company.
In 2016/17 Cue will deliver a three part strategy of; controlling costs to ensure there is a sustainable business that is funded by producing assets, operating with a more focused portfolio investing in near term and affordable growth opportunities, and seeking industry partnerships capable of executing and funding our high impact step change opportunity.
Mr Brian Smith has chosen not to seek re-election at the upcoming Annual General Meeting and won’t be replaced. On behalf of the Board I would like to thank Brian and former Cue Directors, Mr Andrew Knight, Mr Paul Foley, Mr Stuart Brown, Mr Peter Hazledine, Mr Geoffrey King, and Mr Andrew Young, for their contribution to Cue during the year.
CUE
ENER
GY R
ESOU
RCES
LIM
ITED:
ANN
UAL R
EPOR
T 201
5/16
8
For
per
sona
l use
onl
y

PRODUCTIONNEW ZEALAND PMP 38160 Cue Interest: 5% Operator: OMV New Zealand Limited
Maari and Manaia Fields
The Maari Field now has a total of 10 producers and one water injector and was averaging ~12,000 bopd at the end of June 2016. No further drilling is currently planned and the focus going forward is to maximise production by optimising the up-time and deliverability of the wells. The only naturally flowing well is the MR6A well which was drilled as a producer in the Mangahewa reservoir during the growth project. The other 9 producers all rely on pumps (ESP’s) for continued production and the Operator is optimising the use of the ESP’s and top-sides facilities to enhance production. There is a work-over rig on the well-head platform to perform well interventions as required. An exciting production enhancement now being undertaken is adding additional perforations that are currently behind pipe of existing producers. The first one of these was the previously announced MR8A well which initially added ~1600 bopd. Similar workovers are planned for the MR9 and MN1 wells in Q3, calendar 2016.
The only planned shut-down over the next year is in December 2016 to repair the water injection line. Once this project is complete water injection will be reinitiated and is anticipated to provide pressure support to some of the producing wells, increasing production and ultimate recovery.
MaariPMP 38160
Manaia
Tui
Maui
Taranaki Peninsula
10km
New Zealand
Cue Permit
Gas Field
Prospect
LEGEND
Cue Permit
Oil Field
Gas Field
Gas Condensate Field
LEGEND
Onshore Gas
Cue Permit
Oil Field
Gas Field
LEGEND
SEG Unitisation
Gas Line Liquids Line
Cue Permit
Oil Field
Gas Field
Gas Discovery
LEGEND
INDONESIA Sampang PSC- Madura Strait Cue Interest: 15% Operator: Santos (Sampang) Pty Ltd
Oyong and Wortel Fields
The Sampang JV plans to agree on a Final Investment Decision for the Sampang Sustainability Project (SSP) in Q4, calendar 2016 with project planning and execution starting in early 2017. This project will extend the Field life and estimated ultimate recovery for both Oyong and Wortel. Further details of this exciting project, which will add significant value to Cue will be disclosed once the Joint Venture has approved the SSP. Production is anticipated to continue at current rates of ~1000 bopd and the combined gas rate of 60-65 mmcfgd.
The Joint Venture in addition will be making decisions about the remaining exploration potential, in the Sampang PSC in H2, calendar 2016.
Madura Island
East Java Wortel Oyong
Grati Onshore Gas Facilities
Jeruk Peluang
Maleo
30km
Java
Cue Permit
Gas Field
Prospect
LEGEND
Cue Permit
Oil Field
Gas Field
Gas Condensate Field
LEGEND
Onshore Gas
Cue Permit
Oil Field
Gas Field
LEGEND
SEG Unitisation
Gas Line Liquids Line
Cue Permit
Oil Field
Gas Field
Gas Discovery
LEGEND
Java
Kalimantan
Sumatra
New Zealand
SAMPANG PSC LOCATION MAP
TARANAKI PENINSULA LOCATION MAPEx
ECUT
IVE
CHAIR
MAN
'S O
VERV
IEw
9
For
per
sona
l use
onl
y

USA Pine Mills – East Texas Cue Interest: 80% Operator: Cue Resources, Inc
Cue’s new strategic direction no longer includes on-shore production in the USA and a disposition strategy for Pine Mills is being implemented with a closing date anticipated in H2, calendar 2016.
EXPLORATIONINDONESIA Mahakam Hilir PSC Kutei Basin Cue Interest: 100% Operator: Cue Kalimantan Pte Ltd
Cue now holds a 100% interest in, and is the Operator of, the Mahakam Hilir PSC in the prolific Kutei Basin onshore Kalimantan. A four year extension to the exploration phase of the Mahakam Hilir PSC was received in May 2016. The extension includes 2 contingent wells in the first 2 years, in which Cue can elect to drill or withdraw from the PSC or continue for the following 2 years with the wells as firm commitments.
Analysis of the Naga Selatan-2 discovery is continuing focusing on estimating flow potential for oil and gas from both matrix and fracture porosity. Several data collection initiatives are also underway to fully assess the resource focused on delineating areas of optimal reservoir quality and fractures for potential appraisal locations. These
Alba
Quittman
Yantis
Nola-Edwards
Pine Mills
McCrary
Winsboro
Hawkins
Haynesville Dome
Wood County, Texas
10 km
United States
Cue Permit
Gas Field
Prospect
LEGEND
Cue Permit
Oil Field
Gas Field
Gas Condensate Field
LEGEND
Onshore Gas
Cue Permit
Oil Field
Gas Field
LEGEND
SEG Unitisation
Gas Line Liquids Line
Cue Permit
Oil Field
Gas Field
Gas Discovery
LEGENDUnited States
Pelarang Samarinda
Sanga Sanga
Pamaguan
Sambutan
Nangka
Mahakam HilirPSC
5km
NS-2 Well
Cue Permit
Gas Field
Prospect
LEGEND
Cue Permit
Oil Field
Gas Field
Gas Condensate Field
LEGEND
Onshore Gas
Cue Permit
Oil Field
Gas Field
LEGEND
SEG Unitisation
Gas Line Liquids Line
Cue Permit
Oil Field
Gas Field
Gas Discovery
LEGEND
Java
Kalimantan
Sumatra
PINE MILLS LOCATION MAP MAHAKAM HILIR PSC LOCATION MAP
CUE
ENER
GY R
ESOU
RCES
LIM
ITED:
ANN
UAL R
EPOR
T 201
5/16
10
For
per
sona
l use
onl
y
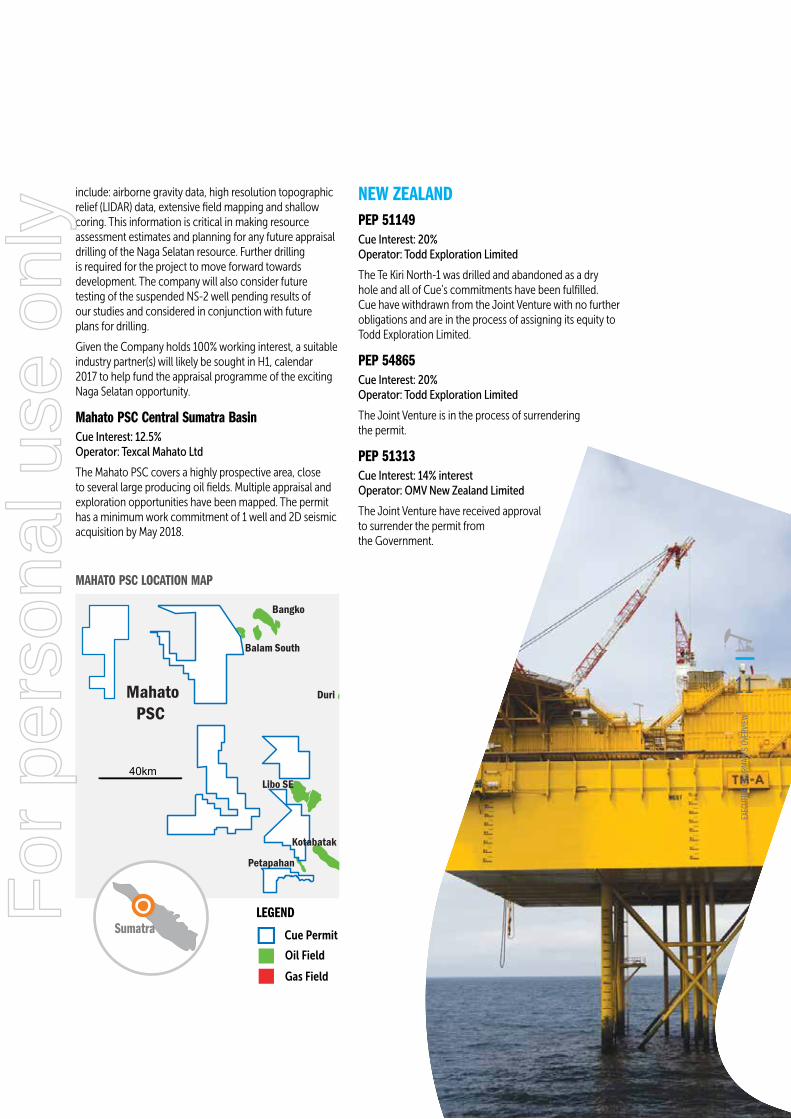
include: airborne gravity data, high resolution topographic relief (LIDAR) data, extensive field mapping and shallow coring. This information is critical in making resource assessment estimates and planning for any future appraisal drilling of the Naga Selatan resource. Further drilling is required for the project to move forward towards development. The company will also consider future testing of the suspended NS-2 well pending results of our studies and considered in conjunction with future plans for drilling.
Given the Company holds 100% working interest, a suitable industry partner(s) will likely be sought in H1, calendar 2017 to help fund the appraisal programme of the exciting Naga Selatan opportunity.
Mahato PSC Central Sumatra Basin Cue Interest: 12.5% Operator: Texcal Mahato Ltd
The Mahato PSC covers a highly prospective area, close to several large producing oil fields. Multiple appraisal and exploration opportunities have been mapped. The permit has a minimum work commitment of 1 well and 2D seismic acquisition by May 2018.
Balam South
Mahato PSC
40km
Petapahan
Libo SE
Minas
Duri
Bangko
Kotabatak
Cue Permit
Gas Field
Prospect
LEGEND
Cue Permit
Oil Field
Gas Field
Gas Condensate Field
LEGEND
Onshore Gas
Cue Permit
Oil Field
Gas Field
LEGEND
SEG Unitisation
Gas Line Liquids Line
Cue Permit
Oil Field
Gas Field
Gas Discovery
LEGEND
NEW ZEALAND PEP 51149 Cue Interest: 20% Operator: Todd Exploration Limited
The Te Kiri North-1 was drilled and abandoned as a dry hole and all of Cue’s commitments have been fulfilled. Cue have withdrawn from the Joint Venture with no further obligations and are in the process of assigning its equity to Todd Exploration Limited.
PEP 54865 Cue Interest: 20% Operator: Todd Exploration Limited
The Joint Venture is in the process of surrendering the permit.
PEP 51313 Cue Interest: 14% interest Operator: OMV New Zealand Limited
The Joint Venture have received approval to surrender the permit from the Government.
Java
Kalimantan
Sumatra
MAHATO PSC LOCATION MAP
ExEC
UTIV
E CH
AIRM
AN'S
OVE
RVIE
w
11
For
per
sona
l use
onl
y

AUSTRALIAWA-359-P Cue Interest: 100% Operator: Cue Exploration Pty Ltd
Cue has evaluated the regional prospectivity in its Northern Carnarvon Basin permits and has identified an exciting new play type now referred to as the Deep Mungaroo Play (DMP). The Ironbark prospect has been identified as the primary candidate for testing the DMP and the ideal location is in WA-359-P where Cue currently has a well commitment. Cue has received approval to have the Permit Year 3 well commitment suspended to allow further time to mature the prospect and plan for drilling. The well is now required to be drilled by April 2018. Cue is continuing a farm-out process to find suitable joint venture partner(s) to participate in the drilling of the well.
WA-409-P Cue Interest: 100% Operator: Cue Exploration Pty Ltd
Cue acquired 100% of WA-409-P in February 2015 and is now Operator of the permit. The primary term expired in April 2016 and Cue have requested a renewal of the permit based on a work programme targeting the Deep Mungaroo Play focussed on the portion of the Ironbark prospect which extends into the Block. Cue expect to be granted the renewal in Q3, calendar 2016 and plan to continue the farm-out process for the Ironbark prospect.
WA-389-P
WA-359-P
25km
WA-389-PWA-389-P
WA-409-P
WA-359-P
Goodwyn Wheatstone
North Rankin Angel
Iago
PlutoEurytion
West Tryal Rocks
Io/Jansz
Australia
WA-360-P Cue Interest: 37.5% Operator: MEO Australia Limited
The WA-360-P Joint Venture has relinquished the permit with no outstanding obligations.
WA-361-P Cue Interest: 15% Operator: MEO Australia Limited
The WA-361-P Joint Venture has relinquished the permit with no outstanding obligations.
WA-389-P Cue Interest: 40% Operator: BHP Billiton Petroleum (Australia) Pty Ltd
Reprocessing of existing 2D and 3D seismic data is completed and fulfils the Joint Venture’s minimum work obligations. The data is now being interpreted to compile a block wide prospect portfolio.
Grant A. Worner Executive Chairman
30 September 2016
Cue Permit
Gas Field
Prospect
LEGEND
Cue Permit
Oil Field
Gas Field
Gas Condensate Field
LEGEND
Onshore Gas
Cue Permit
Oil Field
Gas Field
LEGEND
SEG Unitisation
Gas Line Liquids Line
Cue Permit
Oil Field
Gas Field
Gas Discovery
LEGEND
CARNARVON BASIN LOCATION MAP
CUE
ENER
GY R
ESOU
RCES
LIM
ITED:
ANN
UAL R
EPOR
T 201
5/16
12
For
per
sona
l use
onl
y

Reserves and ResourcesANNUAL RESERVES AND RESOURCES SUMMARYNET TO CUE ENERGY RESOURCES LIMITED AS AT 30 June 2016
RESERVES PROVED (1P) PROVED AND PROBABLE (2P)
DEVELOPED UNDEVELOPED DEVELOPED UNDEVELOPED
FIELD (LICENCE)CUE
INTEREST
OIL AND CONDEN-
SATE GAS
OIL AND CONDEN-
SATE GAS
OIL AND CONDEN-
SATE GAS
OIL AND CONDEN-
SATE GAS
MMBBL BCF MMBBL BCF MMBBL BCF MMBBL BSCF
INDONESIA
Oyong (1) (Sampang PSC) 15% 0.036 0.914 - - 0.057 1.845 - -
Wortel (1) (Sampang PSC) 15% 0.003 2.917 0.003 2.711 0.003 2.951 0.004 3.335
NEW ZEALAND
Maari (2) (PMP 38160) 5% 0.512 - - - 1.301 - - -
US
Pine Mills (3) (TX) 80% 0.373 - - - 0.477 - - -
Total Reserves 0.924 3.831 0.003 2.711 1.838 4.796 0.004 3.335
CONTINGENT RESOURCES BEST ESTIMATE (2C)
FIELD (LICENCE)CUE
INTERESTOIL AND
CONDENSATE GAS
MMBBL BCF
INDONESIA
Oyong (1)(4) (Sampang PSC) 15% - 1.90
Jeruk (Sampang PSC) 8% 1.24 -
NEW ZEALAND
Maari (2) (PMP 38160) 5% 1.32 -
Total Contingent Resources 2.56 1.90
NOTE:(1) CUE reserves are net of Indonesian government share of production. Estimates of in-place and recoverable sales gas volumes include both free gas and
solution gas.(2) Maari field’s reserves are based on an independent technical review conducted by RISC and calculated using RISC’s technical recoverable quantities,
cost and CUE’s oil price assumptions. Deterministic methods were used for reserves and a combination of deterministic and probabilistic methods used for contingent resources.
(3) Pine Mills reserves are CUE’s net entitlement.(4) Oyong Contingent Gas Resources were based on CUE’s analysis of Sampang Sustainability Project. Deterministic methods were used.(5) Oil equivalent conversion factor: 5.4 MSCF per BOE (Barrel of Oil Equivalent).
RESE
RVES
AND
RES
OURC
ES
13
For
per
sona
l use
onl
y

GOVERNANCE ARRANGEMENTS AND INTERNAL CONTROLS CUE estimates and reports its petroleum reserves and resources in accordance with the definitions and guidelines of the Petroleum Resources Management
System 2007 (SPE-PRMS), published by the Society of Petroleum Engineers (SPE).
All estimates of petroleum reserves reported by CUE are prepared by, or under the supervision of, a qualified petroleum reserves and resources evaluator.
To ensure the integrity and reliability of data used in the reserves estimation process, the reserves and production data is reviewed and quality controlled by senior professional reservoir and geological staff at CUE. During each petroleum reserves review, this data is updated, analysed and reconciled against the previous year’s data. CUE has engaged the services of RISC to independently assess the Maari reserves.
CUE reviews and updates its oil reserves position on an annual basis and reports the updated estimates as of 30 June each year. CUE reviews and updates its gas reserves position as frequently as required by the magnitude of the petroleum reserves and changes indicated by new data.
QUALIFIED PETROLEUM RESERVES AND RESOURCES EVALUATOR STATEMENT The reserves and contingent resources report as at 30 June 2016 was prepared in accordance with the SPE-PRMS. This reserve and resource information contained in this summary is based on and fairly represents information and supporting documentation prepared by, or under the supervision of Aung Moe (Senior Reservoir Engineer) who is a full time employee of the Company. Mr Moe is a is a member of SPE and his qualifications include a Master of Science (Petroleum Engineering) from Norwegian University of Science & Technology. Mr. Moe has more than 16 years of experience in the Oil & Gas industry and is a qualified petroleum reserves and resources evaluator (QPRRE) as defined by ASX oil and gas listing rules.
Pine Mills Reserves review was carried out in accordance with the SPE Reserves Auditing Standards and the SPE-PRMS guidelines by Mr. Christian Snyder who is contracted by CUE Resources Inc. Mr. Snyder holds a Bachelor’s Degree in Petroleum Engineering from Texas A&M University and has over 19 years of experience in the Oil & Gas industry and is a member of the Society of Petroleum Engineers. Mr. Snyder is a qualified person as defined in the ASX Listing Rule 5.41.
RISC CONSENTS Information on the Reserves and Contingent Resources in this release relating to the Maari fields is based on an independent review conducted by RISC Operations Pty Ltd (RISC) and fairly represents the information and supporting documentation reviewed. The review was carried out in accordance with the SPE Reserves Auditing Standards and the SPE-PRMS guidelines under the supervision of Mr. Geoffrey J Barker, a Partner of RISC, a leading independent petroleum advisory firm.
Mr. Barker is a member of SPE and his qualifications include a Master of Engineering Science (Petroleum Engineering) from Sydney University. Mr Barker has more than 30 years of global experience in the upstream hydrocarbon industry and is a qualified petroleum reserves and resources evaluator (QPRRE) as defined by ASX oil and gas listing rules. Mr Barker consents to the inclusion of this information in this report.
CUE
ENER
GY R
ESOU
RCES
LIM
ITED:
ANN
UAL R
EPOR
T 201
5/16
14
For
per
sona
l use
onl
y
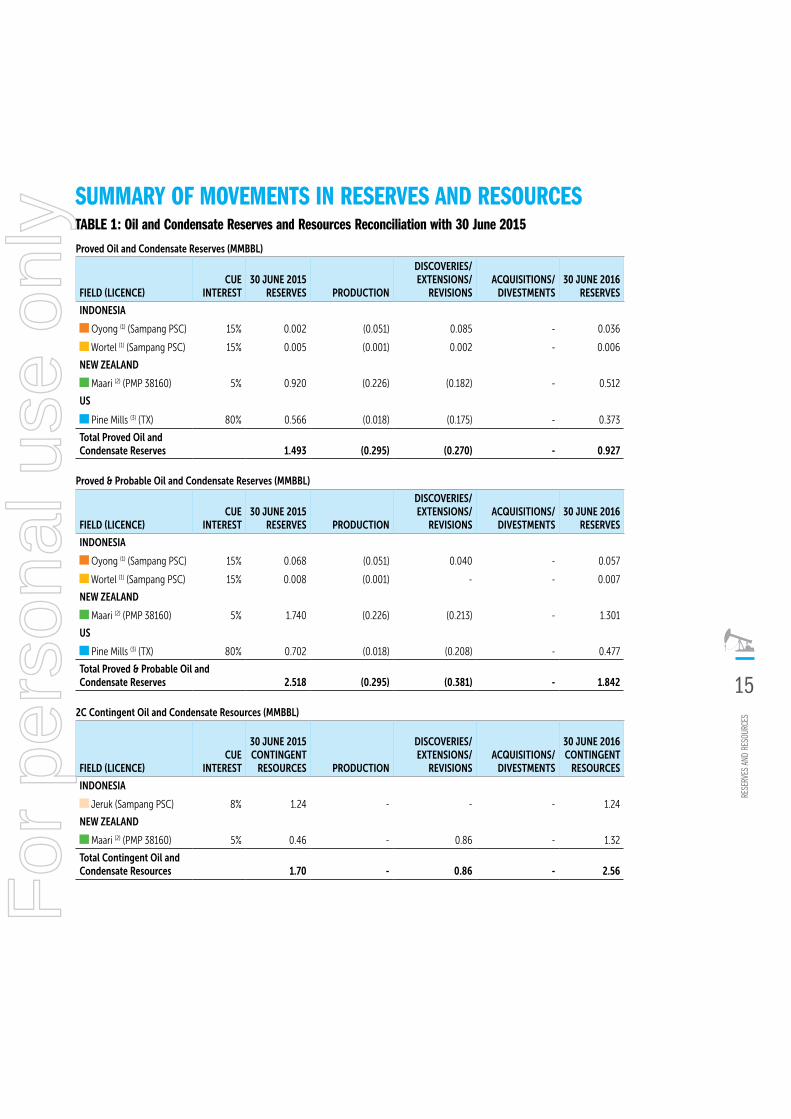
SUMMARY OF MOVEMENTS IN RESERVES AND RESOURCESTABLE 1: Oil and Condensate Reserves and Resources Reconciliation with 30 June 2015
Proved Oil and Condensate Reserves (MMBBL)
FIELD (LICENCE) CUE
INTEREST30 JUNE 2015
RESERVES PRODUCTION
DISCOVERIES/ EXTENSIONS/
REVISIONSACQUISITIONS/
DIVESTMENTS30 JUNE 2016
RESERVES
INDONESIA
Oyong (1) (Sampang PSC) 15% 0.002 (0.051) 0.085 - 0.036
Wortel (1) (Sampang PSC) 15% 0.005 (0.001) 0.002 - 0.006
NEW ZEALAND
Maari (2) (PMP 38160) 5% 0.920 (0.226) (0.182) - 0.512
US
Pine Mills (3) (TX) 80% 0.566 (0.018) (0.175) - 0.373
Total Proved Oil and Condensate Reserves 1.493 (0.295) (0.270) - 0.927
Proved & Probable Oil and Condensate Reserves (MMBBL)
FIELD (LICENCE) CUE
INTEREST30 JUNE 2015
RESERVES PRODUCTION
DISCOVERIES/ EXTENSIONS/
REVISIONSACQUISITIONS/
DIVESTMENTS30 JUNE 2016
RESERVES
INDONESIA
Oyong (1) (Sampang PSC) 15% 0.068 (0.051) 0.040 - 0.057
Wortel (1) (Sampang PSC) 15% 0.008 (0.001) - - 0.007
NEW ZEALAND
Maari (2) (PMP 38160) 5% 1.740 (0.226) (0.213) - 1.301
US
Pine Mills (3) (TX) 80% 0.702 (0.018) (0.208) - 0.477
Total Proved & Probable Oil and Condensate Reserves 2.518 (0.295) (0.381) - 1.842
2C Contingent Oil and Condensate Resources (MMBBL)
FIELD (LICENCE)CUE
INTEREST
30 JUNE 2015 CONTINGENT
RESOURCES PRODUCTION
DISCOVERIES/ EXTENSIONS/
REVISIONSACQUISITIONS/
DIVESTMENTS
30 JUNE 2016 CONTINGENT
RESOURCES
INDONESIA
Jeruk (Sampang PSC) 8% 1.24 - - - 1.24
NEW ZEALAND
Maari (2) (PMP 38160) 5% 0.46 - 0.86 - 1.32
Total Contingent Oil and Condensate Resources 1.70 - 0.86 - 2.56
RESE
RVES
AND
RES
OURC
ES
15
For
per
sona
l use
onl
y

TABLE 2: Gas Reserves and Resources Reconciliation with 30 June 2015
Proved Gas Reserves (BCF)
FIELD (LICENCE) CUE
INTEREST30 JUNE 2015
RESERVES PRODUCTION
DISCOVERIES/ EXTENSIONS/
REVISIONSACQUISITIONS/
DIVESTMENTS30 JUNE 2016
RESERVES
INDONESIA
Oyong (1) (Sampang PSC) 15% 0.699 (1.123) 1.338 - 0.914
Wortel (1) (Sampang PSC) 15% 5.188 (1.788) 2.228 - 5.628
Total Proved Gas Reserves 5.887 (2.911) 3.566 - 6.542
Proved & Probable Gas Reserves (BCF)
FIELD (LICENCE) CUE
INTEREST30 JUNE 2015
RESERVES PRODUCTION
DISCOVERIES/ EXTENSIONS/
REVISIONSACQUISITIONS/
DIVESTMENTS30 JUNE 2016
RESERVES
INDONESIA
Oyong (1) (Sampang PSC) 15% 2.784 (1.123) 0.183 - 1.845
Wortel (1) (Sampang PSC) 15% 8.441 (1.788) (0.367) - 6.286
Total Proved & Probable Gas Reserves 11.225 (2.911) (0.183) - 8.131
2C Contingent Gas Resources (BCF)
FIELD (LICENCE) CUE
INTEREST
30 JUNE 2015 CONTINGENT
RESOURCES PRODUCTION
DISCOVERIES/ EXTENSIONS/
REVISIONSACQUISITIONS/
DIVESTMENTS
30 JUNE 2016 CONTINGENT
RESOURCES
INDONESIA
Oyong (4) (Sampang PSC) 15% - - 1.90 - 1.90
Total Contingent Gas Resources - - 1.90 - 1.90
CUE
ENER
GY R
ESOU
RCES
LIM
ITED:
ANN
UAL R
EPOR
T 201
5/16
16
For
per
sona
l use
onl
y

LEGENDOyong (Indonesia)
Wortel (Indonesia)
Jeruk (Indonesia)
Maari (New Zealand)
Pine Mills (US)
0.93 1.84 2.56
0.040.01
0.511.30
0.37
0.060.01
0.48 1.321.24
Proved (1P) Oil and Condensate Reserves
(MMBBL)
Proved & Probable (2P) Oil & Condensate Reserves(MMBBL)
Contingent (2C)Oil & Condensate Resources(MMBBL)
6.54
0.91
5.63
1.84
6.29 1.90
8.13 1.90
Proved (1P) Gas Reserves (BCF)
Proved & Probable (2P) Gas Reserves (BCF)
Contingent (2C)Gas Resources (BCF)
2.14 3.35 6.26
0.21
1.050.51
0.370.40 0.75
1.171.171.30
0.48
2.62
0.48
1.24
Proved (1P)Oil Equivalent (MMboe)
Proved & Probable (2P)Oil Equivalent (MMboe)
2P + 2C Oil Equivalent (MMboe)
RESE
RVES
AND
RES
OURC
ES
17
For
per
sona
l use
onl
y

Directors’Report
MANAGEMENTChief Executive OfficerGrant A. Worner (Interim CEO appointed 23 March 2016)
David A.J. Biggs (resigned 15 April 2016)
Chief Financial Officer/ Company SecretaryAndrew M. Knox
Co-Company SecretaryPauline M. Moffatt
PRINCIPAL ACTIVITIESThe principal activities of the group are petroleum exploration, development and production.
Cue Energy Resources Limited (‘Cue’) is listed on the Australian Securities Exchange. The Company has an American Depositary Receipt (ADR) programme sponsored by the Bank of New York and these are traded via the OTC Market in the US.
Registered Office & Principal Place of BusinessLevel 19, 357 Collins Street Melbourne 3000 Australia
CORPORATE GOVERNANCE STATEMENTDetails of the Company’s corporate governance practices are included in the Corporate Governance Statement set out on the Company’s website. This URL on our website is located at: www.cuenrg.com.au/irm/content/corporate-governance.aspx?RID=296.
DIVIDENDSNo dividends were paid during the financial year or have been approved subsequent to the reporting date (2015: nil).
Your Directors present their report on the Company and its controlled entities (“the Group” or “consolidated entity”) consisting of Cue Energy Resources Limited (“the Company” or “Parent Entity”) and the entities it controlled at the end of, or during, the financial year ended 30 June 2016.
DIRECTORSThe names of Directors of the Company in office during the year and up to the date of this report were:
Grant A. Worner Executive Chairman (appointed 4 March 2016)
Koh Ban Heng (appointed 29 July 2015)
Duncan Saville (appointed 18 August 2016)
Brian L. Smith
Paul G. Foley (resigned 4 March 2016)
Stuart A. Brown (resigned 4 March 2016)
C. Peter Hazledine (resigned 4 March 2016)
Geoffrey J. King (removed 29 July 2015)
Andrew T.N. Knight (appointed 4 March 2016, resigned 18 August 2016)
Andrew A. Young (removed 29 July 2015)
CUE
ENER
GY R
ESOU
RCES
LIM
ITED:
ANN
UAL R
EPOR
T 201
5/16
18
For
per
sona
l use
onl
y

REVIEW OF OPERATIONSProduction revenue from continuing operations for the year ended 30 June 2016 was $45.41 million (2015: $36.70 million).
Production and amortisation expenses from continuing operations totalled $30.59 million for the year (2015: $23.79 million).
Loss before income tax expense for the year from continuing operations was $79.60 million (2015: profit $26.92 million). Tax expense for the year was $4.80 million (2015: benefit $5.27 million), resulting in loss after income tax expense of $84.40 million for the year (2015: profit $32.19 million).
Loss from discontinuing operations amounted to $3.06 million (2015: profit $8.75 million) resulting in loss after income tax benefit for the year of $87.46 million (2015: profit $40.95 million).
Further information on the operations and financial position of the group and its business strategies and prospects is set out in the Executive Chairman’s Overview in this annual report.
Significant changes in the state of affairsDuring the financial year the Company:
• Changed its accounting policy from full costs to successful efforts for exploration and evaluation expenditure. This resulted in impairments of exploration and evaluation expenditure of $49.96 million (2015: nil) and exploration and evaluation expenditure expensed of $16.33 million (2015: $2.10 million).
• Resolved to divest of the 80% interest in the Pine Mills production in East Texas USA.
Apart from the above, there was no further significant change in the state of affairs of the consolidated entity.
Equity and capital structureTotal equity as at 30 June 2016 $42.59 million (2015: $131.67 million). At the reporting date, Cue had issued share capital of $152.42 million (2015: $152.42 million). No further shares have been issued subsequent to the reporting date.
The total number of shares on issue at 30 June 2016 was 698,119,720 (2015: 698,119,720).
Environmental disclosureWithin the last year there have been zero incidents, zero lost time injuries and zero significant spills within Cue Energy Resources. Among the joint venture operations there have been a number of incidents that have been reported and investigated by all the relevant parties. The increased reporting is showing a growth in the reporting culture and an openness to share learnings in order to reduce risk not only within Cue Energy Resources but within the industry. Cue Energy Resources continues to monitor the progress and close out of these incidents and work with the joint venture operation partners and operators to improve overall health and safety and minimise any impact on the environment.
There have been a number of steps taken in order to improve Health, Safety and Environment (HSE) and to implement an HSE management system that is suitable for all countries and all levels of operations that the business may wish to be involved with. The overall aim of the system is to not only meet legislative requirements but to show a true commitment to HSE for the sake of Cue Energy Resources personnel, contractors, assets and the environment.
Throughout this year, internally the HSE management system is in effect and beginning to grow a proactive safety culture with the business in line with industry best practice. While Cue is still a relatively small business, it has in place a management system that is fit for purpose regardless of the size of the company. The system will now be able to grow with the business.
Through ongoing commitment by both senior management and staff alike, this system will move Cue Energy Resources forward and will continually improve overall Health, Safety and Environmental risk to the company. This will demonstrate that Cue Energy Resources is a leader in all its current and projected fields of expertise and will give Cue Energy Resources the ability to remain competitive, whilst managing its risks to as low as reasonably practicable.
DIRE
CTOR
S' R
EPOR
T
19
For
per
sona
l use
onl
y

Likely developments and expected results of operationsThe following activities may affect the expected results of operations:
• Farming down WA-409-P and WA-359-P permits, Carnarvon Basin
• Farming down the Mahakam Hilir PSC, Indonesia
• Actively seeking to acquire additional production
Apart from the above, no other matter or circumstance has arisen since 30 June 2016 that has significantly, or may significantly affect the consolidated entity’s operations, the results of those operations, or the consolidated entity’s state of affairs in future financial years.
Directors meetings, qualifications and experienceThe following table sets out the number of meetings of the Board of Directors held during the year and the number of meetings attended by each Director.
BOARDAUDIT AND RISK
COMMITTEEREMUNERATION AND
NOMINATION COMMITTEE
HELD ATTENDED HELD ATTENDED HELD ATTENDED
Grant A. Worner(i) 2 2 - - - -
Koh Ban Heng (ii) 8 8 2 2 - -
Duncan P. Saville(iii) - - - - - -
Brian L. Smith 10 10 2 2 - -
Paul G. Foley(v) 8 7 - - - -
Stuart A. Brown(iv) 8 8 - - 2 2
C. Peter Hazledine(vi) 8 8 - - 2 2
Geoffrey J. King(vii) 1 1 - - - -
Andrew T.N. Knight(viii) 2 2 - - - -
Andrew A. Young(ix) 1 1 - - - -
(i) Grant Worner, Executive Chairman (appointed 4 March 2016)(ii) Koh Ban Heng (appointed 29 July 2015)(iii) Duncan P. Saville (appointed 18 August 2016)(iv) Stuart A. Brown (resigned 4 March 2016)(v) Paul G. Foley, (resigned 4 March 2016) (vi) C. Peter Hazledine (resigned 4 March 2016)(vii) Geoffrey J. King (removed 29 July 2015)(viii) Andrew T.N. Knight (appointed 4 March 2016, resigned 18 August 2016)(ix) Andrew A. Young (removed 29 July 2015)
Held: represents the number of meetings held during the time the director held office or was a member of the relevant committee.
CUE
ENER
GY R
ESOU
RCES
LIM
ITED:
ANN
UAL R
EPOR
T 201
5/16
20
For
per
sona
l use
onl
y

Information on directors and executives, including qualifications and experience is as follows:
DIRECTORS QUALIFICATIONS AND EXPERIENCESPECIAL RESPONSIBILITIES
PARTICULARS OF DIRECTORS’ INTERESTS IN SHARES OF CUE ENERGY
RESOURCES LIMITED AT THE DATE OF THIS REPORT
DIRECT INDIRECT
G.A. Worner BE(Chemical Ist Hons), MBA, GAICD
Executive Chairman of Cue Energy Resources Limited(i)
-Appointed 4 March 2016
Non-Executive Director of New Guinea Energy Ltd(i)
-Appointed 15 July 2015
Executive Director of Pan Pacific Petroleum NL(ii)
-Appointed 24 August 2015
Executive Chairman Nil Nil
B.H. Koh BSc, GDipBA
Non-Executive Director of Cue Energy Resources Limited(i)
-Appointed 29 July 2015
Non-Executive Director of Tipco Asphalt Ltd PLC
-Appointed 1 July 2011
Non-Executive Director of Keppel Infrastructure Holdings (KIH) Pte Ltd
-Appointed 15 March 2013
Non-Executive Chairman of Keppel Infrastructure Fund Management Pte Ltd
-Appointed 1 May 2015
Non-Executive Director
Member of Audit and Risk Committee
Nil Nil
D.P. Saville BCom. (Hons), BSc (Hons), FCA, F Fin, FAICD
Non-Independent Director of Cue Energy Resources Limited(i)
-Appointed 18 August 2016
Non-Executive Director of Touchcorp Limited
-Appointed 17 February 2014
Non-Executive Director of Infratil Limited
-Resigned 24 August 2016
Non-independent Director of New Zealand Oil & Gas Limited
-Appointed 4 November 2014
Non-Independent Director
Nil 337,623,791
B.L. Smith Non-Executive Director of Cue Energy Resources Limited(i)
-Appointed 13 April 2015
Non-Executive Director
Chairman of Audit and Risk Committee
Nil Nil
DIRE
CTOR
S' R
EPOR
T
21
For
per
sona
l use
onl
y

DIRECTORS QUALIFICATIONS AND EXPERIENCESPECIAL RESPONSIBILITIES
PARTICULARS OF DIRECTORS’ INTERESTS IN SHARES OF CUE ENERGY
RESOURCES LIMITED AT THE DATE OF THIS REPORT
DIRECT INDIRECT
S.A. Brown BSc Hons (First Class)
Non-Executive Director of Cue Energy Resources Limited(i)
-Appointed 24 July 2014
-Resigned 4 March 2016(iii)
Non-Executive Director of Galicia Energy Limited(i)
-Appointed February 2014
-Resigned 19 February 2015(iii)
Non-Executive Director of Empire Oil & Gas NL(ii)
-Appointed January 2014
Non-Executive Chairman of WHL Energy Limited(i)
-Appointed 6 December 2013
-Resigned 17 November 2015(iii)
Non-Executive Director
Chairman of Remuneration and Nomination Committee
Nil Nil
P.G. Foley BCA, LL.B
Non-Executive Chairman of Cue Energy Resources Limited(i)
-Appointed 13 April 2015
-Resigned 4 March 2016(iii)
Non-Executive Director of New Zealand Oil & Gas Limited(i)
-Appointed July 2000
-Resigned November 2014(iii)
Chairman of Grosvenor Financial Services Limited(ii)
-Appointed April 2012
Deputy Chairman of Board of the National Provident Fund(ii)
-Appointed September 2012
-Resigned June 2015(iii)
Chairman of Racing Integrity Unit Limited(ii)
-Appointed February 2013
-Resigned January 2014(iii)
Chairman Nil Nil
C.P. Hazledine
BSc (Hons)
Non-Executive Director of Cue Energy Resources Limited(i)
-Appointed 13 April 2015
-Resigned 4 March 2016(iii)
Non-Executive Director
Member of Remuneration and Nomination Committee
Nil Nil
CUE
ENER
GY R
ESOU
RCES
LIM
ITED:
ANN
UAL R
EPOR
T 201
5/16
22
For
per
sona
l use
onl
y
DIRECTORS QUALIFICATIONS AND EXPERIENCESPECIAL RESPONSIBILITIES
PARTICULARS OF DIRECTORS’ INTERESTS IN SHARES OF CUE ENERGY
RESOURCES LIMITED AT THE DATE OF THIS REPORT
DIRECT INDIRECT
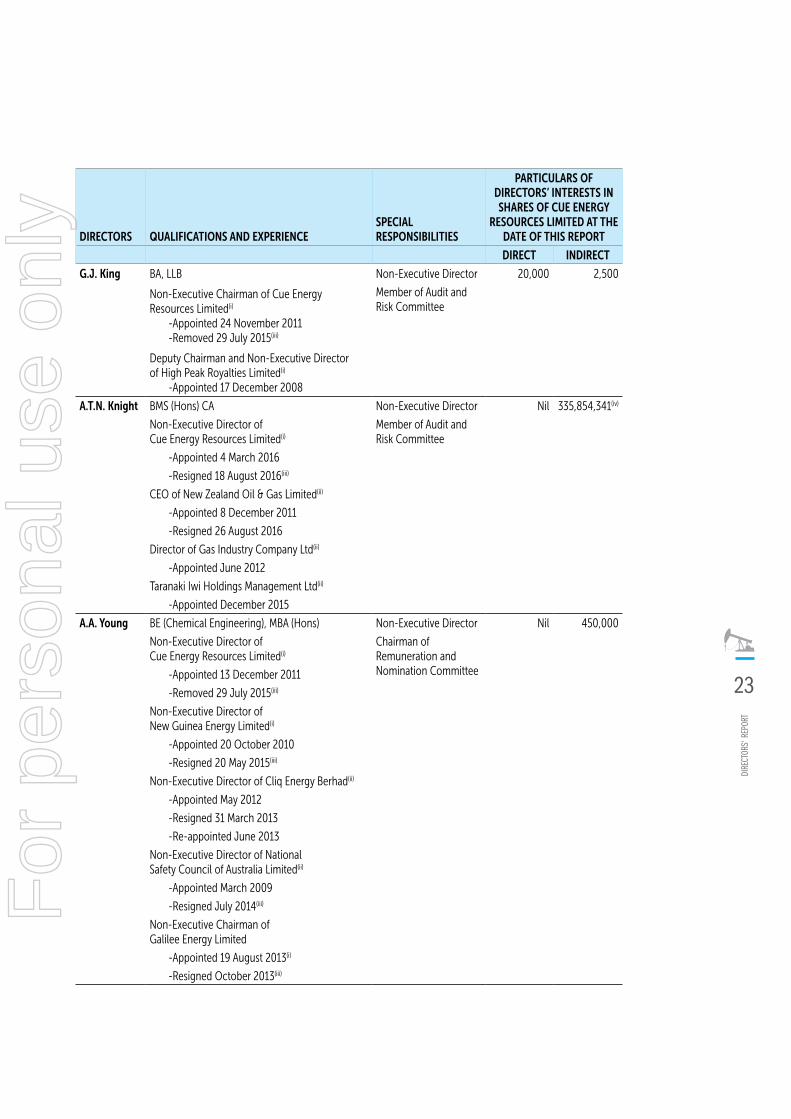
G.J. King BA, LLB
Non-Executive Chairman of Cue Energy Resources Limited(i) -Appointed 24 November 2011 -Removed 29 July 2015(iii)
Deputy Chairman and Non-Executive Director of High Peak Royalties Limited(i) -Appointed 17 December 2008
Non-Executive Director
Member of Audit and Risk Committee
20,000 2,500
A.T.N. Knight BMS (Hons) CA
Non-Executive Director of Cue Energy Resources Limited(i)
-Appointed 4 March 2016
-Resigned 18 August 2016(iii)
CEO of New Zealand Oil & Gas Limited(ii)
-Appointed 8 December 2011
-Resigned 26 August 2016
Director of Gas Industry Company Ltd(ii)
-Appointed June 2012
Taranaki Iwi Holdings Management Ltd(ii)
-Appointed December 2015
Non-Executive Director
Member of Audit and Risk Committee
Nil 335,854,341(iv)
A.A. Young BE (Chemical Engineering), MBA (Hons)
Non-Executive Director of Cue Energy Resources Limited(i)
-Appointed 13 December 2011
-Removed 29 July 2015(iii)
Non-Executive Director of New Guinea Energy Limited(i)
-Appointed 20 October 2010
-Resigned 20 May 2015(iii)
Non-Executive Director of Cliq Energy Berhad(ii)
-Appointed May 2012
-Resigned 31 March 2013
-Re-appointed June 2013
Non-Executive Director of National Safety Council of Australia Limited(ii)
-Appointed March 2009
-Resigned July 2014(iii)
Non-Executive Chairman of Galilee Energy Limited
-Appointed 19 August 2013(i)
-Resigned October 2013(iii)
Non-Executive Director
Chairman of Remuneration and Nomination Committee
Nil 450,000
DIRE
CTOR
S' R
EPOR
T
23
For
per
sona
l use
onl
y

EXECUTIVES QUALIFICATIONS AND EXPERIENCE SPECIAL RESPONSIBILITIES
DIRECT INDIRECT
A.M. Knox BCom, CA, CPA, FAICD Chief Financial Officer Company Secretary
2,321,007 2,137,244
(i) Refers to ASX listed directorships held over the past three years.(ii) Refers to unlisted public company directorships held over the past three years.(iii) As at date of ceasing to be a director or executive.(iv) As at date of resignation 18 August 2016
OTHER QUALIFICATIONS AND EXPERIENCE SPECIAL RESPONSIBILITIES
DIRECT INDIRECT
P.M. Moffatt BCom, FGIA, AAICD Co Company Secretary 114,645 Nil
No shares in subsidiary companies are held by the Directors and no remuneration or other benefits were paid or are due and payable by subsidiary companies. No share options are held in the company by Directors or Executives. There are no Performance rights held by executives.
CUE
ENER
GY R
ESOU
RCES
LIM
ITED:
ANN
UAL R
EPOR
T 201
5/16
24
For
per
sona
l use
onl
y
REMUNERATION REPORT (AUDITED)This Remuneration Report which has been audited, and which forms part of the Directors’ Report, sets out information about the remuneration of Cue Energy Resources Limited’s Directors and its senior management for the financial year ended 30 June 2016, in accordance with the Corporations Act 2001 and its regulations.
The prescribed details for each person covered by this report are detailed below under the following headings:
(A) Director and Executive Details
(B) Remuneration Policy
(C) Details of Remuneration
(D) Equity Based Remuneration
(E) Relationship between Remuneration Policy and Company Performance
(A) Director and executive details The following persons acted as Directors of the company during or since the end of the financial year:
G.A. Worner (Executive Chairman) – appointed 4 March 2016 and (Interim CEO appointed 23 March 2016)
D.P. Saville (Non-Executive Director) – appointed 18 August 2016
B.H. Koh (Non-Executive Director) – appointed 29 July 2015
B.L. Smith (Non-Executive Director)
P.G. Foley (Non-Executive Chairman) – resigned 4 March 2016
S.A. Brown (Non-Executive Director) – resigned 4 March 2016
C.P. Hazledine (Non-Executive Director) – resigned 4 March 2016
G.J. King (Non-Executive Director) – removed 29 July 2015
A.T.N. Knight (Non-Executive Director) – appointed 4 March 2016, resigned 18 August 2016
A.A. Young (Non-Executive Director) – removed 29 July 2015
The term “Key Management Personnel” is used in this Remuneration Report to refer to the following persons:
A.M. Knox (Chief Financial Officer/Company Secretary)
J.L. Schrull (Production & Exploration Manager)
D.A.J. Biggs (Chief Executive Officer) – resigned 15 April 2016
Unless otherwise stated the persons named above held their current position for the whole of the financial year and since the end of the financial year.
(B) Remuneration policyThe Board’s policy for remuneration of Executives and Directors is detailed below.
Remuneration packages are set at levels that are intended to attract and retain high calibre directors and employees and align the interest of the Directors and Executives with those of the company’s shareholders. The Remuneration policy is established and implemented solely by the Board.
Remuneration and other terms and conditions of employment are reviewed annually by the Board having regard to performance and relevant employment market information. As well as a base salary, remuneration packages include superannuation, termination entitlements and fringe benefits.
The Board is conscious of its responsibilities in relation to the performance of the Company. Directors and Executives are encouraged to hold shares in the Company to align their interests with those of shareholders.
No remuneration or other benefits are paid to Directors or Executives by any subsidiary companies.
(C) Details of remunerationThe structure of non-executive Director and Executive remuneration is separate and distinct.
Non-Executive DirectorsRemuneration of Non-Executive Directors is determined by the Board within the maximum amount approved by the shareholders from time to time. The amount currently approved is $700,000, which was approved at the Annual General Meeting held on 24 November 2011. The Company’s policy is to remunerate Non-Executive Directors at a fixed fee based on their time involvement, commitment and responsibilities. Remuneration for Non-Executive Directors is not linked to individual or company performance, however, to align Directors’ interests with shareholders’ interests, Non-Executive Directors are encouraged to hold shares in the Company. The Board retains the discretion to award options or performance rights to Non-Executive Directors based on the recommendation of the Board, which is always subject to shareholder approval.
DIRE
CTOR
S' R
EPOR
T
25
For
per
sona
l use
onl
y

ExecutivesExecutives receive a mixture of fixed and variable pay and a blend of short and long term incentives as appropriate. Remuneration packages contain the following key elements:
• Fixed compensation component inclusive of base salary, superannuation, non-monetary benefits and consultancy fees.
• Short term incentive programme.
• Long term employee benefits.
• Cash bonus scheme paid 1 February 2016.
The Board is currently reviewing policies going forward in relation to short and long term incentives.
The Board is responsible for determining and reviewing remuneration arrangements and in doing so assesses the appropriateness of the nature and amount of remuneration of executives on a periodic basis, by reference to relevant employment market conditions, with the overall objective of ensuring maximum stakeholder benefit from the retention of a high quality, high performing Director and executive team.
Fixed compensationFixed compensation consists of base salary (which is calculated on a total cost base and including any FBT charges related to employee benefits including motor vehicles), as well as employer contributions to superannuation funds.
The base salary is reflective of market rates for companies of similar size and industry which is reviewed annually to ensure market competitiveness. During 2016, the Board reviewed the salaries paid to peer company executives in determining the salary of Cue’s Key Management Personnel. This base salary is fixed remuneration and is not subject to performance of the company. Base salary is reviewed annually and adjusted on 1 July each year. There is no guaranteed base salary increase included in any executive’s contracts.
Cash BonusesIn the first quarter of 2016 the Board approved a cash bonus payment equivalent to 30% of base salary to staff that remained with Cue for the 12 months following the on market take-over bid for the Company in February 2015 that resulted in New Zealand Oil and Gas Limited owning 48.11% of Cue. A total cash bonus of $1,143,799 (inclusive of super) was paid to Cue staff at the time.
Employment contractsRemuneration and other terms of employment for key executives G.A. Worner and J.L. Schrull is formalised in service agreements. Details of the agreements are as follows:
G.A. Worner
Title: Executive Chairman
Agreement commenced: 23 March 2016
Details: The Company will pay the Executive (and in the case of superannuation, contribute) a total remuneration package having a total cost to the Company of $35,000 per month (comprising salary and superannuation contributions).
Terms of this agreement is a period for six months.
J.L. Schrull
Title: Production and Exploration Manager
Agreement commenced: 18 August 2014
Details: Base salary of $431,375 including superannuation to be reviewed annually by the Board. 3 months termination notice by either party. Non solicitation and non-compete clauses included.
Compensation levels are reviewed each year to take into account cost of living changes, any change in the scope of the role performed and any changes to meet the principles of the compensation policy.
Details of the nature and amount of each major element of remuneration of each Director of the Company and other Key Management Personnel of the consolidated entity are:
CUE
ENER
GY R
ESOU
RCES
LIM
ITED:
ANN
UAL R
EPOR
T 201
5/16
26
For
per
sona
l use
onl
y

Compensation of key management personnel – 2016:
2016 SHORT-TERM POST-EMPLOYMENT
NAME
CASH SALARY
AND FEES
$
CASH BONUSES
$
NON MONETARY BENEFITS (I)
$
CONSULT- ING FEES
$
LONG SERVICE
LEAVE $
SUPER-ANNUATION
$
TERMIN-ATION
PAYMENTS $
TOTAL $
G.A. Worner(ii) 31,875 - - 105,168 - 9,993 - 147,036
D.P. Saville(iii) - - - - - - - -
B.H. Koh(iV) 84,218 - - - - - - 84,218
B.L. Smith 91,827 - - - - - - 91,827
P.G. Foley(v) 85,575 - - - - - - 85,575
S.A. Brown(vi) 61,719 - - 61,875 - 5,863 - 129,457
C.P. Hazledine(vii) 67,582 - - - - - - 67,582
G.J. King(viii) 10,245 - - - - - - 10,245
*A.T.N. Knight(ix) 24,519 - - - - - - 24,519
A.A. Young(ix) 7,880 - - - - - - 7,880
Total 465,440 - - 167,043 - 15,856 - 648,339
Other Key Management Personnel
A.M. Knox 199,121 125,049 149,699 - 12,317 35,000 - 521,186
J.L. Schrull 412,067 143,792 - - 6,358 19,308 - 581,525
D.A.J. Biggs(xi) 398,134 158,783 - - - 35,000 76,173 668,090
Total 1,009,322 427,624 149,699 - 18,675 89,308 76,173 1,770,801
Total remuneration of Executives and Directors 1,474,762 **427,624 149,699 167,043 18,675 105,164 76,173 2,419,140
* A Knight director fees paid directly to NZOG.
** Cash bonus disclosures paid.(i) Non-performance based salary sacrifice benefits, including motor vehicle expenses(ii) G.A. Worner appointed 4 March 2016(iii) D.P. Saville appointed 18 August 2016(iv) B.H. Koh appointed 29 July 2015(v) P.G. Foley resigned 4 March 2016(vi) S.A. Brown resigned 4 March 2016(vii) C.P. Hazledine resigned 4 March 2016(viii) G.J. King removed 29 July 2015(ix) A.T.N. Knight appointed 4 March 2016, resigned 18 August 2016(x) A.A. Young removed 29 July 2015(xi) D.A.J. Biggs resigned 15 April 2016
DIRE
CTOR
S' R
EPOR
T
27
For
per
sona
l use
onl
y

Compensation of key management personnel – 2015:
2015 SHORT-TERM POST-EMPLOYMENT
NAME
CASH SALARY AND
FEES $
CASH BONUSES
$
NON MONETARY BENEFITS (I)
$
LONG SERVICE
LEAVE $
SUPER-ANNUATION
$
TERMINATION PAYMENTS
$TOTAL
$
P.G. Foley(ii) 21,703 - - - - - 21,703
S.A. Brown(iii) 87,785 - - - 5,965 - 93,750
C.P. Hazledine(iv) 21,703 - - - - - 21,703
B.L. Smith(v) 21,703 - - - - - 21,703
G.J. King(vi) 130,000 - - - - - 130,000
A.A. Young(vii) 100,000 - - - - - 100,000
R.A. Sylvester(viii) 48,750 - - - 28,723 - 77,473
Total 431,644 - - - 34,688 - 466,332
Other Key Management Personnel
D.A.J. Biggs 433,792 70,396 - 2,270 34,992 - 541,450
A.M. Knox 255,509 36,990 87,415 2,304 35,000 - 417,218
J.L. Schrull(ix) 353,802 63,750 - 2,038 16,360 - 435,950
D. B. Whittam(x) 59,759 - - - 35,000 105,000 199,759
Total 1,102,862 171,136 87,415 6,612 121,352 105,000 1,594,377
Total remuneration of Executives and Directors 1,534,506 171,136 87,415 6,612 156,040 105,000 2,060,709
(i) Non performance based salary sacrifice benefits, including motor vehicle expenses.
(ii) P.G. Foley appointed 13 April 2015.(iii) S.A. Brown appointed 24 July 2014.(iv) C.P. Hazledine appointed 13 April 2015.(v) B.L. Smith appointed 13 April 2015.(vi) G.J. King removed 29 July 2015.(vii) A.A. Young removed 29 July 2015.(viii) R.A. Sylvester resigned 10 April 2015.(ix) J.L. Schrull appointed 18 August 2014.(x) D.B. Whittam resigned 22 August 2014.
All remuneration paid to D.A.J. Biggs, J.L. Schrull and A.M. Knox is incurred by the parent entity.
A.M. Knox is a Director of all the subsidiaries in the Group and an Executive of the parent company.
FIXED REMUNERATION
NAME 2016 2015Non-Executive Directors:G.A. Worner 100% -D.P. Saville - -B.H. Koh 100% -B.L. Smith 100% 100%
P.G. Foley 100% 100%S. A. Brown 100% 100%C.P. Hazledine 100% 100%G.J. King 100% 100%A.T.N. Knight 100% -
A.A. Young 100% 100%Other Key Management Personnel:A.M. Knox 100% 100%J.L. Schrull 100% 100%D.A.J. Biggs 100% 100%
CUE
ENER
GY R
ESOU
RCES
LIM
ITED:
ANN
UAL R
EPOR
T 201
5/16
28
For
per
sona
l use
onl
y

(D) Equity based remunerationOverview of share options and performance rightsHistorically, the Company has granted performance rights to certain Key Management Personnel. These performance rights were granted under a Performance Rights Plan which was approved by shareholders at the Company’s Annual General meeting on 24 November 2011. The Performance Rights Plan has a mechanism for providing a share based performance incentive for Key Management Personnel and to achieve alignment between Key Management Personnel and Shareholder objectives.
Performance rights were granted under the plan for no consideration, neither carry dividend or voting rights.
The Plan was designed to align the interests of executives with shareholders by providing direct participation in the benefits of future Company performance over the medium to long term.
The Board is currently reviewing policies going forward in relation to short and long term incentives.
Long term performance targets of the Company will be established every year and the future award of performance rights may be made at the Board’s sole discretion.
No share options or performance rights were granted during the financial year to 30 June 2016 (2015: nil) (refer note 25).
All previously issued performance rights had lapsed as at 30 June 2014.
(E) Relationship between remuneration policy and company performanceCompany performance reviewThe tables below set out summary information about the company’s earnings and movements in shareholder wealth and key management remuneration for the five years to 30 June 2016.
PROFIT PERFORMANCE30 JUNE 2016
$000’S
RESTATED 30 JUNE 2015
$000’S30 JUNE 2014
$000’S30 JUNE 2013
$000’S30 JUNE 2012
$000’S
Production income from continuing operations 45,412 36,704 32,246 49,798 41,222
(Loss)/profit before income tax expense from continuing operations (79,598) 26,916 753 8,409 13,621
(Loss)/profit after income tax expense (84,398) 32,191 (2,166) 6,369 5,663
Total Key Management Personnel Remuneration 2,419 2,061 1,713 2,729 2,050
SHARE PERFORMANCE 30 JUNE 2016 30 JUNE 2015 30 JUNE 2014 30 JUNE 2013 30 JUNE 2012
Share price at start of year (cents) 7.60 12.0 11.0 18.0 26.5
Share price at end of year (cents) 8.10 7.60 12.0 11.0 18.0
Dividends (cents) - - - - -
Basic (loss)/earnings per share (cents) (12.44) 5.86(i) (0.31) 0.91 0.81
Diluted (loss)/earnings per share (cents) (12.44) 5.86 (i) (0.31) 0.91 0.81
(i) restated due to change in accounting policy
The company’s remuneration policy seeks to reward staff members for their contribution to adding shareholder value so there is a direct link between a portion of remuneration and financial performance.
DIRE
CTOR
S' R
EPOR
T
29
For
per
sona
l use
onl
y

Additional disclosures relating to key management personnel
ShareholdingThe number of shares in the company held during the financial year by each director and other members of key management personnel of the consolidated entity, including their personally related parties, is set out below:
ORDINARY SHARES
BALANCE AT THE START OF
YEAR (1) ADDITIONS(2)
DISPOSALS/OTHER
BALANCE AT THE END OF THE YEAR (3)
Non-Executive Directors
Grant A. Worner - - - -
Koh Ban Heng - - - -
Duncan P. Saville 335,854,341 1,769,450 - 337,623,791
Brian Smith - - - -
Paul D. Foley - - - -
Stuart A. Brown - - - -
C. Peter Hazledine - - - -
Geoffrey J. King 22,500 - - 22,500
Andrew T.N. Knight 335,854,341 - - 335,854,341
Andrew A. Young 450,000 - - 450,000
Other Key Management Personnel
David A.J. Biggs 8,045 - - 8,045
Andrew M. Knox 4,458,251 - - 4,458,251
Jeffrey L. Schrull 308,797 144,312 - 453,109 (1) or date of appointment(2) acquisition of shares, after the end of the financial year(3) or date of Directors Report
This concludes the Remuneration Report which has been audited.
CUE
ENER
GY R
ESOU
RCES
LIM
ITED:
ANN
UAL R
EPOR
T 201
5/16
30
For
per
sona
l use
onl
y

AUDITORIn accordance with the provisions of the Corporations Act 2001 the Company’s auditor, BDO East Coast Partnership, continues in office.
Non-audit ServicesThe Company may decide to employ the auditor on assignments additional to its statutory audit duties where the auditor’s expertise and experience with the Company are important.
The Board of Directors has considered the position and is satisfied that the provision of the non-audit services is compatible with the general standard of independence for auditors imposed by the Corporations Act 2001. The Directors are satisfied that the provision of non-audit services by the auditor as set out below, did not compromise the audit independence requirement, of the Corporations Act 2001, based on advice received from the Audit and Risk Committee, for the following reasons:
• All non-audit services have been reviewed by the Board to ensure they do not impact the impartiality and objectivity of the auditor.
• None of the services undermine the general principle relating to auditor independence as set out in the Code of Ethics for Professional Accountants, including reviewing or auditing the auditor’s own work, acting in a management or a decision making capacity for the Company, acting as advocate for the Company or jointly sharing economic risk and reward.
Audit ServicesAmounts paid or due and payable to the auditor – BDO East Coast Partnership for:
2016 $
2015 $
Audit or review of the financial statements 121,700 115,500
Other Services:
Advisory Services 2,000 1,000
Tax compliance 20,000 36,900
Tax consulting 85,693 -
Total 229,393 153,400
INDEPENDENCE DECLARATIONA copy of the auditor’s independence declaration as required under section 307C of the Corporations Act 2001, is set out on page 33.
ROUNDING OFF OF AMOUNTS1. The Company is a company of the kind referred
to in ASIC Legislative Instrument 2016/191, and in accordance with the Class Order amounts in the Directors’ Report and the Financial Report are rounded off to the nearest thousand dollars, unless otherwise indicated.
DIRECTORS’ INSURANCE AND INDEMNIFICATION OF DIRECTORS AND AUDITORSDuring the financial year, the company paid a premium in respect of a contract insuring the directors of the company, the company secretary, and all executive officers against a liability incurred as a director, company secretary or executive officer to the extent permitted by the Corporations Act 2001. In accordance with commercial practice, the insurance policy prohibits disclosure of the terms of the policy, including the nature of the liability insured against and the amount of the premium.
The company has not otherwise, during or since the end of the financial year indemnified or agreed to indemnify an officer or auditor of the company or any related body corporate against a liability incurred as an officer or auditor.
MATTERS SUBSEQUENT TO THE END OF THE FINANCIAL YEAR Subsequent to the end of the financial year:
(i) Mr Andrew Knight resigned as a director, and Mr Duncan Saville was appointed as a director, effective 18 August 2016.
(ii) Cue together with all joint venture partners has elected to withdraw from PEP54865 and PEP51313, offshore New Zealand. These were fully impared as at 30 June 2016.
Apart from these matters the Directors are not aware of any matter or circumstance since the end of the financial year, not otherwise dealt with in this report that has significantly or may significantly affect the operations of Cue Energy Resources Limited, the results of those operations or the state of affairs of the Company or Group.
DIRE
CTOR
S' R
EPOR
T
31
For
per
sona
l use
onl
y

PROCEEDINGS ON BEHALF OF THE COMPANYNo person has applied to the Court under section 237 of the Corporations Act 2001 for leave to bring proceedings on behalf of the company, or to intervene in any proceedings to which the company is a party for the purpose of taking responsibility on behalf of the company for all or part of those proceedings.
This report is made in accordance with a resolution of directors, pursuant to section 298(a) of the Corporations Act 2001.
On behalf of the Board
Grant A. Worner
Executive Chairman
30 September 2016
CUE
ENER
GY R
ESOU
RCES
LIM
ITED:
ANN
UAL R
EPOR
T 201
5/16
32
For
per
sona
l use
onl
y

Auditor’s Independence Declaration
AuDI
TOR'
S In
DEPE
nDEn
CE D
EClA
RATIO
n
33
For
per
sona
l use
onl
y

The directors of Cue Energy Resources Limited declare that:
(a) in the Directors’ opinion the financial statements and notes and the Remuneration report in the Directors’ Report set out on pages 25 to 30, are in accordance with the Corporations Act 2001, including:
(i) giving a true and fair view of the consolidated entity’s financial position as at 30 June 2016 and of its performance, for the financial year ended on that date; and
(ii) complying with Australian Accounting Standards (including the Australian Accounting Interpretations) and Corporations Regulations 2001.
(b) the financial report also complies with International Financial Reporting Standards as disclosed in note 1; and
(c) there are reasonable grounds to believe that the company will be able to pay its debts as and when they become due and payable.
The Directors have been given the declarations required by Section 295A of the Corporations Act 2001 by the Chief Executive Officer and Chief Financial Officer for the financial year ended 30 June 2016.
Signed in accordance with a resolution of the Directors.
Dated in Melbourne 30th day of September 2016.
Grant A. Worner
Executive Chairman
Directors’Declaration
CUE
ENER
GY R
ESOU
RCES
LIM
ITED:
ANN
UAL R
EPOR
T 201
5/16
34
For
per
sona
l use
onl
y
35
FOR THE YEAR ENDED 30 JUNE 2015
Financial Statements 2015/16FOR THE FINANCIAL YEAR ENDED 30 JUNE 2016
FInAn
CIAl
STA
TEm
EnTS
35
For
per
sona
l use
onl
y

CONSOLIDATED STATEMENT OF PROFIT OR LOSS AND OTHER COMPREHENSIVE INCOME FOR THE FINANCIAL YEAR ENDED 30 JUNE 2016
NOTE2016
$000’S
RESTATED 2015
$000’S
Production revenue from continuing operations 3 45,412 36,704
Production costs 4 (30,585) (23,787)
Gross profit from production 14,827 12,917
Other Income 3 3,780 36,129
Net foreign currency exchange (loss)/gain 3 (90) 6,916
Impairment - production 15 (25,103) (18,015)
Impairment - E&E 13 (49,963) -
E&E expenditure 12 (16,329) (2,099)
Administration expenses 4 (6,720) (8,932)
(Loss)/profit before income tax benefit/(expense) from continuing operations (79,598) 26,916
Income tax benefit/(expense) 6 (4,800) 5,275
(Loss)/profit after income tax benefit/(expense) from continuing operations (84,398) 32,191
(Loss)/profit after income tax benefit/(expense) from discontinuing operations 23 (3,062) 8,754
(Loss)/profit after income tax benefit/(expense) for the year (87,460) 40,945
Other comprehensive income
Items that may be reclassified subsequent to profit or loss
Foreign currency translation (1,624) 1,666
Total comprehensive income for the year (89,084) 42,611
(Loss)/profit for the year is attributable to:
Owners of Cue Energy Resources Limited (86,834) 40,943
Non-controlling interest (626) 2
(87,460) 40,945
Total comprehensive income for the year is attributable to:
Owners of Cue Energy Resources Limited
Continuing operations (85,396) 33,855
Discontinuing operations (3,062) 8,754
(88,458) 42,609
Non-controlling interest
Continuing operations - 2
Discontinuing operations (626) -
Non-controlling interest (626) 2
(89,084) 42,611
The accompanying notes form part of and are to be read in conjunction with these Financial Statements.
CUE
ENER
GY R
ESOU
RCES
LIM
ITED:
ANN
UAL R
EPOR
T 201
5/16
36
For
per
sona
l use
onl
y

NOTE2016
CENTS
RESTATED 2015
CENTS
Earnings per share for profit/(loss) from continuing operations attributable to the owners of Cue Energy Resources Limited
Basic earnings per share 22 (12.09) 4.61
Diluted earnings per share 22 (12.09) 4.61
Earnings per share for profit/(loss) from discontinuing operations attributable to the owners of Cue Energy Resources Limited
Basic earnings per share 22 (0.35) 1.25
Diluted earnings per share 22 (0.35) 1.25
Earnings per share for profit/(loss) attributable to the owners of Cue Energy Resources Limited
Basic earnings per share 22 (12.44) 5.86
Diluted earnings per share 22 (12.44) 5.86
The accompanying notes form part of and are to be read in conjunction with these Financial Statements.
CONSOLIDATED STATEMENT OF PROFIT OR LOSS AND OTHER COMPREHENSIVE INCOME (Cont’) FOR THE FINANCIAL YEAR ENDED 30 JUNE 2016
NOTE2016
$000’S
RESTATED 2015
$000’S
Production revenue from continuing operations 3 45,412 36,704
Production costs 4 (30,585) (23,787)
Gross profit from production 14,827 12,917
Other Income 3 3,780 36,129
Net foreign currency exchange (loss)/gain 3 (90) 6,916
Impairment - production 15 (25,103) (18,015)
Impairment - E&E 13 (49,963) -
E&E expenditure 12 (16,329) (2,099)
Administration expenses 4 (6,720) (8,932)
(Loss)/profit before income tax benefit/(expense) from continuing operations (79,598) 26,916
Income tax benefit/(expense) 6 (4,800) 5,275
(Loss)/profit after income tax benefit/(expense) from continuing operations (84,398) 32,191
(Loss)/profit after income tax benefit/(expense) from discontinuing operations 23 (3,062) 8,754
(Loss)/profit after income tax benefit/(expense) for the year (87,460) 40,945
Other comprehensive income
Items that may be reclassified subsequent to profit or loss
Foreign currency translation (1,624) 1,666
Total comprehensive income for the year (89,084) 42,611
(Loss)/profit for the year is attributable to:
Owners of Cue Energy Resources Limited (86,834) 40,943
Non-controlling interest (626) 2
(87,460) 40,945
Total comprehensive income for the year is attributable to:
Owners of Cue Energy Resources Limited
Continuing operations (85,396) 33,855
Discontinuing operations (3,062) 8,754
(88,458) 42,609
Non-controlling interest
Continuing operations - 2
Discontinuing operations (626) -
Non-controlling interest (626) 2
(89,084) 42,611
The accompanying notes form part of and are to be read in conjunction with these Financial Statements.
FInAn
CIAl
STA
TEm
EnTS
37
For
per
sona
l use
onl
y

NOTES2016
$000’S
RESTATED 2015
$000’S
RESTATED 1 JULY 2014
$000’S
Current Assets
Cash and cash equivalents 27(b) 20,490 27,605 40,558
Trade and other receivables 8 4,481 4,761 3,542
Inventories 10 1,609 3,728 843
Non-Current assets classified held for sale 16 4,095 - -
Total Current Assets 30,675 36,094 44,943
Non-Current Assets
Property, plant and equipment 9 59 76 118
Deferred tax assets 6 - 70 71
Exploration and evaluation expenditure 12 - 51,629 8,674
Production properties 14 42,564 78,131 79,458
Total Non-Current Assets 42,623 129,906 88,321
Total Assets 73,298 166,000 133,264
Current Liabilities
Liabilities directly associated with assets classified as held for sale 16 2,017 - -
Trade and other payables 17 9,050 15,936 21,184
Tax liabilities 6 1,865 580 2,398
Provisions 18 640 584 563
Total Current Liabilities 13,572 17,100 24,145
Non-Current Liabilities
Deferred tax liabilities 6 4,167 5,818 14,430
Provisions 18 12,970 11,409 5,627
Total Non-Current Liabilities 17,137 17,227 20,057
Total Liabilities 30,709 34,327 44,202
Net Assets 42,589 131,673 89,062
Equity
Contributed equity 7(a) 152,416 152,416 152,416
Reserves 42 1,666 -
Accumulated losses (109,245) (22,411) (63,354)
Equity attributable to the owners of Cue Energy Resources Limited 43,213 131,671 89,062
Non-controlling interest (624) 2 -
Total Equity 42,589 131,673 89,062
The accompanying notes form part of and are to be read in conjunction with these Financial Statements
CONSOLIDATED STATEMENT OF FINANCIAL POSITION AS AT 30 JUNE 2016
CUE
ENER
GY R
ESOU
RCES
LIM
ITED:
ANN
UAL R
EPOR
T 201
5/16
38
For
per
sona
l use
onl
y

CONTRIBUTE EQUITY $000’S
ACCUMULATED LOSSES $000’S
FOREIGN CURRENCY
TRANSLATION RESERVE
$000’S
NON-CONTROLLING
INTEREST $000’S
TOTAL $000’S
Balance at 1 July 2015 restated 152,416 (22,411) 1,666 2 131,673
Loss after income tax benefit for the year - (86,834) - (626) (87,460)
Other comprehensive income for the year, net of tax - - (1,624) - (1,624)
Total comprehensive profit for the year - (86,834) (1,624) (626) (89,084)
Balance at 30 June 2016 152,416 (109,245) 42 (624) 42,589
CONTRIBUTE EQUITY $000’S
ACCUMULATED LOSSES $000’S
FOREIGN CURRENCY
TRANSLATION RESERVE
$000’S
NON-CONTROLLING
INTEREST $000’S
TOTAL $000’S
Balance at 1 July 2014 152,416 (23,013) - - 129,403
Balance of restatements – refer note 1(d) - (40,341) - - (40,341)
Balance at 1 July 2014 restated 152,416 (63,354) - - 89,062
Profit after income tax benefit for the year - 40,943 - 2 40,945
Other comprehensive income for the year, net of tax - - 1,666 - 1,666
Total comprehensive profit for the year - 40,943 1,666 2 42,611
Balance at 30 June 2015 restated 152,416 (22,411) 1,666 2 131,673
The accompanying notes form part of and are to be read in conjunction with these Financial Statements.
CONSOLIDATED STATEMENT OF CHANGES IN EQUITY FOR THE FINANCIAL YEAR ENDED 30 JUNE 2016
FInAn
CIAl
STA
TEm
EnTS
39
For
per
sona
l use
onl
y

NOTES2016
$000’S
RESTATED 2015
$000’S
Cash Flows from Operating Activities
Receipts from customers 45,166 35,992
Insurance refunds received 3,720 -
Interest received 58 115
Payments to suppliers (inclusive of GST) (23,946) (28,680)
Exploration and evaluation expenditure (17,891) (13,602)
Income tax paid (5,160) (5,159)
Royalties paid (836) (998)
Net cash provided by (used in) operating activities 27(a) 1,111 (12,332)
Cash Flows from Investing Activities
Payments with respect to production properties (7,122) (17,927)
Payments for plant and equipment (156) (7)
Proceeds from sale of prospects, less costs of sale - 8,289
Net cash used in investing activities (7,278) (9,645)
Net Decrease in Cash Held (6,167) (21,977)
Cash and cash equivalents at the beginning of the year 27,605 40,558
Effect of exchange rate change on foreign currency balances held at the beginning of the year (948) 9,024
Cash and cash equivalents at the end of the year 27(b) 20,490 27,605
The accompanying notes form part of and are to be read in conjunction with these Financial Statements.
CONSOLIDATED STATEMENT OF CASH FLOWS FOR THE FINANCIAL YEAR ENDED 30 JUNE 2016
CUE
ENER
GY R
ESOU
RCES
LIM
ITED:
ANN
UAL R
EPOR
T 201
5/16
40
For
per
sona
l use
onl
y

NOTES TO THE FINANCIAL STATEMENTS FOR THE FINANCIAL YEAR ENDED 30 JUNE 2016
1. SUMMARY OF SIGNIFICANT ACCOUNTING POLICIESThe previous accounting policy was to capitalise and carry forward exploration and evaluation expenditure as an asset when rights to tenure of the area of interest were current and costs were expected to be recouped or activities in the area of interest had not, at the reporting date, reached a stage that permitted a reasonable assessment of the existence or otherwise of economically recoverable reserves and active and significant operations in, or in relation to, the area of interest were continuing.
The Group has made a voluntary change to its accounting policy relating to exploration and evaluation expenditure. The new accounting policy was adopted for the year 30 June 2016 with effect from 1 July 2015 and has been applied retrospectively.
The new exploration and evaluation accounting policy is to charge exploration and evaluation expenditure against profit and loss as incurred, except for expenditure incurred after a decision to proceed to development is made, in which case the expenditure is capitalised as an asset. This does not include acquisition costs or costs capitalised as a result of a business combination totalling $49.96 million. The impact on the consolidated statement of cash flows is a movement from investing activities to a movement in operating activities. This amendment to the accounting policy has had a significant effect on the consolidated financial performance and consolidated financial position of the Group because it previously capitalised exploration expenditure in the period it was incurred. The Group has transferred at the beginning of the comparative period $45.40 million of exploration expenditure costs carried forward to accumulated losses as a result of the change in accounting policy.
The Group is of the view that the change in policy will result in the financial report providing more relevant and no less reliable information because capitalisation of costs will only begin once a decision to proceed with development has been made.
The following tables summarises the impact of the voluntary change in the accounting policy on exploration and evaluation costs, set out in the Group’s consolidated financial statements.
Cue Energy Resources Limited is a for-profit Public Company listed on the Australian Securities Exchange, incorporated and domiciled in Australia. The financial statements are presented in Australian Dollars, which is the Company’s functional currency. The financial report was authorised for issue by the Directors on the date the Directors’ Declaration was signed.
(a) Operations and principal activities
Operations comprise petroleum exploration, development and production activities.
(b) Statement of compliance
The financial report is a general purpose financial report presented in Australian dollars which has been prepared in accordance with Australian Accounting Standards and Interpretations issued by the Australian Accounting Standards Board (“AASB”) and the Corporations Act 2001, as appropriate for for-profit oriented entities. International Financial Reporting Standards (“IFRSs”) form the basis of Australian Accounting Standards adopted by the AASB. The financial reports of the consolidated entity also comply with IFRS and interpretations adopted by the International Accounting Standards Board.
The accounting policies set out below have been applied consistently to all periods presented in this report.
(c) Basis of preparation
The financial report has been prepared on a going concern basis using the historical cost convention.
In accordance with the Corporations Act 2001, these financial statements present the results of the consolidated entity only. Supplementary information about the parent entity is disclosed in note 28.
(d) Changes in accounting policy
AASB 6 Exploration for and Evaluation of Mineral Resources allows to either capitalise or expense the exploration and evaluation expenditure incurred by the Group.
FInAn
CIAl
STA
TEm
EnTS
41
For
per
sona
l use
onl
y

NOTES TO THE FINANCIAL STATEMENTS (Cont’) FOR THE FINANCIAL YEAR ENDED 30 JUNE 2016
1. SUMMARY OF SIGNIFICANT ACCOUNTING POLICIES (Cont’)CONSOLIDATED STATEMENT OF PROFIT OR LOSS AND OTHER COMPREHENSIVE INCOME
30 JUNE 2015 AS
PREVIOUSLY REPORTED
$000’S
EFFECT OF RESTATEMENT IN
DISCONTINUED OPERATIONS
$000’S
EFFECT OF CHANGE IN
ACCOUNTING POLICY $000’S
30 JUNE 2015 AS RESTATED
$000’S
Production revenue from continuing operations 36,925 (221) - 36,704
Production costs (24,253) 466 - (23,787)
Gross profit from production 12,672 245 - 12,917
Other revenue 41,986 (8,704) 2,847 36,129
Net foreign currency exchange (loss)/gain 6,911 5 - 6,916
Impairment - production (18,015) - - (18,015)
E&E expenditure - - (2,099) (2,099)
Administration expenses (8,932) - - (8,932)
(Loss)/profit before income tax benefit/(expense) from continuing operations 34,622 (8,454) 748 26,916
Income tax benefit/(expense) 5,200 (70) 145 5,275
(Loss)/profit after income tax benefit from continuing operations 39,822 (8,524) 893 32,191
Profit after income tax benefit from discontinuing operations 230 8,524 - 8,754
Profit after income tax benefit for the year 40,052 - 893 40,945
Other comprehensive income
Items that may be reclassified subsequent to profit or loss
Foreign currency translation 2,448 - (782) 1,666
Total comprehensive income for the year 42,500 - 111 42,611
Profit for the year is attributable to:
Owners of Cue Energy Resources Limited 40,050 - 893 40,943
Non-controlling interest 2 - - 2
40,052 - 893 40,945
Total comprehensive income for the year is attributable to:
Continuing operations 42,268 (8,524) 111 33,855
Discontinuing operations 230 8,524 - 8,754
42,498 - 111 42,609
Owners of Cue Energy Resources Limited
Continuing operations 2 - - 2
Discontinuing operations - - - -
Non-controlling interest 2 - - 2
42,500 - 111 42,611
The accompanying notes form part of and are to be read in conjunction with these Financial Statements
CUE
ENER
GY R
ESOU
RCES
LIM
ITED:
ANN
UAL R
EPOR
T 201
5/16
42
For
per
sona
l use
onl
y

NOTES TO THE FINANCIAL STATEMENTS (Cont’) FOR THE FINANCIAL YEAR ENDED 30 JUNE 2016
30 JUNE 2015 AS PREVIOUSLY
REPORT $000’S
EFFECT OF RESTATEMENT
$000’S
30 JUNE 2015 AS RESTATED
$000’S
*Earnings per share for profit/(cents per share)
Basic earnings per share 5.74 0.12 5.86
Diluted earnings per share 5.74 0.12 5.86
*Earnings per share for profit/(loss) (cents per share) – continuing operations
Basic earnings per share 5.71 (1.10) 4.61
Diluted earnings per share 5.71 (1.10) 4.61
*Earnings per share for profit/(loss) (cents per share) – discontinued operations
Basic earnings per share 0.03 0.41 1.25
Diluted earnings per share 0.03 0.41 1.25
* refer to Note 22 for detailed calculation of EPS
FInAn
CIAl
STA
TEm
EnTS
43
For
per
sona
l use
onl
y

NOTES TO THE FINANCIAL STATEMENTS (Cont’) FOR THE FINANCIAL YEAR ENDED 30 JUNE 2016
1. SUMMARY OF SIGNIFICANT ACCOUNTING POLICIES (Cont’)CONSOLIDATED STATEMENT OF FINANCIAL POSITION
30 JUNE 2015 $000’S
EFFECTS OF RESTATEMENT
$000’S
30 JUNE 2015 RESTATED
$000’S
Current Assets
Cash and cash equivalents 27,605 - 27,605
Trade and other receivables 4,761 - 4,761
Inventories 3,728 - 3,728
Total Current Assets 36,094 - 36,094
Non-Current Assets
Property, plant and equipment 76 - 76
Deferred tax assets 70 - 70
Exploration and evaluation expenditure 97,058 (45,429) 51,629
Production properties 78,131 - 78,131
Total Non-Current Assets 175,335 (45,429) 129,906
Total Assets 211,429 (45,429) 166,000
Current Liabilities
Trade and other payables 15,936 - 15,936
Tax liabilities 580 - 580
Provisions 584 - 584
Total Current Liabilities 17,100 - 17,100
Non-Current Liabilities
Deferred tax liabilities 11,017 (5,199) 5,818
Provisions 11,409 - 11,409
Total Non-Current Liabilities 22,426 (5,199) 17,227
Total Liabilities 39,526 (5,199) 34,327
Net Assets 171,903 (40,230) 131,673
Equity
Contributed equity 152,416 - 152,416
Reserves 2,448 (782) 1,666
Accumulated gain/(losses) 17,037 (39,448) (22,411)
Equity attributable to the owners of Cue Energy Resources Limited 171,901 (40,230) 131,671
Non-controlling interest 2 - 2
Total Equity 171,903 (40,230) 131,673
CUE
ENER
GY R
ESOU
RCES
LIM
ITED:
ANN
UAL R
EPOR
T 201
5/16
44
For
per
sona
l use
onl
y

NOTES TO THE FINANCIAL STATEMENTS (Cont’) FOR THE FINANCIAL YEAR ENDED 30 JUNE 2016
1 JULY 2014 $000’S
EFFECTS OF RESTATEMENT
$000’S
1 JULY 2014 RESTATED
$000’S
Current Assets
Cash and cash equivalents 40,558 - 40,558
Trade and other receivables 3,542 - 3,542
Inventories 843 - 843
Total Current Assets 44,943 - 44,943
Non-Current Assets
Property, plant and equipment 118 - 118
Deferred tax assets 71 - 71
Exploration and evaluation expenditure 54,069 (45,395) 8,674
Production properties 79,458 - 79,458
Total Non-Current Assets 133,716 (45,395) 88,321
Total Assets 178,659 (45,395) 133,264
Current Liabilities
Trade and other payables 21,184 - 21,184
Tax liabilities 2,398 - 2,398
Provisions 563 - 563
Total Current Liabilities 24,145 - 24,145
Non-Current Liabilities
Deferred tax liabilities 19,484 (5,054) 14,430
Provisions 5,627 - 5,627
Total Non-Current Liabilities 25,111 (5,054) 20,057
Total Liabilities 49,256 (5,054) 44,202
Net Assets 129,403 (40,341) 89,062
Equity
Contributed equity 152,416 - 152,416
Reserves - - -
Accumulated losses (23,013) (40,341) (63,354)
Equity attributable to the owners of Cue Energy Resources Limited 129,403 (40,341) 89,062
Non-controlling interest - - -
Total Equity 129,403 (40,341) 89,062
FInAn
CIAl
STA
TEm
EnTS
45
For
per
sona
l use
onl
y

NOTES TO THE FINANCIAL STATEMENTS (Cont’) FOR THE FINANCIAL YEAR ENDED 30 JUNE 2016
1. SUMMARY OF SIGNIFICANT ACCOUNTING POLICIES (Cont’)CONSOLIDATED STATEMENT OF CASH FLOWS
30 JUNE 2015 AS
PREVIOUSLY REPORTED
EFFECT OF RESTATEMENT
30 JUNE 2015 AS RESTATED
$’000 $’000 $’000
Cash flows from operating activities
Exploration and evaluation expenditure - (13,602) (13,602)
Net cash (used in) operating activities - (13,602) (13,602)
Cash flows from investing activities
Exploration and evaluation expenditure (13,602) 13,602 -
Net cash (used in) investing activities (13,602) 13,602 -
(e) Critical accounting estimates and judgements
The preparation of a financial report in conformity with Australian Accounting Standards requires management to make judgements, estimates and assumptions that affect the application of policies and reported amounts of assets and liabilities, income and expenses. The estimates and associated assumptions are based on historical experience and various other factors that are believed to be reasonable under the circumstances, the results of which form the basis of making the judgements about carrying values of assets and liabilities that are not readily apparent from other sources. Actual results may differ from these estimates. These accounting policies have been consistently applied by each entity in the consolidated entity, and the estimates and underlying assumptions are reviewed on an ongoing basis.
The judgements, estimates and assumptions that have a significant risk of causing a material adjustment to the carrying values of assets and liabilities within the next financial year are discussed below.
(i) Recovery of Deferred Tax Assets
Deferred tax assets resulting from unused tax losses have been recognised on the basis that management considers it is probable that future tax profits will be available to utilise the unused tax losses.
(ii) Impairment of Production Properties Assets
Production properties impairment testing requires an estimation of the value-in-use of the cash generating units to which deferred costs have been allocated. The value-in-use calculation requires the entity to estimate the future cash flows expected to arise from the cash generating unit and a suitable discount rate in order to calculate present value. Other assumptions used in the calculations which could have an impact on future years includes USD rates, available reserves and oil and gas prices.
(iii) Useful Life of Production Property Assets
As detailed at note 1 (l) production properties are amortised on a unit-of-production basis, with separate calculations being made for each resource. Estimates of reserve quantities are a critical estimate impacting amortisation of production property assets.
(iv) Estimates of Reserve Quantities
The estimated quantities of Proven and Probable hydrocarbon reserves reported by the Company are integral to the calculation of the amortisation expense relating to Production Property Assets, and to the assessment of possible impairment of these assets. Estimated reserve quantities are based upon interpretations of geological and geophysical models and assessments of the technical feasibility and commercial viability of producing the reserves. These assessments require assumptions to be made regarding future development and production costs, commodity prices, exchange rates and fiscal regimes. The estimates of reserves may change from period to period as the economic assumptions used to estimate the reserves can change from period to period, and as additional geological data is generated during the course of operations. Reserves estimates are prepared in accordance with the Company’s policies and procedures for reserves estimation which conform to guidelines prepared by the Society of Petroleum Engineers.
(v) Joint Arrangements
The entity is subject to a number of joint arrangements in relation to both its production properties and exploration assets. The joint arrangement agreements require unanimous consent from all parties in some instances for all relevant activities, all assets are held jointly in common and all parties are severally liable for the liabilities incurred.
These arrangements are therefore classified as Joint Operations and the consolidated entity recognises its direct rights to jointly held assets, liabilities, revenues and expenses.
CUE
ENER
GY R
ESOU
RCES
LIM
ITED:
ANN
UAL R
EPOR
T 201
5/16
46
For
per
sona
l use
onl
y

NOTES TO THE FINANCIAL STATEMENTS (Cont’) FOR THE FINANCIAL YEAR ENDED 30 JUNE 2016
Subsidiaries are fully consolidated from the date on which control is transferred to the Group. They are de-consolidated from the date that control ceases.
Intercompany transactions, balances and unrealised gains on transactions between Group companies are eliminated. Unrealised losses are also eliminated unless the transaction provides evidence of the impairment of the asset transferred. Accounting policies of subsidiaries have been changed where necessary to ensure consistency with the policies adopted by the Group.
The acquisition of subsidiaries is accounted for using the acquisition method of accounting. A change in ownership interest, without the loss of control, is accounted for as an equity transaction, where the difference between the consideration transferred and the book value of the share of the non-controlling interest acquired is recognised directly in equity attributable to the parent.
A change in ownership interest, without the loss of control, is accounted for as an equity transaction, where the difference between the consideration transferred and the book value of the share of the non-controlling interest is recognised directly in equity attributable to the parent.
Non-controlling interest is the results in equity of subsidiaries are shown separately in the statement of profit or loss and other comprehensive income, statement of financial position and statement of changes in equity of the consolidated entity. Losses incurred by the consolidated entity are attributed to the non-controlling interest in full, even if that results in a deficit balance.
Investments in subsidiaries are accounted for at cost in the individual financial statements of Cue Energy Resources Limited.
(h) Revenue recognition
Revenue is recognised in profit or loss when the significant risks and rewards of ownership have been transferred to the buyer. Revenue is recognised and measured at the fair value of the consideration or contributions received, net of goods and service tax (“GST”), to the extent it is probable that the economic benefits will flow to the Group and the revenue can be reliably measured.
Sales revenue
Sales revenue is recognised on the basis of the Group’s interest in a producing field (“entitlements” method), when the physical product and associated risks and rewards of ownership pass to the purchaser, which is generally at the time of ship or truck loading, or in certain instances the product entering the pipeline.
Revenue earned under a production sharing contract (“PSC”) is recognised on a net entitlements basis according to the terms of the PSC.
(vi) Restoration Provisions
Provisions for future environmental restoration are recognised where there is a present obligation as a result of exploration, development, production, transportation or storage activities having been undertaken, and it is probable that an outflow of economic benefits will be required to settle the obligation. The estimated future obligations include the costs of removing facilities, abandoning wells and restoring the affected areas.
(vii) Legal Claim
As a result of an economic project arrangement in the Jeruk field within the Sampang PSC, Indonesia, Cue may in certain circumstances have an obligation to reimburse certain monies spent by the incoming party from future profit oil within the Sampang PSC. There is a dispute between Cue and the incoming party as to the quantum of monies that they may be entitled to claim by way of such reimbursement and when any such reimbursement would be payable. The Company is of the view that any amount which might eventually become payable would not be likely to exceed the amount of USD4.5 million (AUD6.1 million) which has been provided for in the financial statements.
(f) New, revised or amending Accounting Standards and Interpretations adopted
The consolidated entity has adopted all of the new, revised or amending Accounting Standards and Interpretations issued by the Australian Accounting Standards Board (“AASB”) that are mandatory for the current reporting period.
Any new, revised or amending Accounting Standards or Interpretations that are not yet mandatory have not been early adopted.
The adoption of these Accounting Standards and Interpretations did not have any significant impact on the financial performance or position of the consolidated entity.
(g) Principles of consolidation
The consolidated financial statements incorporate the assets and liabilities of all subsidiaries of Cue Energy Resources Limited (‘’company’’ or ‘’parent entity’’) as at 30 June 2016 and the results of all subsidiaries for the year then ended. Cue Energy Resources Limited and its subsidiaries together are referred to in this financial report as the Group or the consolidated entity.
Subsidiaries are all those entities over which the Group has control. The consolidated entity controls an entity when it is exposed to, or has rights to, variable returns from its involvement with the entity and has the ability to affect these returns through its power to direct the activities of the entity. The existence and effect of potential voting rights that are currently exercisable or convertible are considered when assessing whether the Group controls another entity.
FInAn
CIAl
STA
TEm
EnTS
47
For
per
sona
l use
onl
y

NOTES TO THE FINANCIAL STATEMENTS (Cont’) FOR THE FINANCIAL YEAR ENDED 30 JUNE 2016
1. SUMMARY OF SIGNIFICANT ACCOUNTING POLICIES (Cont’)(j) Impairment
The carrying amounts of the consolidated entity’s assets are reviewed at each reporting date to determine whether there is any indication of impairment. If any such indication exists, the asset’s recoverable amount is estimated.
An impairment loss is recognised whenever the carrying amount of an asset or its cash generating unit exceeds the recoverable amount. Impairment losses are recognised in profit or loss, unless an asset has previously been revalued, in which case the impairment loss is recognised as a reversal to the extent of that previous revaluation with any excess recognised through profit or loss.
Impairment losses recognised in respect of cash-generating units are allocated to reduce the carrying amount of the assets in the unit (group of units) on a pro rata basis.
(k) Calculation of recoverable amount
For oil and gas assets the estimated future cash flows are based on value-in-use calculations using estimates of hydrocarbon reserves, future production profiles, commodity prices, operating costs and any future development costs necessary to produce the reserves. Estimates of future commodity prices are based on contracted prices where applicable or based on forward market prices where available. The recoverable amount of other assets is the greater of their net selling price and value-in-use.
In assessing value-in-use, the estimated future cash flows are discounted to their present value using a pre-tax discount rate that reflects current market assessments of the time value of money and the risks specific to the asset. For an asset that does not generate largely independent cash inflows, the recoverable amount is determined for the cash-generating unit to which the asset belongs.
(l) Production properties
Production properties are carried at the reporting date at cost less accumulated amortisation and accumulated impairment losses. Production properties represent the accumulation of all exploration, evaluation, development and acquisition costs in relation to areas of interest in which production licences have been granted.
Amortisation of costs is provided on the unit-of-production basis, separate calculations being made for each resource. The unit-of-production basis results in an amortisation charge proportional to the depletion of economically recoverable reserves (comprising both proven and probable reserves), and is shown as a separate line item in profit or loss.
Amounts (including subsidies) received during the exploration, evaluation, development or construction phases which are in the nature of reimbursement or recoupment of previously incurred costs are offset against such capitalised costs.
Interest income
Interest revenue is recognised as interest accrues using the effective interest method. This is a method calculating the amortised cost of a financial asset and allocating the interest income over the relevant period using the effective interest rate, which is the rate that exactly discounts estimated future cash receipts through the expected life of the financial assets to the net carrying amount of the financial asset.
Other income
Other income is recognised in profit or loss at the fair value of the consideration received or receivable, net of GST, when the significant risks and rewards of ownership have been transferred to the buyer or when the service has been performed.
The gain or loss arising on disposal of a non-current asset is included as other income at the date control of the asset passes to the buyer. The gain or loss on disposal is calculated as the difference between the carrying amount of the asset at the time of disposal and the net proceeds on disposal.
(i) Exploration and evaluation project expenditure
AASB 6 Exploration for and Evaluation of Mineral Resources allows to either capitalise or expense the exploration and evaluation expenditure incurred by the Group.
The previous accounting policy was to capitalise and carry forward exploration and evaluation expenditure as an asset when rights to tenure of the area of interest were current and costs were expected to be recouped or activities in the area of interest had not, at the reporting date, reached a stage that permitted a reasonable assessment of the existence or otherwise of economically recoverable reserves and active and significant operations in , or in relation to, the area of interest were continuing.
The Group has made a voluntary change to its accounting policy relating to exploration and evaluation expenditure. The new accounting policy was adopted for the year 30 June 2016 with effect from 1 July 2015 and has been applied retrospectively.
The new exploration and evaluation accounting policy is to charge exploration and evaluation expenditure against profit and loss as incurred, except for expenditure incurred after a decision to proceed to development is made, in which case the expenditure is capitalised as an asset. This does not include acquisition costs or costs capitalised as a result of a business combination. The impact on the consolidated statement of cash flows is a movement from investing activities to a movement in operating activities. This amendment to the accounting policy has had a significant effect on the consolidated financial performance and consolidated financial position of the Group because it previously capitalised exploration expenditure in the period it was incurred. The Group has transferred at the beginning of the comparative period exploration expenditure costs carried forward to accumulated losses as a result of the change in accounting policy (refer note 1(d)).
CUE
ENER
GY R
ESOU
RCES
LIM
ITED:
ANN
UAL R
EPOR
T 201
5/16
48
For
per
sona
l use
onl
y

NOTES TO THE FINANCIAL STATEMENTS (Cont’) FOR THE FINANCIAL YEAR ENDED 30 JUNE 2016
(m) Property, plant and equipment
CLASS OF FIXED ASSET DEPRECIATION RATE
Office and computer equipment 5-40%
Property, plant and equipment is carried at historical cost less accumulated depreciation and accumulated impairment losses. Depreciation is calculated on a diminishing value basis so as to allocate the cost of each item of equipment over its expected economic life. The economic life of equipment has due regard to physical life limitations and to present assessments of economic recovery. Estimates of remaining useful lives are made on a regular basis for all assets, with annual reassessment for major items. Gains and losses on disposal of property, plant and equipment are taken into account in determining the operating results for the year.
(n) Cash and cash equivalents
For purposes of the statement of cash flows, cash includes deposits at call which are readily convertible to cash on hand and which are used in the cash management function on a day-to-day basis, net of outstanding bank overdrafts.
(o) Trade and other receivables
Trade receivables due from related parties and other receivables represent the principal amounts due at the reporting date plus accrued interest and less, where applicable, any unearned income and allowance for doubtful accounts. Trade receivables are generally due for settlement within 30 days.
(p) Inventories
Inventories consist of hydrocarbon stock. Inventories are valued at the lower of cost and net realisable value. Cost is determined on a weighted average basis and includes direct costs and an appropriate portion of fixed production overheads where applicable.
(q) Trade and other payables
These amounts represent the principal amounts outstanding at the reporting date plus, where applicable, any accrued interest. Trade payables are normally paid within 30 days, and due to their short term nature are generally unsecured and not discounted.
(r) Provisions
A provision is recognised in the statement of financial position when the Group has a present legal or constructive obligation as a result of a past event, it is probable that an outflow of resources embodying economic benefits will be required to settle the obligation and a reliable estimate can be made of the amount of the obligation. Provisions are determined by discounting the expected future cash flows at a pre-tax rate that reflects current market assessments of the time value of money and, where appropriate, the risk specific to the liability.
Restoration
Provisions for future environmental restoration are recognised where there is a present obligation as a result of exploration, development, production, transportation or storage activities having been undertaken, and it is probable that an outflow of economic benefits will be required to settle the obligation. The estimated future obligations include the costs of removing facilities, abandoning wells and restoring the affected areas.
The provision of future restoration costs is the best estimate of the present value of the future expenditure required to settle the restoration obligation at the reporting date, based on current legal requirements. Future restoration costs are reviewed annually and any changes in the estimate are reflected in the present value of the restoration provision at the reporting date, with a corresponding change in the cost of the associated asset.
The amount of the provision for future restoration costs relating to exploration, development and production facilities is capitalised and depleted as a component of the cost of those activities.
(s) Employee benefits
The following liabilities arising in respect of employee benefits are measured at their nominal amounts:
• wages and salaries and annual leave expected to be settled within twelve months of the reporting date; and
• other employee benefits expected to be settled within twelve months of the reporting date.
All other employee benefit liabilities expected to be settled more than 12 months after the reporting date are measured at the present value of the estimated future cash outflows in respect of services provided up to the reporting date. Liabilities are determined after taking into consideration estimated future increase in wages and salaries and past experience regarding staff departures. Related on-costs are included.
(t) Joint operations
A joint operation is a joint arrangement whereby the parties that have joint control of the arrangement have rights to the assets, and obligations for the liabilities, relating to the arrangement. The consolidated entity has recognised its share of jointly held assets, liabilities, revenues and expenses of joint operations. These have been incorporated in the financial statements under the appropriate classifications.
(u) Income tax
The income tax expense for the year is the tax payable on the current period’s taxable income based on the applicable income tax rate for each jurisdiction adjusted by changes in deferred tax assets and liabilities attributable to temporary differences and to unused tax losses.
FInAn
CIAl
STA
TEm
EnTS
49
For
per
sona
l use
onl
y

NOTES TO THE FINANCIAL STATEMENTS (Cont’) FOR THE FINANCIAL YEAR ENDED 30 JUNE 2016
Deferred income tax is provided in full, using the liability method, on temporary differences arising between the tax bases of assets and liabilities and their carrying amounts in the consolidated financial statements. However, deferred income tax is not accounted for if it arises from initial recognition of an asset or liability in a transaction other than a business combination that at the time of the transaction affects neither accounting nor taxable profit or loss. Deferred income tax is determined using tax rates (and laws) that have been enacted or substantially enacted by the reporting date and are expected to apply when the related deferred income tax asset is realised or the deferred income tax liability is settled.
Deferred tax assets are recognised for deductible temporary differences and unused tax losses only if it is probable that future taxable amounts will be available to utilise those temporary differences and losses.
Deferred tax assets and liabilities are offset when there is a legally enforceable right to offset current tax assets and liabilities and when the deferred tax balances relate to the same taxation authority. Current tax assets and tax liabilities are offset where the entity has a legally enforceable right to offset and intends either to settle on a net basis, or to realise the asset and settle the liability simultaneously.
Current and deferred tax balances attributable to amounts recognised directly in equity are also recognised directly in equity.
Cue Energy Resources Limited (the ‘head entity’) and its wholly-owned Australian controlled entities have formed an income tax consolidated group under the tax consolidation regime effective 1 July 2010. The head entity and the controlled entities in the tax consolidated group continue to account for their own current and deferred tax amounts. The tax consolidated group has applied the group allocation approach in determining the appropriate amount of taxes to allocate to members of the tax consolidated group.
In addition to its own current and deferred tax amounts, the head entity also recognises the current tax liabilities (or assets) and the deferred tax assets arising from unused tax losses and unused tax credits assumed from controlled entities in the tax consolidated group.
Assets or liabilities arising under tax funding agreement with the tax consolidated entities are recognised as amounts receivable from or payable to other entities in the tax consolidated group. The tax funding arrangement ensures that the intercompany charge equals the current tax liability or benefit of each tax consolidated group member, resulting in neither a contribution by the head entity to the subsidiaries nor a distribution by the subsidiaries to the head entity.
(v) Foreign currency
Functional and presentation currency
The financial statements of each group entity are measured using their relevant functional currency, which is the currency of the primary economic environment in which that entity operates. The consolidated financial statements are presented in Australian dollars, as this is the parent entity’s functional and presentation currency.
Transactions and balances
Transactions in foreign currencies of entities within the consolidated entity are translated into functional currency at the rate of exchange ruling at the date of the transaction. Non-monetary items measured at historical cost continue to be carried at the exchange rate at the date of the transaction. Non-monetary items measured at fair value are reported at the exchange rate at the date when fair values were determined.
Foreign currency monetary items that are outstanding at the reporting date (other than monetary items arising under foreign currency contracts where the exchange rate for that monetary item is fixed in the contract) are translated using the spot rate at the end of financial year.
Exchange differences arising on the translation of non-monetary items are recognised directly in other comprehensive income to the extent that the underlying gain or loss is recognised in other comprehensive income; otherwise the exchange difference is recognised in profit or loss.
Foreign Operations
The results and financial position of Cue’s foreign operations shall be translated into its presentation currency using the following procedures:
(a) assets and liabilities for each statement of financial position presented (ie including comparatives) shall be translated at the closing rate at the date of that statement of financial position;
(b) income and expenses for each statement presenting profit or loss and other comprehensive income (ie including comparatives) shall be translated at exchange rates at the dates of the transactions; and
(c) all resulting exchange differences shall be recognised in other comprehensive income.
(w) Leases
Operating leases are leases which the lessor effectively retains substantially all the risks and benefits incidental to ownership of the leased asset.
Operating lease payments, net of any incentives received from the lessor, are charged to profit or loss on a straight line basis over the term of the lease.
1. SUMMARY OF SIGNIFICANT ACCOUNTING POLICIES (Cont’)
CUE
ENER
GY R
ESOU
RCES
LIM
ITED:
ANN
UAL R
EPOR
T 201
5/16
50
For
per
sona
l use
onl
y

NOTES TO THE FINANCIAL STATEMENTS (Cont’) FOR THE FINANCIAL YEAR ENDED 30 JUNE 2016
(x) Contributed equity
Ordinary share capital is recognised at the fair value of the consideration received by the Company. Any transaction costs arising on the issue of ordinary shares are recognised directly in equity as a reduction of the share proceeds received. Ordinary share capital bears no special terms or conditions affecting income or capital entitlements of the shareholders.
(y) Rounding
The amounts contained in this financial report have been rounded to the nearest $1,000 (where rounding is applicable) under the option available to the Company under ASIC Corporations (Rounding in Financials and Directors Reports) instrument 206/191. The Company is an entity to which the Class Order applies.
(z) Comparative Figures
When required by Accounting Standards, comparative figures have been adjusted to conform to changes in presentation for the current financial year.
Where the Group restrospectively applies an accounting policy, makes a retrospective restatement or reclassifies items in its financial statements, an additional (third) statement of financial position as at the beginning of the preceding period in addition to the minimum comparative financial statements is presented.
(aa) Non-current Assets Held for Sale Discontinued Operations
Non-current assets and disposal groups are classified as held for sale and measured at the lower of carrying amount and fair value less costs to sell, where the carrying amount will be recovered principally through sale as opposed to continued use. No depreciation or amortisation is charged against assets classified as held for sale.
Classification as “held for sale” occurs when: management has committed to a plan for immediate sale; the sale is expected to occur within one year from the date of classification; and active marketing of the asset has commenced. Such assets are classified as current assets.
A discontinued operation is a component of an entity, being a cash-generating unit (or a group of cash generation units), that either has been disposed of, or is classified as held for sale, and: represents a separate major line of business or geographical area of operations; is part of a single coordinated plan to dispose of a separate major line of business or geographical area of operations; or is a subsidiary acquired exclusively with the view to resale.
Impairment losses are recognised for any initial or subsequent write down of an asset (or disposal group) classified as held for sale to fair value less costs to sell. Any reversal of impairment recognised on classification as held for sale or prior to such classification is recognised as a gain in profit or loss in the period in which it occurs.
(ab) Goods and Services tax (‘GST’) and other similar taxes
Revenues, expense and assets are recognised net of the amount of associated GST, unless the GST incurred is not recoverable from the tax authority. In this case it is recognised as part of the cost of the acquisition of the asset or as part of the expense.
Receivables and payables are stated inclusive of the amount of GST receivable or payable. The net amount of GST recoverable from, or payable to, the tax authority is included in other receivables or other payables in the statement of financial position.
Cash flows are presented on a gross basis. The GST components of cash flows arising from investing or financing activities which are recoverable from, or payable to the tax authority, are presented as operating cash flows.
Commitments and contingencies are disclosed net of the amount of GST recoverable from, or payable to, the tax authority.
(ac) New Accounting Standards and Interpretations not yet mandatory or early adopted
Australian Accounting Standards and Interpretations that have recently been issued or amended but are not yet mandatory, have not been early adopted by the consolidated entity for the annual reporting period ended 30 June 2016. The consolidated entity’s assessment of the impact of these new or amended Accounting Standards and Interpretations, most relevant to the consolidated entity, are set out below.
AASB 9 Financial Instruments
This standard is applicable to annual reporting periods beginning on or after 1 January 2018. The standard replaces all previous versions of AASB 9 and completes the project to replace IAS 39 ‘Financial Instruments: Recognition and Measurement’. AASB 9 introduces new classification and measurement models for financial assets. A financial asset shall be measured at amortised cost, if it is held within a business model whose objective is to hold assets in order to collect contractual cash flows, which arise on specified dates and solely principal and interest. All other financial instrument assets are to be classified and measured at fair value through profit or loss unless the entity makes an irrevocable election on initial recognition to present gains and losses on equity instruments (that are not held-for-trading) in other comprehensive income (‘OCI’). For financial liabilities, the standard requires the portion of the change in fair value that relates to the entity’s own credit risk to be presented in OCI (unless it would create an accounting mismatch). New simpler hedge accounting requirements are intended to more closely align the accounting treatment with the risk management activities of the entity. New impairment requirements will use an ‘expected credit loss’ (‘ECL’) model to recognise an allowance. Impairment will be measured under a 12-month ECL method unless the credit risk on a financial instrument
FInAn
CIAl
STA
TEm
EnTS
51
For
per
sona
l use
onl
y

NOTES TO THE FINANCIAL STATEMENTS (Cont’) FOR THE FINANCIAL YEAR ENDED 30 JUNE 2016
has increased significantly since initial recognition in which case the lifetime ECL method is adopted. The standard introduces additional new disclosures. The consolidated entity will adopt this standard from 1 July 2018 but the impact of its adoption is yet to be assessed by the consolidated entity.
AASB 16 Leases (applicable to annual reporting periods beginning on or after 1 January 2019).
When effective, this Standard will replace the current accounting requirements applicable to leases in AASB 117: Leases and related interpretations. AASB 16 introduces a single lessee accounting model that eliminates the requirement for leases to be classified as operating or finance leases.
The main changes introduced by the new Standard include:
• recognition of a right-to-use asset and liability for all leases (excluding short-term leases with less than 12 months of tenure and leases relating to low-value assets);
• depreciation of right-to-use assets in line with AASB 116: Property, Plant and Equipment in profit or loss and unwinding of the liability in principal and interest components;
• variable lease payments that depend on an index or a rate are included in the initial measurement of the lease liability using the index or rate at the commencement date;
• by applying a practical expedient, a lessee is permitted to elect not to separate non-lease components and instead account for all components as a lease; and
• additional disclosure requirements.
The transitional provisions of AASB 16 allow a lessee to either retrospectively apply the Standard to comparatives in line with AASB 108 or recognise the cumulative effect of retrospective application as an adjustment to opening equity on the date of initial application.
Although the directors anticipate that the adoption of AASB 16 will impact the Group’s financial statements, it is impracticable at this stage to provide a reasonable estimate of such impact.
AASB 15 Revenue from Contracts with Customers
This standard is applicable to annual reporting periods beginning on or after 1 January 2018. The standard provides a single standard for revenue recognition. The core principle of the standard is that an entity will recognise revenue to depict the transfer of promised goods or services to customers in an amount that reflects the consideration to which the entity expects to be entitled in exchange for those goods or services. The standard will require: contracts (either written, verbal or implied) to be identified, together with the separate performance obligations within the contract; determine the transaction price, adjusted for the time value of money excluding credit risk; allocation of the transaction price to the separate performance obligations on a basis of relative stand-alone selling price of each distinct good or service, or estimation approach if no distinct observable prices exist; and recognition of revenue when each performance obligation is satisfied. Credit risk will be presented separately as an expense rather than adjusted to revenue. For goods, the performance obligation would be satisfied when the customer obtains control of the goods. For services, the performance obligation is satisfied when the service has been provided, typically for promises to transfer services to customers. For performance obligations satisfied over time, an entity would select an appropriate measure of progress to determine how much revenue should be recognised as the performance obligation is satisfied. Contracts with customers will be presented in an entity’s statement of financial position as a contract liability, a contract asset, or a receivable, depending on the relationship between the entity’s performance and the customer’s payment. Sufficient quantitative and qualitative disclosure is required to enable users to understand the contracts with customers; the significant judgments made in applying the guidance to those contracts; and any assets recognised from the costs to obtain or fulfil a contract with a customer. The consolidated entity will adopt this standard from 1 July 2018 but the impact of its adoption is yet to be assessed by the consolidated entity.
1. SUMMARY OF SIGNIFICANT ACCOUNTING POLICIES (Cont’)
CUE
ENER
GY R
ESOU
RCES
LIM
ITED:
ANN
UAL R
EPOR
T 201
5/16
52
For
per
sona
l use
onl
y

NOTES TO THE FINANCIAL STATEMENTS (Cont’) FOR THE FINANCIAL YEAR ENDED 30 JUNE 2016
2. FINANCIAL INSTRUMENTSThe Group’s principal financial instruments comprise receivables, payables, cash and short term deposits.
The Group manages its exposure to key financial risks, including interest rate and currency risk through management’s regular assessment of financial risks. The objective of the assessment is to support the delivery of the Group’s financial targets whilst protecting future financial security.
The main risks arising from the Group’s financial instruments are interest rate risk, foreign currency risk, commodity price risk, credit risk and liquidity risk. The Group uses different methods to measure and manage different types of risk to which it is exposed. These include monitoring levels of exposure to interest rate and foreign exchange risk and assessments of market forecasts for interest rate, foreign exchange and commodity prices. These risks are summarised below.
Primary responsibility for identification and control of financial risks rests with the Chief Financial Officer under the authority of the Board. The Board reviews and agrees management’s assessment for managing each of the risks identified below.
The carrying amounts and net fair values of the economic entity’s financial assets and liabilities at the reporting date are:
CONSOLIDATED
CARRYING AMOUNT NET FAIR VALUE
2016 $’000’S
2015 $’000’S
2016 $’000’S
2015 $’000’S
Financial assets
Cash and cash equivalents 20,490 27,605 20,490 27,605
Trade and other receivables 4,481 4,761 4,481 4,761
Non-traded financial assets 24,971 32,366 24,971 32,366
Financial liabilities
Trade and other payables 9,050 15,936 9,050 15,936
Non-traded financial liabilities 9,050 15,936 9,050 15,936
Risk Exposures and Responses(a) Fair Value Risk
The financial assets and liabilities of the Group are recognised in the statement of financial position at their fair value in accordance with the accounting policies set out in note 1. In all instances the fair value of financial amounts and liabilities approximates to their carrying value.
Basis for determining fair values
The following summarises the significant methods and assumptions used in estimating the fair values of financial instruments:
Trade and other receivables
The carrying value less impairment provision of trade receivables is a reasonable approximation of their fair values due to the short-term nature of trade and other receivables.
Financial liabilities
Fair value is calculated based on the present value of future principal and interest cash flows, discounted at the market rate of interest at the reporting date. Where these cash flows are in a foreign currency the present value is converted into Australian dollars at the foreign exchange spot rate prevailing at the reporting date.
Trade and other payables
The carrying value of trade payables is a reasonable approximation of their fair values due to the short term nature of trade payables.
FInAn
CIAl
STA
TEm
EnTS
53
For
per
sona
l use
onl
y

NOTES TO THE FINANCIAL STATEMENTS (Cont’) FOR THE FINANCIAL YEAR ENDED 30 JUNE 2016
2. FINANCIAL INSTRUMENTS (Cont’)(b) Interest Rate Risk
The Group’s exposure to market interest rates is related primarily to the Group’s cash deposits.
At the reporting date, the Group had the following financial assets exposed to Australian and overseas variable interest rate risk that are not designated in cash flow hedges:
CONSOLIDATED
2016 $000’S
2015 $000’S
Cash and cash equivalents 20,490 27,605
The Group constantly analyses its interest rate opportunity and exposure. Within this analysis consideration is given to existing positions and alternative arrangement on fixed or variable deposits.
The following sensitivity analysis is based on the interest rate opportunity/risk in existence at the reporting date.
Based upon the balance of net exposure at the year end, if interest rates changed by +/-1%, with all other variables held constant, the estimated impact on post-tax profit and equity would have been:
CONSOLIDATED
2016 $000’S
2015 $000’S
Impact on post-tax profit
Interest rates +1% 205 341
Interest rates –1% (205) (341)
Impact on equity
Interest rates +1% 205 341
Interest rates –1% (205) (341)
A movement of + and – 1% is selected because this is historically within a range of rate movements and available economic data suggests this range is reasonable.
(c) Foreign Exchange Risk
The Group is subject to foreign exchange risk on its international exploration and appraisal activities where costs are incurred in foreign currencies, in particular United States dollars.
The Board approved the policy of holding certain funds in United States dollars to manage foreign exchange risk.
The Group’s exposure to foreign exchange risk at the reporting date was as follows (holdings are shown in AUD equivalent):
CONSOLIDATED
30 JUNE 2016 30 JUNE 2015
USD $’000’S
NZD $’000’S
IDR $’000’S
USD $’000’S
NZD $’000’S
IDR $’000’S
Financial assets:
Cash and cash equivalents 19,264 495 129 26,635 384 186
Receivables 4,207 258 16 4,394 240 -
Financial liabilities:
Current payables 7,357 911 60 12,659 1,408 357
CUE
ENER
GY R
ESOU
RCES
LIM
ITED:
ANN
UAL R
EPOR
T 201
5/16
54
For
per
sona
l use
onl
y
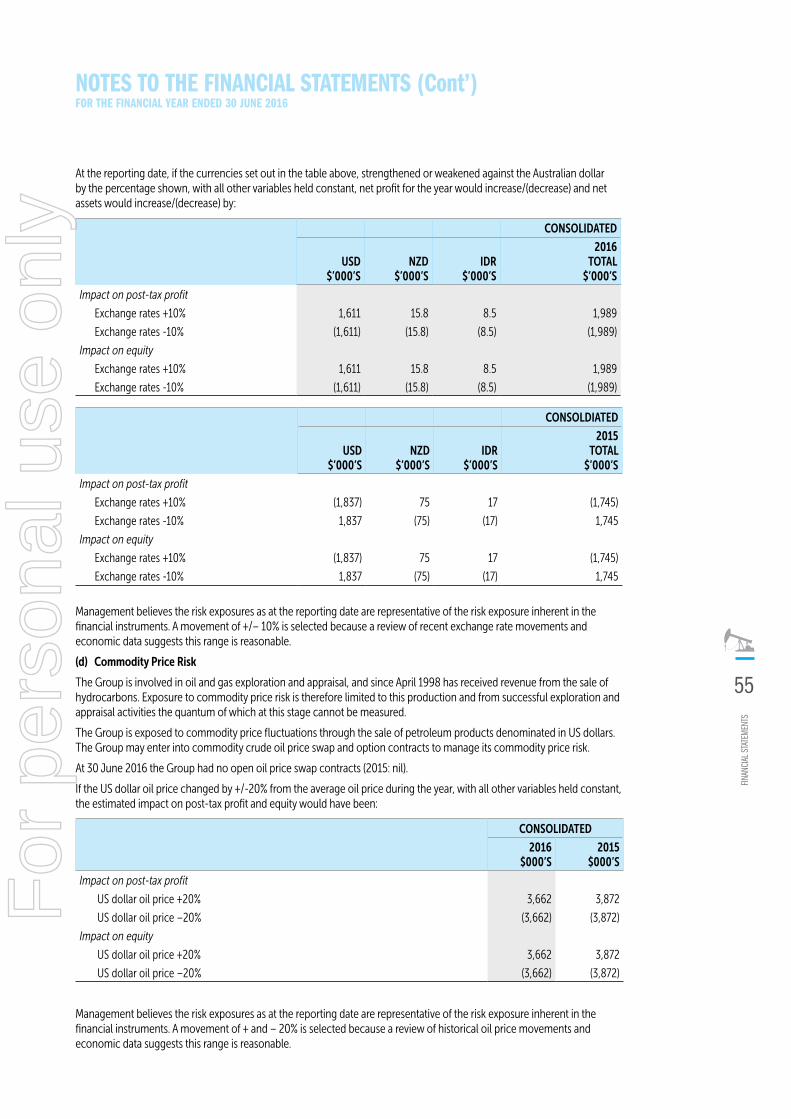
NOTES TO THE FINANCIAL STATEMENTS (Cont’) FOR THE FINANCIAL YEAR ENDED 30 JUNE 2016
At the reporting date, if the currencies set out in the table above, strengthened or weakened against the Australian dollar by the percentage shown, with all other variables held constant, net profit for the year would increase/(decrease) and net assets would increase/(decrease) by:
CONSOLIDATED
USD $’000’S
NZD $’000’S
IDR $’000’S
2016 TOTAL
$’000’S
Impact on post-tax profit
Exchange rates +10% 1,611 15.8 8.5 1,989
Exchange rates -10% (1,611) (15.8) (8.5) (1,989)
Impact on equity
Exchange rates +10% 1,611 15.8 8.5 1,989
Exchange rates -10% (1,611) (15.8) (8.5) (1,989)
CONSOLDIATED
USD $’000’S
NZD $’000’S
IDR $’000’S
2015 TOTAL
$’000’S
Impact on post-tax profit
Exchange rates +10% (1,837) 75 17 (1,745)
Exchange rates -10% 1,837 (75) (17) 1,745
Impact on equity
Exchange rates +10% (1,837) 75 17 (1,745)
Exchange rates -10% 1,837 (75) (17) 1,745
Management believes the risk exposures as at the reporting date are representative of the risk exposure inherent in the financial instruments. A movement of +/– 10% is selected because a review of recent exchange rate movements and economic data suggests this range is reasonable.
(d) Commodity Price Risk
The Group is involved in oil and gas exploration and appraisal, and since April 1998 has received revenue from the sale of hydrocarbons. Exposure to commodity price risk is therefore limited to this production and from successful exploration and appraisal activities the quantum of which at this stage cannot be measured.
The Group is exposed to commodity price fluctuations through the sale of petroleum products denominated in US dollars. The Group may enter into commodity crude oil price swap and option contracts to manage its commodity price risk.
At 30 June 2016 the Group had no open oil price swap contracts (2015: nil).
If the US dollar oil price changed by +/-20% from the average oil price during the year, with all other variables held constant, the estimated impact on post-tax profit and equity would have been:
CONSOLIDATED
2016 $000’S
2015 $000’S
Impact on post-tax profit
US dollar oil price +20% 3,662 3,872
US dollar oil price –20% (3,662) (3,872)
Impact on equity
US dollar oil price +20% 3,662 3,872
US dollar oil price –20% (3,662) (3,872)
Management believes the risk exposures as at the reporting date are representative of the risk exposure inherent in the financial instruments. A movement of + and – 20% is selected because a review of historical oil price movements and economic data suggests this range is reasonable.
FInAn
CIAl
STA
TEm
EnTS
55
For
per
sona
l use
onl
y
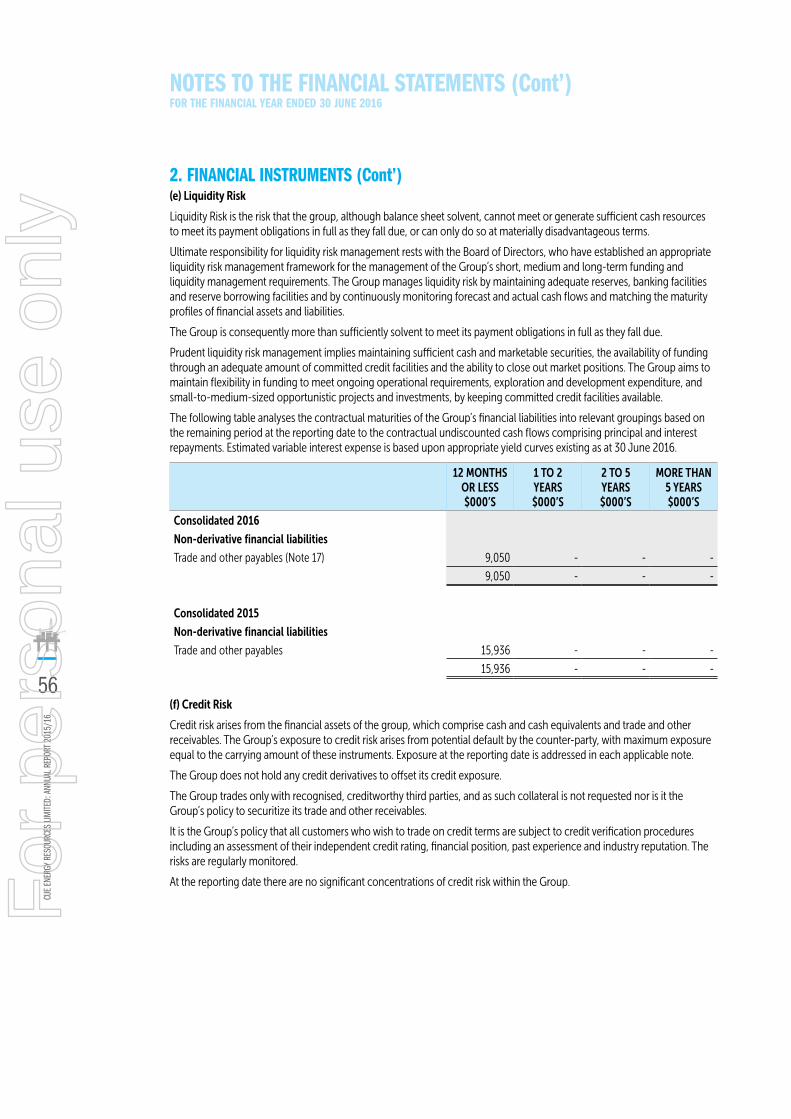
NOTES TO THE FINANCIAL STATEMENTS (Cont’) FOR THE FINANCIAL YEAR ENDED 30 JUNE 2016
2. FINANCIAL INSTRUMENTS (Cont’)(e) Liquidity Risk
Liquidity Risk is the risk that the group, although balance sheet solvent, cannot meet or generate sufficient cash resources to meet its payment obligations in full as they fall due, or can only do so at materially disadvantageous terms.
Ultimate responsibility for liquidity risk management rests with the Board of Directors, who have established an appropriate liquidity risk management framework for the management of the Group’s short, medium and long-term funding and liquidity management requirements. The Group manages liquidity risk by maintaining adequate reserves, banking facilities and reserve borrowing facilities and by continuously monitoring forecast and actual cash flows and matching the maturity profiles of financial assets and liabilities.
The Group is consequently more than sufficiently solvent to meet its payment obligations in full as they fall due.
Prudent liquidity risk management implies maintaining sufficient cash and marketable securities, the availability of funding through an adequate amount of committed credit facilities and the ability to close out market positions. The Group aims to maintain flexibility in funding to meet ongoing operational requirements, exploration and development expenditure, and small-to-medium-sized opportunistic projects and investments, by keeping committed credit facilities available.
The following table analyses the contractual maturities of the Group’s financial liabilities into relevant groupings based on the remaining period at the reporting date to the contractual undiscounted cash flows comprising principal and interest repayments. Estimated variable interest expense is based upon appropriate yield curves existing as at 30 June 2016.
12 MONTHS OR LESS $000’S
1 TO 2 YEARS $000’S
2 TO 5 YEARS $000’S
MORE THAN 5 YEARS $000’S
Consolidated 2016
Non-derivative financial liabilities
Trade and other payables (Note 17) 9,050 - - -
9,050 - - -
Consolidated 2015
Non-derivative financial liabilities
Trade and other payables 15,936 - - -
15,936 - - -
(f) Credit Risk
Credit risk arises from the financial assets of the group, which comprise cash and cash equivalents and trade and other receivables. The Group’s exposure to credit risk arises from potential default by the counter-party, with maximum exposure equal to the carrying amount of these instruments. Exposure at the reporting date is addressed in each applicable note.
The Group does not hold any credit derivatives to offset its credit exposure.
The Group trades only with recognised, creditworthy third parties, and as such collateral is not requested nor is it the Group’s policy to securitize its trade and other receivables.
It is the Group’s policy that all customers who wish to trade on credit terms are subject to credit verification procedures including an assessment of their independent credit rating, financial position, past experience and industry reputation. The risks are regularly monitored.
At the reporting date there are no significant concentrations of credit risk within the Group.
CUE
ENER
GY R
ESOU
RCES
LIM
ITED:
ANN
UAL R
EPOR
T 201
5/16
56
For
per
sona
l use
onl
y

NOTES TO THE FINANCIAL STATEMENTS (Cont’) FOR THE FINANCIAL YEAR ENDED 30 JUNE 2016
3. REVENUE AND OTHER INCOMECONSOLIDATED
2016 $000’S
2015 $000’S
Revenue from continuing operations:
Production income 45,412 36,704
Other income:
Interest from cash and cash equivalents 60 107
Maari insurance refund 3,720 -
Gain on acquisition of 60% Mahakam Hilir PSC(1) - 36,022
Total other revenue from continuing operations 3,780 36,129
Net foreign currency exchange (loss)/gain (90) 6,916
(1) Gain on bargain purchase of exploration assets
4. EXPENSESProfit before income tax expense from continuing operations includes the following specific areas:
2016 $000’S
2015 $000’S
Production Expenses
Production costs 19,653 12,989
Amortisation of production properties 10,932 10,798
Total production expenses 30,585 23,787
Administration Expenses
Depreciation of property, plant and equipment 34 49
Employee expense 4,793 4,150
Superannuation contribution expense 245 221
Operating lease expenses 254 265
Takeover defence related costs - 2,003
Other expenses 1,005 765
Business development expenses 389 1,479
Total administration expenses 6,720 8,932
FInAn
CIAl
STA
TEm
EnTS
57
For
per
sona
l use
onl
y

NOTES TO THE FINANCIAL STATEMENTS (Cont’) FOR THE FINANCIAL YEAR ENDED 30 JUNE 2016
5. AUDITORS REMUNERATIONAmounts paid or due and payable to the auditor – BDO East Coast Partnership for:
2016 $
2015 $
Audit or review of the financial statements 121,700 115,500
Other Services:
Advisory Services 2,000 1,000
Tax compliance 20,000 36,900
Tax consulting 85,693 -
Total 229,393 153,400
No other services were provided by the auditor during the year, other than those set out above.
CUE
ENER
GY R
ESOU
RCES
LIM
ITED:
ANN
UAL R
EPOR
T 201
5/16
58
For
per
sona
l use
onl
y

NOTES TO THE FINANCIAL STATEMENTS (Cont’) FOR THE FINANCIAL YEAR ENDED 30 JUNE 2016
6. TAXATIONCONSOLIDATED
2016 $000’S
RESTATED 2015
$000’S
INCOME TAX BENEFIT/(EXPENSE)
Current tax (4,744) (3,266)
Adjustment recognised for current tax in prior periods (1,706) -
Deferred tax 1,576 8,611
Aggregate income tax benefit/(expense)
(4,874) 5,345
Income tax expense is attributable to:
Continuing operations (4,800) 5,275
Discontinued operations (74) 70
(4,874) 5,345
Numerical reconciliation of income tax expense and tax at the statutory rate
(Loss)/profit before income tax benefit/(expense) from continuing operations (79,598) 26,916
(Loss)/profit before income tax benefit/(expense) from discontinuing operations (2,989) 8,684
(Loss)/profit before income tax benefit/(expense) (82,587) 35,600
Tax expense at Australian tax rate of 30% (2015: 30%) 24,776 (10,680)
Unrealised foreign exchange movements (58) 1,666
Non-taxable gain reversal on bargain purchase (11,287) 10,805
Non-assessable intercompany interest 470 86
Non-deductible / (deductible) mining deductions 407 3,529
Non-taxable gain on disposal of subsidiary - 2,535
Unrecognised temporary differences (11,532) (175)
Unrecognised tax losses (8,183) (2,179)
Adjustments to current tax from prior periods(i) (1,706) -
Derecognition of deferred tax assets - continuing operations 3,279 -
Derecognition of deferred tax assets - discontinued operations (74) -
Difference in overseas tax rates (966) (242)
Income tax benefit/(expense) (4,874) 5,345
(i) During the 2016 income year, Cue Sampang Pty Ltd received notices of amended assessments in respect of the 2011 tax year. Under the amended assessments the additional tax payable including penalties and interest is $1.7 million . Cue Sampang Pty Ltd is currently disputing these amended assessments. Cue Sampang Pty Ltd has paid $0.6 million of the additional tax liability and has provided for the balance of $1.1 million.
FInAn
CIAl
STA
TEm
EnTS
59
For
per
sona
l use
onl
y

NOTES TO THE FINANCIAL STATEMENTS (Cont’) FOR THE FINANCIAL YEAR ENDED 30 JUNE 2016
6. TAXATION (Cont’)CONSOLIDATED
2016 $000’S
RESTATED 2015
$000’S
Current tax liabilities 1,865 580
Deferred tax assets recognised comprise of
Restoration provision 228 3,238
Tax losses - 5,267
Total deferred tax assets recognised 228 8,505
Deferred tax liabilities recognised comprise of
Production properties (4,104) (12,731)
Inventories (290) (1,522)
Total deferred tax liabilities recognised (4,395) (14,253)
Net deferred tax liabilities recognised (4,167) (5,748)
Presentation in the consolidated statement of financial position as follows:
Deferred tax asset - 70
Deferred tax liability (4,167) (5,818)
Net (4,167) (5,748)
Deferred tax assets not recognised comprise of
Restoration provision 3,672 -
Employee provisions 199 191
Tax losses 23,615 18,579
Total deferred tax assets not recognised 27,487 18,770
Deferred tax liabilities not recognised comprise of
Production properties (611) -
Inventories (266) -
Total deferred tax liabilities not recognised (877) -
Net deferred tax assets not recognised 26,610 18,770
CUE
ENER
GY R
ESOU
RCES
LIM
ITED:
ANN
UAL R
EPOR
T 201
5/16
60
For
per
sona
l use
onl
y
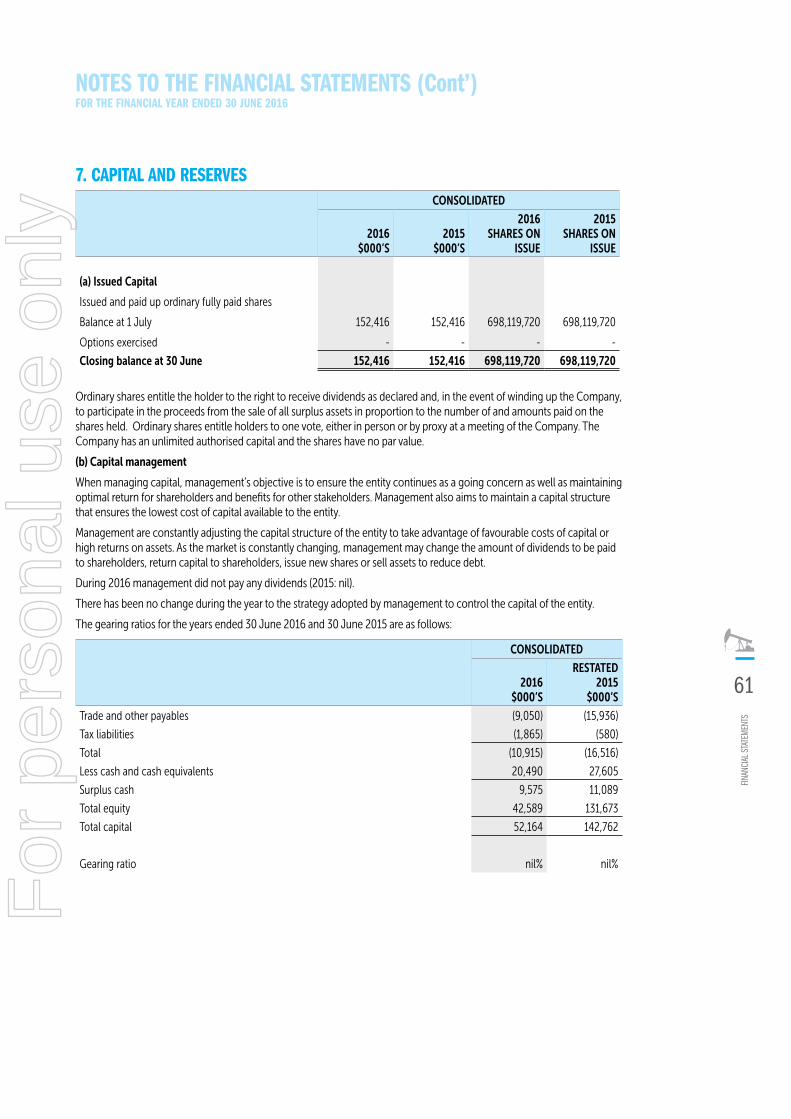
NOTES TO THE FINANCIAL STATEMENTS (Cont’) FOR THE FINANCIAL YEAR ENDED 30 JUNE 2016
7. CAPITAL AND RESERVESCONSOLIDATED
2016 $000’S
2015 $000’S
2016 SHARES ON
ISSUE
2015 SHARES ON
ISSUE
(a) Issued Capital
Issued and paid up ordinary fully paid shares
Balance at 1 July
Options exercised
152,416
-
152,416
-
698,119,720
-
698,119,720
-
Closing balance at 30 June 152,416 152,416 698,119,720 698,119,720
Ordinary shares entitle the holder to the right to receive dividends as declared and, in the event of winding up the Company, to participate in the proceeds from the sale of all surplus assets in proportion to the number of and amounts paid on the shares held. Ordinary shares entitle holders to one vote, either in person or by proxy at a meeting of the Company. The Company has an unlimited authorised capital and the shares have no par value.
(b) Capital management
When managing capital, management’s objective is to ensure the entity continues as a going concern as well as maintaining optimal return for shareholders and benefits for other stakeholders. Management also aims to maintain a capital structure that ensures the lowest cost of capital available to the entity.
Management are constantly adjusting the capital structure of the entity to take advantage of favourable costs of capital or high returns on assets. As the market is constantly changing, management may change the amount of dividends to be paid to shareholders, return capital to shareholders, issue new shares or sell assets to reduce debt.
During 2016 management did not pay any dividends (2015: nil).
There has been no change during the year to the strategy adopted by management to control the capital of the entity.
The gearing ratios for the years ended 30 June 2016 and 30 June 2015 are as follows:
CONSOLIDATED
2016 $000’S
RESTATED 2015
$000’S
Trade and other payables (9,050) (15,936)
Tax liabilities (1,865) (580)
Total (10,915) (16,516)
Less cash and cash equivalents 20,490 27,605
Surplus cash 9,575 11,089
Total equity 42,589 131,673
Total capital 52,164 142,762
Gearing ratio nil% nil%
FInAn
CIAl
STA
TEm
EnTS
61
For
per
sona
l use
onl
y

NOTES TO THE FINANCIAL STATEMENTS (Cont’) FOR THE FINANCIAL YEAR ENDED 30 JUNE 2016
8. TRADE AND OTHER RECEIVABLESCONSOLIDATED
2016 $000’S
2015 $000’S
Current receivables
Trade receivables 4,201 3,288
Other receivables and prepayments 280 1,473
4,481 4,761
The ageing of trade receivables at the reporting date was as follows:
Less than one month 4,201 3,288
4,201 3,288
Trade receivables are non-interest-bearing and settlement terms are generally within 30 days.
Trade receivables are neither past due nor impaired and relate to a number of independent customers for whom there is no recent history of default.
Impaired receivables
At 30 June 2016 there were no current trade receivables that were impaired (2015: nil).
The balance of the allowance for impairment in respect of trade receivables at 30 June 2016 was nil (2015: nil). There has been no movement in the allowance during the year.
The Directors consider that the carrying value of receivables reflects their fair values.
9. PROPERTY, PLANT AND EQUIPMENTCONSOLIDATED
2016 $000’S
2015 $000’S
Office and computer equipment
Cost 267 258
Accumulated depreciation (208) (182)
59 76
Reconciliation of the carrying amount of office and computer equipment at the beginning and end of the current financial year is set out below:
CONSOLIDATED
2016 $000’S
2015 $000’S
Balance at beginning of year 76 118
Additions 17 7
Depreciation expense (34) (49)
Balance at end of year 59 76
10. INVENTORIESCONSOLIDATED
2016 $000’S
2015 $000’S
Current Assets
Inventory at cost 1,609 3,728
CUE
ENER
GY R
ESOU
RCES
LIM
ITED:
ANN
UAL R
EPOR
T 201
5/16
62
For
per
sona
l use
onl
y

NOTES TO THE FINANCIAL STATEMENTS (Cont’) FOR THE FINANCIAL YEAR ENDED 30 JUNE 2016
11. SHARES IN SUBSIDIARIES Shares held by the parent entity at the reporting date:
PARENT
SUBSIDIARY COMPANIES
2016
$
2015
$INTEREST
HELDCOUNTRY OF
INCORPORATION PRINCIPAL ACTIVITY
Cue Mahato Pty Ltd 2 2 100% Australia Petroleum exploration
Cue Mahakam Hilir Pty Ltd 1 1 100% Australia Petroleum exploration
Cue Kalimantan Pte Ltd1 2 2 100% Singapore Petroleum exploration
Cue (Ashmore Cartier) Pty Ltd 2 2 100% Australia Petroleum exploration
Cue Sampang Pty Ltd 1 1 100% AustraliaPetroleum production and exploration
Cue Resources, Inc 1,371 1,371 100% USAPetroleum production and exploration
Buccaneer Operating LLC2 1 1 100% USAPetroleum production and exploration
Cheetah Energy LLC2 1,388 - 100% USAPetroleum production and exploration
Cue Taranaki Pty Ltd 1 1 100% AustraliaPetroleum production and exploration
Cue Cooper Pty Ltd3 2 - 100% Australia Petroleum exploration
Cue Exploration Pty Ltd 1,929,077 1,929,077 100% Australia Petroleum exploration
Less accumulated impairment losses (1,343,808) (1,343,808)
585,269 585,269
Total 588,040 586,650
All companies in the Group have a 30 June reporting date. 1 shares held by Cue Mahakam Hilir Pty Ltd.2 shares held by Cue Resources, Inc.3 shares held by Parent Company (incorporated 18 August 2015).
FInAn
CIAl
STA
TEm
EnTS
63
For
per
sona
l use
onl
y

NOTES TO THE FINANCIAL STATEMENTS (Cont’) FOR THE FINANCIAL YEAR ENDED 30 JUNE 2016
12. EXPLORATION AND EVALUATION EXPENDITURECONSOLIDATED
2016 $000’S
RESTATED 2015
$000’S
Costs carried forward in respect of areas of interest in exploration and evaluation phase 51,629 8,674
Expenditure assets acquired during the year - 5,330
Fair value of assets acquired - 37,625
Impairment of exploration asset(i) (51,629) -
Closing balance at 30 June - 51,629
Accumulated costs incurred on current areas of interest net of amounts written off -
Joint Venture assets:
- Mahato PSC - 5,330
- PEP 51313 - 2,634
- PEP 51149 - 1,287
- 9,251
Controlled assets:
- Mahakam Hilir PSC - 42,378
- 51,629
(i) Includes foreign currency translation revenue of $1.67 million.
Exploration Costs Expensed
2016 $000’S
2015 $000’S
Exploration & Evaluation Expenditure
Sampang PSC 213 (34)
Mahakam Hilir PSC 9,113 (721)
Mahato PSC 346 51
WA-359-P 488 1,249
WA-360-P 19 106
WA-361-P 23 4
WA-389-P 1,504 208
WA-409-P 537 663
PEP51313 159 165
PEP51149 3,860 321
PEP54865 67 87
16,329 2,099CUE
ENER
GY R
ESOU
RCES
LIM
ITED:
ANN
UAL R
EPOR
T 201
5/16
64
For
per
sona
l use
onl
y
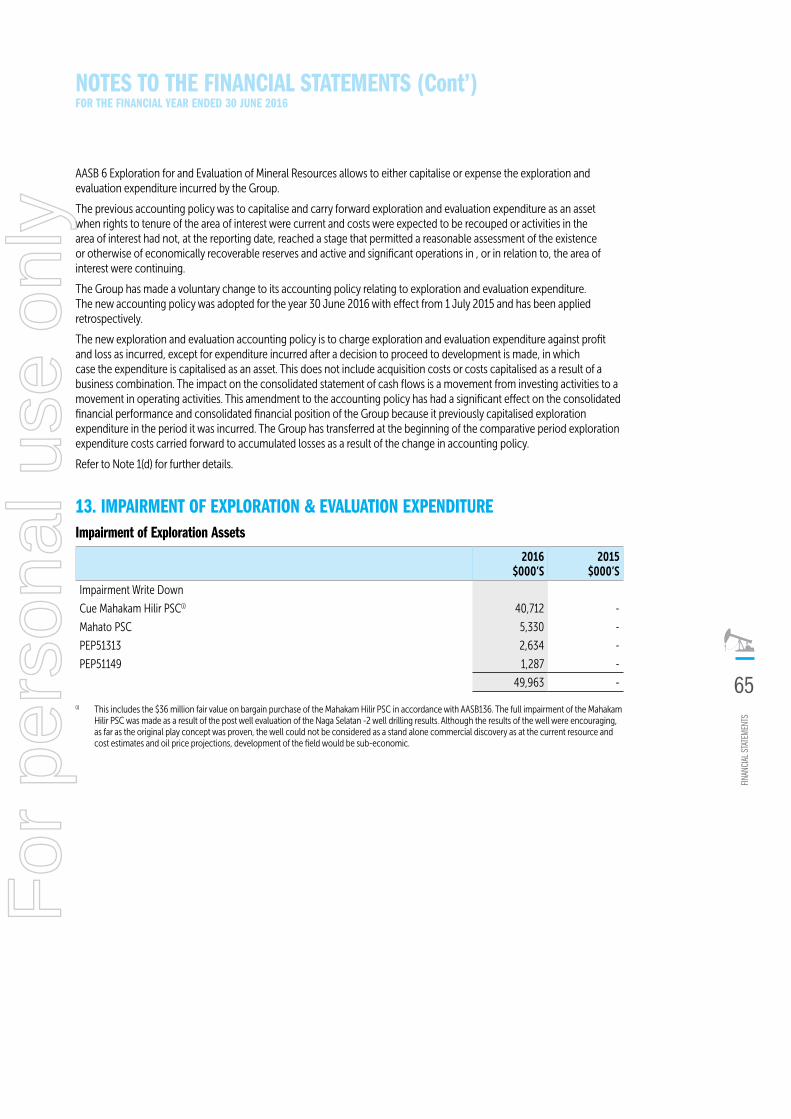
NOTES TO THE FINANCIAL STATEMENTS (Cont’) FOR THE FINANCIAL YEAR ENDED 30 JUNE 2016
AASB 6 Exploration for and Evaluation of Mineral Resources allows to either capitalise or expense the exploration and evaluation expenditure incurred by the Group.
The previous accounting policy was to capitalise and carry forward exploration and evaluation expenditure as an asset when rights to tenure of the area of interest were current and costs were expected to be recouped or activities in the area of interest had not, at the reporting date, reached a stage that permitted a reasonable assessment of the existence or otherwise of economically recoverable reserves and active and significant operations in , or in relation to, the area of interest were continuing.
The Group has made a voluntary change to its accounting policy relating to exploration and evaluation expenditure. The new accounting policy was adopted for the year 30 June 2016 with effect from 1 July 2015 and has been applied retrospectively.
The new exploration and evaluation accounting policy is to charge exploration and evaluation expenditure against profit and loss as incurred, except for expenditure incurred after a decision to proceed to development is made, in which case the expenditure is capitalised as an asset. This does not include acquisition costs or costs capitalised as a result of a business combination. The impact on the consolidated statement of cash flows is a movement from investing activities to a movement in operating activities. This amendment to the accounting policy has had a significant effect on the consolidated financial performance and consolidated financial position of the Group because it previously capitalised exploration expenditure in the period it was incurred. The Group has transferred at the beginning of the comparative period exploration expenditure costs carried forward to accumulated losses as a result of the change in accounting policy.
Refer to Note 1(d) for further details.
13. IMPAIRMENT OF EXPLORATION & EVALUATION EXPENDITURE Impairment of Exploration Assets
2016 $000’S
2015 $000’S
Impairment Write Down
Cue Mahakam Hilir PSC(i) 40,712 -
Mahato PSC 5,330 -
PEP51313 2,634 -
PEP51149 1,287 -
49,963 -
(i) This includes the $36 million fair value on bargain purchase of the Mahakam Hilir PSC in accordance with AASB136. The full impairment of the Mahakam Hilir PSC was made as a result of the post well evaluation of the Naga Selatan -2 well drilling results. Although the results of the well were encouraging, as far as the original play concept was proven, the well could not be considered as a stand alone commercial discovery as at the current resource and cost estimates and oil price projections, development of the field would be sub-economic.
FInAn
CIAl
STA
TEm
EnTS
65
For
per
sona
l use
onl
y

NOTES TO THE FINANCIAL STATEMENTS (Cont’) FOR THE FINANCIAL YEAR ENDED 30 JUNE 2016
14. PRODUCTION PROPERTIESCONSOLIDATED
2016 $000’S
2015 $000’S
Balance at beginning of year 78,131 79,458
Production asset reclassified as Asset held for sale (Pine Mills) (3,548) -
Impairment – production from discontinuing operations (Pine Mills) (1,200) -
Impairment – production from continuing operations (25,103) (18,015)
Expenditure incurred during the year 4,461 17,332
Acquisition of production asset - 3,906
Disposal of production asset - (553)
Changes in abandonment provision - production 930 6,831
Amortisation expense from continuing operations (10,932) (10,798)
Amortisation expense from discontinuing operations (Pine Mills) (175) (30)
Balance at end of year 42,564 78,131
Net accumulated costs incurred on areas of interest
Joint Venture assets:
- Oyong and Wortel – Sampang PSC 9,935 13,075
- Maari – PMP 38160 32,629 61,132
42,564 74,207
Controlled assets:
- Pine Mills - 3,924
Total 42,564 78,131
CUE
ENER
GY R
ESOU
RCES
LIM
ITED:
ANN
UAL R
EPOR
T 201
5/16
66
For
per
sona
l use
onl
y

NOTES TO THE FINANCIAL STATEMENTS (Cont’) FOR THE FINANCIAL YEAR ENDED 30 JUNE 2016
15. IMPAIRMENT OF PRODUCTION PROPERTY ASSETSAt 30 June 2016 the Group reassessed the carrying amount of its oil and gas assets, Production Properties (refer note 14 and note 1(i)), for indicators of impairment such as changes in future prices, future costs and reserves. As a result, the recoverable amounts of cash-generating units were formally reassessed. An impairment of the Maari oil field development in New Zealand of $25.10 million (2015: $18.01 million) and the Pine Mills oil field development in the USA of $1.2 million (2015: nil), primarily as a result of significantly reduced oil prices, was recognised during the year).
Estimates of recoverable amounts are based on the assets’ value-in-use, determined by discounting each asset’s estimated future cash flows at asset specific discount rates. The pre-tax discount rates applied were 14.3% (2015: 14.3%) equivalent to post-tax discount rates of 10% (2015: 10%) depending on the nature of the risks specific to each asset. Recoverable amounts are estimated as follows:
Maari $20.46 million
Pines Mills $2.08 million
Where an asset does not generate cash flows that are largely independent from other assets or groups of assets, the recoverable amount is determined for the cash-generating unit to which the asset belongs.
16. PRODUCTION ASSET RECLASSIFIED AS ASSET HELD FOR SALE2016
$000’S
Current Assets
Trade and other receivables 371
Inventories 37
Total Current Assets 408
Non-Current Assets
Property, plant and equipment 139
Production properties 3,548
Total Non-Current Assets 3,687
Total Assets 4,095
Current Liabilities
Trade and other payables 1,447
Total Current Liabilities 1,447
Non-Current Liabilities
Provisions 570
Total Non-Current Liabilities 570
Total Liabilities 2,017
Net Assets 2,078
It is expected the Pine Mills asset will be sold within six months.
FInAn
CIAl
STA
TEm
EnTS
67
For
per
sona
l use
onl
y

NOTES TO THE FINANCIAL STATEMENTS (Cont’) FOR THE FINANCIAL YEAR ENDED 30 JUNE 2016
17. TRADE AND OTHER PAYABLES2016
$000’S2015
$000’S
Current
Trade payables and accruals 8,961 15,637
Amounts due to directors and director related entities 89 299
9,050 15,936
The Directors consider the carrying amount of payables reflect their fair values. Trade creditors are generally settled within 30 days. Included within trade payable and accruals is an amount of $6.1 million relating to liabilities associated with a dispute in relation to the Jeruk field within the Sampang PSC. Refer to note 29 for more information.
18. PROVISIONSCONSOLIDATED
2016 $000’S
2015 $000’S
Current
Employee benefits 640 584
Non-Current
Employee benefits 31 96
Restoration 12,939 11,313
12,970 11,409
Movements in each class of provision during the financial year are set out below:
EMPLOYEE BENEFITS RESTORATION
$000’S $000’S
Consolidated
Balance at 1 July 2015 680 11,313
Provisions made during the year 250 1,888
Unused amounts reversed - (262)
Provisions used during the year (259) -
Balance at 30 June 2016 671 12,939
RestorationProvisions for future removal and restoration costs are recognised where there is a present obligation as a result of exploration, development, production, transportation or storage activities having been undertaken, and it is probable that an outflow of economic benefits will be required to settle the obligation. The estimated future obligations include costs of removing facilities, abandoning wells and restoring the affected areas. Expected timing of outflow of restoration liabilities is not within the next 12 months from the reporting date.
CUE
ENER
GY R
ESOU
RCES
LIM
ITED:
ANN
UAL R
EPOR
T 201
5/16
68
For
per
sona
l use
onl
y

NOTES TO THE FINANCIAL STATEMENTS (Cont’) FOR THE FINANCIAL YEAR ENDED 30 JUNE 2016
19. INTERESTS IN JOINT OPERATIONS
PROPERTY OPERATOR
CUE INTEREST
(%)GROSS AREA
(KM2)NET AREA
(KM2)
PERMIT EXPIRY DATE
PETROLEUM EXPLORATION PROPERTIES
Carnarvon Basin – Western Australia
WA-359-P Cue Exploration Pty Ltd 100 645 645 25/04/2018
WA-389-P BHP Billiton (Australia) Pty Ltd 40 1,939 775.60 08/10/2018
*WA-409-P Cue Exploration Pty Ltd 100 565 169.50 20/07/2016
New Zealand
**PEP51149 Todd Exploration Limited 20 217 43.40 22/09/2018
Indonesia
Mahakam Hilir PSC Cue Kalimantan Pte Ltd 100 222.14 88.90 12/05/2020
Mahato PSC Texcal Mahato Pte Ltd 12.50 5,600 700 20/07/2018
PETROLEUM PRODUCTION PROPERTIES
New Zealand
PMP 38160 OMV New Zealand Limited 5 80.18 4 01/12/2027
Madura - Indonesia
Sampang PSC Santos (Sampang) Pty Ltd 15 (8.181818
Jeruk field)
534.50 80.20 04/12/2027
USA
Pine Mills Cue Resources, Inc 80 8,903.08 7122.47 N/A
* Renewal for this permit has been submitted.
** Surrender of license has been submitted by the Operator.
FInAn
CIAl
STA
TEm
EnTS
69
For
per
sona
l use
onl
y

NOTES TO THE FINANCIAL STATEMENTS (Cont’) FOR THE FINANCIAL YEAR ENDED 30 JUNE 2016
19. INTERESTS IN JOINT OPERATIONS (Cont’)CONSOLIDATED
2016 $000’S
2015 $000’S
The share of assets and liabilities of the joint operations and other financial liabilities attributed to Joint Operations have been included under the relevant headings:
Current Assets:
Receivables 4,201 4,192
Inventory 1,609 3,714
Non-Current Assets:
Exploration and Evaluation Expenditure (note 12) - 9,251
Production Properties (note 14) 42,564 74,207
Total Assets 48,374 91,364
Current Liabilities:
Payables 8,298 6,596
Current Tax Liabilities 1,865 576
Non-Current Liabilities:
Restoration Provisions 12,940 11,312
Deferred Tax Liabilities 4,167 5,818
Total Liabilities 27,270 24,302
Net Assets 21,104 67,062
Income and expenses of the consolidated entity attributable to joint ventures:
Production Income 45,412 37,450
Production Expenses 16,684 15,637
Refer to note 29 in relation to contingent liabilities of the Group.
Commitments for expenditure are disclosed in note 20.
CUE
ENER
GY R
ESOU
RCES
LIM
ITED:
ANN
UAL R
EPOR
T 201
5/16
70
For
per
sona
l use
onl
y

NOTES TO THE FINANCIAL STATEMENTS (Cont’) FOR THE FINANCIAL YEAR ENDED 30 JUNE 2016
20. COMMITMENTS FOR EXPENDITUREa) Exploration Tenements
In order to maintain current rights of tenure to petroleum exploration tenements, the Group has discretionary exploration expenditure requirements up until expiry of the primary term of the tenements. These requirements, which are subject to renegotiation and are not provided for in the financial statements, are payable as follows:
CONSOLIDATED
2016 $000’S
2015 $000’S
Not later than 1 year 24 21,260
Later than 1 year but not later than 2 years 30,310 413
Later than 2 years but not later than 5 years - -
Later than 5 years - -
30,334 21,673
If the economic entity decides to relinquish certain tenements and/or does not meet these obligations, assets recognised in the Statement of Financial Position may require review in order to determine the appropriateness of carrying values. The sale, transfer or farm-out of exploration rights to third parties could potentially reduce or extinguish these obligations.
All commitments relate to Joint Operation projects.
b) Production Development Expenditure
In order to maintain and improve existing production properties the Group has committed to expend funds as follows:
CONSOLIDATED
2016 $000’S
2015 $000’S
Not later than 1 year 1,765 4,982
Later than 1 year but not later than 2 years 408 -
Later than 2 years but not later than 5 years - -
Later than 5 years - -
2,173 4,982
All development expenditure commitments relates to the development of oil and gas fields.
c) Operating Lease Commitments
CONSOLIDATED
2016 $000’S
2015 $000’S
Non-cancellable operating lease are payable as follows:
Not later than 1 year 293 217
Later than 1 year but not later than 2 years 302 276
Later than 2 years but not later than 5 years 107 383
Later than 5 years - -
702 876
Premises lease term for 5 years from the commencement date of 12 September 2013, with a fixed increase of 3.75% p.a. and further term of 5 years, at the Company’s option.
FInAn
CIAl
STA
TEm
EnTS
71
For
per
sona
l use
onl
y

NOTES TO THE FINANCIAL STATEMENTS (Cont’) FOR THE FINANCIAL YEAR ENDED 30 JUNE 2016
21. EVENTS SUBSEQUENT TO THE REPORTING DATESubsequent to the end of the financial year:
(i) Mr Andrew Knight resigned as a director, and Mr Duncan Saville was appointed as a director, effective 18 August 2016.
(ii) Cue together with all joint venture partners has elected to withdraw from PEP54865 and PEP51313, offshore New Zealand. These were fully impaired as at 30 June 2016.
Apart from these matters the Directors are not aware of any matter or circumstance since the end of the financial year, not otherwise dealt with in this report that has significantly or may significantly affect the operations of Cue Energy Resources Limited, the results of those operations or the state of affairs of the Company or Group.
22. EARNINGS PER SHARE CONSOLIDATED
2016 $000’S
2015 $000’S
Earnings/(loss) per share for profit/(loss) from continuing operations
Profit/(loss) after income tax (84,398) 32,191
Non-controlling interest - (2)
Profit/(loss) after income tax attributable to the owners of Cue Energy Resources Limited
(84,398) 32,189
NUMBER NUMBER
Weighted average number of ordinary shares used in calculating basic earnings per share 698,119,720 698,119,720
Weighted average number of ordinary shares used in calculating diluted earnings per share 698,119,720 698,119,720
CENTS CENTS
Basic earnings per share 12.09 4.61
Diluted earnings per share 12.09 4.61
CONSOLIDATED
2016 $000’S
2015 $000’S
Earnings/(loss) per share for profit/(loss) from discontinued operations
Profit/(loss) after income tax attributable to the owners of Cue Energy Resources Limited (3,062) 8,754
Non-controlling interest 626 -
Profit/(loss) after income tax attributable to the owners of Cue Energy Resources Limited (2,436) 8,754
NUMBER NUMBER
Weighted average number of ordinary shares used in calculating basic earnings per share 698,119,720 698,119,720
Weighted average number of ordinary shares used in calculating diluted earnings per share 698,119,720 698,119,720
CENTS CENTS
Basic earnings per share (0.35) 1.25
Diluted earnings per share (0.35) 1.25
CUE
ENER
GY R
ESOU
RCES
LIM
ITED:
ANN
UAL R
EPOR
T 201
5/16
72
For
per
sona
l use
onl
y

NOTES TO THE FINANCIAL STATEMENTS (Cont’) FOR THE FINANCIAL YEAR ENDED 30 JUNE 2016
CONSOLIDATED
2016 $000’S
2015 $000’S
Earnings/(loss) per share for profit/(loss)
Profit/(loss) after income tax (87,460) 40,945
Non-controlling interest 626 (2)
Profit/(loss) after income tax attributable to the owners of Cue Energy Resources Limited (86,834) 40,943
NUMBER NUMBER
Weighted average number of ordinary shares used in calculating basic earnings per share 698,119,720 698,119,720
Weighted average number of ordinary shares used in calculating diluted earnings per share 698,119,720 698,119,720
CENTS CENTS
Basic earnings per share (12.44) 5.86
Diluted earnings per share (12.44) 5.86
23. DISCONTINUING AND DISCONTINUED OPERATIONSDescription
The Company has resolved to divest of its subsidiary Cue Resources Inc during the 2016 financial year which holds the interest in the Pine Mills production property in East Texas and the Pine Mills asset is held for sale (refer note 16). Cue intends to focus on core business in South East Asia and Australasia.
On 20 November 2014 the consolidated entity sold Cue PNG Oil Company Pty Ltd (incorporated in Australia), a subsidiary of Cue Energy Resources Limited, for consideration of USD7.03 million (AUD8.5 million) resulting in a profit on disposal before income tax restated to $8.67 million. Whilst Cue PNG Oil Company Pty Ltd was sufficiently profitable up to the date of sale, future losses were projected due to reduced production and expected exploration expenditure.
FInAn
CIAl
STA
TEm
EnTS
73
For
per
sona
l use
onl
y

NOTES TO THE FINANCIAL STATEMENTS (Cont’) FOR THE FINANCIAL YEAR ENDED 30 JUNE 2016
23. DISCONTINUING AND DISCONTINUED OPERATIONS (Cont’)Financial performance information
2016 $000’S
RESTATED 2015
$000’S
Production revenue 984 965
Foreign currency exchange gain 123 (6)
Other Income - 27
Total revenue 1,107 986
Operating expense (2,720) (949)
Impairment expense (1,200) -
E&E expenditure - -
Amortisation expense (175) (30)
Total expenses (4,095) (979)
(Loss)/profit before income tax expense (2,988) 7
Income tax expense/benefit (74) 70
(Loss)/profit after income tax expense from discontinued operations (3,062) 77
Profit on disposal before income tax - 8,677
Income tax expense - -
Profit on disposal after income tax - 8,677
(Loss)/profit after income tax expense from discontinued operations (3,062) 8,754
Carrying amounts of assets and liabilities being disposed/disposed
RESTATED 2015
$000’S
Production income receivables 126
Inventories -
Deferred tax asset 71
Exploration permits -
Production properties 553
Total assets 750
Trade and other payables (69)
Abandonment provision (1,083)
Total liabilities (1,152)
Net assets (402)CUE
ENER
GY R
ESOU
RCES
LIM
ITED:
ANN
UAL R
EPOR
T 201
5/16
74
For
per
sona
l use
onl
y

NOTES TO THE FINANCIAL STATEMENTS (Cont’) FOR THE FINANCIAL YEAR ENDED 30 JUNE 2016
The net cash flows of the discontinuing operation, which is not incorporated into the statement of cash flows, are as follows:
2016 $000’S
2015 $000’S
Net cash inflow/(outflow) from operating activities (2,239) 26
Net cash inflow from investing activities (173) -
Net cash (outflow)/inflow from financing activities 2,232 -
Net increase in cash generated by the discontinuing operation (180) 26
Details of the Cue PNG Oil Company Pty Ltd disposal
2016 $000’S
2015 $000’S
Total sale consideration - 8,536
Carrying amount of net assets disposed - 402
Disposal costs - (261)
Profit on disposal before tax income - 8,677
Income tax expense - -
Profit on disposal after income tax - 8,677
FInAn
CIAl
STA
TEm
EnTS
75
For
per
sona
l use
onl
y

NOTES TO THE FINANCIAL STATEMENTS (Cont’) FOR THE FINANCIAL YEAR ENDED 30 JUNE 2016
24. FINANCIAL REPORTING BY SEGMENTS Segment Information
AASB 8 requires operating segments to be identified on the basis of internal reports about components of the Group that are regularly reviewed and used by the Board of Directors (who are identified as the Chief Operating Decision Makers (“CODM”)) in assessing performance and in determining the allocation of resources.
The CODM assesses the performance of the operating segments based upon a measure of earnings before interest expense, tax, depreciation and amortisation. The accounting policies adopted for internal reporting to the CODM are consistent with those adopted in the Group financial statements.
The principal business of the group is the production and exploration for hydrocarbons in Australia, New Zealand, Indonesia and USA. The Board considers the business from both a product and geographic perspective and has identified four reportable segments. Information regarding the Group’s reportable segments is presented below:
2016AUSTRALIA
$000’SNZ
$000’SINDONESIA
$000’SUSA*
$000’STOTAL
$000’S
Gas Revenue from continuing operations - - 27,354 - 27,354
Oil Revenue from continuing operations - 13,091 4,967 - 18,058
Production Revenue from continuing operations - 13,091 32,321 - 45,412
Production Revenue from discontinuing oil operations - - - 984 984
Production Revenue - 13,091 32,321 984 46,396
Production Expenses - (6,608) (13,045) (2,720) (22,373)
Gross Profit - 6,483 19,276 (1,736) 24,023
Other revenue 60 3,720 - 123 3,903
Impairment - production - (25,103) - - (25,103)
Impairment – E&E - (3,921) (46,042) - (49,963)
Foreign exchange movement (90) - - - (90)
Earnings before interest expense, tax, depreciation and amortisation (9,289) (22,907) (36,438) (2,811) (71,445)
2015AUSTRALIA
$000’SNZ
$000’SINDONESIA
$000’SUSA*
$000’SPNG*
$000’STOTAL
$000’S
Gas Revenue from continuing operations - - 18,308 - - 18,308
Oil Revenue from continuing operations - 14,269 4,127 - - 18,396
Production Revenue from continuing operations - 14,269 22,435 - - 36,704
Production Revenue from discontinuing oil operations - - - 221 745 966
Production Revenue - 14,269 22,435 221 745 37,670
Production Expenses - (4,010) (8,978) (437) (515) (13,940)
Gross Profit - 10,259 13,457 (216) 230 23,730
Other revenue 107 - 36,022 27 8,677 44,833
Impairment - production - (18,015) - - - (18,015)
Impairment – E&E - - - - - -
Foreign exchange movement 7,322 - (405) (1) - 6,916
Earnings before interest expense, tax, depreciation and amortisation (3,685) (8,329) 49,778 (195) 8,908 46,477
CUE
ENER
GY R
ESOU
RCES
LIM
ITED:
ANN
UAL R
EPOR
T 201
5/16
76
For
per
sona
l use
onl
y

NOTES TO THE FINANCIAL STATEMENTS (Cont’) FOR THE FINANCIAL YEAR ENDED 30 JUNE 2016
AUSTRALIA $000’S
NZ $000’S
INDONESIA $000’S
USA $000’S
TOTAL $000’S
TOTAL SEGMENT ASSETS
Current Assets 16,588 1,911 8,081 4,095 30,675
Non-current Assets 59 32,629 9,935 - 42,623
Total 30 June 2016 Assets 16,647 34,540 18,016 4,095 73,298
Current Assets 26,329 1,619 7,682 464 36,094
Non-current Assets 76 65,053 60,784 3,993 129,906
Total 30 June 2015 Assets 26,405 66,671 68,466 4,458 166,000
TOTAL SEGMENT LIABILITIES
Current Liabilities 1,323 1,209 9,023 2,017 13,572
Non-current Liabilities 31 12,421 4,685 - 17,137
Total 30 June 2016 Liabilities 1,354 13,630 13,708 2,017 30,709
Current Liabilities 1,947 4,593 8,948 1,612 17,100
Non-current liabilities 96 14,149 2,982 - 17,227
Total 30 June 2015 Liabilities 2,043 18,742 11,930 1,612 34,327
* discontinuing/discontinued operations
Major CustomersThe Group has a number of customers to whom it provides both oil and gas products. The Group supplies a single external customer in the gas segment who accounts for 100% of external gas revenue (2015: 100%).
Reconciliation of earnings before interest expense, tax, depreciation and amortisation (EBITDA) to Profit before Income Tax:
2016 $000’S
2015 $000’S
EBITDA (71,445) 46,477
Depreciation (34) (49)
Amortisation (11,107) (10,828)
(Loss)/profit before income tax expense (82,586) 35,600
includes discontinued operations
25. SHARE BASED PAYMENTSNo performance rights were outstanding as at 30 June 2016.
FInAn
CIAl
STA
TEm
EnTS
77
For
per
sona
l use
onl
y

NOTES TO THE FINANCIAL STATEMENTS (Cont’) FOR THE FINANCIAL YEAR ENDED 30 JUNE 2016
26. KEY MANAGEMENT PERSONNEL AND RELATED PARTY DISCLOSURES Total remuneration payments and equity issued to Directors and key management personnel are summarised below. Elements of Directors and executives remuneration includes:
• Short term employment benefits, including superannuation, non-monetary benefits and consultancy fees
• Post employment benefits – superannuation
• Long term employee benefits
CONSOLIDATED ENTITY
2016 $
2015 $
Short term employment benefits (including non-monetary benefits) 1,624,461 1,621,921
Cash bonuses 427,624 171,136
Consulting fees 167,043 -
2,219,128 1,793,057
Long term benefits 18,675 6,612
Post employment benefits 105,164 156,040
Termination payments 76,173 105,000
Total employee benefits 2,419,140 2,060,709
Consolidated EntitiesDetails of controlled entities are shown in note 11.
Advances to/(from) controlled entities from/to Cue Energy Resources Limited, net of provisions for impairment, at the reporting date are as follows:
2015 $
MOVEMENT $
2016 $
Cue Exploration Pty Ltd 8,877,521 2,689,337 11,566,858
Cue (Ashmore Cartier) Pty Ltd (2,226,329) - (2,226,329)
Cue Resources, Inc 2,997,629 2,332,111 5,329,740
Cue Mahakam Hilir Pty Ltd 26,141,923 9,413,652 35,555,575
Cue Sampang Pty Ltd 7,754,247 (14,792,285) (7,038,038)
Cue Mahato Pty Ltd 5,380,786 29,060 5,409,846
Cue Taranaki Pty Ltd 32,823,362 1,758,832 34,582,194
Total 81,749,139 1,430,707 83,179,846
Repayment of amounts owing to the Company as at 30 June 2016 and all future debts due to the Company, by the controlled entities are subordinated in favour of all other creditors. Cue Energy has agreed to provide sufficient financial assistance to the controlled entities as and when it is needed to enable the controlled entities to continue operations.
The parent company provides management, administration and accounting services to the subsidiaries. Management fees of $1,565,065 (2015: $3,714,214) were charged by the parent company to Cue Taranaki Pty Ltd.
The ultimate parent company is New Zealand Oil and Gas Limited, a company incorporated in New Zealand.
CUE
ENER
GY R
ESOU
RCES
LIM
ITED:
ANN
UAL R
EPOR
T 201
5/16
78
For
per
sona
l use
onl
y

NOTES TO THE FINANCIAL STATEMENTS (Cont’) FOR THE FINANCIAL YEAR ENDED 30 JUNE 2016
27. NOTES TO THE STATEMENT OF CASH FLOWSCONSOLIDATED ENTITY
2016 $000’S
RESTATED 2015
$000’S
(a) Reconciliation of operating profit to net cash flows from operating activities:
Reported profit/(loss) after tax (87,460) 40,945
Impact of changes in working capital items
Increase/(decrease) in assets 2,060 (18,227)
(Increase)/decrease in liabilities 16 (11,564)
Items not involving cash flows
Production property write down 26,303 18,015
Exploration impairments 49,990 2,099
Depreciation 34 49
Amortisation 11,107 10,828
Gain on purchase of assets - (36,022)
Profit on sale of assets - (8,677)
Net gain on foreign currency conversion (939) (9,778)
Decrease net cash flows from operating activities 1,111 (12,332)
(b) Cash comprises cash balances held in Australia and foreign currencies, principally US dollars, within Australia and overseas:
Australia 16,501 26,197
New Zealand 495 384
Indonesia 3,413 763
USA 81 261
Cash Flow Statement cash balance 20,490 27,605
FInAn
CIAl
STA
TEm
EnTS
79
For
per
sona
l use
onl
y

NOTES TO THE FINANCIAL STATEMENTS (Cont’) FOR THE FINANCIAL YEAR ENDED 30 JUNE 2016
28. PARENT ENTITY INFORMATIONPARENT ENTITY
2016 $000’S
2015 $000’S
Information relating to Cue Energy Resources Limited:
Financial position
Current assets 20,510 27,369
Non-current assets 22,847 82,411
Total assets 43,357 109,780
Current liabilities 1,293 1,798
Non-current liabilities 31 96
Total liabilities 1,324 1,894
Net assets 42,033 107,886
Contributed equity 152,416 152,416
Reserves - -
Accumulated losses (110,383) (44,530)
Net assets 42,033 107,886
Financial performance
Profit/(loss) for the year (65,854) 7,441
Total comprehensive income (loss)/profit for the year (65,854) 7,441
Capital Commitments
The parent entity has no commitments for the acquisition of capital assets as at 30 June 2016 (2015: nil).
Leases Commitments
The parent entity has no commitments in relation to leases as at 30 June 2016 other than disclosed in note 20.
The parent entity has no contingent assets.
29. CONTINGENT LIABILITIES & ASSETS Contingent Liabilities
As a result of an economic project arrangement in the Jeruk field within the Sampang PSC, Indonesia, Cue may in certain circumstances have an obligation to reimburse certain monies spent by the incoming party from future profit oil within the Sampang PSC. There is a dispute between Cue and the incoming party as to the quantum of monies that they may be entitled to claim by way of such reimbursement and when any such reimbursement would be payable. The Company is of the view that any amount which might eventually become payable would not be likely to exceed the amount of USD4.5 million (AUD 6.1 million) which has been provided for in the accounts. Claims made by the incoming party are yet to be settled and hence there is still significant judgement and estimation in relation to these legal claims.
Contingent Assets
The Group has no contingent assets.
CUE
ENER
GY R
ESOU
RCES
LIM
ITED:
ANN
UAL R
EPOR
T 201
5/16
80
For
per
sona
l use
onl
y

Independent Auditor’s Report
InDE
PEnD
EnT A
uDITO
R'S
REPO
RT
81
For
per
sona
l use
onl
y

CUE
ENER
GY R
ESOU
RCES
LIM
ITED:
ANN
UAL R
EPOR
T 201
5/16
82
For
per
sona
l use
onl
y
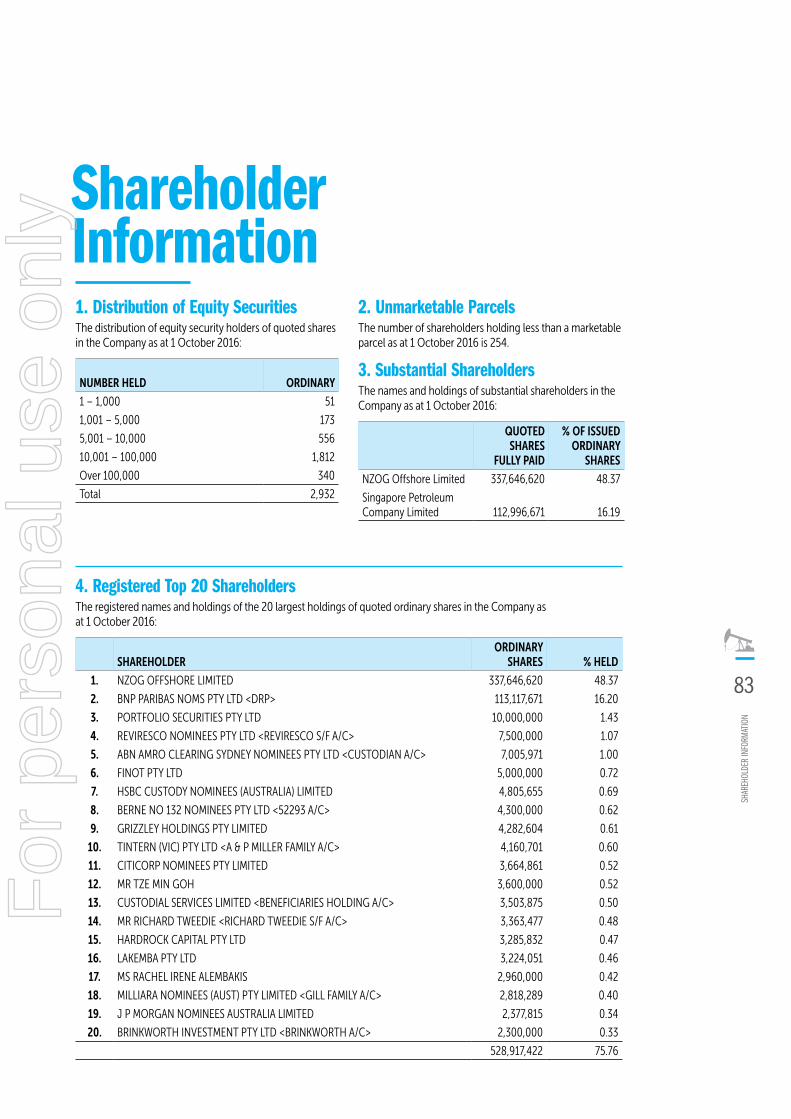
Shareholder Information1. Distribution of Equity SecuritiesThe distribution of equity security holders of quoted shares in the Company as at 1 October 2016:
NUMBER HELD ORDINARY
1 – 1,000 51
1,001 – 5,000 173
5,001 – 10,000 556
10,001 – 100,000 1,812
Over 100,000 340
Total 2,932
2. Unmarketable Parcels The number of shareholders holding less than a marketable parcel as at 1 October 2016 is 254.
3. Substantial ShareholdersThe names and holdings of substantial shareholders in the Company as at 1 October 2016:
QUOTED SHARES
FULLY PAID
% OF ISSUED ORDINARY
SHARES
NZOG Offshore Limited 337,646,620 48.37
Singapore Petroleum Company Limited 112,996,671 16.19
4. Registered Top 20 ShareholdersThe registered names and holdings of the 20 largest holdings of quoted ordinary shares in the Company as at 1 October 2016:
SHAREHOLDERORDINARY
SHARES % HELD
1. NZOG OFFSHORE LIMITED 337,646,620 48.37
2. BNP PARIBAS NOMS PTY LTD <DRP> 113,117,671 16.20
3. PORTFOLIO SECURITIES PTY LTD 10,000,000 1.43
4. REVIRESCO NOMINEES PTY LTD <REVIRESCO S/F A/C> 7,500,000 1.07
5. ABN AMRO CLEARING SYDNEY NOMINEES PTY LTD <CUSTODIAN A/C> 7,005,971 1.00
6. FINOT PTY LTD 5,000,000 0.72
7. HSBC CUSTODY NOMINEES (AUSTRALIA) LIMITED 4,805,655 0.69
8. BERNE NO 132 NOMINEES PTY LTD <52293 A/C> 4,300,000 0.62
9. GRIZZLEY HOLDINGS PTY LIMITED 4,282,604 0.61
10. TINTERN (VIC) PTY LTD <A & P MILLER FAMILY A/C> 4,160,701 0.60
11. CITICORP NOMINEES PTY LIMITED 3,664,861 0.52
12. MR TZE MIN GOH 3,600,000 0.52
13. CUSTODIAL SERVICES LIMITED <BENEFICIARIES HOLDING A/C> 3,503,875 0.50
14. MR RICHARD TWEEDIE <RICHARD TWEEDIE S/F A/C> 3,363,477 0.48
15. HARDROCK CAPITAL PTY LTD 3,285,832 0.47
16. LAKEMBA PTY LTD 3,224,051 0.46
17. MS RACHEL IRENE ALEMBAKIS 2,960,000 0.42
18. MILLIARA NOMINEES (AUST) PTY LIMITED <GILL FAMILY A/C> 2,818,289 0.40
19. J P MORGAN NOMINEES AUSTRALIA LIMITED 2,377,815 0.34
20. BRINKWORTH INVESTMENT PTY LTD <BRINKWORTH A/C> 2,300,000 0.33
528,917,422 75.76
ShAR
EhOl
DER
InFO
RmAT
IOn
83
For
per
sona
l use
onl
y

5. HoldersThe number of holders of each class of equity securities as at 1 October 2016 was:
CLASS OF SECURITY NUMBER
Ordinary Fully Paid Shares 2,932
6. Vendor SecuritiesThere are no restricted securities on issue as at 1 October 2016.
7. Voting RightsAt meeting of members or classes of members:
(a) each member entitled to vote may vote in person or by proxy, attorney or representative;
(b) on a show of hands, every person present who is a member or a proxy, attorney or representative of a member has one vote; and
(c) on a poll, every person present who is a member or a proxy, attorney or representative of a member has:
(i) for each fully paid share held by person, or in respect of which he/she is appointed a proxy, attorney or representative, one vote for the share;
(ii) for each partly paid share, only the fraction of one vote which the amount paid (not credited) on the share bears to the total amounts paid and payable on the share (excluding amounts credited).
Subject to any rights or restrictions attached to any shares or class or classes of shares.
8. Annual General MeetingCue’s 2016 Annual General Meeting will be held at the ‘InterContinental Melbourne The Rialto, 495 Collins St, Melbourne VIC 3000, Victoria, Australia on Thursday 24th November 2016, commencing at 9.00am (AEDT).
9. Share registryEnquiriesCue’s share register is managed by Computershare. Please contact Computershare for all shareholding and dividend related enquiries.
Change of shareholder detailsShareholders should notify Computershare of any changes in shareholder details via the Computershare website (www.computershare.com.au) or writing (fax, email, mail). Examples of such changes include:
• Registered name
• Registered address
• Direct credit payment details
Computershare Investor Services Pty LtdGPO Box 2975Melbourne, Victoria 3001 AustraliaTelephone: 1300 850 505 (within Australia)or +61 3 9415 4000 (outside Australia)Facsimile: +61 3 9473 2500Email: [email protected]: www.computershare.com.au
10. SharecodesASX Share Code: CUE ADR Share Code: CUEYY
11. Cue Energy WebsiteA wide range of information on Cue Energy is available on the Company’s website, at www.cuenrg.com.au. The following information for investors is available:
• Share price information
• Annual reports
• Quarterly reports
• Press releases
CUE
ENER
GY R
ESOU
RCES
LIM
ITED:
ANN
UAL R
EPOR
T 201
5/16
84
For
per
sona
l use
onl
y

For
per
sona
l use
onl
y

Cue Energy ResourcesABN 45 066 383 971
Level 19, 357 Collins Street Melbourne Victoria 3000 Australia
Telephone: + 61 3 8610 4000 Facsimile: + 61 3 9614 2142 Website: www.cuenrg.com.au Email: [email protected]
For
per
sona
l use
onl
y