Embed Size (px)
Citation preview
WORKING PAPER
1750 Massachusetts Avenue, NW | Washington, DC 20036-1903 USA | 202.328.9000 Tel | 202.328.5432 Fax | www.piie.com
© Peterson Institute for International Economics. All rights reserved. This publication has been subjected to a prepublication peer review intended to ensure analytical quality.
The views expressed are those of the author. This publication is part of the overall program of the Peterson Institute for International Economics, as endorsed by its Board of Directors, but it does not neces-
sarily reflect the views of individual members of the Board or of the Institute’s staff or management. The Peterson Institute for International Economics is a private nonpartisan, nonprofit institution for rigorous,
intellectually open, and indepth study and discussion of international economic policy. Its purpose is to identify and analyze important issues to make globalization beneficial and sustainable for the people of the United States and the world, and then to develop and communicate practical new approaches for dealing with them. Its work is funded by a highly diverse group
of philanthropic foundations, private corporations, and interested individuals, as well as income on its capital fund. About 35 percent of the Institute’s resources in its latest fiscal year were provided by contributors from outside the United States.
A list of all financial supporters for the preceding six years is posted at https://piie.com/sites/default/files/supporters.pdf.
WP 17-2 Kicking a Crude Habit: Diversifying Away from Oil and Gas in the 21st CenturyCullen S. HendrixFebruary 2017
Abstract
This paper investigates the correlates of diversification away from oil and natural gas dependence in the context of the 21st century resource boom (and bust). In a sample of 40 oil- and gas-dependent economies, the majority showed significant sectoral diversification of GDP, but exports remained highly concentrated in fuel exports. Regression analysis indicates that countries that began the boom with higher levels of oil and gas dependence, poorer countries, and those with significantly larger- or smaller-than-average populations were more successful in diversifying their GDP during the commodities boom. Governance clearly matters—more effective, capable bureaucratic structures are associated with greater GDP diversification away from oil and gas—though the effects are not uniformly positive. For any given level of government effectiveness, stronger rule of law is associated with less GDP diversification. Education appears to affect GDP and export diversification differentially. Consistent with endogenous growth theory, countries with more educated populations saw greater growth in their nonresource sectors than countries with less educated populations, though education is associated with greater export concentration. Market proximity does not affect diversification. Internal economic diversification in the 21st century has been less a matter of correct policy formation and implementation and more a matter of factors that shape the policymaking environment, with the findings suggesting a difficult road to economic diversification for the Gulf Cooperation Council economies.
JEL Codes: E02, O10, O13, Q02, Q40Keywords: petroleum, diversification, education, rule of law, institutions, Gulf Cooperation Council
Cullen S. Hendrix, nonresident senior fellow at the Peterson Institute for International Economics, is associate professor at the Josef Korbel School of International Studies at the University of Denver.
2 3
1. INTRODUCTION
Since the 1970s, oil and gas production has enriched many countries but also made them dangerously dependent on these resources for export revenue and government finance. As a result, development experts have counseled such countries to diversify their economies and export bases.
Virtually all oil- and gas-rich countries are—and have been for decades—rhetorically committed to this goal, and have allocated significant resources to infant industry development and infrastructure projects to boost their economies. However, some—such as Nigeria, Qatar, and Russia—have been more successful than others.
This working paper examines the fortunes of 40 oil- and gas-dependent economies during the 21st century commodity boom and finds that in spite of oil and gas prices nearly trebling, a sizable majority (75 percent) of these countries saw oil and gas rents decrease as a share of GDP. Yet many oil- and gas-rich economies continue to rely very heavily on these resources for export revenue.
Regression analysis reveals that preexisting levels of oil and gas dependence, population size, and per capita incomes are significant covariates of economic diversification: initially resource-dependent, smaller- and larger-than-average, and poorer countries are more successful at diversifying GDP. Political/institutional factors affect diversification in cross-cutting ways, while education correlates with diversification of GDP away from oil and gas but greater export concentration. Regarding export diversification, these structural/political/institutional models perform more poorly. The explanatory power of structural/political/institutional factors implies that domestic diversification in the 21st century has been less a matter of correct policy formation and implementation and more a matter of factors that shape the policymaking environment, and implies a tough road ahead for already wealthy exporting countries.
The paper proceeds as follows. Section 2 briefly reviews the 21st century commodity boom and bust before a discussion in section 3 of the various economic and political rationales for diversifying away from dependence on oil and gas. Section 4 presents descriptive data for 40 oil- and gas-dependent economies and their success or failure at diver-sifying both their GDP and exports. Section 5 outlines theoretical priors regarding the expected covariates of economic diversification, followed by the data, estimation, and results in section 6. Section 7 discusses the sectors into which diversification has occurred. Section 8 discusses the paper’s overall results and their implications for the economies of the Gulf Cooperation Council (GCC). Section 9 concludes.
2. THE 21ST CENTURY COMMODITIES BOOM—AND BUST
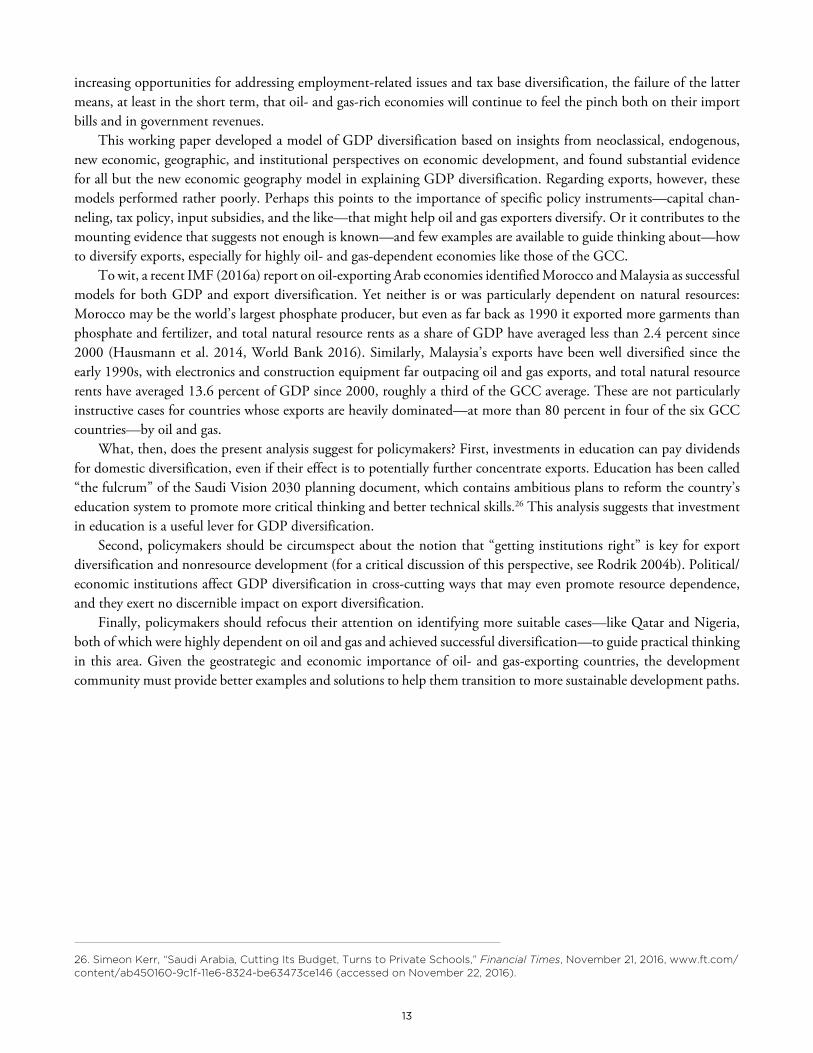
After bottoming out in the late 1990s, crude oil and natural gas prices embarked on a nearly 15-year rally, culminating in 2011–13 with the highest prices observed in the post–World War II era (figure 1). Across the world’s 40 oil- and gas-dependent economies,1 GDPs expanded, government coffers overflowed, budgets ballooned, and some exporters—notably Russia and Iran—flexed their oil-engorged muscles with more aggressive foreign policies (Hendrix and Noland 2014, Hendrix 2015). Oil-rich but conflict-plagued Angola went from one of Africa’s poorest countries to upper-middle income status, and Qatar—an oil-rich desert nation with a population of fewer than 3 million—beat out the United States to host the 2022 World Cup, due in no small part to promises of massive oil- and gas-fueled investments in infrastructure and stadium development.
In October 2014, that rally came to an abrupt end. Since then, crude prices have more than halved from their peak in 2011, and oil exporters are feeling the pain to various extents. Saudi Arabia went from a 30 percent budget surplus in 2008 to a 15 percent deficit in 2015, although massive foreign reserves have so far meant its population has been spared
1. Countries for which oil and gas rents were at least 5 percent of GDP in either 2002–04, or 2012–14, per World Bank (2016). 2002-04 corresponds to the early years of the commodity boom. This measure excludes large oil producers like Canada and the United States from the sample because their absolute production volumes are still only a comparatively small share of GDP in those countries.
2 3
significant hardship.2 The same cannot be said of Venezuela, where oil prices have led to a severe two-year economic contraction that is causing food shortages and fueling large protests against President Nicolás Maduro.
Despite the somewhat surprising November 30, 2016, agreement by the Organization of Petroleum Exporting Countries (OPEC) and other major exporters, including Russia, to cut production, it is far from clear whether OPEC retains the power to move prices in the current production environment.3 With the development of Canadian and US shale, Iran’s return to Western markets, and the host of smaller, new exporters that emerged in the early 2000s boom, oil and gas markets are likely less sensitive to OPEC announcements than in the past, although they remain susceptible to supply-side shocks related to political instability in oil-exporting countries (Arezki and Blanchard 2014).
The drop in oil and gas prices has refocused attention on how exporters of these resources can transition to more diversified, resilient economies. This question is of obvious policy import. Commodity price-driven boom-and-bust cycles complicate macroeconomic and budgetary planning. Many oil and gas exporters are seeing domestic demand rise faster than production, pointing to a future in which these resources can no longer form the basis of the country’s export economy. Yet surprisingly little is known about the structural and institutional factors that facilitate or inhibit diversification.
Discussions of economic diversification tend to focus more on capital channeling, input subsidies, infrastructure development, and tax policies—the basics of industrial policy—than on structural or institutional factors that might affect whether these policy levers are effective in changing the sectoral composition of the economy (Noland and Pack 2003, Rodrik 2004a). For instance, South Korea and Taiwan are often held up as evidence of successful industrial policy, but their policies were likely successful in part because of the confluence of low per capita incomes and compara-tively high quality human capital stock that implied high latent returns to investment (Rodrik, Grossman, and Norman 1995). Given that the resource curse—the tendency for resource-dependent economies to experience worse economic outcomes and more authoritarian and conflict-prone politics—has been found to operate less through specific policy channels and more via the corrosive effect of natural resource dependence on political and economic institutions, this oversight is somewhat curious (Robinson, Torvik, and Verdier 2006).
3. THE DESIRE TO DIVERSIFY
Virtually all oil- and gas-rich countries are—and have been for decades—rhetorically committed to reducing their dependence on oil and gas. A desire to diversify has been a central goal of successive Saudi economic plans since the release of the First Five-Year Plan in 19704; in 2016, Saudi deputy crown prince Mohammad bin Salman announced an ambitious, $72 billion plan (on top of an estimated $2 trillion in infrastructure investment) for a National Transformation Program that includes privatization of state-owned enterprises, increased public-private partnerships, and even heretofore unheard of consumption taxes.5 Similar ambitions can be found in official planning documents from Republic of Congo, Libya, and others.
The reasons are several. The first and most obvious is the boom-and-bust nature of oil and gas revenues, which are determined largely by global prices that are increasingly out of the hands of any actor—or subset of actors—to manage. As prices fluctuate, there are concomitant effects for export revenues and government finance. For most oil exporters, oil prices are essentially the only important determinants of the relative prices of their exports and imports, with net terms of trade correlating quite strongly (r > 0.95) with crude oil prices. Similarly, government revenues in oil-dependent states can vary widely based on prevailing market prices. In Bahrain, total government revenue grew by
2. “Saudi Arabia Government Budget,” Trading Economics, www.tradingeconomics.com/saudi-arabia/government-budget (ac-cessed on November 16, 2016).
3. “OPEC Confounds Skeptics, Agrees to First Cuts in 8 Years,” Bloomberg Markets November 30, 2016, https://www.bloom-berg.com/news/articles/2016-11-30/opec-said-to-agree-oil-production-cuts-as-saudis-soften-on-iran (accessed on January 30, 2017).
4. Development Plan, 1390 A.H. (Riyadh: Central Planning Organization, 1970).
5. Nasser Saidi, “Saudi Arabia’s Shock Therapy,” Project Syndicate, September 27, 2016, www.project-syndicate.org/commen-tary/saudi-economic-diversification-plan-by-nasser-saidi-2016-09 (accessed on October 17, 2016).
4 5
18.8 percent on the strength of a 29 percent jump in global crude prices in 2008 only to fall by 27 percent the next year after oil prices fell by a third (World Bank 2016, BP 2016). A more diversified economy implies more diversified exports and a more diverse tax base less susceptible to the vagaries of international commodity markets.
Second, due a combination of economic development, lavish consumer fuel subsidies, and rapid population growth, many oil- and gas-rich countries have seen domestic consumption rise much faster than total production (Ross, Hazlett, and Mahdavi 2017). Saudi Arabia’s domestic consumption was 13 percent of total production in 1992; by 2015 the share had increased to nearly a third (32 percent) despite a similarly sized increase (32 percent) in total production (BP 2016). It has even been suggested that Saudi Arabia—long the world’s largest exporter in total volume—may become a net importer in the next 15 years (Lahn and Stevens 2011).
In fact, exporters, especially in the food and manufactures import-dependent Arabian Peninsula, are at increasing peril of “eating their seed corn,” or consuming the product whose export is the centerpiece of the economy. Given that the aforementioned subsidies are almost entirely financed by government revenues derived from oil exports, this situation will become increasingly untenable over time, especially if the current low prices prevail over the near and medium term.
Third, oil- and gas-led development does not provide sufficient job opportunities to meet the demands of many oil-exporting countries’ growing—and youth-laden—populations. The oil and gas sector tends to employ comparatively small, often imported labor forces. While oil and gas wealth may facilitate the development of energy-intensive indus-tries like aluminum smelting, these linked industries are usually capital-intensive and do not employ many workers. For oil exporters in regions with large youth bulges, like Africa and the Middle East, a failure to provide meaningful opportunities to work and support families has been and will continue to be met with social unrest, radicalization, and often heavy-handed government responses (Urdal 2006, Nordås and Davenport 2013). Low prices and declining revenues will leave oil- and gas-exporting countries with fewer sticks and carrots to pacify restive populations. As ongoing conflicts in Libya and Syria make clear, the confluence of oil and gas dependence and minimal employment prospects for young people is a combustible mix. A long-term solution to the problems of youth unemployment and lack of opportunity will require growing the nonresource economy.
4. DIVERSIFICATION IN THE EARLY 21ST CENTURY
How successful have oil- and gas-dependent economies been at diversifying in the 21st century? The news is mixed: while oil- and gas-rich economies have been more uniformly successful in diversifying the sectoral composition of their economies, exports—and thus terms of trade and export revenue—remain stubbornly concentrated.
This working paper analyzes diversification from two perspectives: oil and gas rents as a share of GDP, which measures the relative size of the resource and nonresource sectors, and fuel exports as a share of total merchandise exports, which measures export concentration. The rents variables represent the value of the extracted resources net of production costs. Because the values are calculated using constant dollar exchange rates, the rents variable is most useful for making within-country comparisons over time.6
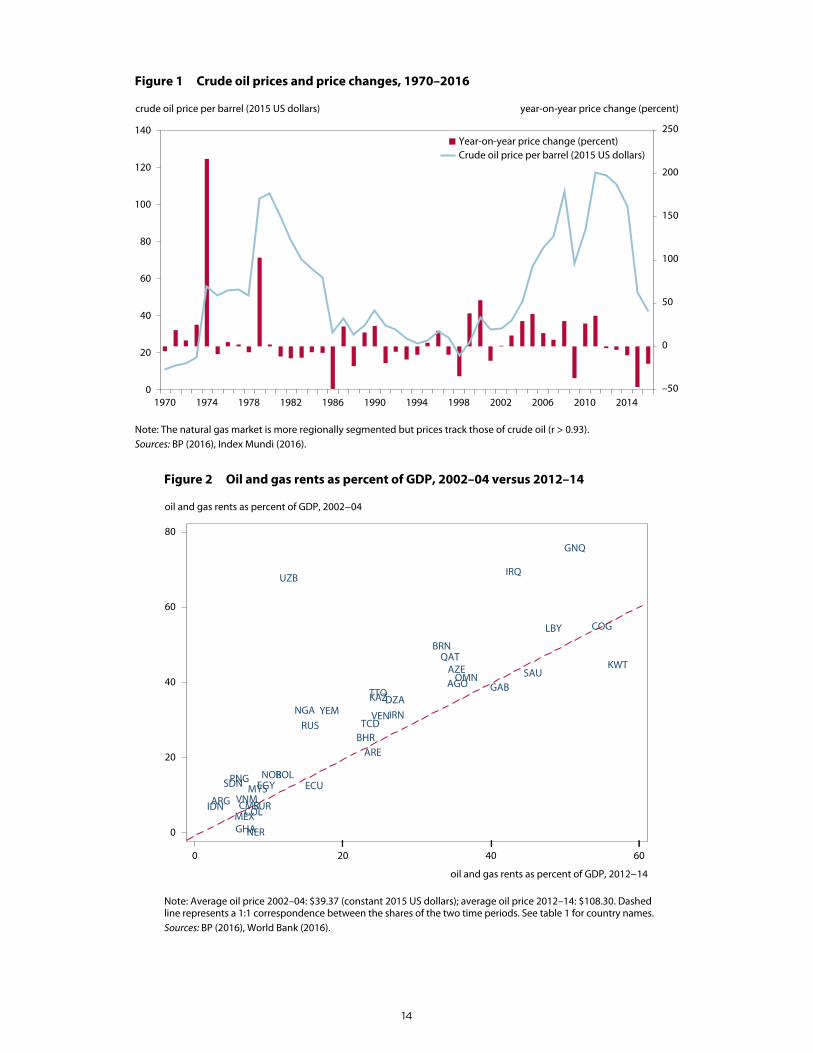
In 2002–04 oil and gas rents accounted for an average of 28.7 percent of GDP in the 40 countries for which oil and gas rents were at least 5 percent of GDP.7 By 2012–14 that share had decreased to 22.3 percent. Figure 2 plots the 40
6. Quoting the World Bank (2011, 24) study from which the data were derived at length: “Throughout the book [The Changing Wealth of Nations], all wealth figures are reported in constant 2005 US dollar prices. It is important to keep in mind that when we compare wealth across countries, we are using nominal market exchange rates. Because of this, wealth does not reflect the purchasing power of the income generated by wealth in a given country. To get an idea of the purchasing power of wealth, we would have to use purchasing power parity (PPP) exchange rates, which are often used to compare GDP across countries. Consequently, the wealth accounts are most appropriate for making comparisons across broad income groups and for looking at a country’s wealth over time—its volume and composition—but are less useful for making comparisons between individual countries” (emphasis added).
7. In either 2002–04 or 2012–14. The countries included in the analysis are Algeria, Angola, Argentina, Azerbaijan, Bahrain, Bolivia, Brunei Darussalam, Cameroon, Chad, Colombia, Republic of Congo, Ecuador, Egypt, Equatorial Guinea, Gabon, Ghana, Indonesia, Iran, Iraq, Kazakhstan, Kuwait, Libya, Malaysia, Mexico, Niger, Nigeria, Norway, Oman, Papua New Guinea, Qatar, Russia, Saudi Arabia, Sudan, Suriname, Trinidad and Tobago, United Arab Emirates, Uzbekistan, Venezuela, Vietnam, and Yemen. These 40 countries account for 83.4 percent of global oil reserves and 77.0 percent of natural gas reserves (CIA 2016).
4 5
countries according to oil and gas shares of GDP during the two periods. Any diversification during a commodity boom is the equivalent of swimming upstream: as commodity prices increase, a given export quantity (whether measured in barrels, tonnes, or millions of British thermal units, MMBTU) will mechanically translate into a larger contribution to GDP or share of exports.
Among the 40 countries are some obvious cases that defy standard economic analysis: Chad didn’t begin exporting oil in any significant quantities until the opening of the Chad-Cameroon pipeline in 2003, and Ghana’s oil exports did not take off until the Jubilee offshore field began producing in 2010. For both, oil and gas as a share of GDP could only have increased. In Iraq, the 2003 US-led invasion and subsequent civil war resulted in massive contractions in the nonoil economy there. In other countries, diversification appears to have been driven by growth in the nonoil and gas economy. The more successful diversifiers include Uzbekistan (67.6 percent in 2002–04 vs. 12.4 percent in 2012–14), Nigeria (32.4 percent vs. 14.5 percent), and even Russia (28.4 percent vs. 15.3 percent; see table 1). Fully 75 percent of the countries in the sample saw oil and gas shrink as a share of GDP.
In other cases, the deepening or continuance of oil and gas dependence is not attributable to brand new discoveries or other macro shocks and often counters stated policy goals. Kuwait, Saudi Arabia, and the United Arab Emirates all had higher oil and gas shares of GDP than in the early 2000s, as did Colombia and Ecuador.
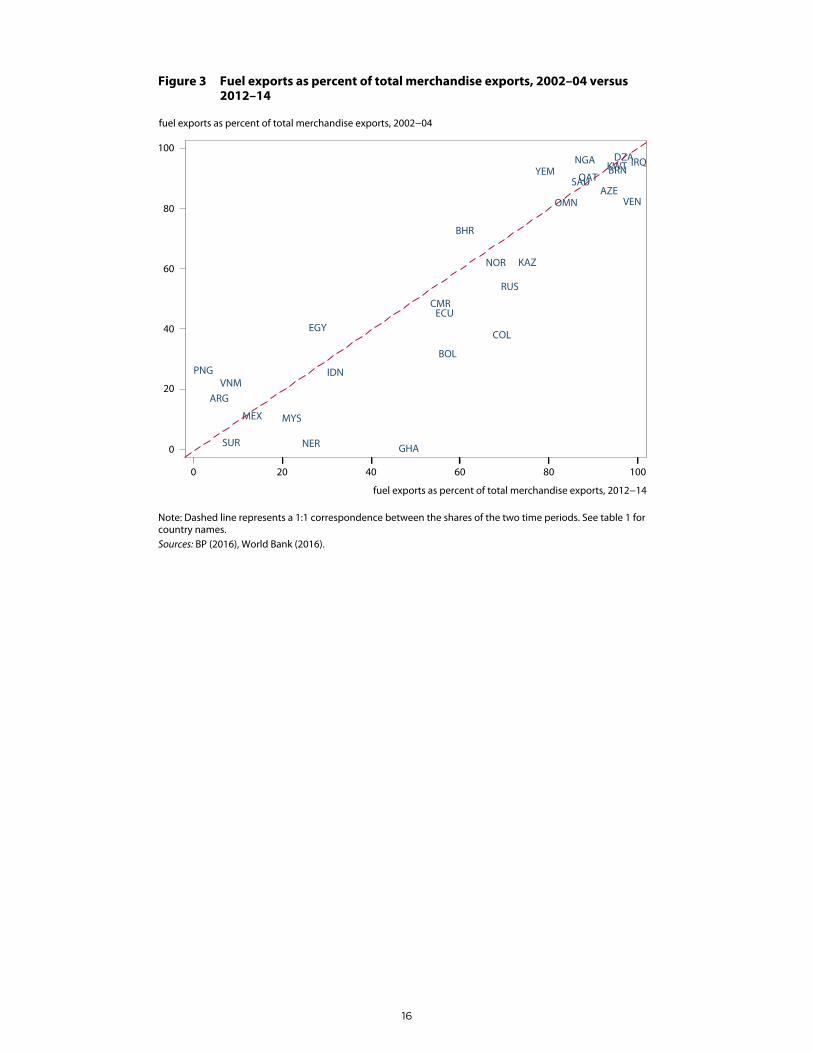
Diversification of GDP addresses some of the challenges associated with resource dependence—by enhancing employment opportunities and diversifying the potential tax base8—but does little to address issues arising from export price volatility and terms of trade shocks. Regarding export diversification, the record is even less positive: only a third (10 of the 29 for which data are available) of the economies saw fuel exports decline as a share of total merchandise exports (table 1 and figure 3). Among the export diversifiers are Papua New Guinea,9 Vietnam, Yemen, and Egypt. Fuel exports as a share of total merchandise exports rose substantially in Ghana and Niger—as would be expected, given their new exporter status—but also in established exporters such as Bolivia, Colombia, and, to a somewhat lesser extent, Russia and Venezuela.
Nine countries saw declines in both oil and gas rents as a share of GDP and fuel exports as a share of total merchan-dise exports during the boom: Algeria, Argentina, Bahrain, Egypt, Nigeria, Papua New Guinea, Qatar, Vietnam, and Yemen. This is a diverse set of countries, ranging from comparatively poor (Nigeria, Papua New Guinea, and Yemen) to wealthy (Qatar), and from small (Bahrain, Qatar) to quite populous (Egypt, Nigeria, Vietnam).
5. WHO DIVERSIFIES?
The theoretical priors regarding GDP diversification are guided by insights from several theories in the economic growth literature. The basic logic is that explaining economic diversification at the level of the national economy (i.e., of GDP) is less about specific policy tools to stimulate a different basket of exports and more about factors that may affect growth in the nonresource sector(s).
The first theory concerns standard neoclassical growth. It suggests that countries that started the boom with smaller nonresource sectors and at lower levels of economic development should see their nonresource economies grow more quickly. This is a simple implication of the convergence hypothesis (Mankiw, Romer, and Weil 1992). The effect of population is potentially important but theoretically ambiguous, as a larger population equates to a larger potential endowment of labor—and thus greater returns to capital—but also higher aggregate consumption levels and lower savings (Kuznets 1960).
8. At least in theory. In oil states, “no taxation without representation” may be recast as “no taxation, no representation.” Governments that are reliant on their citizens for revenue have general incentives to defer to those citizens’ preferences in policy and in process. In contrast, the existence of a plentiful, valuable natural resource base (particularly oil) generates sub-stantial revenue and thus exerts downward pressure on tax levels, as governments are able to finance themselves through the monopolization of these industries, obviating the need for high levels of taxation. As a result, their populations do not have this source of leverage with which to bargain for a greater say in governing; the “fiscal contract” linking government behavior to citizens’ policy preferences is absent. See Hendrix and Noland (2014).
9. According to this measure; Papua New Guinea remains, however, very dependent on other extractive exports: gold and copper, as well as oil and natural gas.
6 7
The second is endogenous growth theory, which places more weight on levels of human capital (Romer 1986, Barro 2001). Countries with more educated populations should experience more rapid growth in the nonresource sector.10
The third theoretical tradition, that of new economic geography, highlights the importance of proximity to markets and market size for export potential and economic development (Gallup, Sachs, and Mellinger 1999; Redding and Venables 2004). According to this perspective, countries that are closer to larger, more potentially lucrative export markets should experience more rapid growth in the nonresource sector (Parteka and Tamberi 2013).
According to the fourth theoretical tradition, the institutionalist strain, growth should occur when and where the political and economic institutions facilitate productive investment. Growth in the nonresource sector should be higher in economies where the policy environment is more stable, government bureaucracies are more efficacious and insulated from political pressures, and rule of law obtains (Evans and Rauch 1999; Rodrik, Subramanian, and Trebbi 2004; Haggard and Tiede 2011).
Finally, the literature on the economic effects of armed conflict suggests that highly violent contexts result in greater commodity dependence, as conflict often scares off investment in the nonresource sector (Brunnschweiler and Bulte 2009).11 Conflict particularly affects growth in resource-dependent economies, which tend to experience more armed conflict and political instability, though the specific location of resources and other contextual factors—like inequali-ties across ethnic groups and social spending—can amplify or mitigate this relationship (Lujala 2010, Basedau and Pierskalla 2014, Bodea, Higashijima and Singh 2016).
Note that these various theoretical traditions are policy agnostic: they simply pertain to the structural or political/institutional factors that might promote or inhibit the growth of the nonresource economy.
6. DATA, ESTIMATION, AND RESULTS
These conjectures are investigated via multiple regression with robust standard errors and robust regression. Particularly influential cases (as identified by Cook’s distance) are excluded from the analysis. All data are from the World Development Indicators.12
The core dependent variable is the change in oil and gas rents as a share of GDP from 2002–04 to 2012–14, which has a mean of −6.4 and a standard deviation of 11.3, and which ranges from −55.2 (Uzbekistan) to 12.2 (Kuwait). Secondarily, models are estimated using the change in fuel exports as a share of total merchandise exports, which has a mean of 4.7 and standard deviation of 15.2, and which ranges from −24.4 (Papua New Guinea) to 47.8 (Ghana).13
The key independent variables are as follows. Unless stated otherwise, all values are the three-year average for 2002–04—the early years of the boom—and are from the World Development Indicators:
n Oil and gas rents as a share of GDP proxies the relative size of the preexisting nonresource sector, with higher values corresponding to smaller nonresource economies at the outset of the boom.
n Natural log-transformed GDP per capita (constant 2010 USD) proxies preexisting levels of economic development.
n Natural log-transformed population proxies the country’s labor endowment.
10. There is some evidence that resource-dependent economies spend less on education and human capital formation (Gylfason 2001).
11. As the sample includes only countries for which oil and gas are a significant share of the economy, the broader relationships between natural resource dependence, economic development, governance institutions, and violence will not be investigated. For instance, there is evidence that oil- and gas-rich economies tend to have systematically weaker governance institutions and more political violence than they might otherwise, given their levels of economic development. For an extensive discus-sion, see Hendrix and Noland (2014).
12. Accessed using the wbopendata user-created module in Stata (Azevedo 2014).
13. This is simply (Oil and Gas Rents as % of GDP 2012–14) − (Oil and Gas Rents as % of GDP 2002–04).
6 7
n Average years of schooling for residents over 15 years of age proxies human capital stock. Data are from Barro and Lee (2013),14 averaged for the years 2000 and 2005.
n Natural log-transformed foreign market potential proxies geographic proximity to lucrative export markets. Data are from Mayer (2009). The values are generated by an augmented gravity model that includes not just distance and geographic contiguity but also common language, colonial links, common membership in regional free trade agreements and currency unions, and WTO membership to estimate potential market size for a country’s export goods. Data are averaged from 2002–03.
Proxies for the institutional environment and political violence are from the Worldwide Governance Indicators and capture different aspects of governance that have been found to affect both economic development and general policy formation.15 Each variable aggregates many different measures of the core concept of interest—such as government effectiveness or rule of law—to come up with a composite indicator. By construction, the variables have a mean of zero and a standard deviation of one, though in this sample the means are systematically lower, in part because of the pernicious effects of natural resource wealth on governance institutions and political violence.
After iterative exploratory modeling, three of the six composite measures are used:
n Government effectiveness, which reflects “perceptions of the quality of public services, the quality of the civil service and the degree of its independence from political pressures, the quality of policy formulation and implementation, and the credibility of the government’s commitment to such policies” (Kaufmann, Kraay, and Mastruzzi 2011, 4). The variable has a mean of −0.4 and ranges from −1.7 (Iraq) to 2.0 (Norway).
n Rule of law, which reflects “perceptions of the extent to which agents have confidence in and abide by the rules of society, and in particular the quality of contract enforcement, property rights, the police, and the courts, as well as the likelihood of crime and violence” (Kaufmann, Kraay, and Mastruzzi 2011, 4). The variable has a mean of −0.5 and ranges from −1.7 (Iraq) to 1.9 (Norway).
n Political stability and absence of violence/terrorism, which reflects “perceptions of the likelihood that the government will be destabilized or overthrown by unconstitutional or violent means, including politically‐motivated violence and terrorism” (Kaufmann, Kraay, and Mastruzzi 2011, 4). The variable has a mean of −0.5 and ranges from −2.4 (Iraq) to 1.3 (Norway).16
As the descriptive statistics suggest, the Worldwide Governance Indicators are highly correlated with one another, although meaningful differences between countries are present. For example, Azerbaijan and Yemen perform similarly in terms of government effectiveness (−0.85 and −0.83, respectively), but rule of law is considered significantly worse in Yemen than Azerbaijan (−1.32 vs. −0.84).
Finally, the model includes controls for oil and gas shares of GDP in 2002–04, to capture resource intensity at the outset of the boom, and a dummy for whether the country had any oil and gas exports in the 1990s. This accounts for countries (e.g., Chad, Ghana, and Niger) where oil resources were not developed until more recently. Obviously, for new exporters, both oil and gas rents as a share of GDP and fuel exports as a share of total merchandise exports are expected to be higher in 2012–14 than in the earlier period.
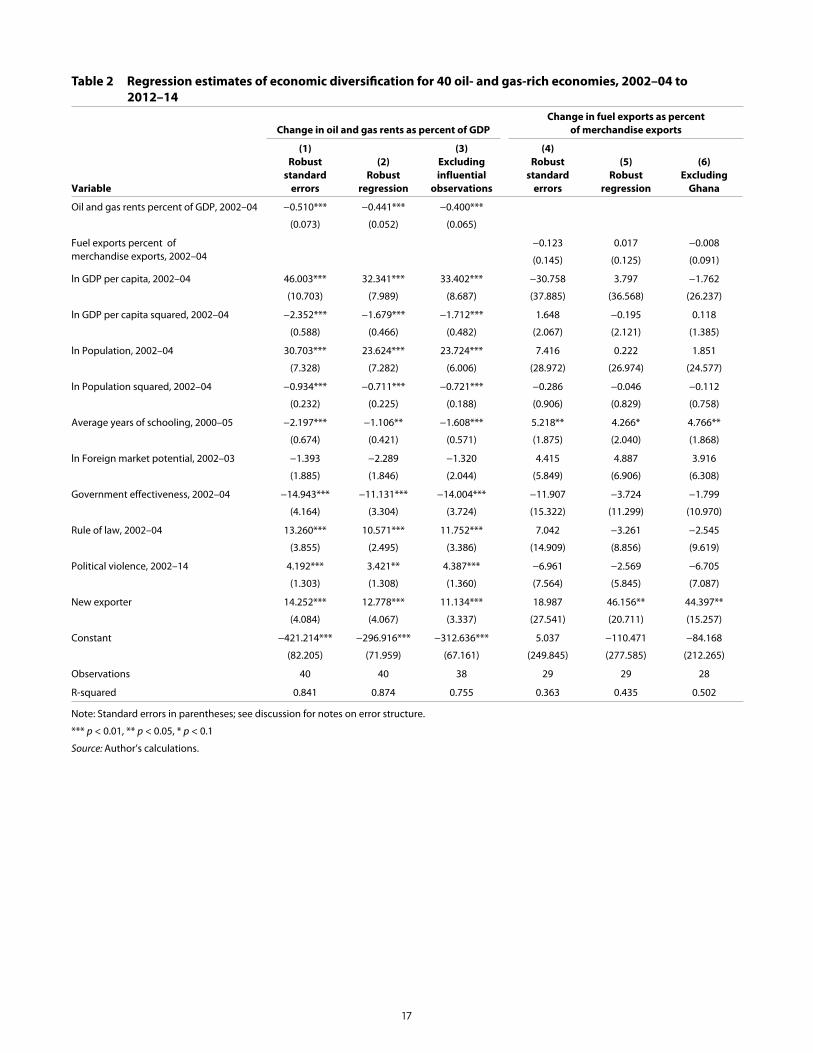
Table 2 presents the results of six models. The outcome variable in models 1–3 is the change in oil and gas rents as a share of GDP; for models 4–6, it is the change in fuel exports as a share of total merchandise exports. Data for
14. Data for Angola, Azerbaijan, Chad, Equatorial Guinea, Nigeria, Oman, Suriname, and Uzbekistan are missing. For each, the country was imputed its UN subregional average for 2000–05. In the absence of observations for Central Africa, those coun-tries were imputed the average of Western and Eastern Africa (4.2).
15. World Bank, Worldwide Governance Indicators, http://info.worldbank.org/governance/wgi/index.aspx#home (accessed on September 29, 2016).
16. The violence variable is calculated as the mean for the period 2002–14.
8 9
fuel exports as a share of total merchandise exports are missing for 11 countries.17 Models 1 and 4 are estimated using ordinary least squares (OLS) with robust standard errors; models 2 and 5 use robust regression, which assigns smaller weights to observations that exert disproportionate influence on OLS-derived coefficients (i.e., “outlier” observations); and models 3 and 6 are estimated using OLS with robust standard errors but excluding observations that exert dispro-portionate leverage on the model as identified by Cook’s distance.
Results for models 1–3 are broadly similar across estimators and the exclusion of influential cases. Moreover, model fit is high, with the least explanatory specification (model 3) still explaining nearly 76 percent of the observed variation in the dependent variable. Results for the fuel exports models are less similar across specifications, in part because of the smaller sample size and concomitant reduction in statistical power, and model fit is uniformly much poorer. Indeed, only two variables (years of schooling and new exporter status) were consistently correlated with changes in fuel export dependence.
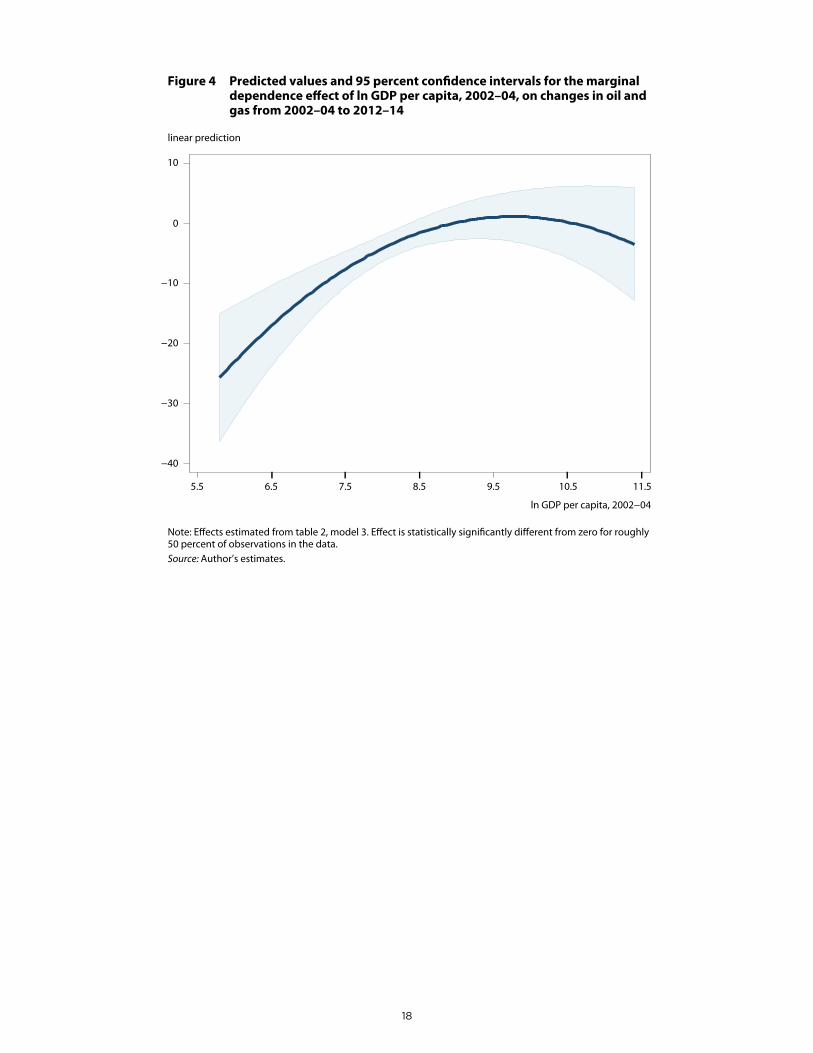
The results for GDP diversification were mostly consistent with theoretical priors. Greater oil and gas dependence in the early 2000s is associated with larger reductions in oil and gas dependence by 2012–14. Using model 3 as the base-line specification,18 a one percentage point increase in initial oil and gas dependence is associated with a 0.4 percentage point decrease in oil and gas dependence in the latter period. Similarly, lower initial GDP per capita is associated with lower oil and gas dependence in the latter period, although the relationship is nonlinear.
Figure 4 plots the relationship across the observed values for ln GDP per capita. The effect is statistically significant for values of GDP per capita up to about $4,800; beyond that threshold, additional output per capita is not associated with significant increases or decreases in oil and gas dependence. An economy with GDP per capita equivalent to Nigeria’s in the earlier period ($1,530) would expect its oil and gas dependence to decrease by 8.9 percentage points. Meanwhile, a country with Saudi Arabia’s GDP per capita would see a one percentage point increase, though the effect is not statistically significant. This suggests a potential “high oil income trap,” where oil and gas economies at higher levels of development are “locked in” to oil and gas in a way less developed economies are not. However, as relatively poorer countries develop economically, it may become more difficult for them to diversify.
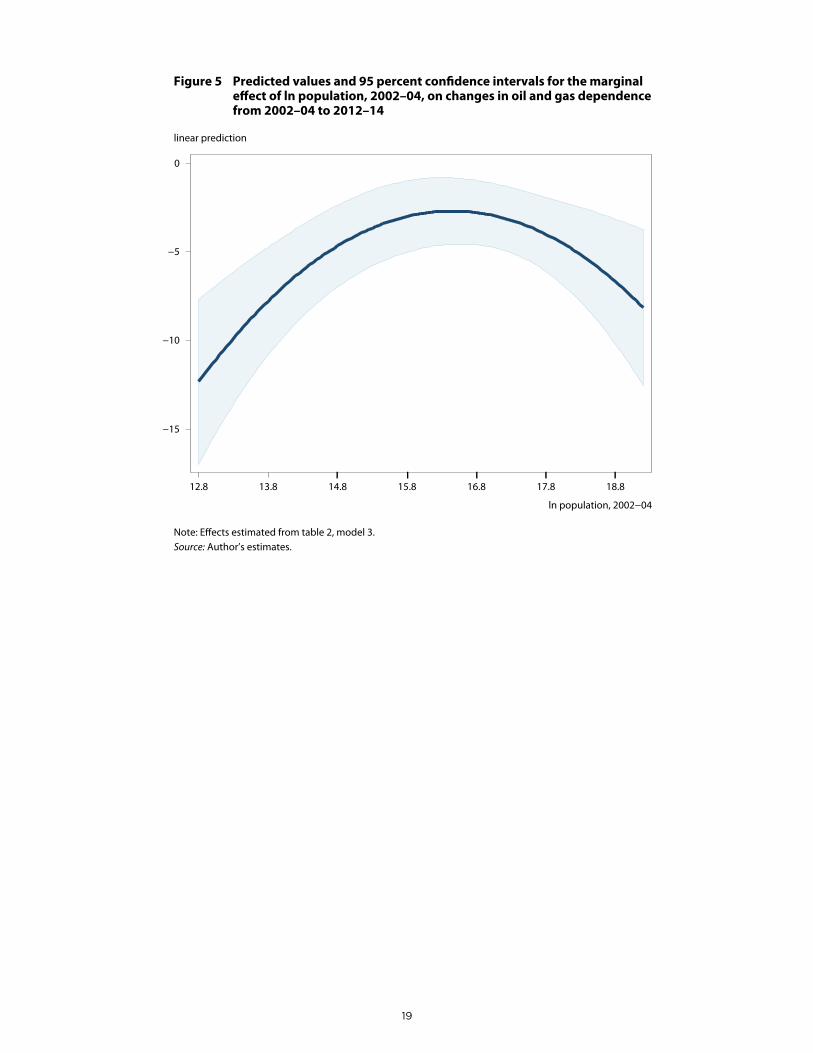
The effect of population was found to be nonlinear as well, with both less and more populous countries diversi-fying more than those in the middle. The smallest predicted decrease (a 2.7-point decrease in oil and gas dependence) is associated with roughly 13 million inhabitants. Figure 5 plots the effect across the observed range of values for ln population.
The quality of human capital has a consistent, linear, and positive effect: each additional year of schooling in the early 2000s is associated with a 1.6 percentage point decrease in oil and gas dependence in the latter period. Thus, increasing the average schooling level by roughly four years—the difference between Indonesia (5.78) and Malaysia (9.40)—would be associated with an additional decrease in oil and gas dependence of 5.8 points.
The coefficients on access to foreign markets are in the expected direction (greater market access is associated with less dependence on oil and gas) but not statistically significant under any of the three specifications.
Turning to the political/institutional variables, the effects are more complicated to interpret. Effective bureaucra-cies and policy stability—or at least perceptions thereof—are associated with declining oil and gas shares of GDP. Countries with one unit above average scores for government effectiveness and policy stability would be expected to see oil and gas shares of GDP decline by 14 points. However, for any given level of government effectiveness, stronger rule of law is correlated with less diversification. Teasing out the effect is complicated, as government effectiveness and rule of law correlate highly.
For example, four countries have government effectiveness scores close to zero—Argentina (−0.10), Ghana (−0.16), Kuwait (0.07), and Suriname (−0.17)—but for which rule of law scores vary more widely, from 0.56 (Kuwait) to −0.82 (Argentina). Holding government effectiveness constant at zero, the lower score would be associated with a −13.4 point
17. Angola, Chad, Republic of Congo, Equatorial Guinea, Gabon, Iran, Libya, Sudan, Trinidad and Tobago, United Arab Emirates, Uzbekistan.
18. Model 3 in table 2 is the baseline specification for the discussion of marginal effects and predicted values for changes in oil and gas dependence. Model 6 is referenced for changes in fuel exports as a share of total merchandise exports.
8 9
drop in oil and gas shares of GDP, while the higher score would be associated with a 2.8 point increase in oil and gas shares of GDP, although the latter effect is not statistically significant. These findings suggest that if governance institu-tions are otherwise credible and capable, stronger rule of law may inhibit economic diversification.
Political stability and the absence of violence, a third variable that is relatively highly correlated with the insti-tutional measures, exert statistically significant effects in the expected direction.19 A one unit decrease in political stability—equivalent to the difference between Trinidad and Tobago (−0.05) and Uzbekistan (−1.07)—is associated with an increase in oil and gas dependence of about 4.4 points. Thus governance matters, but in countervailing ways.
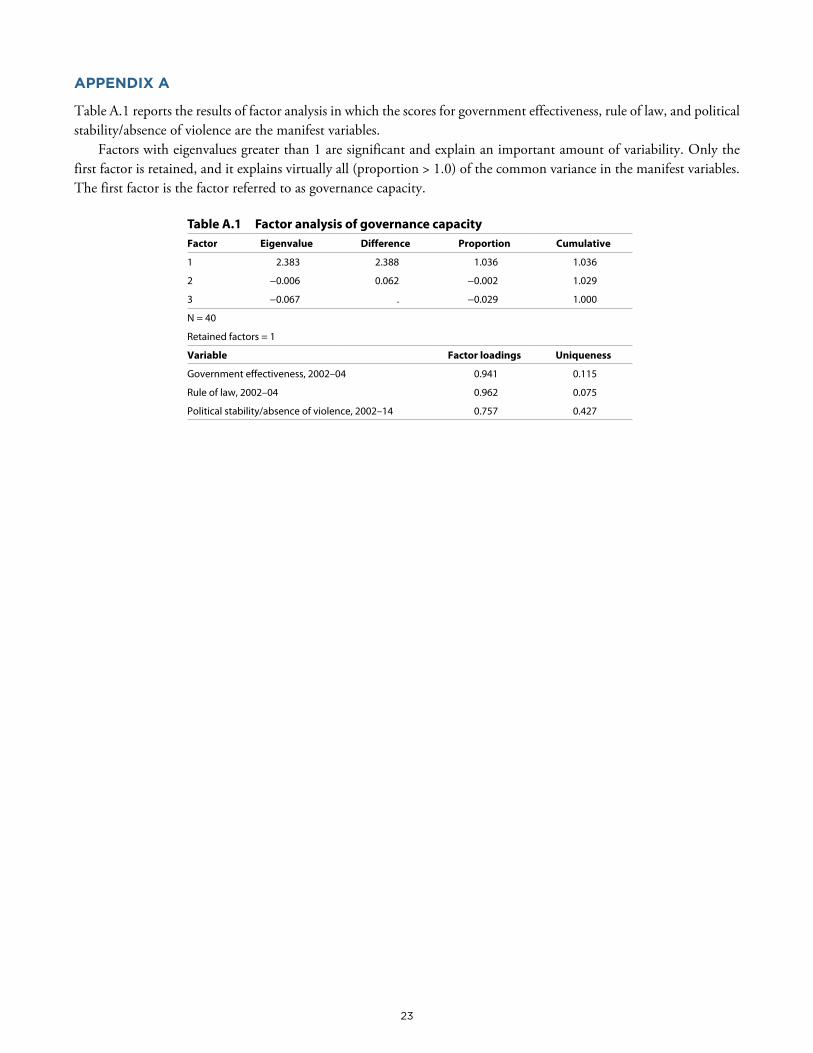
Alternatively, governance can be understood as a latent concept, of which government effectiveness, rule of law, and political stability and the absence of violence are observable components. Techniques such as factor analysis are useful when concepts, like governance, either cannot be measured directly or can be measured multiple different ways with varying degrees of construct validity and measurement error (Treier and Jackman 2008, Hendrix 2010). Table A.1 in the appendix presents results for alternate specifications of the models using a factor analysis–derived measure of governance capacity.20 Operationalized by a single indicator, better governance is associated with less GDP diversifica-tion. However, the result is less robust across estimators. Although highly correlated, the components of governance mentioned above each provide additional, statistically separable leverage on the question of which countries diversify.
Finally, the control for new exporter status is highly statistically significant and in the expected direction. Countries that just began producing and exporting oil and gas saw increases in their share of both GDP and total merchandise exports.
Regarding export diversification, the models perform poorly. Across specifications, only one nontrivial finding emerges: countries with more highly educated populations see their fuel export dependence increase. The aforemen-tioned difference between Indonesia (5.78) and Malaysia (9.40) is associated with a 17.2 percentage point increase in fuel exports as a share of total merchandise exports (model 6 as baseline specification).
Taken together, the quantitative results support five basic conclusions:
1. Structural factors, such as preexisting levels of resource dependence, population, and GDP per capita, signifi-cantly explain success or failure to diversify GDP away from oil and gas. Countries that began the boom with higher levels of oil and gas dependence, poorer countries, and those with either larger or smaller populations were more successful in diversifying their GDP during the commodities boom.
2. Political/institutional factors affect diversification in cross-cutting ways. Governance clearly matters for diver-sification, although the effects are not uniformly positive. More effective, capable bureaucratic structures are asso-ciated with greater GDP diversification away from oil and gas. For any given level of government effectiveness, however, stronger rule of law is associated with less GDP diversification. Here, rule of law may be capturing something akin to foreign investor bias. Several of the indicators used to construct the World Bank Governance Indicators Rule of Law measure21 are designed to capture contract viability, repatriation of profits, and delays in payment—factors affecting the safety and profitability of foreign direct investment (FDI; Hendrix 2010). Countries that perform better on these measures may be more likely to attract investment capital to their export sectors, especially in the context of a global commodities boom, which would auger against diversification. This conjecture has been supported in the aggregate in a study of inward FDI in Gulf Cooperation Council countries—it flows disproportionately to countries with stronger rule of law (Mina 2007); and a recent IMF (2016b) study of FDI in the Middle East and North Africa confirms that, during the boom, FDI in the region was highly concentrated in extractives. However, more research in this area is needed to parse specific mechanisms, perhaps via case studies of firm behavior in different governance contexts.
19. Higher values of political stability and absence of violence are associated with less violence.
20. The retained factor, governance capacity, is highly correlated with the component measures: government effectiveness (r = 0.97), rule of law (r = 0.99), and political stability and the absence of violence (r = 0.78).
21. For example, the Global Insight Business Conditions and Risk Indicators’ “risk of expropriation, state contract alteration, and contract enforcement”; the Institutional Profiles Database’s “withdrawal from contracts” variables.
10 11
3. Human capital matters, but in countervailing ways. Education appears to affect GDP and export diversifica-tion differentially. Consistent with endogenous growth theory, countries with more educated populations saw greater growth in their nonresource sectors than countries with less educated populations. Seemingly paradoxically, however, education is associated with greater export concentration. The mechanism here is unclear. From a policy perspective, the results suggest a tradeoff between GDP diversification and export diversification when thinking about the returns to investment in education.
4. Structural/institutional variables do a reasonably good job of explaining internal diversification (i.e., diver-sification of GDP) but not export diversification. Models 4–6, which estimate changes in fuel exports as a share of total merchandise exports, perform poorly, with coefficient estimates changing significantly in sign, size, and statistical significance across specifications. The overall model fit is considerably worse, with adjusted R2 values for the nonrobust regression specifications below 0.2.
5. Internal economic diversification in the 21st century has been less a matter of correct policy formation and implementation and more a matter of factors that shape the policymaking environment. The reported models are policy agnostic. While the government effectiveness variable speaks to the policy formation process, it conveys no information about policy content. Structural factors, institutions, and education drive outcomes. Regarding export diversification, however, the poor performance of these structural/institutional variables suggests that policy instru-ments—and prices for traded commodities—may be more consequential for export diversification. Of course, the empirical record points to significant stubbornness in changing oil- and gas-dependent economies’ export profiles and diversifying their revenue streams (Bornhorst, Gupta, and Thornton 2008).
7. DIVERSIFYING TO WHAT?
Among the oil- and gas-dependent economies that experienced some GDP diversification during the resource boom, what did they diversify to? With some exceptions, economic diversification took the form of expansion of services and construction, rather than a shift toward more tradable sectors like manufacturing or agriculture.
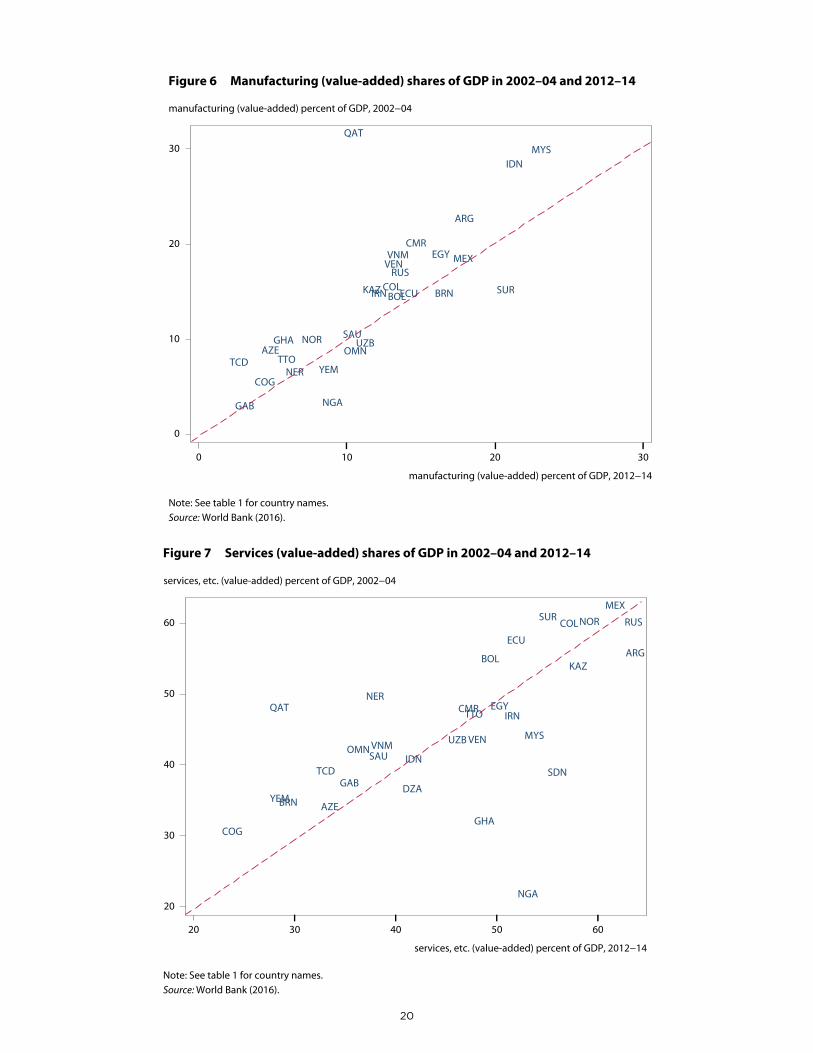
Diversifying into manufacturing is considered highly desirable from a policy perspective, as manufactures tend to employ more workers and are highly tradable and could thus help lessen export concentration (IMF 2016a). Figure 6 plots the manufacturing (value-added) shares of GDP for 30 oil- and gas-dependent economies in 2002–04 and 2012–14.22 Most observations are above the 45-degree line, indicating a relative decline in manufacturing as a share of GDP: The manufacturing sector declined as a relative share in 75 percent of the 30 countries, consistent with a global decline. The largest increases (5.6 and 5.4 percent, respectively) were in Nigeria and Suriname, while the largest contractions were in Qatar, Indonesia, and Malaysia. Nigeria’s rise in manufacturing output came on the strength of rapid growth in products such as textiles, apparel and footwear, and plastics—precisely the types of light manufacturing that historically have attended early industrialization (Amsden 1989, Auty 1994).23 Suriname’s increase was driven in part by aluminum smelting—a downstream activity facilitated by the country’s large bauxite deposits and substantial hydroelectric capacity.
Similarly, agriculture value-added declined as a share of GDP in two-thirds of cases, with a large increase only in Chad (21 percent) and smaller increases in Niger, Suriname, and Sudan (about 2–4 percent in each). Although agriculture is an important source of employment in low-income countries, it is not usually viewed as a vehicle for economic diversification because the value added is typically small and agricultural exports are subject to some of the same boom-and-bust dynamics that characterize other global commodity markets (Hendrix 2011).
In several cases, early 21st century diversification came via an expansion of the service sector, which encompasses a variety of activities in wholesale and retail trade, transportation, and financial, professional, and personal services.
22. Algeria, Angola, Bahrain, Equatorial Guinea, Iraq, Kuwait, Libya, Papua New Guinea, Sudan, and the United Arab Emirates did not report data for manufacturing value-added.
23. “Manufacturing Still Nigeria’s Fastest Growing Sector,” CNBC Africa, September 8, 2014, www.cnbcafrica.com/news/finan-cial/2014/09/08/nigeria-gdp-q2-growth/ (accessed on January 10, 2017).
10 11
With some exceptions, service sector activities are typically nontradable and vary in terms of their labor intensity. Thus, growth in the service sector contributes to GDP and employment diversification but in most cases does not lead to diversification of exports. In 2015, ten countries accounted for over half of global service exports (World Bank 2016). Service exports are highly concentrated in high-income countries (77 percent of the global total in 2015)—India is the only middle- or lower-middle-income country among the top ten service exporters—and only one oil- and gas-dependent economy—Russia—accounts for more than one percentage point of global service exports.
Figure 7 plots the service (value-added) shares of GDP for 32 oil- and gas-dependent economies in 2002–04 and 2012–14. Fourteen of these economies saw their service sectors increase in relative size; three African economies (Nigeria, Ghana, and Sudan) experienced the most marked growth, followed by Malaysia and Argentina. Qatar and Niger saw the largest contractions (−19.8 percent and −12 percent) in the relative size of their service sector. For Niger, a relative contraction in the nonresource sector was to be expected given the very recent development of its oil resources. Qatar’s contraction may be due to a massive investment in fixed infrastructure development and construction, both of which are counted as components of industry value added. These investments are discussed in greater length in the following section.
A skeptical read of these findings—little evidence of systematic growth in the manufacturing or agricultural sectors, expansion in nontradable services, infrastructure, and construction—is that these patterns of diversification are consis-tent with Dutch Disease dynamics, in which commodity booms stimulate growth in nontradable sectors like retail, local services, and construction. This diversification may expand employment opportunities and diversify the potential tax base, but it does not decrease the vulnerability of these economies in the face of commodity busts.
8. DIVERSIFICATION IN THE GULF COOPERATION COUNCIL ECONOMIES
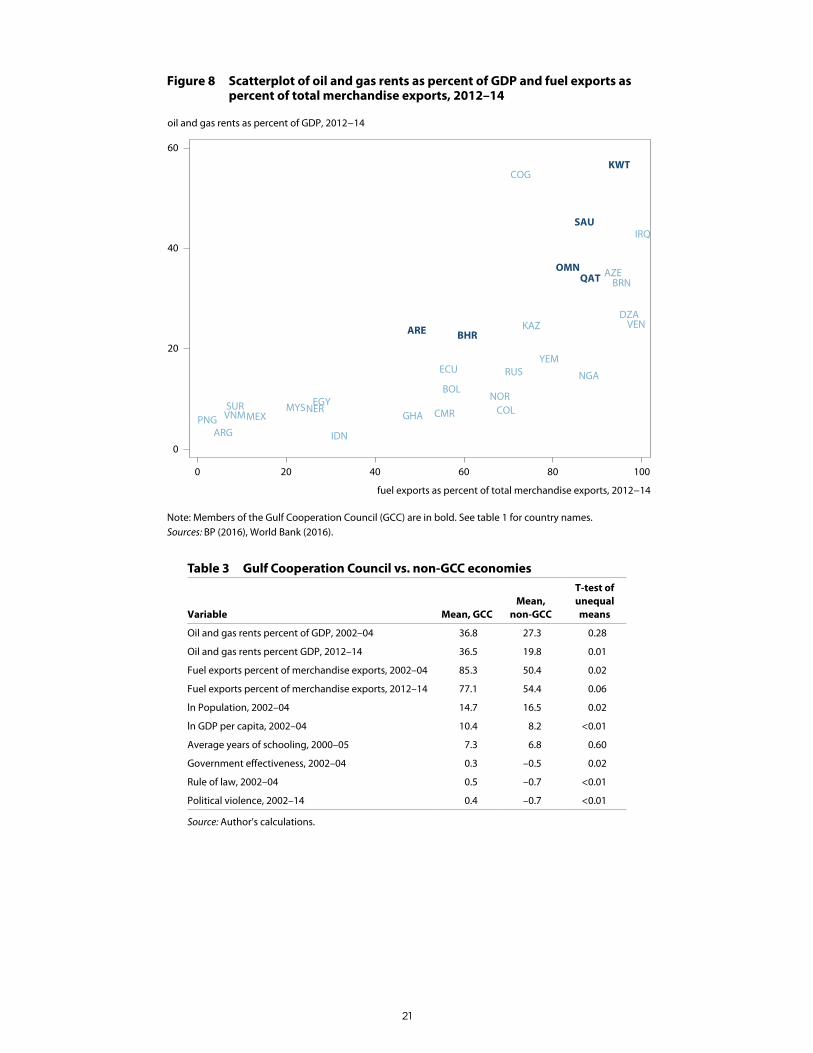
What do these findings suggest for the comparatively wealthy, oil- and gas-dependent countries of the Gulf Cooperation Council (Bahrain, Kuwait, Oman, Qatar, Saudi Arabia, and the United Arab Emirates)? They account for roughly a third of global oil reserves (22 percent of global oil production) and 22 percent of global natural gas reserves (11.5 percent of production), but less than 1 percent of the global population (BP 2016, CIA 2016). Even among oil and gas exporters, their dependence on these resources is exceptional (see figure 8). Oil and gas rents make up 36.5 percent of GDP in the GCC states versus 19.8 percent in non-GCC exporters (this difference is statistically significant) and 77.1 percent of exports versus 54.4 percent (p < 0.1), in large part because non-GCC economies were successful in diversifying whereas the GCC economies have remained more or less equally dependent on oil and gas (see table 3).
The GCC region faces several overlapping sources of economic insecurity, including declining commodity prices, freshwater shortages, and a demographic boom that has resulted in large and largely unemployed youth bulges. Moreover, the region’s population is roughly evenly split between nationals (26.2 million) and foreign nationals (25.2 million), the latter of whom make up the bulk of the workforce and whose ranks swelled during the commodity boom.24 Now, the countries of the GCC—including Saudi Arabia, the world’s single largest oil exporter and perhaps the pivotal player in Middle East politics—find themselves facing budget shortfalls and redoubling their efforts to diversify away from oil and gas.
The regression analysis points to a difficult road ahead for GDP diversification in the GCC states. On the positive side, many GCC countries have small populations and perform better than average for the sample in terms of govern-ment effectiveness and political stability, factors that should augur well for economic diversification. On the negative side, however, the GCC states are at higher levels of per capita income, do not perform particularly well on the years
24. “GCC: Total Population and Percentage of Nationals and Foreign Nationals in GCC Countries (National Statistics, 2010-2016) (with numbers),” Gulf Labor Markets and Migration, http://gulfmigration.eu/gcc-total-population-percentage-nationals-foreign-nationals-gcc-countries-national-statistics-2010-2016-numbers/ (accessed on November 16, 2016).
12 13
of schooling indicator (especially given their higher per capita incomes),25 and have stronger performance in terms of rule of law (see table 3).
Despite significant growth in absolute terms during the boom, several GCC economies have experienced even more rapid population growth, meaning large per capita contractions of the non–oil and gas economy and, in some cases, in oil and gas rents as well (table 4). For all the media coverage of the Emirates’ buildup of megaskyscrapers and opulent artificial islands, its economy contracted significantly in per capita terms during the boom. The contraction was especially large in the non–oil and gas economy, which contracted by over 40 percent. A similar situation obtains in Kuwait, where oil and gas rents rose by 16 percent while the non–oil and gas economy contracted in per capita terms by nearly a third (29 percent).
The situation in the GCC states is neither economically nor politically tenable over the long term. Populations are rising and the nonresource economy is not growing in per capita terms. Large resource rents, long the foundation of social stability in the region, are being diluted by increasing domestic consumption and growing populations that must be either placated or repressed. In light of the countries’ already comparatively high standards of living, many jobs in the non–oil and gas economy are in the service sector (and thus largely nontradable) and have gone to imported labor. Diversification through light manufacturing, either exports or GDP, is likely to be unsuccessful because of the need to import inputs, higher labor costs, and Dutch Disease dynamics, which may render resource exporters less capable of promoting exports through competitive exchange rate policy (Magud and Sosa 2010, Frankel 2012).
Diversification into higher value added, higher-technology tradable sectors has been suggested as a potential solution to the “resource-rich high-income trap” (Ocampo 2016). Industries such as high-end financial and business services, technology, and the like would be appropriate for these countries, given their levels of development, but are likely to be stymied either by crowding of the space—Dubai’s finance-heavy model may not be replicable, especially within the region—or by the region’s comparatively less educated workforces and political environments, which constrain the type of open inquiry necessary to be competitive in these sectors. Of the top 20 global metro areas attracting the most venture capital investment, only three (Beijing, Shanghai, and Moscow) are in countries with relatively closed, undemocratic political systems (Florida and King 2016). The knowledge economy has a revealed preference for more open political systems.
Despite these challenges, the region does have some success stories. In Saudi Arabia oil and gas as a share of GDP rose during the boom but the country nevertheless saw comparatively impressive (~3 percent annualized) growth of the nonresource economy, even as exports remain concentrated. In Qatar, which started the boom with the highest per capita incomes in the region, the nonresource economy grew by over 40 percent. Some of the diversification can be attributed to domestic spending on World Cup–related infrastructure—estimates suggest that Qatar will spend $200 billion to host the tournament, 20 times the spending of the previous two hosts (Brazil and South Africa) combined—but this spending has ramped up only in the past couple of years (Gulf State Analytics 2015). Whether this infrastruc-ture buildup catalyzes further diversification once the World Cup is over, however, remains to be seen. Nevertheless, the Qatari experience may yield clues for resource-rich states about how to spur nonresource-sector growth in the midst of wealth and population pressures.
9. CONCLUSIONS
As the early 21st century commodity boom winds down, the oil- and gas-rich economies once again have turned their focus to economic diversification. In the aggregate, the news is mostly good: a large majority of exporters have seen their nonresource sectors grow more rapidly than their resource sectors over the past ten years, even amid high oil and gas prices. Diversification of exports, however, has proven more elusive. While success with the former will provide
25. The per capita incomes of Qatar and the United Arab Emirates rival that of Norway but their education levels are more on par with upper-middle-income countries such as Ecuador or Mexico. “Inadequately educated workforce” was one of the top three most commonly cited barriers to doing business in Oman, Qatar, Saudi Arabia, and the United Arab Emirates in a recent World Economic Forum (2014) Executive Opinion Survey.
12 13
increasing opportunities for addressing employment-related issues and tax base diversification, the failure of the latter means, at least in the short term, that oil- and gas-rich economies will continue to feel the pinch both on their import bills and in government revenues.
This working paper developed a model of GDP diversification based on insights from neoclassical, endogenous, new economic, geographic, and institutional perspectives on economic development, and found substantial evidence for all but the new economic geography model in explaining GDP diversification. Regarding exports, however, these models performed rather poorly. Perhaps this points to the importance of specific policy instruments—capital chan-neling, tax policy, input subsidies, and the like—that might help oil and gas exporters diversify. Or it contributes to the mounting evidence that suggests not enough is known—and few examples are available to guide thinking about—how to diversify exports, especially for highly oil- and gas-dependent economies like those of the GCC.
To wit, a recent IMF (2016a) report on oil-exporting Arab economies identified Morocco and Malaysia as successful models for both GDP and export diversification. Yet neither is or was particularly dependent on natural resources: Morocco may be the world’s largest phosphate producer, but even as far back as 1990 it exported more garments than phosphate and fertilizer, and total natural resource rents as a share of GDP have averaged less than 2.4 percent since 2000 (Hausmann et al. 2014, World Bank 2016). Similarly, Malaysia’s exports have been well diversified since the early 1990s, with electronics and construction equipment far outpacing oil and gas exports, and total natural resource rents have averaged 13.6 percent of GDP since 2000, roughly a third of the GCC average. These are not particularly instructive cases for countries whose exports are heavily dominated—at more than 80 percent in four of the six GCC countries—by oil and gas.
What, then, does the present analysis suggest for policymakers? First, investments in education can pay dividends for domestic diversification, even if their effect is to potentially further concentrate exports. Education has been called “the fulcrum” of the Saudi Vision 2030 planning document, which contains ambitious plans to reform the country’s education system to promote more critical thinking and better technical skills.26 This analysis suggests that investment in education is a useful lever for GDP diversification.
Second, policymakers should be circumspect about the notion that “getting institutions right” is key for export diversification and nonresource development (for a critical discussion of this perspective, see Rodrik 2004b). Political/economic institutions affect GDP diversification in cross-cutting ways that may even promote resource dependence, and they exert no discernible impact on export diversification.
Finally, policymakers should refocus their attention on identifying more suitable cases—like Qatar and Nigeria, both of which were highly dependent on oil and gas and achieved successful diversification—to guide practical thinking in this area. Given the geostrategic and economic importance of oil- and gas-exporting countries, the development community must provide better examples and solutions to help them transition to more sustainable development paths.
26. Simeon Kerr, “Saudi Arabia, Cutting Its Budget, Turns to Private Schools,” Financial Times, November 21, 2016, www.ft.com/content/ab450160-9c1f-11e6-8324-be63473ce146 (accessed on November 22, 2016).
14 15
–50
0
50
100
150
200
250
0
20
40
60
80
100
120
140
1970 1974 1978 1982 1986 1990 1994 1998 2002 2006 2010 2014
Year-on-year price change (percent)Crude oil price per barrel (2015 US dollars)
Figure 1 Crude oil prices and price changes, 1970–2016
Note: The natural gas market is more regionally segmented but prices track those of crude oil (r > 0.93).Sources: BP (2016), Index Mundi (2016).
crude oil price per barrel (2015 US dollars) year-on-year price change (percent)
AGO
ARE
ARG
AZE
BHR
BOL
BRN
CMR
COG
COL
DZA
ECUEGY
GAB
GHA
GNQ
IDN
IRN
IRQ
KAZ
KWT
LBY
MEX
MYS
NER
NGA
NOR
OMN
PNG
QAT
RUS
SAU
SDN
SUR
TCD
TTO
UZB
VEN
VNM
YEM
0
20
40
60
80
oil and gas rents as percent of GDP, 2002−04
0 20 40 60
oil and gas rents as percent of GDP, 2012−14
Figure 2 Oil and gas rents as percent of GDP, 2002–04 versus 2012–14
Note: Average oil price 2002–04: $39.37 (constant 2015 US dollars); average oil price 2012–14: $108.30. Dashed line represents a 1:1 correspondence between the shares of the two time periods. See table 1 for country names.Sources: BP (2016), World Bank (2016).
14 151
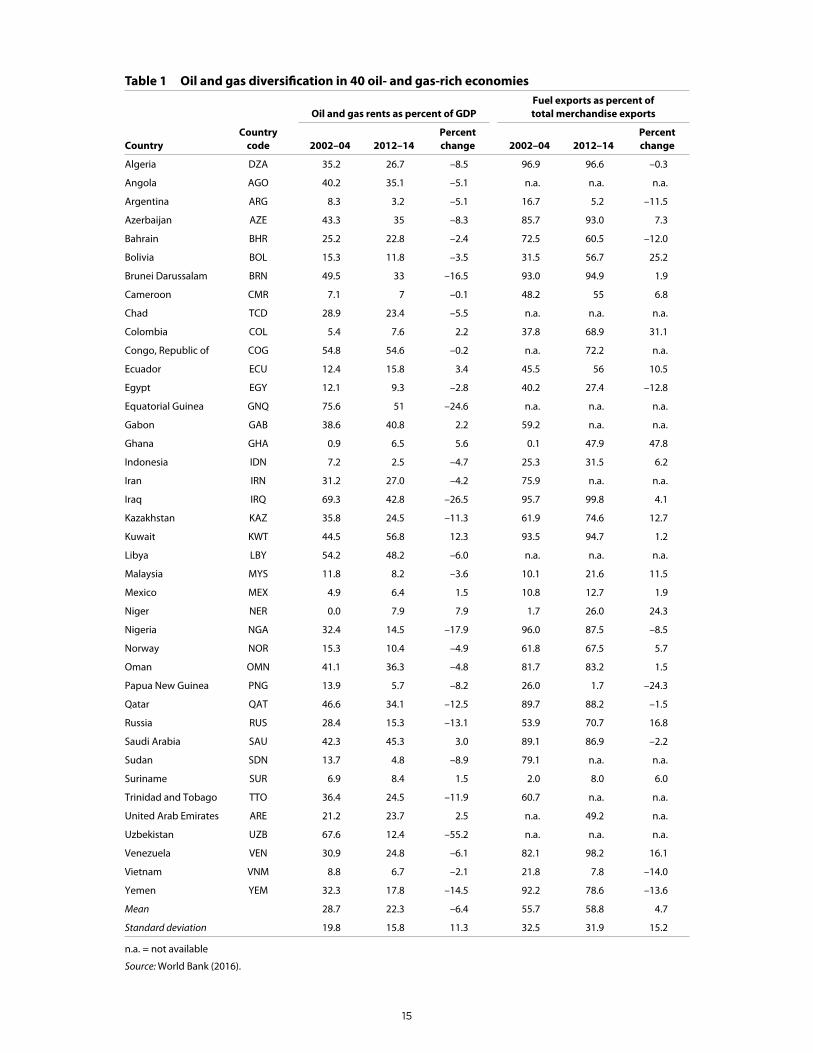
Table 1 Oil and gas diversification in 40 oil- and gas-rich economies
CountryCountry
code
Oil and gas rents as percent of GDP Fuel exports as percent of total merchandise exports
2002–04 2012–14Percent change 2002–04 2012–14
Percent change
Algeria DZA 35.2 26.7 –8.5 96.9 96.6 –0.3
Angola AGO 40.2 35.1 –5.1 n.a. n.a. n.a.
Argentina ARG 8.3 3.2 –5.1 16.7 5.2 –11.5
Azerbaijan AZE 43.3 35 –8.3 85.7 93.0 7.3
Bahrain BHR 25.2 22.8 –2.4 72.5 60.5 –12.0
Bolivia BOL 15.3 11.8 –3.5 31.5 56.7 25.2
Brunei Darussalam BRN 49.5 33 –16.5 93.0 94.9 1.9
Cameroon CMR 7.1 7 –0.1 48.2 55 6.8
Chad TCD 28.9 23.4 –5.5 n.a. n.a. n.a.
Colombia COL 5.4 7.6 2.2 37.8 68.9 31.1
Congo, Republic of COG 54.8 54.6 –0.2 n.a. 72.2 n.a.
Ecuador ECU 12.4 15.8 3.4 45.5 56 10.5
Egypt EGY 12.1 9.3 –2.8 40.2 27.4 –12.8
Equatorial Guinea GNQ 75.6 51 –24.6 n.a. n.a. n.a.
Gabon GAB 38.6 40.8 2.2 59.2 n.a. n.a.
Ghana GHA 0.9 6.5 5.6 0.1 47.9 47.8
Indonesia IDN 7.2 2.5 –4.7 25.3 31.5 6.2
Iran IRN 31.2 27.0 –4.2 75.9 n.a. n.a.
Iraq IRQ 69.3 42.8 –26.5 95.7 99.8 4.1
Kazakhstan KAZ 35.8 24.5 –11.3 61.9 74.6 12.7
Kuwait KWT 44.5 56.8 12.3 93.5 94.7 1.2
Libya LBY 54.2 48.2 –6.0 n.a. n.a. n.a.
Malaysia MYS 11.8 8.2 –3.6 10.1 21.6 11.5
Mexico MEX 4.9 6.4 1.5 10.8 12.7 1.9
Niger NER 0.0 7.9 7.9 1.7 26.0 24.3
Nigeria NGA 32.4 14.5 –17.9 96.0 87.5 –8.5
Norway NOR 15.3 10.4 –4.9 61.8 67.5 5.7
Oman OMN 41.1 36.3 –4.8 81.7 83.2 1.5
Papua New Guinea PNG 13.9 5.7 –8.2 26.0 1.7 –24.3
Qatar QAT 46.6 34.1 –12.5 89.7 88.2 –1.5
Russia RUS 28.4 15.3 –13.1 53.9 70.7 16.8
Saudi Arabia SAU 42.3 45.3 3.0 89.1 86.9 –2.2
Sudan SDN 13.7 4.8 –8.9 79.1 n.a. n.a.
Suriname SUR 6.9 8.4 1.5 2.0 8.0 6.0
Trinidad and Tobago TTO 36.4 24.5 –11.9 60.7 n.a. n.a.
United Arab Emirates ARE 21.2 23.7 2.5 n.a. 49.2 n.a.
Uzbekistan UZB 67.6 12.4 –55.2 n.a. n.a. n.a.
Venezuela VEN 30.9 24.8 –6.1 82.1 98.2 16.1
Vietnam VNM 8.8 6.7 –2.1 21.8 7.8 –14.0
Yemen YEM 32.3 17.8 –14.5 92.2 78.6 –13.6
Mean 28.7 22.3 –6.4 55.7 58.8 4.7
Standard deviation 19.8 15.8 11.3 32.5 31.9 15.2
n.a. = not available
Source: World Bank (2016).
16 17
DZA
ARG
AZE
BHR
BOL
BRN
CMR
COL
ECUEGY
GHA
IDN
IRQ
KAZ
KWT
MYSMEX
NER
NGA
NOR
OMN
PNG
QAT
RUS
SAU
SUR
VEN
VNM
YEM
0
20
40
60
80
100
fuel exports as percent of total merchandise exports, 2002−04
0 20 40 60 80 100
fuel exports as percent of total merchandise exports, 2012−14
Figure 3 Fuel exports as percent of total merchandise exports, 2002–04 versus 2012–14
Note: Dashed line represents a 1:1 correspondence between the shares of the two time periods. See table 1 for country names.Sources: BP (2016), World Bank (2016).
2 3
Table 2 Regression estimates of economic diversification for 40 oil- and gas-rich economies, 2002–04 to 2012–14
Variable
Change in oil and gas rents as percent of GDPChange in fuel exports as percent
of merchandise exports
(1)Robust
standard errors
(2)Robust
regression
(3)Excluding influential
observations
(4)Robust
standard errors
(5)Robust
regression
(6)Excluding
Ghana
Oil and gas rents percent of GDP, 2002–04 −0.510***
(0.073)
−0.441***
(0.052)
−0.400***
(0.065)
Fuel exports percent of merchandise exports, 2002–04
−0.123
(0.145)
0.017
(0.125)
−0.008
(0.091)
ln GDP per capita, 2002–04 46.003***
(10.703)
32.341***
(7.989)
33.402***
(8.687)
−30.758
(37.885)
3.797
(36.568)
−1.762
(26.237)
ln GDP per capita squared, 2002–04 −2.352***
(0.588)
−1.679***
(0.466)
−1.712***
(0.482)
1.648
(2.067)
−0.195
(2.121)
0.118
(1.385)
ln Population, 2002–04 30.703***
(7.328)
23.624***
(7.282)
23.724***
(6.006)
7.416
(28.972)
0.222
(26.974)
1.851
(24.577)
ln Population squared, 2002–04 −0.934***
(0.232)
−0.711***
(0.225)
−0.721***
(0.188)
−0.286
(0.906)
−0.046
(0.829)
−0.112
(0.758)
Average years of schooling, 2000–05 −2.197***
(0.674)
−1.106**
(0.421)
−1.608***
(0.571)
5.218**
(1.875)
4.266*
(2.040)
4.766**
(1.868)
ln Foreign market potential, 2002–03 −1.393
(1.885)
−2.289
(1.846)
−1.320
(2.044)
4.415
(5.849)
4.887
(6.906)
3.916
(6.308)
Government effectiveness, 2002–04 −14.943***
(4.164)
−11.131***
(3.304)
−14.004***
(3.724)
−11.907
(15.322)
−3.724
(11.299)
−1.799
(10.970)
Rule of law, 2002–04 13.260***
(3.855)
10.571***
(2.495)
11.752***
(3.386)
7.042
(14.909)
−3.261
(8.856)
−2.545
(9.619)
Political violence, 2002–14 4.192***
(1.303)
3.421**
(1.308)
4.387***
(1.360)
−6.961
(7.564)
−2.569
(5.845)
−6.705
(7.087)
New exporter 14.252***
(4.084)
12.778***
(4.067)
11.134***
(3.337)
18.987
(27.541)
46.156**
(20.711)
44.397**
(15.257)
Constant −421.214***
(82.205)
−296.916***
(71.959)
−312.636***
(67.161)
5.037
(249.845)
−110.471
(277.585)
−84.168
(212.265)
Observations 40 40 38 29 29 28
R-squared 0.841 0.874 0.755 0.363 0.435 0.502
Note: Standard errors in parentheses; see discussion for notes on error structure.
*** p < 0.01, ** p < 0.05, * p < 0.1
Source: Author’s calculations.
16 172 3
Table 2 Regression estimates of economic diversification for 40 oil- and gas-rich economies, 2002–04 to 2012–14
Variable
Change in oil and gas rents as percent of GDPChange in fuel exports as percent
of merchandise exports
(1)Robust
standard errors
(2)Robust
regression
(3)Excluding influential
observations
(4)Robust
standard errors
(5)Robust
regression
(6)Excluding
Ghana
Oil and gas rents percent of GDP, 2002–04 −0.510***
(0.073)
−0.441***
(0.052)
−0.400***
(0.065)
Fuel exports percent of merchandise exports, 2002–04
−0.123
(0.145)
0.017
(0.125)
−0.008
(0.091)
ln GDP per capita, 2002–04 46.003***
(10.703)
32.341***
(7.989)
33.402***
(8.687)
−30.758
(37.885)
3.797
(36.568)
−1.762
(26.237)
ln GDP per capita squared, 2002–04 −2.352***
(0.588)
−1.679***
(0.466)
−1.712***
(0.482)
1.648
(2.067)
−0.195
(2.121)
0.118
(1.385)
ln Population, 2002–04 30.703***
(7.328)
23.624***
(7.282)
23.724***
(6.006)
7.416
(28.972)
0.222
(26.974)
1.851
(24.577)
ln Population squared, 2002–04 −0.934***
(0.232)
−0.711***
(0.225)
−0.721***
(0.188)
−0.286
(0.906)
−0.046
(0.829)
−0.112
(0.758)
Average years of schooling, 2000–05 −2.197***
(0.674)
−1.106**
(0.421)
−1.608***
(0.571)
5.218**
(1.875)
4.266*
(2.040)
4.766**
(1.868)
ln Foreign market potential, 2002–03 −1.393
(1.885)
−2.289
(1.846)
−1.320
(2.044)
4.415
(5.849)
4.887
(6.906)
3.916
(6.308)
Government effectiveness, 2002–04 −14.943***
(4.164)
−11.131***
(3.304)
−14.004***
(3.724)
−11.907
(15.322)
−3.724
(11.299)
−1.799
(10.970)
Rule of law, 2002–04 13.260***
(3.855)
10.571***
(2.495)
11.752***
(3.386)
7.042
(14.909)
−3.261
(8.856)
−2.545
(9.619)
Political violence, 2002–14 4.192***
(1.303)
3.421**
(1.308)
4.387***
(1.360)
−6.961
(7.564)
−2.569
(5.845)
−6.705
(7.087)
New exporter 14.252***
(4.084)
12.778***
(4.067)
11.134***
(3.337)
18.987
(27.541)
46.156**
(20.711)
44.397**
(15.257)
Constant −421.214***
(82.205)
−296.916***
(71.959)
−312.636***
(67.161)
5.037
(249.845)
−110.471
(277.585)
−84.168
(212.265)
Observations 40 40 38 29 29 28
R-squared 0.841 0.874 0.755 0.363 0.435 0.502
Note: Standard errors in parentheses; see discussion for notes on error structure.
*** p < 0.01, ** p < 0.05, * p < 0.1
Source: Author’s calculations.
18 19
−40
−30
−20
−10
0
10
linear prediction
5.5 6.5 7.5 8.5 9.5 10.5 11.5
ln GDP per capita, 2002−04
Figure 4 Predicted values and 95 percent con�dence intervals for the marginal dependence e�ect of ln GDP per capita, 2002–04, on changes in oil and gas from 2002–04 to 2012–14
Note: E�ects estimated from table 2, model 3. E�ect is statistically signi�cantly di�erent from zero for roughly 50 percent of observations in the data. Source: Author’s estimates.
18 19
−15
−10
−5
0
linear prediction
12.8 13.8 14.8 15.8 16.8 17.8 18.8
ln population, 2002−04
Figure 5 Predicted values and 95 percent con�dence intervals for the marginal e�ect of ln population, 2002–04, on changes in oil and gas dependence from 2002–04 to 2012–14
Note: E�ects estimated from table 2, model 3. Source: Author’s estimates.
20 21
ARG
AZE
BRNBOL
COG
CMR
COLECU
EGY
GAB
GHA
IDN
IRNKAZ
MEX
MYS
NER
NGA
NOROMN
QAT
RUS
SAU
SUR
TCD TTO
UZB
VENVNM
YEM
0
10
20
30
manufacturing (value-added) percent of GDP, 2002−04
0 10 20 30
manufacturing (value-added) percent of GDP, 2012−14
Figure 6 Manufacturing (value-added) shares of GDP in 2002–04 and 2012–14
Note: See table 1 for country names.Source: World Bank (2016).
ARG
AZEBRN
BOL
COG
CMR
COL
DZA
ECU
EGY
GAB
GHA
IDN
IRN
KAZ
MEX
MYS
NER
NGA
NOR
OMN
QAT
RUS
SAU
SDN
SUR
TCD
TTO
UZB VENVNM
YEM
20
30
40
50
60
services, etc. (value-added) percent of GDP, 2002−04
20 30 40 50 60
services, etc. (value-added) percent of GDP, 2012−14
Figure 7 Services (value-added) shares of GDP in 2002–04 and 2012–14
Note: See table 1 for country names.Source: World Bank (2016).
2 3
Table 3 Gulf Cooperation Council vs. non-GCC economies
Variable Mean, GCCMean,
non-GCC
T-test of unequal means
Oil and gas rents percent of GDP, 2002–04 36.8 27.3 0.28
Oil and gas rents percent GDP, 2012–14 36.5 19.8 0.01
Fuel exports percent of merchandise exports, 2002–04 85.3 50.4 0.02
Fuel exports percent of merchandise exports, 2012–14 77.1 54.4 0.06
ln Population, 2002–04 14.7 16.5 0.02
ln GDP per capita, 2002–04 10.4 8.2 <0.01
Average years of schooling, 2000–05 7.3 6.8 0.60
Government effectiveness, 2002–04 0.3 –0.5 0.02
Rule of law, 2002–04 0.5 –0.7 <0.01
Political violence, 2002–14 0.4 –0.7 <0.01
Source: Author’s calculations.
20 21
SAU
KWT
OMNQAT
BHRARE
IRQ
NGA
YEM
COG
VEN
CMRPNG
KAZ
AZE
ECU
NER
IDN
RUS
COL
DZA
ARG
BOL
VNMSUR
MEXEGY
GHA
BRN
MYSNOR
0
20
40
60
oil and gas rents as percent of GDP, 2012−14
0 20 40 60 80 100
fuel exports as percent of total merchandise exports, 2012−14
Figure 8 Scatterplot of oil and gas rents as percent of GDP and fuel exports as percent of total merchandise exports, 2012–14
Note: Members of the Gulf Cooperation Council (GCC) are in bold. See table 1 for country names.Sources: BP (2016), World Bank (2016).
2 3
Table 3 Gulf Cooperation Council vs. non-GCC economies
Variable Mean, GCCMean,
non-GCC
T-test of unequal means
Oil and gas rents percent of GDP, 2002–04 36.8 27.3 0.28
Oil and gas rents percent GDP, 2012–14 36.5 19.8 0.01
Fuel exports percent of merchandise exports, 2002–04 85.3 50.4 0.02
Fuel exports percent of merchandise exports, 2012–14 77.1 54.4 0.06
ln Population, 2002–04 14.7 16.5 0.02
ln GDP per capita, 2002–04 10.4 8.2 <0.01
Average years of schooling, 2000–05 7.3 6.8 0.60
Government effectiveness, 2002–04 0.3 –0.5 0.02
Rule of law, 2002–04 0.5 –0.7 <0.01
Political violence, 2002–14 0.4 –0.7 <0.01
Source: Author’s calculations.
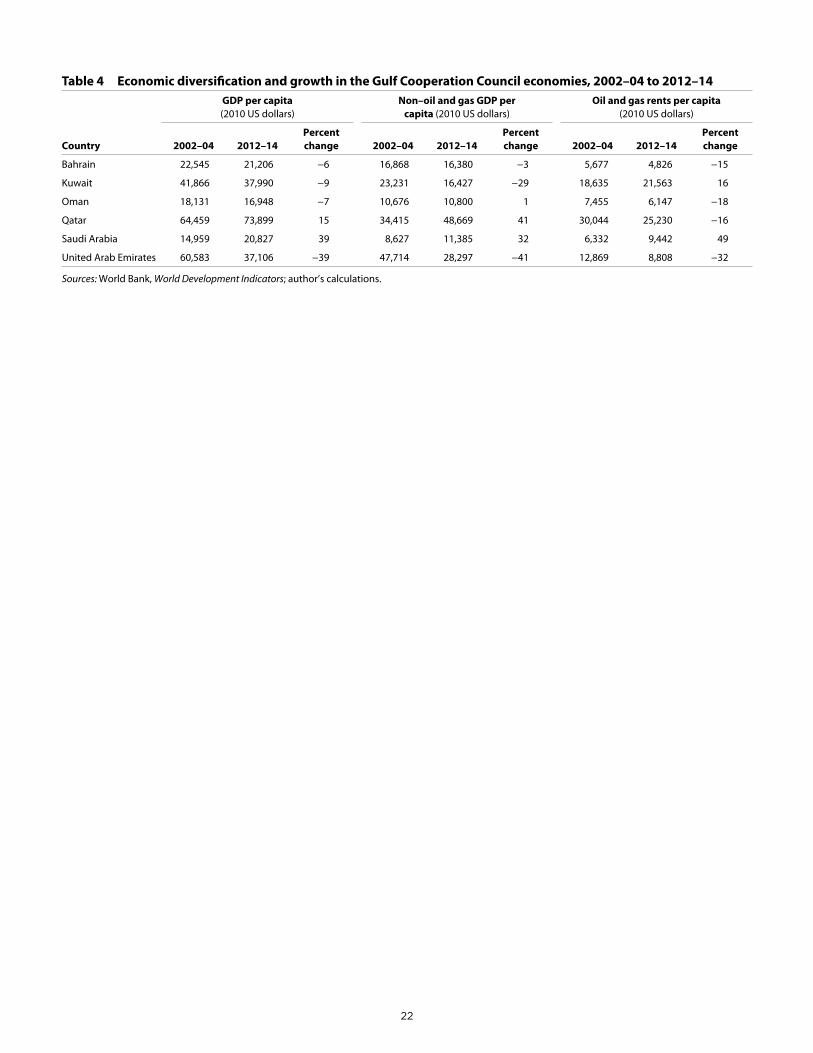
22 234 5
Table 4 Economic diversification and growth in the Gulf Cooperation Council economies, 2002–04 to 2012–14GDP per capita (2010 US dollars)
Non–oil and gas GDP per capita (2010 US dollars)
Oil and gas rents per capita (2010 US dollars)
Country 2002–04 2012–14Percent change 2002–04 2012–14
Percent change 2002–04 2012–14
Percent change
Bahrain 22,545 21,206 −6 16,868 16,380 −3 5,677 4,826 −15
Kuwait 41,866 37,990 −9 23,231 16,427 −29 18,635 21,563 16
Oman 18,131 16,948 −7 10,676 10,800 1 7,455 6,147 −18
Qatar 64,459 73,899 15 34,415 48,669 41 30,044 25,230 −16
Saudi Arabia 14,959 20,827 39 8,627 11,385 32 6,332 9,442 49
United Arab Emirates 60,583 37,106 −39 47,714 28,297 −41 12,869 8,808 −32
Sources: World Bank, World Development Indicators; author’s calculations.
4 5
Table A.1 Factor analysis of governance capacityFactor Eigenvalue Difference Proportion Cumulative
1 2.383 2.388 1.036 1.036
2 −0.006 0.062 −0.002 1.029
3 −0.067 . −0.029 1.000
N = 40
Retained factors = 1
Variable Factor loadings Uniqueness
Government effectiveness, 2002–04 0.941 0.115
Rule of law, 2002–04 0.962 0.075
Political stability/absence of violence, 2002–14 0.757 0.427
22 23
APPENDIX A
Table A.1 reports the results of factor analysis in which the scores for government effectiveness, rule of law, and political stability/absence of violence are the manifest variables.
Factors with eigenvalues greater than 1 are significant and explain an important amount of variability. Only the first factor is retained, and it explains virtually all (proportion > 1.0) of the common variance in the manifest variables. The first factor is the factor referred to as governance capacity.
4 5
Table A.1 Factor analysis of governance capacityFactor Eigenvalue Difference Proportion Cumulative
1 2.383 2.388 1.036 1.036
2 −0.006 0.062 −0.002 1.029
3 −0.067 . −0.029 1.000
N = 40
Retained factors = 1
Variable Factor loadings Uniqueness
Government effectiveness, 2002–04 0.941 0.115
Rule of law, 2002–04 0.962 0.075
Political stability/absence of violence, 2002–14 0.757 0.427
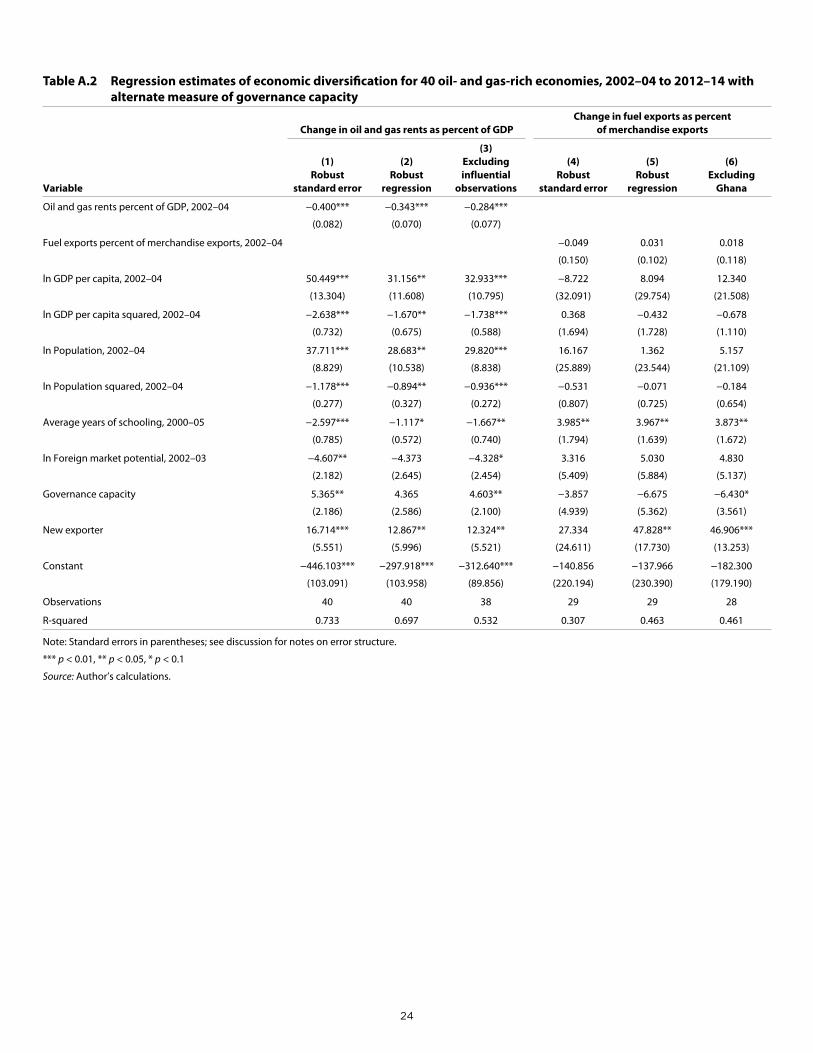
24 256
Table A.2 Regression estimates of economic diversification for 40 oil- and gas-rich economies, 2002–04 to 2012–14 with alternate measure of governance capacity
Variable
Change in oil and gas rents as percent of GDPChange in fuel exports as percent
of merchandise exports
(1)Robust
standard error
(2)Robust
regression
(3)Excluding influential
observations
(4)Robust
standard error
(5)Robust
regression
(6)Excluding
Ghana
Oil and gas rents percent of GDP, 2002–04 −0.400***
(0.082)
−0.343***
(0.070)
−0.284***
(0.077)
Fuel exports percent of merchandise exports, 2002–04 −0.049
(0.150)
0.031
(0.102)
0.018
(0.118)
ln GDP per capita, 2002–04 50.449***
(13.304)
31.156**
(11.608)
32.933***
(10.795)
−8.722
(32.091)
8.094
(29.754)
12.340
(21.508)
ln GDP per capita squared, 2002–04 −2.638***
(0.732)
−1.670**
(0.675)
−1.738***
(0.588)
0.368
(1.694)
−0.432
(1.728)
−0.678
(1.110)
ln Population, 2002–04 37.711***
(8.829)
28.683**
(10.538)
29.820***
(8.838)
16.167
(25.889)
1.362
(23.544)
5.157
(21.109)
ln Population squared, 2002–04 −1.178***
(0.277)
−0.894**
(0.327)
−0.936***
(0.272)
−0.531
(0.807)
−0.071
(0.725)
−0.184
(0.654)
Average years of schooling, 2000–05 −2.597***
(0.785)
−1.117*
(0.572)
−1.667**
(0.740)
3.985**
(1.794)
3.967**
(1.639)
3.873**
(1.672)
ln Foreign market potential, 2002–03 −4.607**
(2.182)
−4.373
(2.645)
−4.328*
(2.454)
3.316
(5.409)
5.030
(5.884)
4.830
(5.137)
Governance capacity 5.365**
(2.186)
4.365
(2.586)
4.603**
(2.100)
−3.857
(4.939)
−6.675
(5.362)
−6.430*
(3.561)
New exporter 16.714***
(5.551)
12.867**
(5.996)
12.324**
(5.521)
27.334
(24.611)
47.828**
(17.730)
46.906***
(13.253)
Constant −446.103***
(103.091)
−297.918***
(103.958)
−312.640***
(89.856)
−140.856
(220.194)
−137.966
(230.390)
−182.300
(179.190)
Observations 40 40 38 29 29 28
R-squared 0.733 0.697 0.532 0.307 0.463 0.461
Note: Standard errors in parentheses; see discussion for notes on error structure.
*** p < 0.01, ** p < 0.05, * p < 0.1
Source: Author’s calculations.
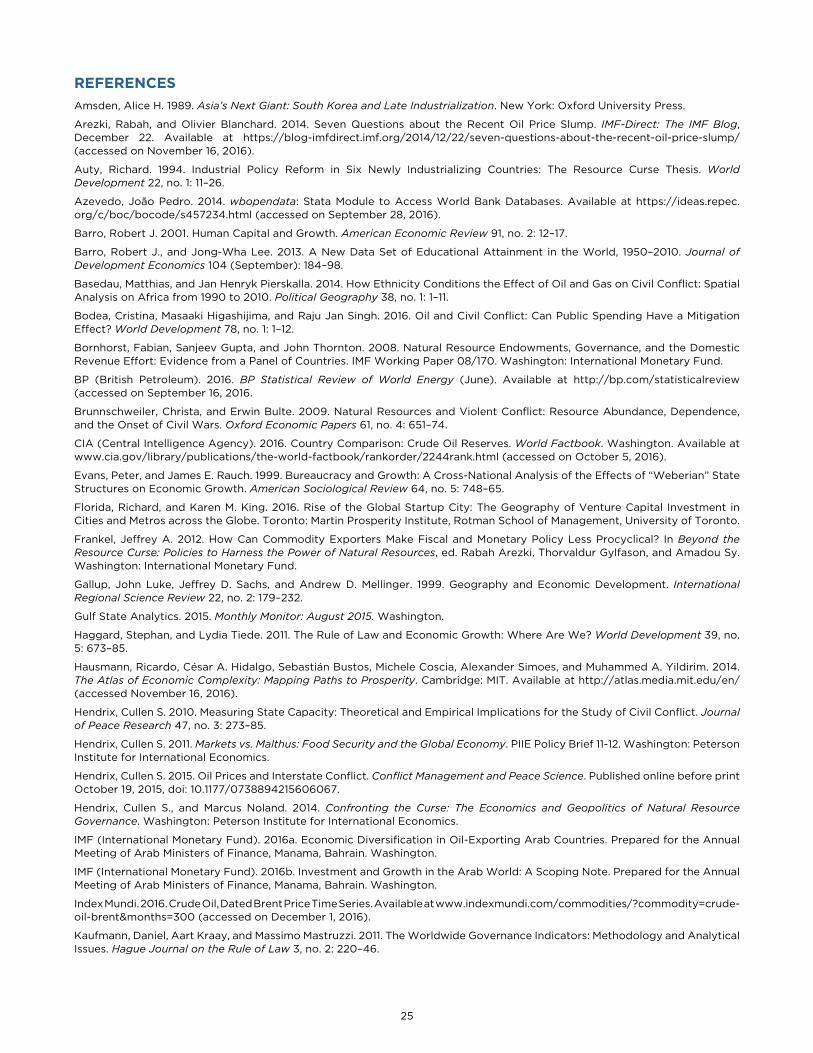
REFERENCESAmsden, Alice H. 1989. Asia’s Next Giant: South Korea and Late Industrialization. New York: Oxford University Press.
Arezki, Rabah, and Olivier Blanchard. 2014. Seven Questions about the Recent Oil Price Slump. IMF-Direct: The IMF Blog, December 22. Available at https://blog-imfdirect.imf.org/2014/12/22/seven-questions-about-the-recent-oil-price-slump/ (accessed on November 16, 2016).
Auty, Richard. 1994. Industrial Policy Reform in Six Newly Industrializing Countries: The Resource Curse Thesis. World Development 22, no. 1: 11–26.
Azevedo, João Pedro. 2014. wbopendata: Stata Module to Access World Bank Databases. Available at https://ideas.repec.org/c/boc/bocode/s457234.html (accessed on September 28, 2016).
Barro, Robert J. 2001. Human Capital and Growth. American Economic Review 91, no. 2: 12–17.
Barro, Robert J., and Jong-Wha Lee. 2013. A New Data Set of Educational Attainment in the World, 1950–2010. Journal of Development Economics 104 (September): 184–98.
Basedau, Matthias, and Jan Henryk Pierskalla. 2014. How Ethnicity Conditions the Effect of Oil and Gas on Civil Conflict: Spatial Analysis on Africa from 1990 to 2010. Political Geography 38, no. 1: 1–11.
Bodea, Cristina, Masaaki Higashijima, and Raju Jan Singh. 2016. Oil and Civil Conflict: Can Public Spending Have a Mitigation Effect? World Development 78, no. 1: 1–12.
Bornhorst, Fabian, Sanjeev Gupta, and John Thornton. 2008. Natural Resource Endowments, Governance, and the Domestic Revenue Effort: Evidence from a Panel of Countries. IMF Working Paper 08/170. Washington: International Monetary Fund.
BP (British Petroleum). 2016. BP Statistical Review of World Energy (June). Available at http://bp.com/statisticalreview (accessed on September 16, 2016.
Brunnschweiler, Christa, and Erwin Bulte. 2009. Natural Resources and Violent Conflict: Resource Abundance, Dependence, and the Onset of Civil Wars. Oxford Economic Papers 61, no. 4: 651–74.
CIA (Central Intelligence Agency). 2016. Country Comparison: Crude Oil Reserves. World Factbook. Washington. Available at www.cia.gov/library/publications/the-world-factbook/rankorder/2244rank.html (accessed on October 5, 2016).
Evans, Peter, and James E. Rauch. 1999. Bureaucracy and Growth: A Cross-National Analysis of the Effects of “Weberian” State Structures on Economic Growth. American Sociological Review 64, no. 5: 748–65.
Florida, Richard, and Karen M. King. 2016. Rise of the Global Startup City: The Geography of Venture Capital Investment in Cities and Metros across the Globe. Toronto: Martin Prosperity Institute, Rotman School of Management, University of Toronto.
Frankel, Jeffrey A. 2012. How Can Commodity Exporters Make Fiscal and Monetary Policy Less Procyclical? In Beyond the Resource Curse: Policies to Harness the Power of Natural Resources, ed. Rabah Arezki, Thorvaldur Gylfason, and Amadou Sy. Washington: International Monetary Fund.
Gallup, John Luke, Jeffrey D. Sachs, and Andrew D. Mellinger. 1999. Geography and Economic Development. International Regional Science Review 22, no. 2: 179–232.
Gulf State Analytics. 2015. Monthly Monitor: August 2015. Washington.
Haggard, Stephan, and Lydia Tiede. 2011. The Rule of Law and Economic Growth: Where Are We? World Development 39, no. 5: 673–85.
Hausmann, Ricardo, César A. Hidalgo, Sebastián Bustos, Michele Coscia, Alexander Simoes, and Muhammed A. Yildirim. 2014. The Atlas of Economic Complexity: Mapping Paths to Prosperity. Cambridge: MIT. Available at http://atlas.media.mit.edu/en/ (accessed November 16, 2016).
Hendrix, Cullen S. 2010. Measuring State Capacity: Theoretical and Empirical Implications for the Study of Civil Conflict. Journal of Peace Research 47, no. 3: 273–85.
Hendrix, Cullen S. 2011. Markets vs. Malthus: Food Security and the Global Economy. PIIE Policy Brief 11-12. Washington: Peterson Institute for International Economics.
Hendrix, Cullen S. 2015. Oil Prices and Interstate Conflict. Conflict Management and Peace Science. Published online before print October 19, 2015, doi: 10.1177/0738894215606067.
Hendrix, Cullen S., and Marcus Noland. 2014. Confronting the Curse: The Economics and Geopolitics of Natural Resource Governance. Washington: Peterson Institute for International Economics.
IMF (International Monetary Fund). 2016a. Economic Diversification in Oil-Exporting Arab Countries. Prepared for the Annual Meeting of Arab Ministers of Finance, Manama, Bahrain. Washington.
IMF (International Monetary Fund). 2016b. Investment and Growth in the Arab World: A Scoping Note. Prepared for the Annual Meeting of Arab Ministers of Finance, Manama, Bahrain. Washington.
Index Mundi. 2016. Crude Oil, Dated Brent Price Time Series. Available at www.indexmundi.com/commodities/?commodity=crude-oil-brent&months=300 (accessed on December 1, 2016).
Kaufmann, Daniel, Aart Kraay, and Massimo Mastruzzi. 2011. The Worldwide Governance Indicators: Methodology and Analytical Issues. Hague Journal on the Rule of Law 3, no. 2: 220–46.
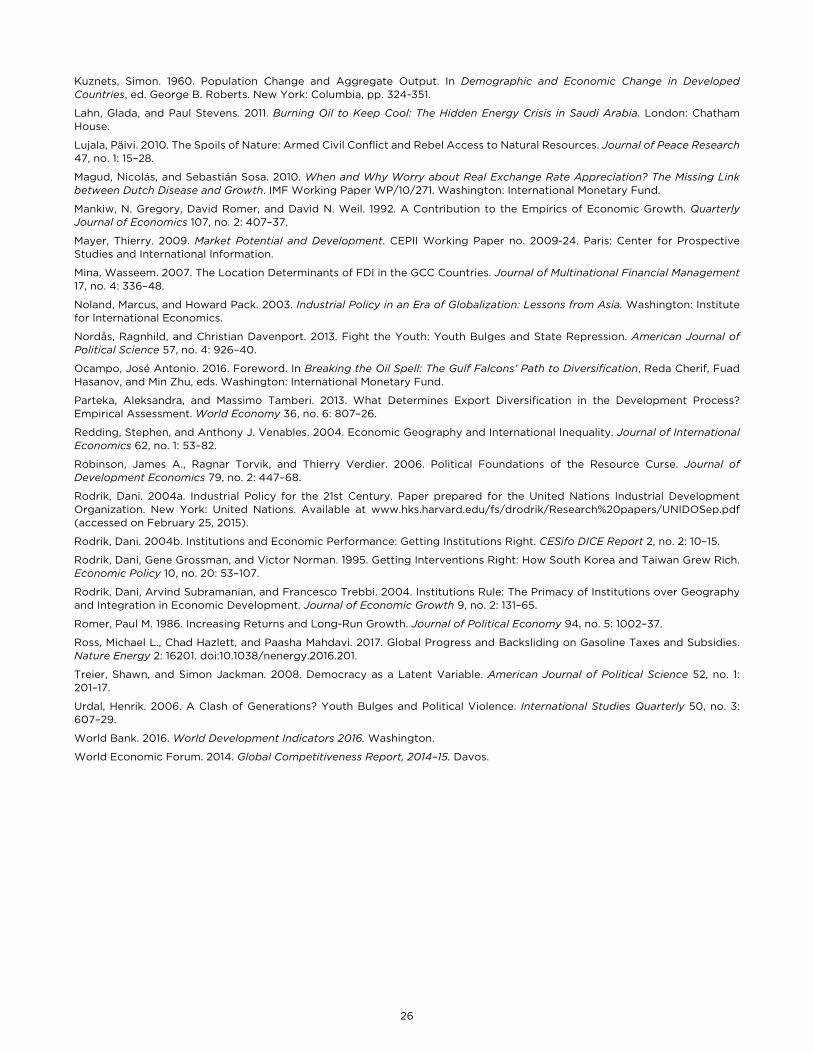
26
Kuznets, Simon. 1960. Population Change and Aggregate Output. In Demographic and Economic Change in Developed Countries, ed. George B. Roberts. New York: Columbia, pp. 324-351.
Lahn, Glada, and Paul Stevens. 2011. Burning Oil to Keep Cool: The Hidden Energy Crisis in Saudi Arabia. London: Chatham House.
Lujala, Päivi. 2010. The Spoils of Nature: Armed Civil Conflict and Rebel Access to Natural Resources. Journal of Peace Research 47, no. 1: 15–28.
Magud, Nicolás, and Sebastián Sosa. 2010. When and Why Worry about Real Exchange Rate Appreciation? The Missing Link between Dutch Disease and Growth. IMF Working Paper WP/10/271. Washington: International Monetary Fund.
Mankiw, N. Gregory, David Romer, and David N. Weil. 1992. A Contribution to the Empirics of Economic Growth. Quarterly Journal of Economics 107, no. 2: 407–37.
Mayer, Thierry. 2009. Market Potential and Development. CEPII Working Paper no. 2009-24. Paris: Center for Prospective Studies and International Information.
Mina, Wasseem. 2007. The Location Determinants of FDI in the GCC Countries. Journal of Multinational Financial Management 17, no. 4: 336–48.
Noland, Marcus, and Howard Pack. 2003. Industrial Policy in an Era of Globalization: Lessons from Asia. Washington: Institute for International Economics.
Nordås, Ragnhild, and Christian Davenport. 2013. Fight the Youth: Youth Bulges and State Repression. American Journal of Political Science 57, no. 4: 926–40.
Ocampo, José Antonio. 2016. Foreword. In Breaking the Oil Spell: The Gulf Falcons’ Path to Diversification, Reda Cherif, Fuad Hasanov, and Min Zhu, eds. Washington: International Monetary Fund.
Parteka, Aleksandra, and Massimo Tamberi. 2013. What Determines Export Diversification in the Development Process? Empirical Assessment. World Economy 36, no. 6: 807–26.
Redding, Stephen, and Anthony J. Venables. 2004. Economic Geography and International Inequality. Journal of International Economics 62, no. 1: 53–82.
Robinson, James A., Ragnar Torvik, and Thierry Verdier. 2006. Political Foundations of the Resource Curse. Journal of Development Economics 79, no. 2: 447–68.
Rodrik, Dani. 2004a. Industrial Policy for the 21st Century. Paper prepared for the United Nations Industrial Development Organization. New York: United Nations. Available at www.hks.harvard.edu/fs/drodrik/Research%20papers/UNIDOSep.pdf (accessed on February 25, 2015).
Rodrik, Dani. 2004b. Institutions and Economic Performance: Getting Institutions Right. CESifo DICE Report 2, no. 2: 10–15.
Rodrik, Dani, Gene Grossman, and Victor Norman. 1995. Getting Interventions Right: How South Korea and Taiwan Grew Rich. Economic Policy 10, no. 20: 53–107.
Rodrik, Dani, Arvind Subramanian, and Francesco Trebbi. 2004. Institutions Rule: The Primacy of Institutions over Geography and Integration in Economic Development. Journal of Economic Growth 9, no. 2: 131–65.
Romer, Paul M. 1986. Increasing Returns and Long-Run Growth. Journal of Political Economy 94, no. 5: 1002–37.
Ross, Michael L., Chad Hazlett, and Paasha Mahdavi. 2017. Global Progress and Backsliding on Gasoline Taxes and Subsidies. Nature Energy 2: 16201. doi:10.1038/nenergy.2016.201.
Treier, Shawn, and Simon Jackman. 2008. Democracy as a Latent Variable. American Journal of Political Science 52, no. 1: 201–17.
Urdal, Henrik. 2006. A Clash of Generations? Youth Bulges and Political Violence. International Studies Quarterly 50, no. 3: 607–29.
World Bank. 2016. World Development Indicators 2016. Washington.
World Economic Forum. 2014. Global Competitiveness Report, 2014–15. Davos.