Embed Size (px)
DESCRIPTION
Cultural Analytics Article Final
Citation preview

1
Lev Manovich
The Science of Culture? Social Computing, Digital Humanities and Cultural Analytics Studying Big Cultural Data: Social Computing and Digital Humanities I define Cultural Analytics as “the analysis of massive cultural data sets and flows using computational and visualization techniques,” I developed this concept in 2005, and in 2007 we established a research lab (Software Studies Initiative, softwarestudies.com) to start working on practical projects. The following are the examples of theoretical and practical questions that are driving our work:
What does it mean to represent “culture” by “data”? What are the unique possibilities offered by computational analysis of large cultural data in contrast to qualitative methods used in humanities and social science? How to use quantitative techniques to study the key cultural form of our era – interactive media? How can we combine computational analysis and visualization of large cultural data with qualitative methods, including "close reading”? (In other words, how to combine analysis of larger patterns with the analysis of individual artifacts and their details?) How can computational analysis do justice to variability and diversity of cultural artifacts and processes, rather than focusing on the "typical" and "most popular"?
Eight years later, the work of our lab has become only a tiny portion of the very large body of research. Thousands of researchers have already published tens of thousands of papers analyzing patterns in massive cultural datasets. First of all, this is data describing the activity on most popular social networks (Flickr, Instagram, YouTube, Twitter, etc.), user created content shared on these networks (tweets, images, video, etc.), and also users’ interactions with this content (likes, favorites, reshares, comments). Second, researchers also have started to analyze particular professional cultural areas and historical periods, such as website design, fashion photography, 20th–century popular music, 19th–century literature, etc. This work is carried out in two newly developed fields – Social Computing and Digital Humanities. Where does this leave Cultural Analytics? I think that it continues to be relevant as the intellectual program. As we will see, Digital Humanities and Social Computing carve their own domains in relation to the types of cultural data they study, but Cultural Analytics does not have these limitations. We are also not interested in choosing between humanistic vs. scientific goals and methodology, or subordinating one to another. Instead, we are interested combining both in the studies of cultures - focus on the particular, interpretation, and the past from the humanities and the focus on

2
the general, formal models, and predicting the future from the sciences. In this article I will discuss these and other characteristics of both approaches to the study of large cultural datasets as they developed until now, pointing out opportunities and ideas that have not yet been explored. Digital Humanities scholars use computers to analyze mostly historical artifacts created by professionals. The examples are novels written by professional writers in the 19th century. Time wise, they stop at the historical boundaries defined by copyright laws in their countries. For example, according to the U.S. copyright law, the works published in the last 95 years are automatically copyrighted. (So, for example, as of 2015, everything created after 1920 is copyrighted, unless it is recent digital content that uses Creative Commons licenses.) I understand the respect for the copyright laws – but it also means that digital humanists shut themselves out from studying the present. The field of Social Computing is thousands of times larger. Here the researchers with advanced degrees in computer science study online user-created content and interactions with this content. Note that this research is carried out not only by computer and information scientists who professionally identify themselves with “Social Computing” field,1 but also researchers in a number of other computer science fields such as Computer Multimedia, Computer Vision, Music Information Retrieval, Natural Language Processing, and Web Science. Therefore, social computing can be also used as an umbrella term for all computer science research that analyzes content and activity on social networks. The researchers deal with the data after 2004, when social networks and media sharing services started to become popular. (Since it takes 1-2 years to do research and publish a paper, typically a paper published in 2015 will use the data collected in 2012-2014.) The datasets are usually much larger than the ones used in digital humanities. Tens or hundreds of millions of posts, photos, or other items is not uncommon. Since the great majority of user-generated content is created by regular people rather than professionals, Social Computing studies the non-professional, vernacular culture by default. The scale of this research may be surprising to humanities and arts practitioners who may not realize how many people are working in computer science and related fields. For example, the search on Google Scholar for “twitter dataset algorithm” returned 102,000 papers, the search for “YouTube video dataset” returned 27,800 papers, and the search for “flickr images algorithm” returned 17,400 papers.2 Searching for “computational aesthetics dataset,” I got 14,100 results.3 Even if the actual numbers are much smaller, this is still impressive. Obviously not all these publications directly ask cultural questions, but many do. 1 See the programs of the conferences in these fields for the range of topics they cover, for example: http://cscw.acm.org/2016/submit/; http://www.www2015.it/accepted-papers/. 2 https://scholar.google.com. 3 https://scholar.google.com.
3
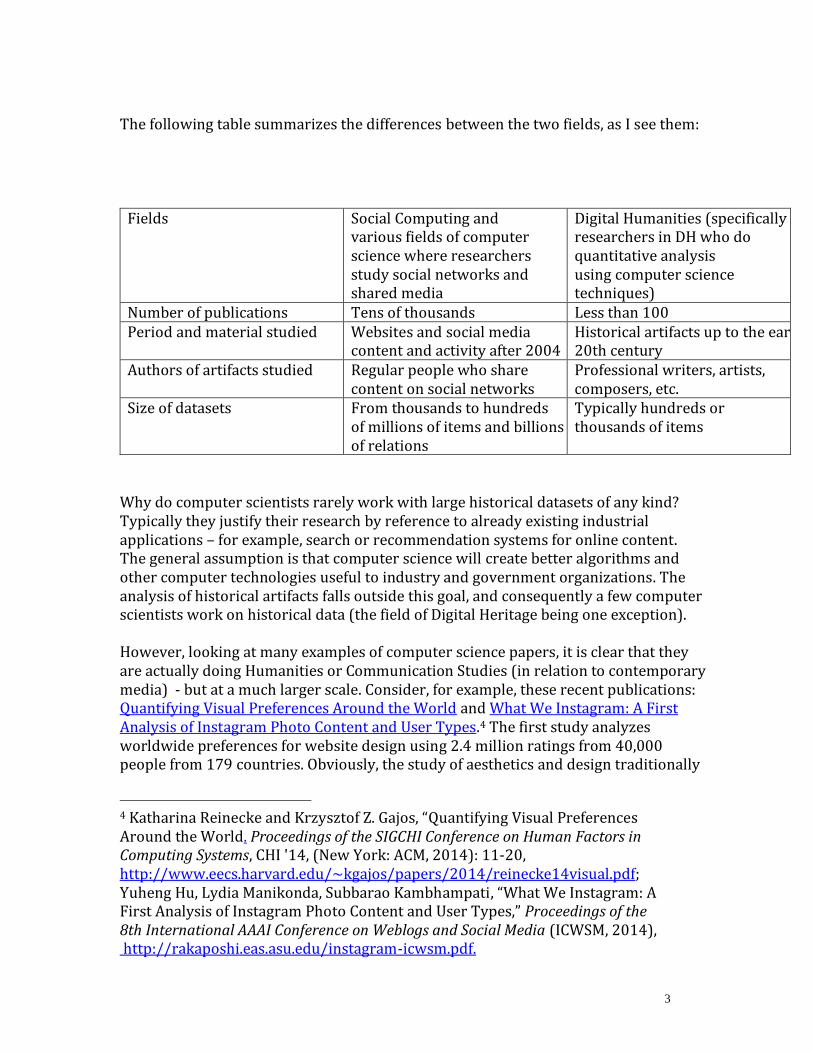
The following table summarizes the differences between the two fields, as I see them:
Fields Social Computing and various fields of computer science where researchers study social networks and shared media
Digital Humanities (specifically researchers in DH who do quantitative analysis using computer science techniques)
Number of publications Tens of thousands Less than 100 Period and material studied Websites and social media
content and activity after 2004 Historical artifacts up to the early 20th century
Authors of artifacts studied Regular people who share content on social networks
Professional writers, artists, composers, etc.
Size of datasets From thousands to hundreds of millions of items and billions of relations
Typically hundreds or thousands of items
Why do computer scientists rarely work with large historical datasets of any kind? Typically they justify their research by reference to already existing industrial applications – for example, search or recommendation systems for online content. The general assumption is that computer science will create better algorithms and other computer technologies useful to industry and government organizations. The analysis of historical artifacts falls outside this goal, and consequently a few computer scientists work on historical data (the field of Digital Heritage being one exception). However, looking at many examples of computer science papers, it is clear that they are actually doing Humanities or Communication Studies (in relation to contemporary media) - but at a much larger scale. Consider, for example, these recent publications: Quantifying Visual Preferences Around the World and What We Instagram: A First Analysis of Instagram Photo Content and User Types.4 The first study analyzes worldwide preferences for website design using 2.4 million ratings from 40,000 people from 179 countries. Obviously, the study of aesthetics and design traditionally
4 Katharina Reinecke and Krzysztof Z. Gajos, “Quantifying Visual Preferences Around the World. Proceedings of the SIGCHI Conference on Human Factors in Computing Systems, CHI '14, (New York: ACM, 2014): 11-20, http://www.eecs.harvard.edu/~kgajos/papers/2014/reinecke14visual.pdf; Yuheng Hu, Lydia Manikonda, Subbarao Kambhampati, “What We Instagram: A First Analysis of Instagram Photo Content and User Types,” Proceedings of the 8th International AAAI Conference on Weblogs and Social Media (ICWSM, 2014), http://rakaposhi.eas.asu.edu/instagram-icwsm.pdf.

4
was part of the humanities. The second study analyzed most frequent subjects of Instagram photos – a topic which can be compared to art historical studies of the genres in the 17th–century Dutch art. Another example is paper called What is Twitter, a Social Network or a News Media?.5 Published in 2010, it has since was cited 3284 times in other computer science publications.6 It was the first large-scale analysis of Twitter social network using 106 million tweets by 41.7 million users. The study looked in particular at trending topics, showing “what categories trending topics are classified into, how long they last, and how many users participate.” This is a classical question of Communication Studies, going back to the pioneering work of Paul F. Lazarsfeld and his colleagues in the 1940s who manually counted the topics of radio broadcasts. But, given that Twitter and other micro-blogging services represent a new form of media – like oil painting, printed books, and photography before, understanding the specificity of Twitter as a medium is also a topic for humanities. A small number of publications lie at the intersection of Digital Humanities and Social Computing. They take computational methods and algorithms developed by computer scientists to study contemporary user-generated content and media and apply them to historical artifacts created by professionals (i.e., professional artists, writers, editors, musicians or filmmakers). The prominent examples are Toward Automated Discovery of Artistic Influence7, Infectious Texts: Modeling Text Reuse in Nineteenth-Century Newspapers (David A. Smith, Ryan Cordell, and Elizabeth Maddock Dillon, 2013)8, Measuring the Evolution of Contemporary Western Popular Music (Joan Serrà, Álvaro Corral, Marián Boguñá, Martín Haro & Josep Ll. Arcos, 2012)9, and
5 Haewoon Kwak, Changhyun Lee, Hosung Park, Sue Moon, “What is Twitter, a Social Network or a News Media?” Proceedings of the 19th International World Wide Web (WWW) Conference (ACM, 2014): 591-600, http://www.eecs.wsu.edu/~assefaw/CptS580-06/papers/2010-www-twitter.pdf. 6 https://scholar.google.com/citations?user=M6i3Be0AAAAJ&hl=en. 7 Babak Saleh, Kanako Abe, Ravneet Singh, Arora Ahmed Elgammal, “Toward Automated Discovery of Artistic Influence,” Multimedia Tools and Applications (Springler, 8/19/2014): 1-27, http://arxiv.org/abs/1408.3218. 8 David A. Smith, Ryan Cordell, and Elizabeth Maddock Dillon, “Infectious texts: Modeling text reuse in nineteenth-century newspapers,” Proceedings of 2013 IEEE Conference on Big Data (IEEE, 2013): 84-94, http://www.ccs.neu.edu/home/dasmith/infect-bighum-2013.pdf. 9 Joan Serrà, Álvaro Corral, Marián Boguñá, Martín Haro, Josep Ll. Arcos, “Measuring the Evolution of Contemporary Western Popular Music,” Nature Scientific Reports 2, article number: 521 (2012), http://www.nature.com/articles/srep00521.

5
Quicker, faster, darker: Changes in Hollywood film over 75 years. (James E Cutting, Kaitlin L Brunick, Jordan DeLong, Catalina Iricinschi, Ayse Candan, 2011).10 Until a few years ago, the only project that analyzed cultural history on a really large scale of millions of texts was carried out by scientists rather than by humanists. I am referring to N-Gram Viewer created in 2010 by Google scientists Jon Orwant and Will Brockman following the prototype by two Ph.D. students from Harvard in Biology and Applied Math. However, more recently, we see people in Digital Humanities scaling up the size of data they study. For example, in Mapping Mutable Genres in Structurally Complex Volumes literary scholar Ted Underwood and his collaborators analyzed 469,200 volumes from Trust Digital Library.11 Art historian Maximilian Schich and his colleagues analyzed the life trajectories of 120,000 notable historical individuals (A network framework of cultural history)12. And even larger historical datasets are becoming available in the areas of literature, photography, film, and TV – although they remain to be analyzed. In 2012 The New York City Municipal Archives released 870,000 digitized historic photos of NYC.13 In 2015 HathiTrust made available for research data extracted from 4,801,237 volumes (containing 1.8 billion pages).14 In the same year The Associated Press and British Movietone uploaded to YouTube 550,000 digitized news stories covering the period from 1895 to today.15 What is the importance of having such large cultural datasets? Can’t we simply use smaller samples? I believe that there are reasons. Firstly, to have a representative sample, we first need to have a much larger set of actual items from which to sample, or at least a good understanding of what this larger set includes. So, for example, if we want to create a representative sample of 20th–century films, we can use IMDb that contains information on 3.4 million films and TV shows (including separate episodes).16 Similarly, we can create a good sample of historical U.S. newspaper pages using Historical American Newspaper collection of millions of digitized pages from 10 James E Cutting, Kaitlin L Brunick, Jordan DeLong, Catalina Iricinschi, Ayse Candan, “Quicker, faster, darker: Changes in Hollywood film over 75 years,” i-Perception (2011), vol. 2: 569 – 576, http://people.psych.cornell.edu/~jec7/pubs/iperception.pdf. 11 Ted Underwood, Michael L. Black, Loretta Auvil, Boris Capitanu, “Mapping Mutable Genres in Structurally Complex Volumes,” Proceedings of the 2013 IEEE Conference on Big Data (IEEE, 2013), http://arxiv.org/abs/1309.3323. 12 Maximilian Schich, Chaoming Song, Yong-Yeol Ahn, Alexander Mirsky, Mauro Martino, Albert-László Barabási, Dirk Helbing, “A network framework of cultural history,” Science 1 August 2014: 345 (6196): 558-562, http://www.uvm.edu/~cdanfort/csc-reading-group/schich-science-2014.pdf. 13 http://www.theatlantic.com/photo/2012/04/historic-photos-from-the-nyc-municipal-archives/100286/. 14 https://sharc.hathitrust.org/features, retreived 8/20/2015. 15 http://www.ap.org/content/press-release/2015/ap-makes-one-million-minutes-of-history-available-on-youtube. 16 "Stats". IMDb. Retrieved August 10, 2015.

6
The Library of Congress.17 But in many other cultural fields, such larger datasets do not exist, and without them, it may be impossible to construct representative samples. Here is the second reason. Assuming that we can construct a representative sample of a cultural field, we can use it to find general trends and patterns. For example, in the already mentioned paper What We Instagram: A First Analysis of Instagram Photo Content and User Types18, three computer scientists analyzed 1000 Instagram photos and came up with eight most frequent categories (selfie, friends, fashion, food, gadget, activity, pet, captioned photos). The sample of 1000 photos was randomly selected from a larger set of photos shared by 95,343 unique users. It is possible that these eight categories are also most popular among all Instagram photos shared worldwide at the time when the scientists did their study. However, as we saw from our projects where we analyzed Instagram photos in different cities and their parts (for example, the center of Kyiv during 2014 Ukrainian Revolution in The Exceptional and the Everyday19), people also share many other types of images. Depending on the geographic area and time period, some of these types may replace the top eight in popularity. In other words, while a small sample allows finding the "typical" or "most popular," it does not reveal what I call “content islands” – types of coherent content with particular semantic and/or aesthetic characteristics shared in moderate numbers.
Can We Study Everything ?
When I first started to think about Cultural Analytics in 2005, both Digital Humanities and Social Computing were just getting started as research fields. I felt the need to introduce this new term to signal that our lab’s work will not be simply a part of digital humanities or social computing, but will cover subject matter studied in both fields. Like digital humanists, we are interested in analyzing historical artifacts – but we are also equally interested in contemporary digital visual culture (e.g., Instagram). Also, we are equally interested in professional culture, artifacts created by dedicated non-professionals and artists outside of the art world (e.g., deviantart.com, “the largest online social network for artists and art enthusiasts”20) and accidental creators (for example, people who once in a while upload their photos to social media networks). Like computational social scientists and computer scientists, we are also attracted to the study of society using social media and social phenomena specific to social networks. An example of the former is finding similar neighborhoods in the city using
17 http://chroniclingamerica.loc.gov/about/. 18 ““What We Instagram: A First Analysis of Instagram Photo Content and User Types.” 19 Lev Manovich, Mehrdad Yazdani, Alise Tifentale, Jay Chow, The Exceptional and the Everyday: 144 hours in Kyiv (2014), http://www.the-everyday.net/. 20 http://about.deviantart.com/, retreived 8/22/2015.

7
social media activity, as in The Livehoods Project: Utilizing Social Media to Understand the Dynamics of a City.21 An example of the latter is analyzing patterns of information diffusion online, as in Delayed information cascades in Flickr: Measurement, analysis, and modeling.22 However, if Social Computing focuses on the social in social networks, Cultural Analytics focuses on the cultural. (Therefore, the most relevant part of social sciences for Cultural Analytics is sociology of culture, and only after that sociology and economics.) We believe that the web and social networks content and user activities give us the unprecedented opportunity to describe, model, and simulate global cultural universe while questioning and rethinking basic concepts and tools of humanities that were developed to analyze “small cultural data” (i.e., highly selective and non-representative cultural samples). In the very influential definition by British cultural critic Matthew Arnold (1869), culture is “the best that has been thought and said in the world.”23 Academic humanities have largely followed this definition. And when they started to revolt against their canons and to include the works of previously excluded people (women, non-whites, non-Western authors, queer, etc.), they often included only “the best” created by those who were previously excluded. Cultural Analytics is interested in everything created by everybody. In this, we are approaching culture the way linguists study languages or biologists who study the life on earth. Ideally, we want to look at every cultural manifestation, rather than selective samples. (This more systematic perspective is not dissimilar to that of cultural anthropology.) The larger inclusive scope combining professional and vernacular, historical and contemporary is exemplified by the range of projects we worked in our lab on since 2008. We have analyzed historical, professionally created cultural content in all Time magazine covers (1923-2009); paintings by Vincent van Gogh, Piet Mondrian, and Mark Rothko; 20,000 photographs from the collection of Museum of Modern Art in New York (MoMA); one million manga pages from 883 manga series published in the last 30 years. Our analysis of contemporary vernacular content includes Phototrails (the comparison of visual signatures of 13 global cities using 2.3 million Instagram photos)24, The Exceptional and the Everyday: 144 Hours in Kyiv (the 21 Justin Cranshaw, Raz Schwartz, Jason I. Hong, Norman Sadeh, “The Livehoods Project: Utilizing Social Media to Understand the Dynamics of a City,” The 6th International AAAI Conference on Weblogs and Social Media (Dublin, 2012), https://s3.amazonaws.com/livehoods/livehoods_icwsm12.pdf. 22 Meeyoung Cha, Fabrício Benevenuto, Yong-Yeol Ahn, Krishna P. Gummadi, “Delayed information cascades in Flickr: Measurement, analysis, and modeling,” Computer Networks 56 (2012): 1066–1076, http://200.131.208.43/bitstream/123456789/2022/1/ARTIGO_DelayedInformationCascades.pdf. 23 Matthew Arnold. Culture and Anarchy (London: 1869), http://www.library.utoronto.ca/utel/nonfiction_u/arnoldm_ca/ca_all.html. 24 Nadav Hochman, Lev Manovich, Jay Chow, Phototrails (2013), http://phototrails.net/.

8
analysis of Instagram images shared in Kyiv during the 2014 Ukrainian Revolution)25 and On Broadway (the interactive installation exploring the Broadway in NYC using 40 million user-generated images and data points)26. We also have looked at contemporary amateur or semi-professional content (one million artworks shared by 30,000 semi-professional artists on www.deviantart.com.) Currently we are exploring a dataset of 265 million images tweeted worldwide during 2011-2014. In summary, in our work we don’t draw a boundary between (smaller) historical professional artifacts and (bigger) online digital content created by non-professionals. Instead, we freely take from both. Obviously, social networks today do not include every human being, and the content shared is sometimes specific to these networks (e.g., Instagram selfies), as opposed to something which existed before hand. This content is also shaped by the tools and interfaces of technologies used for its creation, capturing, editing, and sharing (e.g., Instagram filters, or its collage layouts offered by third party apps such as InstaCollage). The kind of cultural actions available are also defined by these technologies. For example, in social networks you can “like,” share, or comment on a piece of content. In other words, like in quantum physics, here the instrument can influence the phenomena we want to study. All this needs to be carefully considered when we study user-generated content and user activities. While social networks APIs make it easy to access massive amounts of contents, it is not “everything” by “everybody.” (API stands for Application User Interface. It’s a mechanism that allows anybody to download massive amounts of user content from all major social networks. All computer science publications use APIs to download the data they analyze.) The General and the Particular When humanities were concerned with “small data” (content created by single authors or small groups), the sociological perspective was only one of many options for interpretation - unless you were a Marxist. But once we start studying online content and activities of millions of people, this perspective becomes almost inevitable. In the case of “big cultural data,” the cultural and the social closely overlap. Large groups of people from different countries and socio-economic backgrounds (sociological perspective) share images, video, texts, and make particular aesthetic choices in doing this (humanities perspective). Because of this overlap, the kinds of questions investigated in sociology of culture of the 20th century (exemplified by its most influential researcher Pierre Bourdieu27) are directly relevant for Cultural Analytics. 25 Lev Manovich, Mehrdad Yazdani, Alise Tifentale, Jay Chow, The Exceptional and the Everyday: 144 hours in Kyiv (2014), http://www.the-everyday.net/. 26 Daniel Goddemeyer, Moritz Stefaner, Dominikus Baur, Lev Manovich, On Broadway (2014), http://on-broadway.net/. 27 Pierre Bourdieu, Distinctions. A Social Critique of the Judgment of Taste.

9
Given that certain demographic categories have become taken for granted in our thinking about society, it appears natural today to group people into these categories and compare them in relation to social, economic, or cultural indicators. For example, Pew Research Center regularly reports the statistics of popular social platform use, breaking their user sample by demographics such as gender, ethnicity, age, education, income, and place of living (urban, suburban, and rural.)28 So if we are interested in various details of social media activities, such as types of images shared and liked, filters used, or selfie poses, it is logical to study the differences between people from different countries, ethnicities, socio-economic backgrounds, or levels of technical expertise. The earlier research in social computing did not, and most of the current work still does not consider such differences, treating all users as one undifferentiated pool of “humanity” – but more recently we start seeing publications that break users into demographic groups. While this is a very good move, we also want to be careful in how far we want to go. Humanistic analysis of cultural phenomena and processes using quantitative methods should not be simply reduced to sociology, i.e. considering common characteristics and behaviors of human groups only. Sociological tradition is concerned with finding and describing the general patterns in human behavior, rather than with analyzing or predicting the behaviors of particular individuals. Cultural Analytics is also interested in patterns that can be derived from the analysis of large cultural datasets. However, ideally the analysis of the larger patterns will also lead us to particular individual cases, i.e. individual creators, their particular creations, or cultural behaviors. For instance, the computational analysis of all photos made by a photographer during her long career may lead us to the outliers – the photos that are most different from all the rest. Similarly, we may analyze millions of Instagram images shared in multiple cities to discover the types of images unique to each city (this example comes from current research in our lab). In other words, we may combine the concern of social science, and sciences in general, with the general and the regular, and the concern of humanities with individual and particular. (After all, all great artists in history of art were outliers in comparison to their contemporaries). The just described examples of analyzing massive datasets to zoom in on the unique items illustrate one way of doing this, but it is not the only way. The Science of Culture? The goal of science is to explain the phenomena and come with compact mathematical models that describe how these phenomena work. The three laws of Newton’s physics (Harvard University Press, 1984). 28 Pew Research Center, “Demographics of Key Social Networking Platforms,” January 9, 2015, http://www.pewinternet.org/2015/01/09/demographics-of-key-social-networking-platforms-2/

10
is a perfect example of how classical science was approaching this goal. Since the middle of the 19th century, a number of new scientific fields adopted a new probabilistic approach. The first example was the statistical distribution describing likely speeds of gas particles presented by Maxwell in 1860 (now it is called the Maxwell–Boltzmann distribution). And what about the social science? Throughout the 18th and 19th centuries, many thinkers were expecting that, similarly to physics, the quantitative laws governing societies will also be eventually found.29 This never happened. (The closest 19th–century social thought came to postulating objective laws were in the works of Karl Marx). Instead, when positivist social science started to develop in the late 19th and early 20th century, it adopted probabilistic approach. So instead of looking for deterministic laws of society, social scientists study correlations between measurable characteristics and model the relations between “dependent” and “independent” variables using various statistical techniques. After deterministic and probabilistic paradigms in science, the next paradigm was computational simulation – running models on computers to simulate the behavior of systems. The first large-scale computer simulation was created in the 1940s by Manhattan Project to model a nuclear explosion. Subsequently, simulation was adapted in many hard sciences, and in the 1990s it was also taken up in the social sciences. In the early 21st century, the volume of digital online content and user interactions allows us to think of a possible “science of culture.” For example, by the summer of 2015, Facebook users were sharing 400 million photos and sending 45 billion messages daily.30 This scale is still much smaller than that of atoms and molecules – for example, 1cm³ of water contains 3.33 *10^22 molecules. However, it is already bigger than the numbers of neurons in the whole nervous system of an average adult estimated at 86 billion. But since the science now includes a few fundamental approaches to studying and understanding the phenomena – deterministic laws, statistical models, and simulation – which of them a hypothetical science of culture should adapt? Looking at the papers of computer scientists who are studying social media datasets, it is clear that their default approach is statistics.31 They describe social media data and user behavior in terms of probabilities. This includes creation of statistical models – mathematical equations that specify the relations between variables that may be described using probability distributions rather than specific values. A 29 Philip Ball, Critical Mass (London: Arrow Books, 2004): 69-71. 30 http://expandedramblings.com/index.php/by-the-numbers-17-amazing-facebook-stats/15/, retreived 7/24/2015. 31 Computer scientists also use many recently developed methods including techniques of data mining and machine learning that were not part of 20th century statistics. I am discussing these differences in “Data Science and Digital Art History,” International Journal for Digital Art History, issue 1 (2015), https://journals.ub.uni-heidelberg.de/index.php/dah/article/view/21631.
11
majority of papers today also use supervised machine learning – an automatic creation of models that can classify or predict the values of the new data using already existing examples. In both cases, a model can only account for part of the data, and this is typical of the statistical approach. Computer scientists studying social media use statistics differently than social scientists. The latter want to explain social, economic or political phenomena (for example, the effect of family background on children’s educational performance). Computer scientists are generally not concerned with explaining patterns in social media they discover by referencing some external social, economic or technological factors. Instead, they typically either analyze social media phenomena internally, or try to predict the outside phenomena using information extracted from social media datasets. The example of the former is a statistical description of how many favorites a photo on Flickr may receive on the average after a certain period of time.32 The example of the latter is the Google Flu Trends service that predicts flu activity using a combination of Google search data and CDC (U.S. Centers for Disease Control and Prevention) official flu data.33 The difference between deterministic laws and non-deterministic models is that the latter only describe probabilities and not certainties. The laws of classical mechanics apply to any macroscopic objects. In contrast, a probabilistic model for predicting number of favorites for a Flickr photo as a function of time since it was uploaded cannot tell us exactly the numbers of favorites for any particular photo. It only describes the overall trend. This seems to be the appropriate method for a “science of culture.” If instead we start postulating deterministic laws of human cultural activity, what happens to the idea of free will? Even in the case of seemingly pretty automatic cultural behavior (people favoring photos on social networks with certain characteristics such as pretty landscapes, cute pets, or posing young females), we don’t want to reduce humans to mechanical automata for passing of memes. The current focus on probabilistic models in studying online activity leaves out the third scientific paradigm – simulation. As far as I know, simulation has not yet been explored in either Social Computing or Digital Humanities as a tool to study user-generated content, its topics, types of images, etc. If in 2009 scientists at IBM's Almaden research center simulated human visual cortex using 1.6 billion virtual with 9 trillion synapses34, why can’t we think of simulating, for instance, all content produced yearly by users of Instagram? Or all content shared by all users of major social networks? Or the categories of images people share? The point of such simulations will be not to get everything right or to precisely predict what people will be sharing next year. Instead, we can follow the authors of the influential textbook 32 See “Delayed information cascades in Flickr.” 33 http://googleresearch.blogspot.com/2014/10/google-flu-trends-gets-brand-new-engine.html, 10/31/2014. 34 http://www.popularmechanics.com/technology/a4948/4337190/, 12/17/2009.

12
Simulation for the Social Scientist when they state that one of the purposes of simulation is “to obtain a better understanding of some features of the social world” and that simulation can be used as “a method of theory development.”35 (Emphasis mine – LM.) Since computer simulation requires developing an explicit and precise model of the phenomena, thinking of how cultural processes can be simulated can help us to develop more explicit and detailed theories than we use normally. (For the example of how agent-based simulation can be used to study the evolution of human societies, see War, space, and the evolution of Old World complex societies.36) And what about “big data”? Does not it represent a new paradigm in science with its own new research methods? This is a complex question that deserves its own article. (If we are talking about research methods and techniques, the developments in computer hardware in the 2000s, including the increasing CPU speed and RAM size, and the use of GPUs and computing clusters, were probably more important than availability of larger data sets. And while use of machine learning with large training datasets achieved remarkable successes, in most cases it does not provide explanations of the phenomena.) However, as a way of conclusion, I do want to mention one concept interesting for humanities that we can borrow from big data analytics and then push in a new direction. The 20th–century social science was working on what we can call “long data.”37 That is, the number of cases was typically many times bigger than the number of variables being analyzed. For example, imagine that we surveyed 2000 people asking them about their income, family educational achievement and their years of education. As a result, we have 2000 cases and three variables. We can then examine correlations between these variables, or look for clusters in the data, or perform other types of statistical analysis. The beginnings of social sciences are characterized by the most extreme asymmetries of this kind. The first positivist sociologist - Karl Marx - divides all humanity into just two classes: people who own means of production and people who don’t, i.e. capitalists and the proletariat. Later sociologists add other division. Today these divisions are present in numerous surveys, studies and reports in popular media and academic publications – typically, gender, race, ethnicity, age, educational background, income, place of living, religion, and a few others (the list of additional variables varies from study to study). But regardless of details, the data collected, analyzed and interpreted is still very “long.” The full populations or their samples are 35 Nigel Gilbert and Klaus G. Troitzsch, Simulation for the Social Scientist, 2nd edition (2005): 3-4. 36 Peter Turchina,Thomas E. Currieb, Edward A. L. Turnerc, Sergey Gavriletsd, “War, space, and the evolution of Old World complex societies,” PNAS October 8, 2013, vol. 110, no. 41: 16384-16389. 37 I am using this term in different way than Samuel Abresman in his “Stop Hyping Big Data and Start Paying Attention to ‘Long Data’,” wired.com, 1/29/2013, http://www.wired.com/2013/01/forget-big-data-think-long-data/.

13
described using much smaller number of variables. But why this should be the case? In the fields of computer media analysis and computer vision, computer scientists use algorithms to extract thousands of features from every image, a video, a tweet, an email, and so on.38 So while, for example, Vincent van Gogh only created about 900 paintings, these paintings can be described on thousands of separate dimensions. Similarly, we can describe everybody living in a city on millions of separate dimensions by extracting all kinds of characteristics from their social media activity. For another example, consider our own project On Broadway where we represent the Broadway in Manhattan with 40 million data points and images using messages, images and check-ins shared along this street on Twitter, Instagram, and Foursquare, as well as taxi rides data and the U.S. Census indicators for the surrounding areas.39 In other words, instead of long data we can have wide data – very large and potentially endless number of variables describing a set of cases. Note that if we have more variables than cases, such representation would go against the common sense of both social science and data science. The latter refers to the process of making a large number of variables more manageable as dimension reduction. But for us “wide data” offers an opportunity to rethink fundamental assumptions about what is society and how to study it; and similarly, what is culture, an artistic career, a body of images, a group of people with similar aesthetic taste, and so on. Rather than dividing cultural history using one dimension (time), or two (time and geographic location) or a few more (e.g., media, genre), endless dimensions can be put in play. The goal of such “wide data analysis” will not be only to find new similarities, affinities, and clusters in the universe of cultural artifacts, but, first of all, help us question our common sense view of things, where certain dimensions are taken for granted. And this is one example of general Cultural Analytics method: estrangement (ostranenie)40, making strange our basic cultural concepts and ways or organizing and understanding cultural datasets. Using data and techniques for manipulating it to question how we think, see, and ultimately act on our knowledge. Acknowledgments I am grateful to my colleagues from computer science and digital humanities fields for many discussions over the years. My gratitude also extends to the students, and post-docs and research scientists who worked in our lab since 2007 and who taught me so much. Our work was generously supported by The Andrew Mellon Foundation, The
38 I explain the reason for using large number of features in “Data Science and Digital Art History.” 39 http://www.on-broadway.nyc/. 40 The term “ostranenie “ was introduced by Russian literary theorist Viktor Shklovsky in his essay “Art as a Technique” in 1917. http://www.vahidnab.com/defam.htm

14
National Endowment for the Humanities, The National Science Foundation, National Energy Research Scientific Computing Center (NERSC), The Graduate Center, City University of New York (CUNY), California Institute for Telecommunications and Information Technology (Calit2), University of California – San Diego (UCSD), California Humanities Research Institute, Singapore Ministry of Education, and Museum of Modern Art (NYC).