Embed Size (px)
Citation preview
CULTURAL HERITAGE THROUGH TIME:
A CASE STUDY AT HADRIAN’S WALL, UNITED KINGDOM
K. D. Fieber a, J. P. Mills a *, M. V. Peppa a, I. Haynes b, S. Turner b, A. Turner b, M. Douglas c, P. G. Bryan d
a School of Civil Engineering and Geosciences, Newcastle University, Newcastle upon Tyne, NE1 7RU, UK –
(karolina.fieber, jon.mills, m.v.peppa)@ncl.ac.uk b School of History, Classics and Archaeology, Newcastle University, Newcastle upon Tyne, NE1 7RU, UK –
(ian.haynes, sam.turner, alex.turner)@ncl.ac.uk c English Heritage, York, UK –
[email protected] d Historic England, York, UK –
Commission II
KEY WORDS: 4D Modelling, Cultural Heritage, Data Collection, Data Fusion, Monitoring, Visualization.
ABSTRACT:
Diachronic studies are central to cultural heritage research for the investigation of change, from landscape to architectural scales.
Temporal analyses and multi-temporal 3D reconstruction are fundamental for maintaining and safeguarding all forms of cultural
heritage. Such studies form the basis for any kind of decision regarding intervention on cultural heritage, helping assess the risks and
issues involved. This article introduces a European-wide project, entitled “Cultural Heritage Through Time”, and the case study
research carried out as a component of the project in the UK. The paper outlines the initial stages of the case study of landscape change
at three locations on Hadrian’s Wall, namely Beckfoot Roman Fort, Birdoswald Roman Fort and Corbridge Roman Station, all once
part of the Roman Empire’s north-west frontier. The main aim of the case study is to integrate heterogeneous information derived from
a range of sources to help inform understanding of temporal aspects of landscape change. In particular, the study sites are at risk from
natural hazards, notably erosion and flooding. The paper focuses on data collection and collation aspects, including an extensive archive
search and field survey, as well as the methodology and preliminary data processing.
1. INTRODUCTION
Cultural heritage sites and monuments are often taken in
isolation, without consideration of historical changes or the
surrounding environment. Nevertheless, diachronic change and
landscape factors are important, constituting integral aspects of
any site, and as such should be considered inseparable when
developing strategies to document, maintain and conserve
cultural heritage. Modern surveying techniques allow precise
measurements and subsequent 3D modelling of the current state
of cultural heritage, while no longer existing (damaged or
missing) elements can be reconstructed using archival data such
as drawings, paintings, historic photographs and archaeological
analysis with the aid of computer vision and visualisation
techniques.
Previous studies have focused on change detection (Patias et al.,
2011), land cover dynamic investigation (Ratcliffe and Henebry,
2004), urban infrastructure analysis (Vizzari, 2011) and
visualization (El-Hakim et al., 2008). Few have integrated data
from different sources (De Luca et al., 2010; El-Hakim et al.,
2008; Micoli et al., 2013; Patias et al., 2011), allowing for
interdisciplinary interactions and leading to better understanding
and reconstruction, as well as improved accessibility and
visibility of cultural resources.
“Cultural Heritage Through Time” (CHT2, 2017) is a European-
wide project in which the scope is to develop three-dimensional
* Corresponding author
products which represent change over time, from landscape to
architectural scale, to envisage and analyse lost scenarios or
visualize changes due to human activities or interventions, as
well as pollution, wars, earthquakes or other natural hazards. The
main aim of the CHT2 project is to merge heterogeneous
information and expertise to deliver enhanced four-dimensional
(4D) digital products for heritage sites. CHT2 is focussing on the
full integration of the temporal dimension, its management and
visualization, for studying and analysing cultural heritage
structures and landscapes through time. Made possible thanks to
co-funding from the Italian, Polish, Spanish and UK research
councils under the framework of the “Joint Programming
Initiative on Cultural Heritage” (JPI-CH, 2017), the project
includes case studies in each of the four participating countries:
the city centre of Milan, Italy; the fortress city of Krakow,
Poland; the medieval walls of Avila, Spain; Hadrian’s Wall and
its landscape, UK.
The main focus of the case study presented here is Hadrian’s
Wall, stretching from the west to the east coast of Northern
England, once a frontier of the Roman Empire. Three particular
locations along the wall were selected for analysis: Beckfoot
(Bibra) Roman Fort, located furthest west on the Cumbrian coast;
Birdoswald Roman Fort, sited more centrally; and Corbridge
(Corstopitum) Roman Station, situated furthest east of the three
(Figure 1). Emphasis was placed on the temporal aspect of
landscape change caused by coastal, fluvial and soil erosion
The International Archives of the Photogrammetry, Remote Sensing and Spatial Information Sciences, Volume XLII-2/W3, 2017 3D Virtual Reconstruction and Visualization of Complex Architectures, 1–3 March 2017, Nafplio, Greece
This contribution has been peer-reviewed. doi:10.5194/isprs-archives-XLII-2-W3-297-2017
297
(depending on the site) and its impact on cultural heritage with
implications for management of historic sites and the benefit of
interpretation for stakeholders.
2. HISTORICAL CONTEXT
Around AD 122 the Roman Emperor Hadrian ordered a wall to
be built, dividing Britain in half. Stretching over 117 km (80
Roman miles) from Bowness on the River Solway on the north-
west coast of England to Wallsend on the River Tyne in the north-
east, it was to become one of the most heavily defended frontiers
of the Roman Empire. It is believed to have taken three legions
of infantrymen from the army of Britain around six years to
complete. The Wall, complemented by a sophisticated system of
outposts and coastal watch stations, offers a remarkable glimpse
of ancient society. In addition to housing one of the largest
concentrations of Roman soldiers anywhere in the Empire’s
provinces, Hadrian’s frontier system was home to a cosmopolitan
array of civilians.
The Wall is Britain’s finest, most widely known and largest
Roman monument. However, the Wall today (Hadrian's Wall,
2017), a designated UNESCO World Heritage Site since 1987,
and its surrounding landscape is very different to that of Roman
times. Although significant portions are still visible in coastal,
rural and urban settings, the remaining fabric and landscape of
the Wall are subject to various modern day stresses, for example
tourism, urban development and natural hazards, making the
Wall an ideal case study for the CHT2 project.
3. STUDY AREA
The CHT2 UK case study focusses on three different sites located
along Hadrian’s Wall (Figure 1) that characterise natural hazard
phenomena facing the Wall in the 21st Century.
Figure 1: Location map of CHT2 UK study sites overlaid on
Google Maps.
3.1 Beckfoot Roman Fort
The fort (Bibra), civilian settlement and cemetery at Beckfoot
(Historic England, 2017a), located to the south-west of the main
Wall, is the least studied and documented site of the three chosen
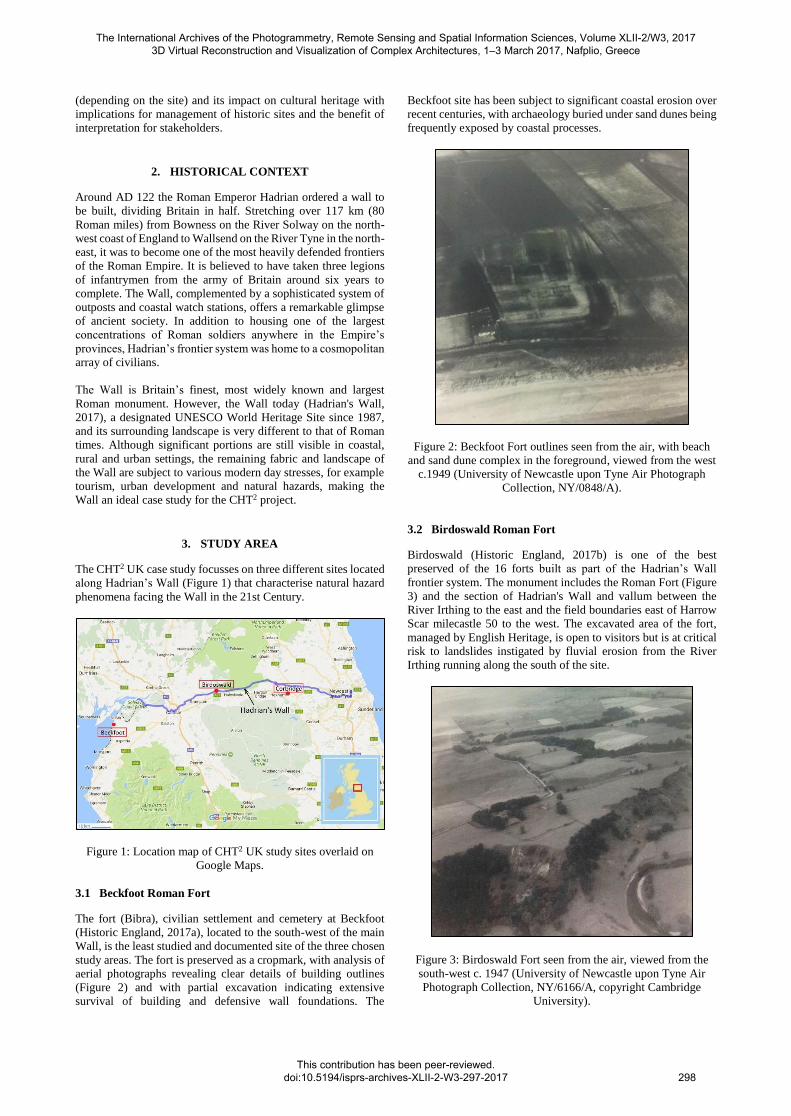
study areas. The fort is preserved as a cropmark, with analysis of
aerial photographs revealing clear details of building outlines
(Figure 2) and with partial excavation indicating extensive
survival of building and defensive wall foundations. The
Beckfoot site has been subject to significant coastal erosion over
recent centuries, with archaeology buried under sand dunes being
frequently exposed by coastal processes.
Figure 2: Beckfoot Fort outlines seen from the air, with beach
and sand dune complex in the foreground, viewed from the west
c.1949 (University of Newcastle upon Tyne Air Photograph
Collection, NY/0848/A).
3.2 Birdoswald Roman Fort
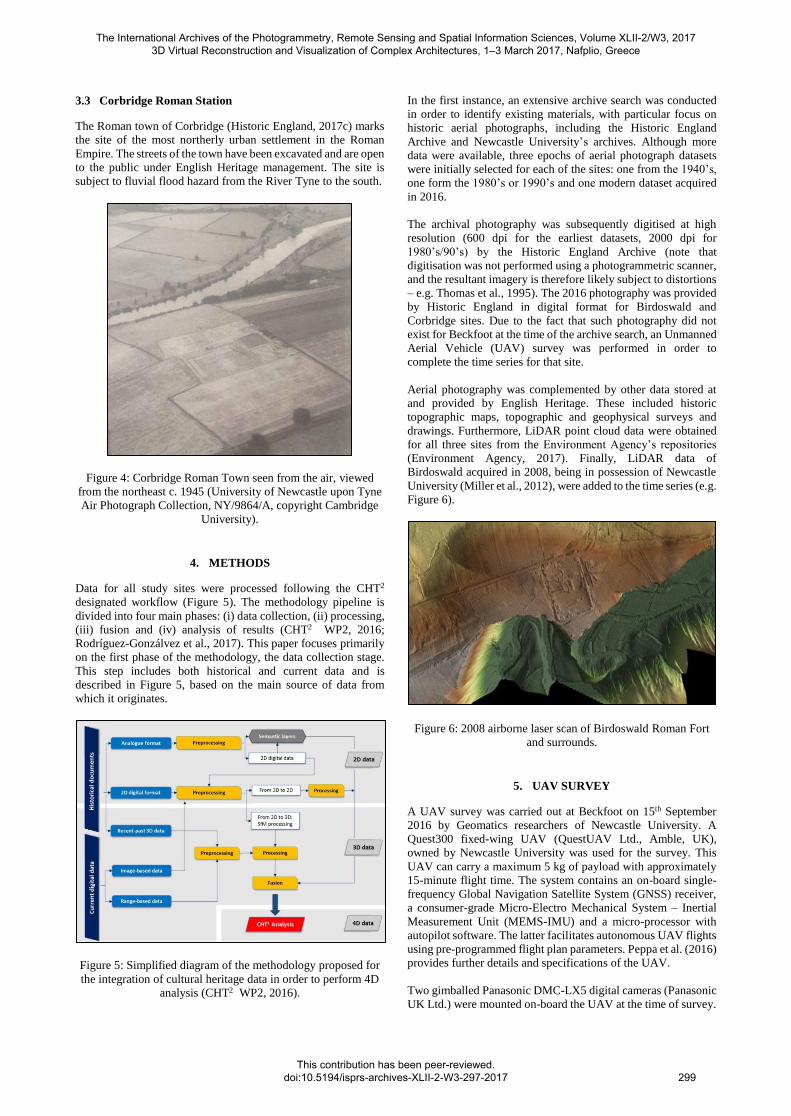
Birdoswald (Historic England, 2017b) is one of the best
preserved of the 16 forts built as part of the Hadrian’s Wall
frontier system. The monument includes the Roman Fort (Figure
3) and the section of Hadrian's Wall and vallum between the
River Irthing to the east and the field boundaries east of Harrow
Scar milecastle 50 to the west. The excavated area of the fort,
managed by English Heritage, is open to visitors but is at critical
risk to landslides instigated by fluvial erosion from the River
Irthing running along the south of the site.
Figure 3: Birdoswald Fort seen from the air, viewed from the
south-west c. 1947 (University of Newcastle upon Tyne Air
Photograph Collection, NY/6166/A, copyright Cambridge
University).
The International Archives of the Photogrammetry, Remote Sensing and Spatial Information Sciences, Volume XLII-2/W3, 2017 3D Virtual Reconstruction and Visualization of Complex Architectures, 1–3 March 2017, Nafplio, Greece
This contribution has been peer-reviewed. doi:10.5194/isprs-archives-XLII-2-W3-297-2017
298
3.3 Corbridge Roman Station
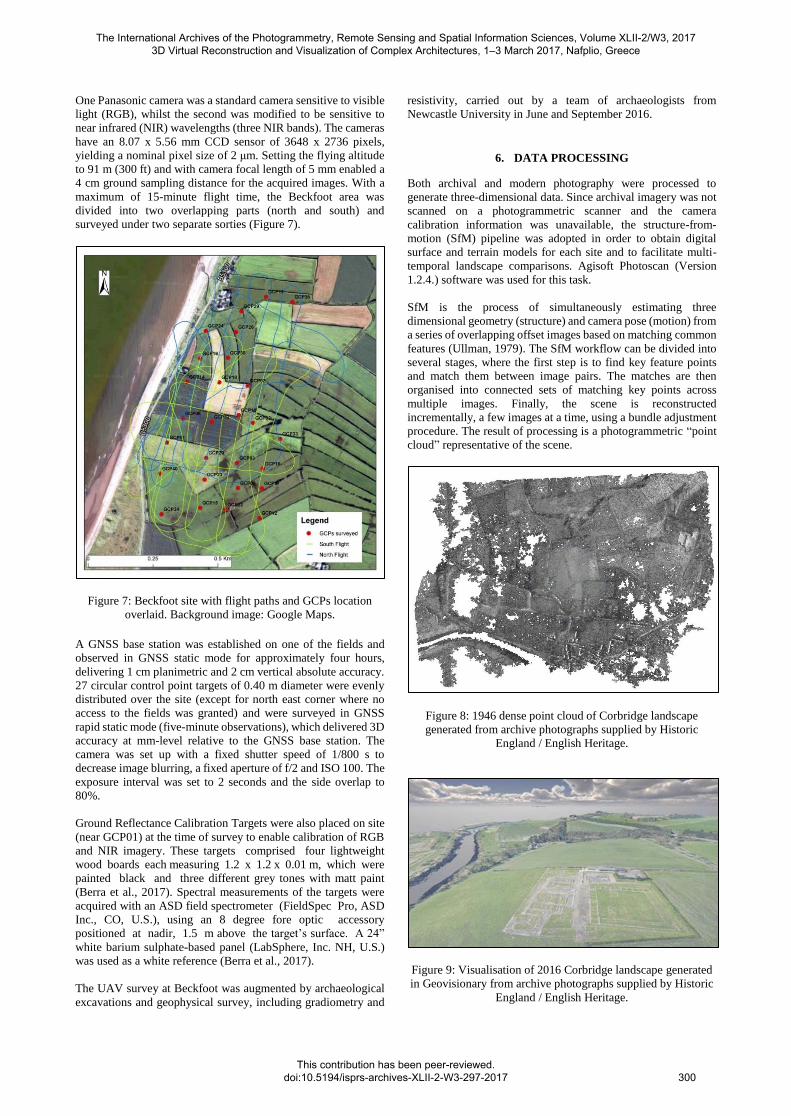
The Roman town of Corbridge (Historic England, 2017c) marks
the site of the most northerly urban settlement in the Roman
Empire. The streets of the town have been excavated and are open
to the public under English Heritage management. The site is
subject to fluvial flood hazard from the River Tyne to the south.
Figure 4: Corbridge Roman Town seen from the air, viewed
from the northeast c. 1945 (University of Newcastle upon Tyne
Air Photograph Collection, NY/9864/A, copyright Cambridge
University).
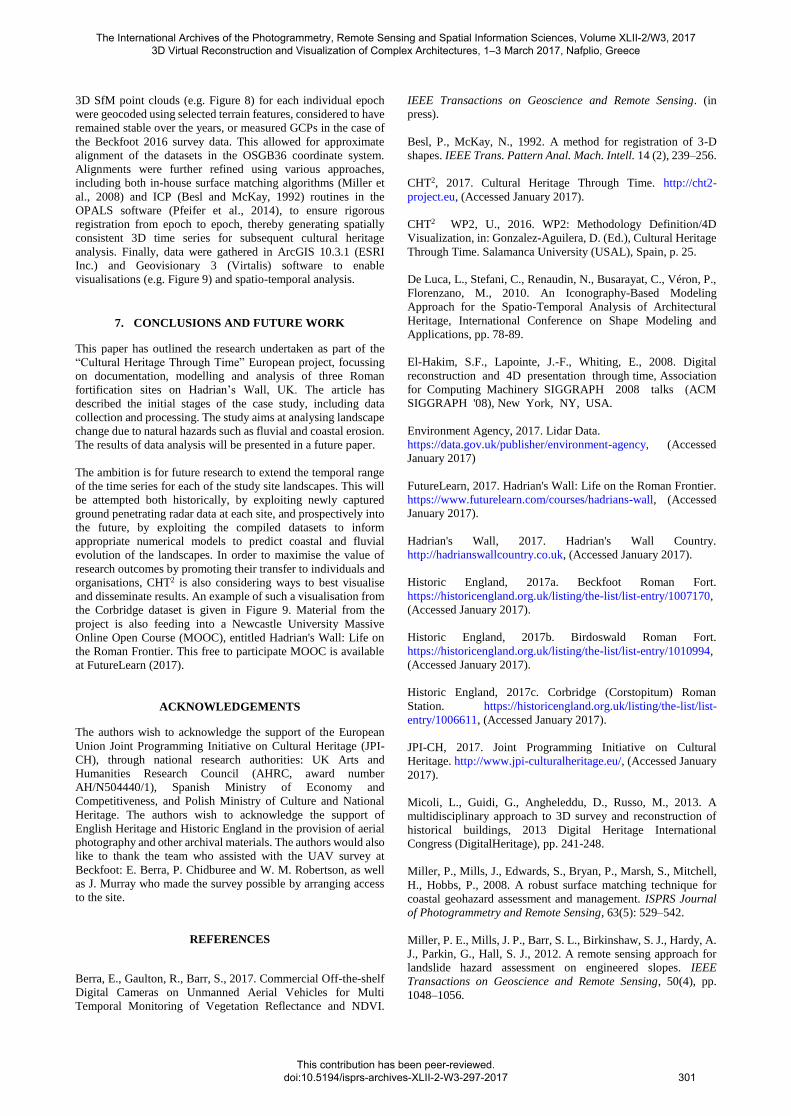
4. METHODS
Data for all study sites were processed following the CHT2
designated workflow (Figure 5). The methodology pipeline is
divided into four main phases: (i) data collection, (ii) processing,
(iii) fusion and (iv) analysis of results (CHT2 WP2, 2016;
Rodríguez-Gonzálvez et al., 2017). This paper focuses primarily
on the first phase of the methodology, the data collection stage.
This step includes both historical and current data and is
described in Figure 5, based on the main source of data from
which it originates.
Figure 5: Simplified diagram of the methodology proposed for
the integration of cultural heritage data in order to perform 4D
analysis (CHT2 WP2, 2016).
In the first instance, an extensive archive search was conducted
in order to identify existing materials, with particular focus on
historic aerial photographs, including the Historic England
Archive and Newcastle University’s archives. Although more
data were available, three epochs of aerial photograph datasets
were initially selected for each of the sites: one from the 1940’s,
one form the 1980’s or 1990’s and one modern dataset acquired
in 2016.
The archival photography was subsequently digitised at high
resolution (600 dpi for the earliest datasets, 2000 dpi for
1980’s/90’s) by the Historic England Archive (note that
digitisation was not performed using a photogrammetric scanner,
and the resultant imagery is therefore likely subject to distortions
– e.g. Thomas et al., 1995). The 2016 photography was provided
by Historic England in digital format for Birdoswald and
Corbridge sites. Due to the fact that such photography did not
exist for Beckfoot at the time of the archive search, an Unmanned
Aerial Vehicle (UAV) survey was performed in order to
complete the time series for that site.
Aerial photography was complemented by other data stored at
and provided by English Heritage. These included historic
topographic maps, topographic and geophysical surveys and
drawings. Furthermore, LiDAR point cloud data were obtained
for all three sites from the Environment Agency’s repositories
(Environment Agency, 2017). Finally, LiDAR data of
Birdoswald acquired in 2008, being in possession of Newcastle
University (Miller et al., 2012), were added to the time series (e.g.
Figure 6).
Figure 6: 2008 airborne laser scan of Birdoswald Roman Fort
and surrounds.
5. UAV SURVEY
A UAV survey was carried out at Beckfoot on 15th September
2016 by Geomatics researchers of Newcastle University. A
Quest300 fixed-wing UAV (QuestUAV Ltd., Amble, UK),
owned by Newcastle University was used for the survey. This
UAV can carry a maximum 5 kg of payload with approximately
15-minute flight time. The system contains an on-board single-
frequency Global Navigation Satellite System (GNSS) receiver,
a consumer-grade Micro-Electro Mechanical System – Inertial
Measurement Unit (MEMS-IMU) and a micro-processor with
autopilot software. The latter facilitates autonomous UAV flights
using pre-programmed flight plan parameters. Peppa et al. (2016)
provides further details and specifications of the UAV.
Two gimballed Panasonic DMC-LX5 digital cameras (Panasonic
UK Ltd.) were mounted on-board the UAV at the time of survey.
The International Archives of the Photogrammetry, Remote Sensing and Spatial Information Sciences, Volume XLII-2/W3, 2017 3D Virtual Reconstruction and Visualization of Complex Architectures, 1–3 March 2017, Nafplio, Greece
This contribution has been peer-reviewed. doi:10.5194/isprs-archives-XLII-2-W3-297-2017
299
One Panasonic camera was a standard camera sensitive to visible
light (RGB), whilst the second was modified to be sensitive to
near infrared (NIR) wavelengths (three NIR bands). The cameras
have an 8.07 x 5.56 mm CCD sensor of 3648 x 2736 pixels,
yielding a nominal pixel size of 2 μm. Setting the flying altitude
to 91 m (300 ft) and with camera focal length of 5 mm enabled a
4 cm ground sampling distance for the acquired images. With a
maximum of 15-minute flight time, the Beckfoot area was
divided into two overlapping parts (north and south) and
surveyed under two separate sorties (Figure 7).
Figure 7: Beckfoot site with flight paths and GCPs location
overlaid. Background image: Google Maps.
A GNSS base station was established on one of the fields and
observed in GNSS static mode for approximately four hours,
delivering 1 cm planimetric and 2 cm vertical absolute accuracy. 27 circular control point targets of 0.40 m diameter were evenly
distributed over the site (except for north east corner where no
access to the fields was granted) and were surveyed in GNSS
rapid static mode (five-minute observations), which delivered 3D
accuracy at mm-level relative to the GNSS base station. The
camera was set up with a fixed shutter speed of 1/800 s to
decrease image blurring, a fixed aperture of f/2 and ISO 100. The
exposure interval was set to 2 seconds and the side overlap to
80%.
Ground Reflectance Calibration Targets were also placed on site
(near GCP01) at the time of survey to enable calibration of RGB
and NIR imagery. These targets comprised four lightweight
wood boards each measuring 1.2 x 1.2 x 0.01 m, which were
painted black and three different grey tones with matt paint
(Berra et al., 2017). Spectral measurements of the targets were
acquired with an ASD field spectrometer (FieldSpec Pro, ASD
Inc., CO, U.S.), using an 8 degree fore optic accessory
positioned at nadir, 1.5 m above the target’s surface. A 24”
white barium sulphate-based panel (LabSphere, Inc. NH, U.S.)
was used as a white reference (Berra et al., 2017).
The UAV survey at Beckfoot was augmented by archaeological
excavations and geophysical survey, including gradiometry and
resistivity, carried out by a team of archaeologists from
Newcastle University in June and September 2016.
6. DATA PROCESSING
Both archival and modern photography were processed to
generate three-dimensional data. Since archival imagery was not
scanned on a photogrammetric scanner and the camera
calibration information was unavailable, the structure-from-
motion (SfM) pipeline was adopted in order to obtain digital
surface and terrain models for each site and to facilitate multi-
temporal landscape comparisons. Agisoft Photoscan (Version
1.2.4.) software was used for this task.
SfM is the process of simultaneously estimating three
dimensional geometry (structure) and camera pose (motion) from
a series of overlapping offset images based on matching common
features (Ullman, 1979). The SfM workflow can be divided into
several stages, where the first step is to find key feature points
and match them between image pairs. The matches are then
organised into connected sets of matching key points across
multiple images. Finally, the scene is reconstructed
incrementally, a few images at a time, using a bundle adjustment
procedure. The result of processing is a photogrammetric “point
cloud” representative of the scene.
Figure 8: 1946 dense point cloud of Corbridge landscape
generated from archive photographs supplied by Historic
England / English Heritage.
Figure 9: Visualisation of 2016 Corbridge landscape generated
in Geovisionary from archive photographs supplied by Historic
England / English Heritage.
The International Archives of the Photogrammetry, Remote Sensing and Spatial Information Sciences, Volume XLII-2/W3, 2017 3D Virtual Reconstruction and Visualization of Complex Architectures, 1–3 March 2017, Nafplio, Greece
This contribution has been peer-reviewed. doi:10.5194/isprs-archives-XLII-2-W3-297-2017
300
3D SfM point clouds (e.g. Figure 8) for each individual epoch
were geocoded using selected terrain features, considered to have
remained stable over the years, or measured GCPs in the case of
the Beckfoot 2016 survey data. This allowed for approximate
alignment of the datasets in the OSGB36 coordinate system.
Alignments were further refined using various approaches,
including both in-house surface matching algorithms (Miller et
al., 2008) and ICP (Besl and McKay, 1992) routines in the
OPALS software (Pfeifer et al., 2014), to ensure rigorous
registration from epoch to epoch, thereby generating spatially
consistent 3D time series for subsequent cultural heritage
analysis. Finally, data were gathered in ArcGIS 10.3.1 (ESRI
Inc.) and Geovisionary 3 (Virtalis) software to enable
visualisations (e.g. Figure 9) and spatio-temporal analysis.
7. CONCLUSIONS AND FUTURE WORK
This paper has outlined the research undertaken as part of the
“Cultural Heritage Through Time” European project, focussing
on documentation, modelling and analysis of three Roman
fortification sites on Hadrian’s Wall, UK. The article has
described the initial stages of the case study, including data
collection and processing. The study aims at analysing landscape
change due to natural hazards such as fluvial and coastal erosion.
The results of data analysis will be presented in a future paper.
The ambition is for future research to extend the temporal range
of the time series for each of the study site landscapes. This will
be attempted both historically, by exploiting newly captured
ground penetrating radar data at each site, and prospectively into
the future, by exploiting the compiled datasets to inform
appropriate numerical models to predict coastal and fluvial
evolution of the landscapes. In order to maximise the value of
research outcomes by promoting their transfer to individuals and
organisations, CHT2 is also considering ways to best visualise
and disseminate results. An example of such a visualisation from
the Corbridge dataset is given in Figure 9. Material from the
project is also feeding into a Newcastle University Massive
Online Open Course (MOOC), entitled Hadrian's Wall: Life on
the Roman Frontier. This free to participate MOOC is available
at FutureLearn (2017).
ACKNOWLEDGEMENTS
The authors wish to acknowledge the support of the European
Union Joint Programming Initiative on Cultural Heritage (JPI-
CH), through national research authorities: UK Arts and
Humanities Research Council (AHRC, award number
AH/N504440/1), Spanish Ministry of Economy and
Competitiveness, and Polish Ministry of Culture and National
Heritage. The authors wish to acknowledge the support of
English Heritage and Historic England in the provision of aerial
photography and other archival materials. The authors would also
like to thank the team who assisted with the UAV survey at
Beckfoot: E. Berra, P. Chidburee and W. M. Robertson, as well
as J. Murray who made the survey possible by arranging access
to the site.
REFERENCES
Berra, E., Gaulton, R., Barr, S., 2017. Commercial Off-the-shelf
Digital Cameras on Unmanned Aerial Vehicles for Multi
Temporal Monitoring of Vegetation Reflectance and NDVI.
IEEE Transactions on Geoscience and Remote Sensing. (in
press).
Besl, P., McKay, N., 1992. A method for registration of 3-D
shapes. IEEE Trans. Pattern Anal. Mach. Intell. 14 (2), 239–256.
CHT2, 2017. Cultural Heritage Through Time. http://cht2-
project.eu, (Accessed January 2017).
CHT2 WP2, U., 2016. WP2: Methodology Definition/4D
Visualization, in: Gonzalez-Aguilera, D. (Ed.), Cultural Heritage
Through Time. Salamanca University (USAL), Spain, p. 25.
De Luca, L., Stefani, C., Renaudin, N., Busarayat, C., Véron, P.,
Florenzano, M., 2010. An Iconography-Based Modeling
Approach for the Spatio-Temporal Analysis of Architectural
Heritage, International Conference on Shape Modeling and
Applications, pp. 78-89.
El-Hakim, S.F., Lapointe, J.-F., Whiting, E., 2008. Digital
reconstruction and 4D presentation through time, Association
for Computing Machinery SIGGRAPH 2008 talks (ACM
SIGGRAPH '08), New York, NY, USA.
Environment Agency, 2017. Lidar Data.
https://data.gov.uk/publisher/environment-agency, (Accessed
January 2017)
FutureLearn, 2017. Hadrian's Wall: Life on the Roman Frontier.
https://www.futurelearn.com/courses/hadrians-wall, (Accessed
January 2017).
Hadrian's Wall, 2017. Hadrian's Wall Country.
http://hadrianswallcountry.co.uk, (Accessed January 2017).
Historic England, 2017a. Beckfoot Roman Fort.
https://historicengland.org.uk/listing/the-list/list-entry/1007170,
(Accessed January 2017).
Historic England, 2017b. Birdoswald Roman Fort.
https://historicengland.org.uk/listing/the-list/list-entry/1010994,
(Accessed January 2017).
Historic England, 2017c. Corbridge (Corstopitum) Roman
Station. https://historicengland.org.uk/listing/the-list/list-
entry/1006611, (Accessed January 2017).
JPI-CH, 2017. Joint Programming Initiative on Cultural
Heritage. http://www.jpi-culturalheritage.eu/, (Accessed January
2017).
Micoli, L., Guidi, G., Angheleddu, D., Russo, M., 2013. A
multidisciplinary approach to 3D survey and reconstruction of
historical buildings, 2013 Digital Heritage International
Congress (DigitalHeritage), pp. 241-248.
Miller, P., Mills, J., Edwards, S., Bryan, P., Marsh, S., Mitchell,
H., Hobbs, P., 2008. A robust surface matching technique for
coastal geohazard assessment and management. ISPRS Journal
of Photogrammetry and Remote Sensing, 63(5): 529–542.
Miller, P. E., Mills, J. P., Barr, S. L., Birkinshaw, S. J., Hardy, A.
J., Parkin, G., Hall, S. J., 2012. A remote sensing approach for
landslide hazard assessment on engineered slopes. IEEE
Transactions on Geoscience and Remote Sensing, 50(4), pp.
1048–1056.
The International Archives of the Photogrammetry, Remote Sensing and Spatial Information Sciences, Volume XLII-2/W3, 2017 3D Virtual Reconstruction and Visualization of Complex Architectures, 1–3 March 2017, Nafplio, Greece
This contribution has been peer-reviewed. doi:10.5194/isprs-archives-XLII-2-W3-297-2017
301
Patias, P., Kaimaris, D., Stylianidis, E., 2011. Change detection
in historical city centers using multi-source data: the case of
historical center of Nicosia – Cyprus, 23rd International CIPA
Conference, Prague, Czech Republic.
Peppa, M. V., Mills, J. P., Moore, P., Miller, P. E., Chambers, J.
E., 2016. Accuracy assessment of a UAV-based landslide
monitoring system. International Archives of Photogrammetry,
Remote Sensing and Spatial Information Sciences, 42(5), pp.
895–902.
Pfeifer, N., Mandlburger, G., Otepka, J., Karel, W., 2014.
OPALS - A framework for Airborne Laser Scanning data
analysis. Computers, Environment and Urban Systems, 45, pp.
125-136.
Ratcliffe, I.C., Henebry, G.M., 2004. Using declassified
intelligence satellite photographs with Quickbird imagery to
study urban land cover dynamics: a case study from Kazakhstan,
Annual ASPRS Conference, Denver, Colorado, pp. 1-10.
Rodríguez-Gonzálvez, P., Muñoz-Nieto, A.L., del Pozo, S.,
Sanchez-Aparicio, L.J., Gonzalez-Aguilera, D., Micoli, L.,
Gonizzi Barsanti, S., Guidi, G., Mills, J., Fieber, K., Haynes, I.,
Hejmanowska, B., 2017. 4D Recontruction and Visualization of
Cultural Heritage: Analyzing Our Legacy Through Time, 3D
Arch Workshop, Nafplio, Greece.
Thomas, P. R., Mills, J. P., Newton, I., 1995. An investigation
into the use of Kodak Photo CD for digital photogrammetry.
Photogrammetric Record, 15(86), pp. 301–314.
Ullman, S., 1979. The interpretation of structure from motion.
Proceeding of Royal Society of London B-203, 405-442.
Vizzari, M., 2011. Spatio-Temporal Analysis Using Urban-Rural
Gradient Modelling and Landscape Metrics, in: Murgante, B.,
Gervasi, O., Iglesias, A., Taniar, D., Apduhan, B.O. (Eds.),
Computational Science and Its Applications - ICCSA 2011:
International Conference, Santander, Spain, June 20-23, 2011.
Proceedings, Part I. Springer Berlin Heidelberg, Berlin,
Heidelberg, pp. 103-118.
The International Archives of the Photogrammetry, Remote Sensing and Spatial Information Sciences, Volume XLII-2/W3, 2017 3D Virtual Reconstruction and Visualization of Complex Architectures, 1–3 March 2017, Nafplio, Greece
This contribution has been peer-reviewed. doi:10.5194/isprs-archives-XLII-2-W3-297-2017
302