Embed Size (px)
Citation preview

Cultural Sources of Support on which Environmental Attitudes and Behaviours Draw Second Report from the Research Programme on Environmental Attitudes, Values and Behaviour in Ireland September 2003 Lead Organisation: University College Dublin Research Team: Dr Mary Kelly, Department of Sociology, University College Dublin (Project Co-ordinator) Dr Pauline Faughnan, Social Science Research Centre, University College Dublin Hilary Tovey, Department of Sociology, Trinity College Dublin Dr Colette Dowling, Associate, Social Science Research Centre, University College Dublin Researchers: Fiachra Kennedy Dr Brian Motherway Dr Fiona Gill Sharon Bryan Administration: Philippa Caithness, Social Science Research Centre, University College Dublin Accommodation: Institute for the Study of Social Change, University College Dublin, Belfield, Dublin 4 Funded by: Environmental Protection Agency under the National Development Plan Environmental RDTI Programme 2002-2006 Grant no: 2001-MS/SE1-M1 Web site: www.ucd.ie/environ/home.htm
Table of Contents
ACKNOWLEDGEMENT………………………………………………….……………...…...….……VII EXECUTIVE SUMMARY……………………………………………………….………..…..…..….…IX 1. ENVIRONMENTAL VALUES, ATTITUDES AND BEHAVIOURS IN IRELAND: AN INTRODUCTION………………………………………………………………………….…….1 2. ENVIRONMENTAL ATTITUDES AND BEHAVIOURS…………………………………..…...13
3. THE IMPACT OF THE NEW ENVIRONMENTAL PARADIGM ON ENVIRONMENTAL ATTITUDES AND BEHAVIOURS IN IRELAND…………………………………………….….29 4. THE IMPACT OF POST-MATERIALISM ON ENVIRONMENTAL ATTITUDES AND
BEHAVIOURS IN IRELAND…………………………………………………………….……..…45 5. THE IMPACT OF CULTURAL VALUES ON ENVIRONMENTAL ATTITUDES AND
BEHAVIOURS IN IRELAND……………………………………………………………………...53
6. THE IMPACT OF UNDERLYING VALUES ON ENVIRONMENTAL ATTITUDES AND BEHAVIOURS IN IRELAND…………………………………………………………….………..69
7. ENVIRONMENTAL VALUES, ATTITUDES AND BEHAVIOURS IN IRELAND:
SOME CONCLUSIONS……………………………………………………………………...……81 APPENDIX 1 – QUESTIONNAIRE ITEMS FROM ISPAS CORE MODULE AND
SELF-COMPLETION MODULE USED IN THIS REPORT……………………..89
APPENDIX 2 – ADDITIONAL TABLES……………………………………..……….….…….….…93 REFERENCES………………………………………………………….………………………..….….97
List of Tables Table 2.1 Distribution of Responses on the Perceptions of Dangers of Danger to the
Environment Items (%)
14
Table 2.2 Distribution of Responses on the Willingness to Take on Extra Costs in Order to Protect the Environment Items (%)
15
Table 2.3 Distribution of Responses on the Environmental Efficacy Items (%)
16
Table 2.4 Distribution of Responses on the Trust as Source of Correct Information about the Causes of Pollution Items (%)
17
Table 2.5 Distribution of Responses on the Dealing with Waste Items (%)
17
Table 2.6 Distribution of Responses on the Reported Environmental Behaviour Items (%)
18
Table 2.7 Distribution of Responses on the Promotion of the Environment as a Social and Political Issue Items (%)
19
Table 2.8 Socio-Demographic Variables and Environmental Attitudes (Standardised Coefficients)
20
Table 2.9 Socio-Demographic Variables and Trust as Source of Information about the Causes of Pollution (Exp(B))
22
Table 2.10 Socio-Demographic Variables and Attitudes to Dealing with Waste (Exp(B))
23
Table 2.11 Socio-Demographic Variables and Reported Environmental Behaviour (Exp(B))
25
Table 2.12 Socio-Demographic Variables and Promotion of the Environment as a Social and Political Issue (Exp(B))
26
Table 3.1 New Environmental Paradigm Scale Items and Principal Component Factor Loadings
32
Table 3.2 Regression Analysis of Socio-Demographic Variables and the NEP Scale (Standardised Coefficients)
34
Table 3.3 NEP Scale and Environmental Attitudes (Standardised Coefficients)
36
Table 3.4 NEP Scale and Trust as Source of Information about the Causes of Pollution (Exp(B))
38
Table 3.5 NEP Scale and Attitudes to Dealing with Waste (Exp(B))
39
Table 3.6 NEP Scale and Reported Environmental Behaviour (Exp(B))
40
Table 3.7 NEP Scale and Promotion of the Environment as a Social and Political Issue (Exp(B))
41
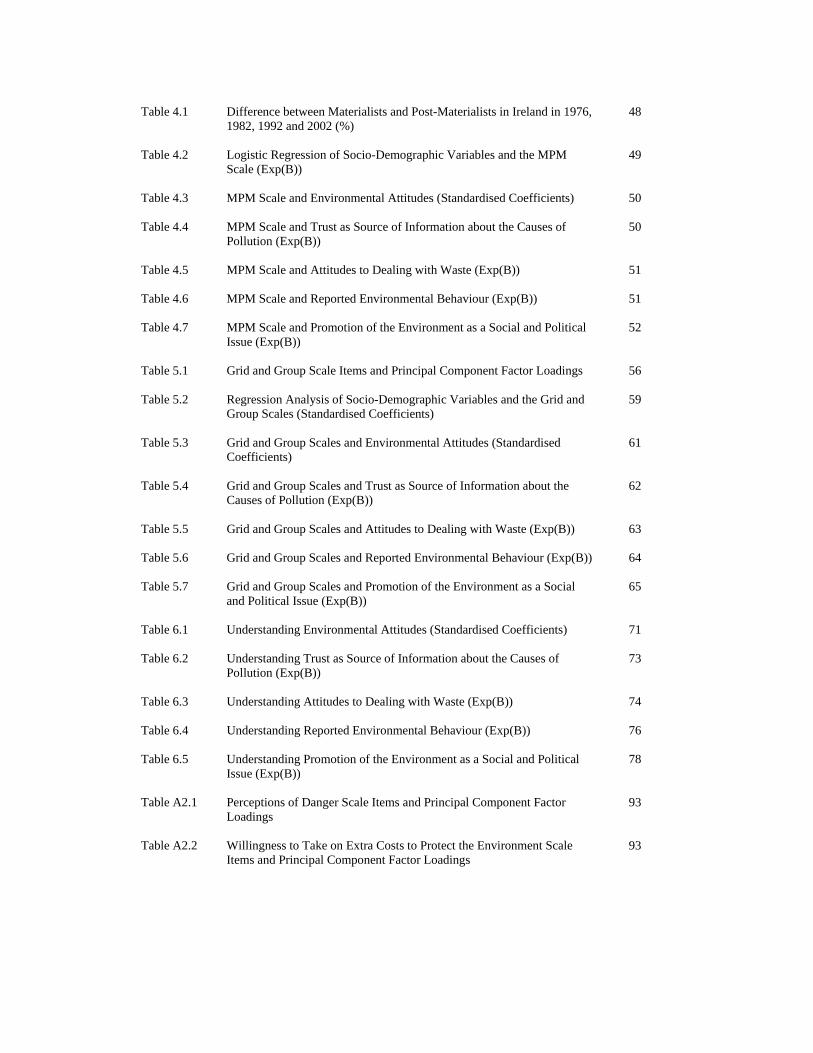
Table 4.1 Difference between Materialists and Post-Materialists in Ireland in 1976,
1982, 1992 and 2002 (%)
48
Table 4.2 Logistic Regression of Socio-Demographic Variables and the MPM Scale (Exp(B))
49
Table 4.3 MPM Scale and Environmental Attitudes (Standardised Coefficients)
50
Table 4.4 MPM Scale and Trust as Source of Information about the Causes of Pollution (Exp(B))
50
Table 4.5 MPM Scale and Attitudes to Dealing with Waste (Exp(B))
51
Table 4.6 MPM Scale and Reported Environmental Behaviour (Exp(B))
51
Table 4.7 MPM Scale and Promotion of the Environment as a Social and Political Issue (Exp(B))
52
Table 5.1 Grid and Group Scale Items and Principal Component Factor Loadings
56
Table 5.2 Regression Analysis of Socio-Demographic Variables and the Grid and Group Scales (Standardised Coefficients)
59
Table 5.3 Grid and Group Scales and Environmental Attitudes (Standardised Coefficients)
61
Table 5.4 Grid and Group Scales and Trust as Source of Information about the Causes of Pollution (Exp(B))
62
Table 5.5 Grid and Group Scales and Attitudes to Dealing with Waste (Exp(B))
63
Table 5.6 Grid and Group Scales and Reported Environmental Behaviour (Exp(B))
64
Table 5.7 Grid and Group Scales and Promotion of the Environment as a Social and Political Issue (Exp(B))
65
Table 6.1 Understanding Environmental Attitudes (Standardised Coefficients)
71
Table 6.2 Understanding Trust as Source of Information about the Causes of Pollution (Exp(B))
73
Table 6.3 Understanding Attitudes to Dealing with Waste (Exp(B))
74
Table 6.4 Understanding Reported Environmental Behaviour (Exp(B))
76
Table 6.5 Understanding Promotion of the Environment as a Social and Political Issue (Exp(B))
78
Table A2.1 Perceptions of Danger Scale Items and Principal Component Factor Loadings
93
Table A2.2 Willingness to Take on Extra Costs to Protect the Environment Scale Items and Principal Component Factor Loadings
93

Table A2.3 Environmental Efficacy Scale Items and Principal Component Factor
Loadings
93
Table A3.1 Two Component NEP Scale Items and Principal Component Factor Loadings
94
Table A3.2 Distribution of Responses on the NEP Scale Items (%)
94
Table A5.1 Distribution of Responses on the Grid and Group Scales Items (%)
95
vii
Acknowledgement This report has been prepared as part of the Environmental Research Technological Development and Innovation Programme under the Productive Sector Operational Programme 2000-2006. The Programme is financed by the Irish Government under the National Development Plan. It is administered on behalf of the Department of the Environment and Local Government by the Environmental Protection Agency which has the statutory function of co-ordinating and promoting environmental research. Disclaimer Although every effort has been made to ensure accuracy of the material contained in this publication, complete accuracy cannot be guaranteed. Neither the Environmental Protection Agency nor the authors accept any responsibility whatsoever for loss or damage occasioned or claimed to have been occasioned, in part or in full, as a consequence of any person acting, or refraining from acting, as a result of a matter contained in this publication. All or part of this publication may be reproduced without further permission, provided the source is acknowledged.

viii
ix
Executive Summary
Introduction
Cultural Sources of Support on which Environmental Attitudes and Behaviours Draw is the
second report to emanate from the Research Programme on Environmental Attitudes, Values and
Behaviour in Ireland. The first report1 considers how Irish environmental attitudes have changed
between 1993 and 2002, while the third report places Irish attitudes to the environment in a
comparative European context. While these three reports drawn on quantitative survey data, the fourth
and fifth reports are based on qualitative research, and are entitled respectively, Environmental
Discourses Articulated by the Public and The Making of Environmental Activists.
This second report focuses on exploring the cultural sources of support for pro-environmental attitudes
and behaviours. The data is based on a national, representative sample survey fielded at the end of 2001
and the beginning of 2002. The questionnaire used was that designed for international comparative
purposes by the International Social Survey Programme (ISSP) with some additional questions
included for the population in the Republic of Ireland.
In order to bring about change, in this case to increase pro-environmental attitudes and practices, it is
important to identify those core cultural values which underpin and support such practices. Some of the
core values identified in this report include a set which emphasise the fragility of nature in the face of
economic development and hence the need to protect it, as well as two socio-political values, one a
sense of being empowered to act to protect the environment and in so doing to make a difference, the
second an egalitarian socio-political perspective. The work of environmental policy makers wishing to
further secure the environmental commitments of those already mobilised, as well as to increase a
sense of environmental responsibility among others, is more likely to be successful when these cultural
values are acknowledged and worked with in the promotion of sustainable development.
Three broad sets of cultural values are explored in order to investigate their relationship with pro-
environmental attitudes and practices. These include respondents’ support for the New Environmental
1 Trends in Irish Environmental Attitudes between 1993 and 2002. First Report of National Survey Data, July 2003. Details of the sample survey, the questionnaire and data tables are provided in appendices to this report. Available: Department of Sociology, University College Dublin or http://www.ucd.ie/environ/reports/environment_attitudes_report.pdf.
x
Paradigm in which subscribers see nature as fragile and in need of care and protection especially given
the potential ravages of economic growth; a second is the extent of commitment to a Post Materialist
perspective; while a third, drawing on the Cultural Values Paradigm, identifies two further value
sources - egalitarianism and a sense of empowerment. The extent to which socio-demographic
variables might help to explain differences in environmental attitudes and behaviours is also explored.
The report begins by analysing a range of perceptions and attitudes among Irish respondents regarding
environmental dangers, willingness to pay to protect the environment, and concerns regarding waste
disposal. It continues by examining three sets of pro-environmental practices, that of sorting waste and
cutting back on car driving, while also examining the prevalence of active mobilisation on behalf of the
environment by such practices as membership or support of environmental organisations. It then
proceeds to examine the extent to which the three sets of broader cultural values noted above were
found to mobilise support for those perceptions and practices which contribute to protecting the
environment.
Differing Environmental Attitudes
Respondents perceive a variety of threats to the environment. The evidence suggests that Irish
respondents are deeply concerned about such threats. In particular, they are convinced about the
dangers posed to the environment by nuclear power stations, water pollution, air pollution caused both
by cars and industry, the ‘greenhouse effect’, and the use of pesticides and chemicals in farming. In the
case of each of these, less than ten percent of respondents believe that they are ‘not very dangerous’ or
‘not dangerous at all’ for the environment.
How willing are they to pay for protecting the environment? There is a greater willingness to pay
higher prices (53 percent) than pay higher taxes (34 percent). On the question of environmental
efficacy, there is an almost even divide between those who feel their pro-environmental actions can
make a difference and those who do not. Combined with the relatively low level of environmental
efficacy is a sense that some major and powerful institutions cannot be trusted to provide accurate
information about pollution. Thus only a quarter of respondents state that their trust in the government
to provide them with such correct information is strong, and less than ten percent of respondents report
a strong sense of trust in business and industry.
xi
With regard to waste disposal, large majorities agree with the idea of paying ‘more in order to recycle
waste’, and believe that the original manufacturer of the product should be responsible for recycling it.
While recycling is thus the preferred option, there is, nonetheless, some support at a general level for
both incineration and landfills. This is despite some high profile campaigns by local communities
against the siting of both. The percentage of respondents who agree that ‘using incinerators is the best
way to dispose of waste’ (40 percent) is slightly greater than the percentage who disagree with this
statement. The development of new landfills meets with very slightly more approval than incinerators,
43 percent agreeing that ‘new landfill sites should be developed to dispose of waste’. There would thus
appear to be no definite preferences or indicators of widely acceptable solutions to the waste disposal
problem.
Differing Environmental Behaviours
The survey evidence suggests that recycling facilities are now perceived as being more widely
available, with less than ten percent of respondents reporting that no such facilities are available where
they live. Where they are available, almost three-quarters of the respondents claim that they at least
sometimes sort through glass, tins, plastic and newspapers. However, despite the fact that half of the
respondents believe that air pollution caused by cars is dangerous for the environment, few are willing
to cut back on their car use for environmental reasons. The majority of those who use a car report that
they have never cut back on using it for environmental reasons, with about a third reporting that they
have sometimes done so.
Respondents were also asked about their activities to promote the environment as a social and political
issue. It is quite clear from the data that few Irish people are actively involved in the more direct forms
of environmental engagement. Only a tiny percentage of respondents (4 percent) report that they are
members of an environmental group and a similarly small percentage of respondents (5 percent) claim
to have protested about an environmental issue. There appears, however, to be a greater willingness
among at least a fifth of Irish people to provide support to those who are involved in these more direct
forms of action. A quarter of respondents has signed a petition, while one in five has given money to an
environmental group. Of those who report either giving money to an environmental group or signing a
petition, just over forty percent claim they do both. So, while there appears to be a reluctance to take an
active part, notable minorities of people are willing to provide support, at least at arm’s-length.
xii
Socio-Demographic Explanations
Of the various socio-demographic variables considered (gender, age, education, residence, religious
attendance, social class, income and employment in the public sector), education proves to be the most
powerful predictor of pro-environmental attitudes, with high incomes and social class also predictive in
this direction. However, in Ireland as elsewhere, socio-demographic variables, even when bundled
together, explain relatively little (generally less than ten percent) of the variance in environmental
attitudes and behaviours.
Cultural Sources of Differing Environmental Attitudes and Behaviours
The study explores whether broader sets of cultural values might be identified which could be shown to
contribute to increased levels of environmental concerns and practices. As noted above, three
theoretical models are examined to investigate the extent to which they help in understanding the
cultural values underpinning environmental attitudes and behaviours.
The first, the New Environmental Paradigm (NEP), examines a set of broad cultural values regarding
perceptions of nature, the environment and socio-economic change. It proposes that there has been
increasing concern in developed western societies regarding the impact of economic development on
what is seen as a fragile environment and a nature that needs care rather than reckless exploitation and
domination. The basis for this perspective may be entirely instrumental and anthropocentric – we need
to protect or carefully use natural resources in order to facilitate future development and for the sake of
future generations, or its basis may be biocentric, emphasising the need to protect the environment for
its own sake. The NEP measure used does not differentiate between these two reasons. However the
fourth report in this research series, Environmental Discourses Articulated by the Public, based on
discussions with 22 focus groups, explores the question in greater detail. In the survey research being
reported here, in Ireland, as in other countries, the great majority is favourably disposed towards a New
Environmental Paradigm view. Those most strongly supportive are the young and those with a higher
level of education. Strong NEP supporters are more likely than others to express concern about
environmental risks and dangers and to be willing to pay for protecting the environment. They have a
sense of environmental efficacy – that their actions on behalf of the environment can have a significant
effect, they trust the information on pollution provided by environmental groups, and they are more
likely than others to give money and sign petitions to promote environmental issues. They have a
xiii
strong preference for recycling – and are more likely to recycle and cut back on driving than other
groups. They have a strong dislike of landfill and incineration. Certainly the NEP would appear to be a
major cultural value system around which pro-environmental sentiment and practices are mobilising.
The Post Materialist perspective proposes that post-war affluence in much of the developed world
combined with a relative absence of war has had a profound effect on a wide range of public attitudes,
including a shift away from materialist concerns towards more post materialist values. However this
set of values has not been found, in general, to be statistically significant in explaining differences in
environmental perceptions, attitudes and behaviour in Ireland.
This is not the case with regard to the Cultural Values paradigm. The values which are explored using
this perspective are broad socio-political cultural values. Two such values are found to be related to
pro-environmental sentiments and practices in Ireland: an egalitarian commitment and a sense of
efficacy or empowerment. Although the amount of variance explained is relatively small, a consistent
pattern emerges, and is in the direction that Cultural Theory would lead us to expect. Thus a strong
sense of egalitarianism and an approval of collective political action to redistribute income more
equitably are related to heightened concerns regarding a whole range of environmental threats.
However, for egalitarians, trust in government departments to provide accurate information about
pollution and thus about these threats is low. Furthermore, when there is a strong commitment to
equality, combined with a tendency to be critical of authority, as well as a sense of socio-political
efficacy, giving what cultural theorists call a strong ‘egalitarian cultural bias’, there tends to be a high
level of trust in the information provided by environmental groups. Noting a similar pattern in other
countries, some cultural theorists have argued that environmentalism can be interpreted as an important
cultural and symbolic resource which egalitarians use to criticise those powerful institutions which they
see as supporters of an inequitable and unjust society.
Regarding empowerment, a questioning attitude to authority and a strong sense of personal and
political efficacy are also found to contribute to pro-environmental mobilisation, including an increased
willingness to pay for protecting the environment, to practice recycling, to cut back on driving, and to
support environmental activism by giving money to environmental groups and signing petitions. These
themes will be further explored in the fifth report of The Research Programme on Environmental
Attitudes and Behaviour in Ireland, The Making of Environmental Activists, which will report on
qualitative interviews with environmental activists.
xiv
Conclusion
While concern regarding environmental dangers is quite strong among the Irish population, pro-
environmental practices are weaker. This is also apparent from the comparative analysis of the Irish
survey data relative to the attitudes and practices in other European countries, the results of which are
presented in the third report, Environmental Attitudes and Behaviours: Ireland in Comparative
European Perspective. This second report has explored some of the cultural reasons for this,
identifying three sets of broadly based cultural values which contribute to mobilising pro-
environmental attitudes and behaviours. One is a set of values called the New Environmental
Paradigm, in which there is concern for the fragility of nature and its need for protection, particularly
from possible over-exploitation and destruction due to rapid economic and social change. The second
and third sets of cultural values, namely egalitarianism and a sense of empowerment, were identified
through an analysis of the Cultural Values paradigm. Egalitarianism expresses a rejection of society’s
unequal structures and the need for collective political efforts to change these. The third is a set of
values around empowerment including a sense of efficacy in bringing about change and criticism of
authoritarian hierarchical structures. Both egalitarianism and a sense of empowerment contribute to the
mobilisation of attitudes and practices to protect the environment. This report has thus identified and
discussed some of the core cultural values with which environmental policy makers must work if they
are to successfully bring about those attitudinal and behavioural changes supportive of sustainable
development.
1
Chapter 1
Environment Values, Attitudes and Behaviours in Ireland: An Introduction
1.1 Introduction
In Ireland, individuals differ not only in terms of how they treat the environment but also in terms of
how they think about the environment. Some people are more concerned about the environment than
others; some are more willing to act in a pro-environmental manner than others. While these differences
between people’s attitudes and behaviours are interesting in and of themselves, the purpose of this
report is to explain these differences. In order to do so we consider three theoretical explanations of
environmental attitudes and behaviours. Each of the three theories purports to identify a set of values or
worldviews that influence the views that people have of the environment and their willingness to act in
a pro-environmental manner. Scholars have also attempted to explain environmental attitudes and
behaviour in terms of social and demographic variables, as well as from particular theoretical
perspectives. In general, the former have not fared well while the latter have been found to offer more
explanatory power. Three such theoretical perspectives are explored here (the effects of socio-
demographic variables will also be taken into account). The first is the New Environmental Paradigm as
proposed and developed by Dunlap and Van Liere (1978), the second is Inglehart’s (1977, 1990, 1997)
post-material thesis, and the third is what is referred to either as Cultural Theory or Grid-Group Theory
(Douglas, 1970 and 1982; Douglas and Wildavsky, 1982; Wildavsky, 1987; Thompson, Ellis and
Wildavsky, 1990). The first two were drawn upon and tested for their explanatory power in the earlier
ISSP Environmental module fielded in 1993. The third was included for the first time in this module
and fielded in Ireland as an optional exploratory model. This report provides an empirical analysis of
these theoretical perspectives and a comparison of their relative merits in explaining environmental
attitudes and behaviours. These models are explored in order to investigate the broader cultural sources
of support on which pro-environmental attitudes and behaviours may draw.
This report is the second report to emanate from the Research Programme on Environmental Attitudes,
Values and Behaviour in Ireland.2 The purpose of this report is the systematic exploration of the values,
2 The first report, Trends in Irish Environmental Attitudes between 1993 and 2002, First Report of National Survey Data, July 2003 examined changes in environmental attitudes over the 1990s, comparing findings from the 1993 ISSP Environmental survey and those of 2001/02. Details of sample survey, the questionnaire and data tables are provided in appendices to this report. (http://www.ucd.ie/environ/reports/environment_attitudes_report.pdf).
2
attitudes and behaviour of Irish people in relation to the environment and the cultural sources of support
on which they draw. The values, attitudes and behaviour of the adult Irish population are examined
using a large-scale representative sample survey. The questionnaire used is a comparative international
survey developed by the International Social Survey Programme (ISSP). The ISSP module was
designed in the context of international theoretical, empirical and methodological literature on
environmentalism. In Ireland, the ISSP Environment module was carried as part of the Irish Social and
Political Attitudes Survey (ISPAS), and was fielded at the end of 2001 and beginning of 2002.
Furthermore, it should also be noted that in Ireland, the ISSP module was supplemented by additional
environmental items carried in a ‘self-completion module’ of ISPAS.
The first report considered how Irish environmental attitudes have changed since 1993, while the next
report will place Irish attitudes in a comparative international context. This second report focuses on
explaining these Irish values, attitudes and behaviours. The research is important because, in order to
increase individual environmental responsibility and to move towards sustainable development, it is
necessary to understand perceptions and behaviour in relation to the environment. The Environmental
RTDI Programme (B/8/2001) called for research that would provide a ‘better understanding of the
realities and facts determining responses to environmental and quality of life issues’. Such an
understanding will, in the long term, be critical in the effective implementation of national and
European Union policies on the environment.
In this report we first describe people’s attitudes towards the environment and their pro-environmental
behaviours. With regard to attitudes to the environment we consider the levels of concern people have
for the environment, their willingness to take on extra costs in order to protect the environment, their
sense of efficacy in dealing with environmental problems, their trust in various institutions as sources of
information about the causes of pollution and their attitudes to dealing with waste. In terms of
behaviours we describe respondents’ self-reported behaviour in terms of recycling and cutting back on
car usage in order to protect the environment, as well as their actions in terms of trying to influence
policy (either indirectly through signing petitions or donating money, or more directly through the
membership of an environmental group or taking part in a protest or demonstration). This is then
followed by an examination of the relationship between these attitudes and behaviours and broader
socio-political and environmental values and worldviews.
3
1.2 Explaining Environmental Attitudes and Behaviour
The purpose of this report is to explore why individuals hold different environmental attitudes and why
they behave differently from one another. For instance, why do some people perceive air pollution
caused by cars as dangerous for the environment while others do not perceive any danger, and why
some people recycle while others do not? In addressing these questions we consider three theoretical
models of environmental attitudes and behaviour. Each of these theoretical models argues that there is a
set of underlying cultural values or worldviews held by the individual respondents that may influence
their attitudes and actions. Schwartz (1992, p.1) defines values as ‘the criteria people use to select and
justify actions and to evaluate people (including the self) and events’. Worldviews are somewhat less
general; where values are seen as referring to broad dispositions or orientations, worldviews are held to
refer to a specific domain of life, such as the environment, and may be the result of political and social
experiences in the larger world.3 (Stern et al, 1995, pp726-727)
Our aim is thus to examine if respondents’ attitudes and behaviours are indeed related to these broader
values or worldviews, and whether or not these theories help us to understand differences between
people in terms of their attitudes and behaviour. Each of the models argues that there is consistency
between the values and worldviews of individuals regarding society and how it operates (or should
operate) and their attitudes and behaviour regarding the environment. The ISSP Environmental module,
as well as the literature on environmental values, attitudes and behaviours, propose a variety of survey
items or questions that can be used to identify those underlying values and worldviews that are intended
to explain attitudes and behaviours.
1.2.1 New Environmental Paradigm
The first theoretical framework that we consider is what Dunlap and Van Liere (1978) refer to as the
New Environmental Paradigm. This theory proposes that there is a growing public consciousness of,
and concern about, the environment, awareness of the environmental destructiveness of economic
growth, criticism of scientific and technological progress, and an assertion as to the fragility of nature.
As such, it questions the perspective that favours economic growth and the scientific and technological
ethos that underpins it. The New Environmental Paradigm has been explored by Dunlap in the USA,
from the 1970s through to the 1990s, using survey evidence, and was also included in the 1993 ISSP
Environmental module.
3 For an extensive review of what is meant by values in the social science, social psychological and political science literatures, and the difficulties involved in arriving at a definition see van Deth and Scarbrough (1995).
4
This new environmental consciousness links beliefs about a wide range of subjects including the
relationship between humanity and nature, the importance of economic growth, and the value of
technology: human needs and values should no longer be of greater concern then those of nature.
(Dalton and Rohrschneider, 1998) By the late 1970s Dunlap and Van Liere, using survey research in the
USA, were able to identify this new set of values and attitudes. These new ideas, such as ‘limits of
growth’, ‘balance of nature’ and more bio-centric concerns challenged the dominant outlook that
favours economic growth and scientific and technological perspectives. The NEP proposes that less
emphasis should be placed on economic growth and a more sceptical attitude should be taken towards
science and technology. There is also a realisation that many of the resources available on the planet are
limited and people’s expectations ought to adjust to reflect this reality. (Dalton and Rohrschneider,
1998) It is expected that those who regard nature as fragile, limited and in need of our care and attention
will be more likely to have attitudes and behaviours that are more pro-environmental than their
counterparts. The questions that we pose are, can such a cultural paradigm be identified in Ireland, and
if so, does it offer a cultural source of support for pro-environmental attitudes and behaviours?
1.2.2 Post-Materialism
This second theoretical framework draws upon the work of Inglehart who argues that post-war
affluence in much of the developed world, combined with a relative absence of war, has had a profound
effect on a wide range of public attitudes. Inglehart (1981, p.886) expects that there will be a
‘significant watershed’ in terms of values and attitudes between the pre-war and post-war generations.
Since the Second World War, the formative years of younger generations in the western developed
world have been ones of increased economic and physical security. These groups are expected to be
more post-materialist than older generations. Inglehart argues that there has been a shift away from the
materialist concerns of pre-industrial and industrial societies (that is, support for the established order
through the maintenance of law and order and the preservation of economic gains) towards post-
materialist values (that is, greater emphasis on individual self-expression, greater participation in
decision-making, freedom and quality of life). (Inglehart, 1977, p.182; Inglehart, 1984; Inglehart et al,
1994, p.336; Poguntke, 1987, p.77; Muller-Rommel, 1989, pp115-116; Dalton, 1996, p.153) The
ambitions and priorities of younger generations, for themselves and their societies, are expected to be
different because unlike earlier generations they could take relative economic well-being and physical
security for granted. In order to examine the emergence of these new attitudes and values in advanced
industrial society, Inglehart proposes a generational theory. The basic expectation of post-materialist
theory is that each successively younger post-war cohort is more post-materialist that its predecessor. It
5
is expected that those who were born before the Second World War will have a different set of attitudes
and values from those who were born after the war. The latter group’s attitudes and values will have
been shaped by their experience of affluence and relative peace during their formative years.
Inglehart (1990, 1997) and Dalton (1994) argue that environmentalism is a consequence of socio-
economic progress in advanced industrial democracies. Dalton and Rohrschneider (1998, pp102-103)
note that from the point of view of this theoretical framework, ‘the rise of environmentalism primarily
reflects a change in the political orientations of the public, rather than changes in the environment’. The
attitudes and values of those born after the Second World War have been shaped by the experience of
economic well-being and physical security. This enables them to focus upon less material issues such as
the environment. As people become more concerned about their quality of life, and less concerned
about advancing their material welfare, they are expected to be more concerned about the impact of
industrialisation and its effect on the environment. Inglehart (1990, p.56) states that one consequence of
the shift from Materialist priorities to Post-Materialist goals ‘has been a diminishing emphasis on
economic growth in these societies, together with increasing emphasis on environmental protection and
preserving the quality of life – if necessary, even at the expense of economic growth… Post-
Materialists place more emphasis on protecting the environment and are far more likely to be active
members of environmental organizations that are Materialists’. This report will examine whether or not
the same can be said about those who hold Post-Materialist values in Ireland.
1.2.3 Cultural Theory/Grid-Group Theory
The third and final theoretical perspective that we consider is alternatively labelled Cultural Theory or
Grid-Group Theory and has been developed since the 1970s, initially by Douglas (1970 and 1982), then
in co-operation with Wildavsky (Douglas and Wildavsky, 1982). This is a theory of social relations and
cultural preferences. Two central aspects of social relationships are explored: the grid dimension (which
focuses on restrictions on individual behaviour and the extent of acceptance of rules and regulations and
is sometimes referred to as the ‘legitimation of external prescription’4) and the group dimension of
social relations (the extent of a sense of responsibility and commitment that individuals have to units
greater than themselves and the extent to which they are incorporated into these units). (Grendstad,
2003; Vaughan, 2002; Coughlin and Lockhart, 1998) However, it is only in the 1990s that Cultural
Theory or Grid-Group Theory has begun to be tested empirically using quantitative studies. (Thompson
et al, 1990; Coughlin and Lockhart, 1998; Ellis and Thompson, 1997; Grendstad, 2000, 2003)
4 Legitimacy of external prescription refers to the varying ease with which persons accept another person’s judgements are valid for, and binding on, them. (Coughlin and Lockhart, 1998, p.35)
6
The interrelationship of these two dimensions gives rise to a typology of four cultural biases, or as Ellis
and Thompson (1997, p.885) state Grid-Group Theory ‘posits four basic ways of organizing and
justifying social and political life’:
• Hierarchy: characterised by strong group boundaries and strong role prescription;
• Egalitarian: also characterised by strong group boundaries but weak role prescription;
• Individualism: is characterised by weak group boundaries and weak role prescription; while
• Fatalism: is characterised by weak group boundaries but strong role prescription.
The theory argues that each of these ways of organising social life has a related cultural bias, which
operates to justify this particular mode of social organisation. Each of these cultural biases includes
ideas about nature, the human-nature relationship and appropriate ways of relating to the environment.
For Grendstad (2003, p.3) each of the four cultural biases may be seen as a ‘justification’, which he
defines as ‘the social logic whereby individuals maintain their views and actions and make themselves
accountable to others’. In contemporary complex societies, all four sets of cultural biases may be
available, with the possibility of actors choosing one set in preference to others.
The first cultural bias is hierarchy and is characterised by strong group boundaries and strict role
prescriptions. The cultural bias here is towards a strong sense of commitment or responsibility for the
group, incorporation into it and an acceptance of its rules and regulations. There is a preference for
hierarchical and highly specified social relations, which in contemporary, advanced capitalist societies
may translate into a high level of acceptance of a bureaucratic and centralised form of administration. In
such societies there is a high level of trust in experts and a willingness to leave decisions to the
authorities. It is assumed that once authority and the requisite social relationships are maintained, the
order and the proper continuance of society will be assured. Those who adopt this view believe that
society as a whole will benefit from ‘rules, regulations and tight role definitions, handed down from
previous generations or elaborated by certified experts’. (Grendstad, 2003, p.3) Deviance from these
rules, regulations and role definitions only serves to threaten the hierarchical order and undermine the
ability of society to provide the best for all. (Grendstad, 2003, p.3) The theory argues that perspectives
regarding the natural world and how to relate to it tend to be consistent with this bias towards the
acceptance of hierarchical relationships and a sense of responsibility and commitment to the group as a
whole. Thus there is a sense of responsibility towards nature and its protection, while environmental
risks are assessed, regulated and managed by experts. Those who adopt a hierarchical bias see nature as
7
tolerant of change, but only within given limits; once established procedures ‘are unheeded and limits
transgressed, the system will collapse’. (Grendstad, 2000, p.219; see also Steg and Sievers, 2000)
The second cultural bias is egalitarian and is characterised by a strong sense of group boundaries but a
weak sense of role prescriptions. The cultural bias is towards a strong commitment to, and a sense of
responsibility for, the group, but with a questioning of its rules and regulations regarding roles. There is
strong criticism of hierarchies, bureaucracies and a questioning of experts. People who use an
egalitarian justification feel that ‘the natural harmony innate in all human beings’ is being obstructed by
unjust distribution of wealth, role differentiation and oppression. (Grendstad, 2003, p.3) Again, the
theory argues that there is a consistency (or Weber might say ‘elective affinity’) between the cultural
bias towards egalitarian relationships, which sees humanity as potentially in harmony but threatened by
hierarchical and other forces, and attitudes to nature. Thus with regard to the environment, those who
adopt an egalitarian justification also see nature as being in harmony, but this harmony is precariously
balanced and threatened. That the environment is so precariously balanced is a consequence of its
ephemeral and fragile state and with depleting resources ‘the least jolt may generate catastrophic and
irreversible outcomes’. (Grendstad, 2000, p.219; Steg and Sievers, 2000, p.254) The environment’s
fragility means that it is in need of protection from the risks taken by society, in particular society as
characterised by big business, government bureaucracies and scientific experts who exploit nature and
threaten its fragile balance. The theory argues that those who express a strongly egalitarian bias will be
concerned about the state of the environment and are expected to act in a manner that protects it.
The cultural bias of individualism is characterised by a weaker sense of responsibility for the wider
group or society as well as weak acceptance of regulations. The social and cultural preferences of an
individualist bias are for a weak sense of commitment to the group, for low-group boundaries, and for
weak role prescriptions. For them the social world is boundless. They not only support self-regulation
and market freedom, but also seek ‘to minimize authority other than that which is needed to guarantee
the functioning of markets of any kind’. (Grendstad, 2003, p.3) With regard to the environment, those
who adopt an individualistic justification regard nature as robust, benign and stable. Even if the
environment is over exploited it will heal either through its own abundant resources or the skills of
science, technology and market forces. The environment is capable of recovering from any external
shock and this implies that it is ‘an exploitable, skill-controlled cornucopia’. (Grendstad, 2000, p.219;
Steg and Sievers, 2000, p.254)
8
The fourth and final cultural bias is fatalism and is characterised by strong role prescriptions, usually
enforced by others, but by weak involvement in the group. The cultural bias is pessimistic with little
sense of political or social efficacy, and the world is seen as operating ‘without rhyme or reason and
man is fickle’. (Grendstad, 2003, p.3) For those who adopt a fatalistic justification, nature is seen as
capricious, unpredictable and characterised by chance. In their view, neither needs nor resources are
controllable, and they regard environmental risk as: what you don’t know, can’t harm you. (Steg and
Sievers, 2000, p.254) Dealing with environmental problems is one of simply coping, ‘physical nature is
therefore a lottery-controlled cornucopia’. (Grendstad, 2000, p.219)
This report examines the extent to which robust indices and scales can be identified regarding each of
these cultural biases given the data available in the ISSP Environmental module. However, having
noted the difficulties encountered in doing this, we examine the two dimensions, Grid and Group,
independently. We find a certain theoretical and empirical potency in doing this in terms of exploring
further the cultural sources of support for pro-environmental attitudes and behaviours in Ireland.
1.2.4 Socio-Demographic Variables
Faughnan and McCabe (1998) who analysed the 1993 ISSP Environmental module for Ireland found
that support for the environment was higher among younger respondents, those with relatively large
personal incomes and those with higher levels of educational attainment, than their counterparts. These
socio-demographic factors also correlated with levels of environmental knowledge and pro-
environment consumer behaviour. Research in the USA has shown that younger adults, the well
educated, political liberals, those voting Democrat, those employed outside the primary industries, and
those raised and living in urban areas are consistently more supportive of environmental protection than
their respective counterparts. On the other hand, race, gender, family income and occupational prestige
have been found to be relatively poor predictors. However, when all of these variables are taken
together they explain only about ten percent of the variance in environmental concern. (Jones and
Dunlap, 1992, p.39) Dietz et al (1998), who analysed the 1993 ISSP data for the USA, also found that
age, education, gender, race, liberalism and denomination again explained only a small percentage of
the variance in pro-environmental attitudes and behaviours.
The overall low level of variance explained by demographic factors has spurred a continued drive to
develop more robust and powerful explanatory models. When Dietz et al (1998) using data from the
1993 General Social Survey included general worldviews, or value-dimensions, such as post-
materialism and beliefs related to the New Environmental Paradigm, in their model, they found that
9
these value-dimensions explained more of the variance than the social structural variables. Likewise,
Ellis and Thompson (1997) in their study located in the Pacific Northwest of USA found that the Grid-
Group variables of egalitarianism and individualism explained the greatest amount of variance in
environmental attitudes.
1.3 Environmental Attitudes and Behaviour
Attitudes towards the environment and environmental friendly behaviours vary tremendously within
Ireland (in the next Research Programme on Environmental Attitudes, Values and Behaviour report we
consider how these attitudes and behaviours vary across countries). Attitudes differ from values and
worldviews in that they refer to a specific person, object, idea or action, while values are seen as the
criteria that people use to evaluate people and events and justify actions. (Schwartz, 1992) Bagozzi et al
(2002, p.170) define an attitude as ‘a psychological tendency to respond evaluatively to persons,
physical objects, ideas or actions in favourable or unfavourable ways’.
The first set of attitudes that we consider in this report is ‘perceptions of danger to the environment’. In
the ISSP Environment module respondents were asked how dangerous seven different ‘items’ were for
the environment. The seven items capture a wide variety of environmental threats: air pollution caused
by cars and industry; pesticides and chemicals used in farming; pollution of Ireland’s rivers, streams
and lakes; rising world temperatures caused by the ‘greenhouse effect’; modifying the genes of certain
crops; and nuclear power stations.
The second set of attitudes to the environment that we consider is the willingness of respondents to take
on extra costs to protect the environment. While people may wish to protect the environment, this is not
a costless goal. Witherspoon (1996) reports that in most countries environmental concern is
substantially higher than environmental action. The ISSP Environment module includes items designed
to gauge the willingness of respondents to make sacrifices for the sake of the environment: respondents’
willingness to pay higher prices and taxes as well as their willingness to accept cuts in their standards of
living in order to protect the environment. These questions explicitly highlight the link between support
for environmental protection and the associated costs involved. (Young, 1990; Dalton and
Rohrschneider, 1998)
10
A third set of attitudes relates to how ‘efficacious’ respondents feel in dealing with environmental
problems. Here respondents are asked whether or not they feel it is worth putting in the effort to look
after the environment. While respondents are asked about the impact that they themselves, as
individuals, can have on environmental problems, respondents are also asked about the impact that they
feel they can have if they pull together as a group. The next set of environmental attitudes that we
consider are respondents’ attitudes to various sources of information about the environment. Both the
NEP and Post-Materialism suggest that the public is increasingly sceptical about the validity of
different sources of information. In order to examine this, respondents are asked how much trust they
have in business and industry, environmental groups, government departments, newspapers, radio or
TV programmes and university research centres to give correct information about the causes of
pollution. Finally, in addition to the items carried in the ISSP Environment module, four items dealing
with waste were asked in the self-completion module of the ISPAS. Two of these items dealt with
recycling while the other two addressed the issues of incinerators and landfill.
Of course we are not simply interested in exploring what people think about various aspects of the
environment, we are also concerned with understanding their behaviours, that is, what they do. In this
report ‘behaviour’ refers to the reported actions of individual respondents. The first set of actions that
we consider are whether or not respondents report sorting household waste for recycling and cutting
back on car usage in order to protect the environment. The second set of behavioural items refers to the
reported actions of respondents targeted at policy makers. There is a wide span of activities considered,
from indirect action such as petition signing and giving money to environmental groups, to more direct
forms of action, including joining a group whose main aim is to preserve or protect the environment as
well as participating in protests or demonstrations on environmental issues.
1.4 Summary
The aim of this report is to examine whether or not the three theoretical frameworks considered in this
project help us understand why Irish people have differing attitudes to the environment and why some
behave in more environmentally friendly ways than others. In Chapters 3-5, drawing upon the ISSP data
set, we consider the extent to which the New Environmental Paradigm, Post-Materialism and Grid-
Group dimensions of the Cultural Values paradigm can be identified in Ireland. Furthermore, having
been identified, can these be related to pro-environmental attitudes and behaviours, and hence, can they
be seen as offering broad cultural support for environmentalist orientations? In Chapter 6 we compare

11
the extent to which each of these three theories, along with socio-demographic variables, explain the
variance in Irish people’s attitudes and behaviour to the environment, and hence their comparative
explanatory potency in the Irish context. However, firstly we need to outline these differences in
attitudes and behaviours and related demographic patterns.

12
13
Chapter 2
Environmental Attitudes and Behaviours
2.1 Introduction
The aim of this chapter is to outline those environmental attitudes and behaviours that form the focus of
our attention over the next few chapters. In so doing we will describe the responses of Irish people
when asked about their concerns regarding threats to the environment, who they trust as sources of
information about the causes of pollution, what they are willing to do to protect the environment, how
they think waste should be dealt with and what they themselves actually do. The purpose here is to
firstly, outline the differences in responses: some people are more concerned about the environment
than others; some are more active in promoting the environment as a social and political issue than
others. In all we will consider ten sets of environmental attitudes and six environmental behaviours.
Secondly, we will consider a variety of socio-demographic variables and how they help us to
understand people’s environmental attitudes and behaviours. These socio-demographic variables
describe respondents in a variety of social contexts, such as, gender, social class, levels of formal
education and so on.
2.2 Environmental Attitudes
2.2.1 Perceptions of Environmental Dangers
Beliefs about environmental risks are an important aspect of environmental research. Prescott-Clarke
and Hedges (1987) have found that rather than being concerned about the environment in general,
concern is often triggered by particular subject matters, such as nuclear power. In the ISSP Environment
module respondents were asked how dangerous seven different items are for the environment. As is
evident from Table 2.1, Irish respondents see threats to the environment from a wide variety of sources.
Despite the fact that there are no nuclear power stations in Ireland, the long running concerns over
Sellafield are reflected by a large majority of Irish people regarding nuclear power stations as being
either extremely or very dangerous for the environment. With regard to the other items, the percentages
regarding these items as either extremely or very dangerous for the environment range from 49 percent
14
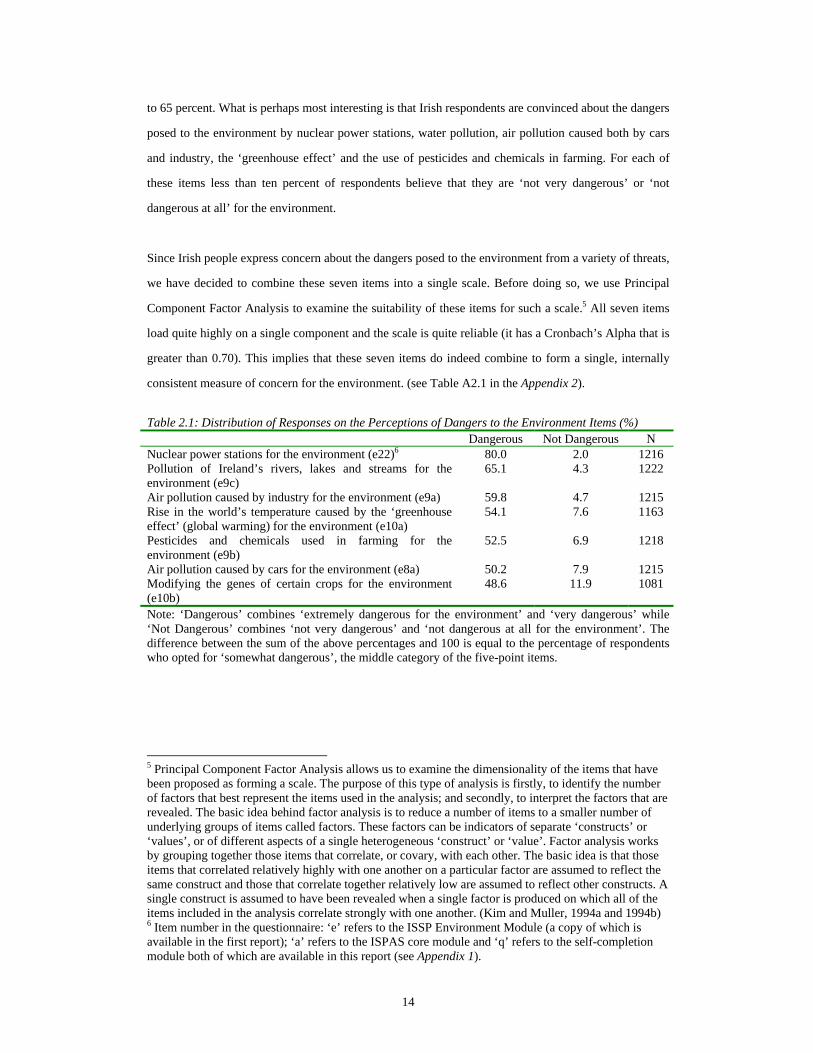
to 65 percent. What is perhaps most interesting is that Irish respondents are convinced about the dangers
posed to the environment by nuclear power stations, water pollution, air pollution caused both by cars
and industry, the ‘greenhouse effect’ and the use of pesticides and chemicals in farming. For each of
these items less than ten percent of respondents believe that they are ‘not very dangerous’ or ‘not
dangerous at all’ for the environment.
Since Irish people express concern about the dangers posed to the environment from a variety of threats,
we have decided to combine these seven items into a single scale. Before doing so, we use Principal
Component Factor Analysis to examine the suitability of these items for such a scale.5 All seven items
load quite highly on a single component and the scale is quite reliable (it has a Cronbach’s Alpha that is
greater than 0.70). This implies that these seven items do indeed combine to form a single, internally
consistent measure of concern for the environment. (see Table A2.1 in the Appendix 2).
Table 2.1: Distribution of Responses on the Perceptions of Dangers to the Environment Items (%) Dangerous Not Dangerous N Nuclear power stations for the environment (e22)6 80.0 2.0 1216 Pollution of Ireland’s rivers, lakes and streams for the environment (e9c)
65.1 4.3 1222
Air pollution caused by industry for the environment (e9a) 59.8 4.7 1215 Rise in the world’s temperature caused by the ‘greenhouse effect’ (global warming) for the environment (e10a)
54.1 7.6 1163
Pesticides and chemicals used in farming for the environment (e9b)
52.5 6.9 1218
Air pollution caused by cars for the environment (e8a) 50.2 7.9 1215 Modifying the genes of certain crops for the environment (e10b)
48.6 11.9 1081
Note: ‘Dangerous’ combines ‘extremely dangerous for the environment’ and ‘very dangerous’ while ‘Not Dangerous’ combines ‘not very dangerous’ and ‘not dangerous at all for the environment’. The difference between the sum of the above percentages and 100 is equal to the percentage of respondents who opted for ‘somewhat dangerous’, the middle category of the five-point items.
5 Principal Component Factor Analysis allows us to examine the dimensionality of the items that have been proposed as forming a scale. The purpose of this type of analysis is firstly, to identify the number of factors that best represent the items used in the analysis; and secondly, to interpret the factors that are revealed. The basic idea behind factor analysis is to reduce a number of items to a smaller number of underlying groups of items called factors. These factors can be indicators of separate ‘constructs’ or ‘values’, or of different aspects of a single heterogeneous ‘construct’ or ‘value’. Factor analysis works by grouping together those items that correlate, or covary, with each other. The basic idea is that those items that correlated relatively highly with one another on a particular factor are assumed to reflect the same construct and those that correlate together relatively low are assumed to reflect other constructs. A single construct is assumed to have been revealed when a single factor is produced on which all of the items included in the analysis correlate strongly with one another. (Kim and Muller, 1994a and 1994b) 6 Item number in the questionnaire: ‘e’ refers to the ISSP Environment Module (a copy of which is available in the first report); ‘a’ refers to the ISPAS core module and ‘q’ refers to the self-completion module both of which are available in this report (see Appendix 1).
15
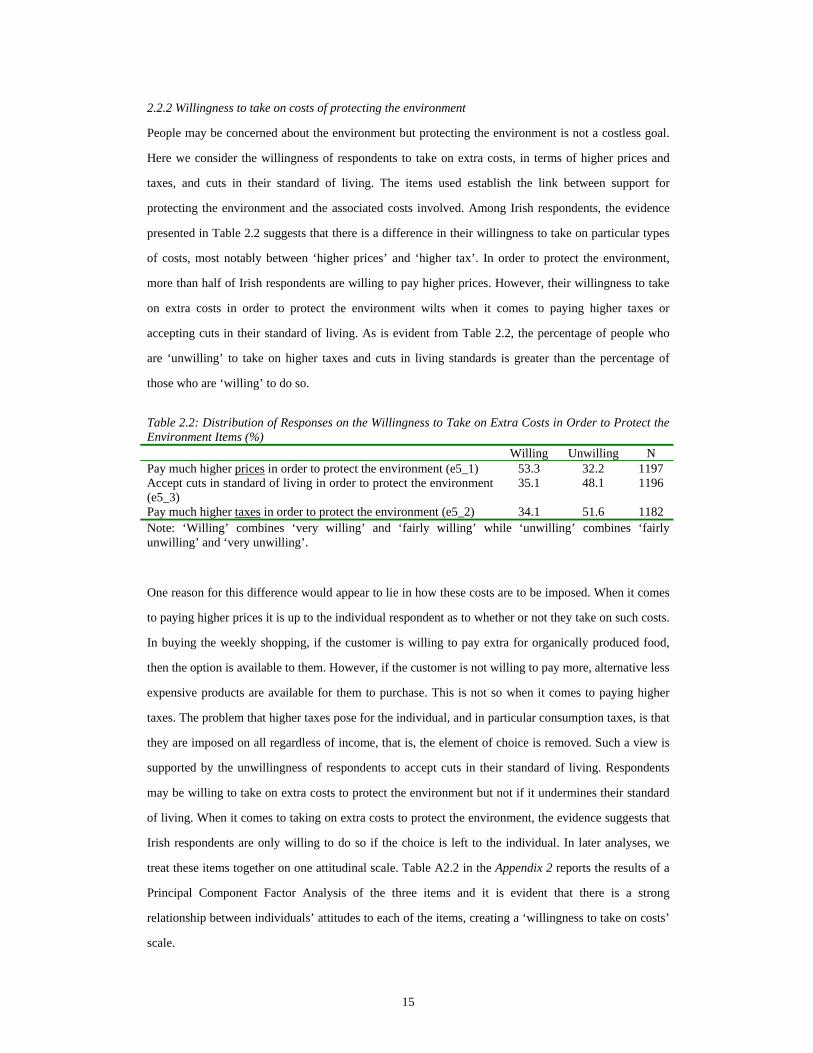
2.2.2 Willingness to take on costs of protecting the environment
People may be concerned about the environment but protecting the environment is not a costless goal.
Here we consider the willingness of respondents to take on extra costs, in terms of higher prices and
taxes, and cuts in their standard of living. The items used establish the link between support for
protecting the environment and the associated costs involved. Among Irish respondents, the evidence
presented in Table 2.2 suggests that there is a difference in their willingness to take on particular types
of costs, most notably between ‘higher prices’ and ‘higher tax’. In order to protect the environment,
more than half of Irish respondents are willing to pay higher prices. However, their willingness to take
on extra costs in order to protect the environment wilts when it comes to paying higher taxes or
accepting cuts in their standard of living. As is evident from Table 2.2, the percentage of people who
are ‘unwilling’ to take on higher taxes and cuts in living standards is greater than the percentage of
those who are ‘willing’ to do so.
Table 2.2: Distribution of Responses on the Willingness to Take on Extra Costs in Order to Protect the Environment Items (%) Willing Unwilling N Pay much higher prices in order to protect the environment (e5_1) 53.3 32.2 1197 Accept cuts in standard of living in order to protect the environment (e5_3)
35.1 48.1 1196
Pay much higher taxes in order to protect the environment (e5_2) 34.1 51.6 1182 Note: ‘Willing’ combines ‘very willing’ and ‘fairly willing’ while ‘unwilling’ combines ‘fairly unwilling’ and ‘very unwilling’.
One reason for this difference would appear to lie in how these costs are to be imposed. When it comes
to paying higher prices it is up to the individual respondent as to whether or not they take on such costs.
In buying the weekly shopping, if the customer is willing to pay extra for organically produced food,
then the option is available to them. However, if the customer is not willing to pay more, alternative less
expensive products are available for them to purchase. This is not so when it comes to paying higher
taxes. The problem that higher taxes pose for the individual, and in particular consumption taxes, is that
they are imposed on all regardless of income, that is, the element of choice is removed. Such a view is
supported by the unwillingness of respondents to accept cuts in their standard of living. Respondents
may be willing to take on extra costs to protect the environment but not if it undermines their standard
of living. When it comes to taking on extra costs to protect the environment, the evidence suggests that
Irish respondents are only willing to do so if the choice is left to the individual. In later analyses, we
treat these items together on one attitudinal scale. Table A2.2 in the Appendix 2 reports the results of a
Principal Component Factor Analysis of the three items and it is evident that there is a strong
relationship between individuals’ attitudes to each of the items, creating a ‘willingness to take on costs’
scale.
16
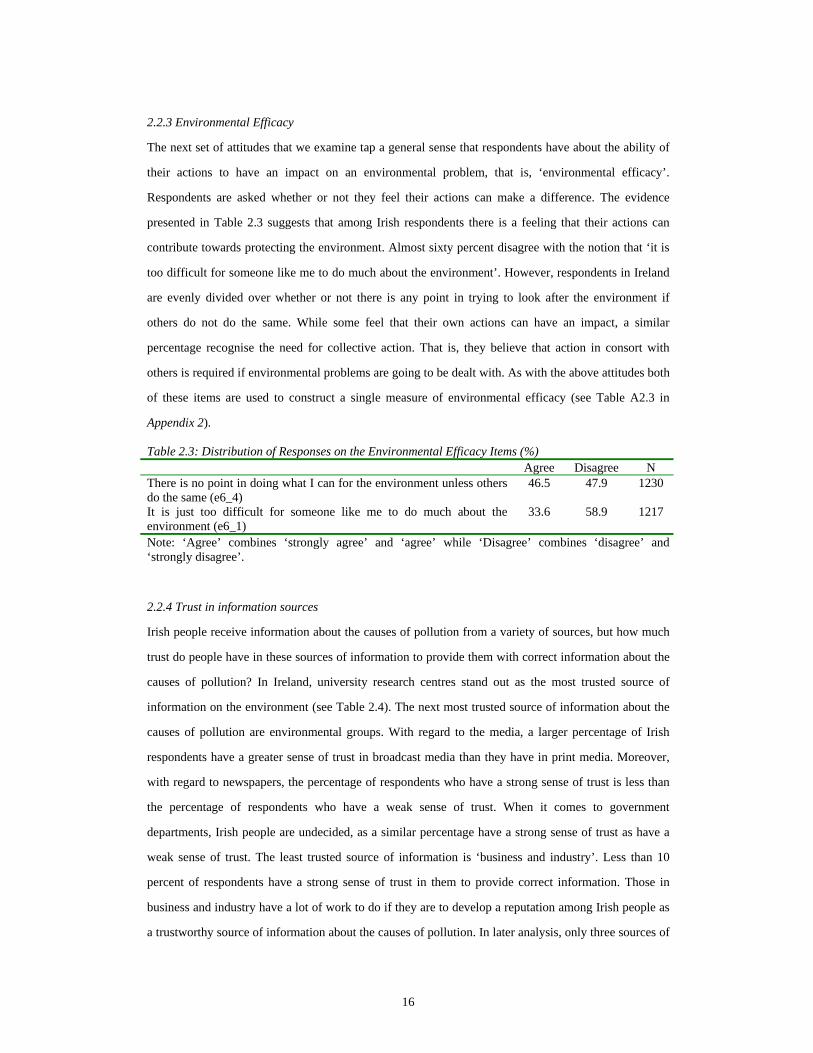
2.2.3 Environmental Efficacy
The next set of attitudes that we examine tap a general sense that respondents have about the ability of
their actions to have an impact on an environmental problem, that is, ‘environmental efficacy’.
Respondents are asked whether or not they feel their actions can make a difference. The evidence
presented in Table 2.3 suggests that among Irish respondents there is a feeling that their actions can
contribute towards protecting the environment. Almost sixty percent disagree with the notion that ‘it is
too difficult for someone like me to do much about the environment’. However, respondents in Ireland
are evenly divided over whether or not there is any point in trying to look after the environment if
others do not do the same. While some feel that their own actions can have an impact, a similar
percentage recognise the need for collective action. That is, they believe that action in consort with
others is required if environmental problems are going to be dealt with. As with the above attitudes both
of these items are used to construct a single measure of environmental efficacy (see Table A2.3 in
Appendix 2). Table 2.3: Distribution of Responses on the Environmental Efficacy Items (%) Agree Disagree N There is no point in doing what I can for the environment unless others do the same (e6_4)
46.5 47.9 1230
It is just too difficult for someone like me to do much about the environment (e6_1)
33.6 58.9 1217
Note: ‘Agree’ combines ‘strongly agree’ and ‘agree’ while ‘Disagree’ combines ‘disagree’ and ‘strongly disagree’.
2.2.4 Trust in information sources
Irish people receive information about the causes of pollution from a variety of sources, but how much
trust do people have in these sources of information to provide them with correct information about the
causes of pollution? In Ireland, university research centres stand out as the most trusted source of
information on the environment (see Table 2.4). The next most trusted source of information about the
causes of pollution are environmental groups. With regard to the media, a larger percentage of Irish
respondents have a greater sense of trust in broadcast media than they have in print media. Moreover,
with regard to newspapers, the percentage of respondents who have a strong sense of trust is less than
the percentage of respondents who have a weak sense of trust. When it comes to government
departments, Irish people are undecided, as a similar percentage have a strong sense of trust as have a
weak sense of trust. The least trusted source of information is ‘business and industry’. Less than 10
percent of respondents have a strong sense of trust in them to provide correct information. Those in
business and industry have a lot of work to do if they are to develop a reputation among Irish people as
a trustworthy source of information about the causes of pollution. In later analysis, only three sources of
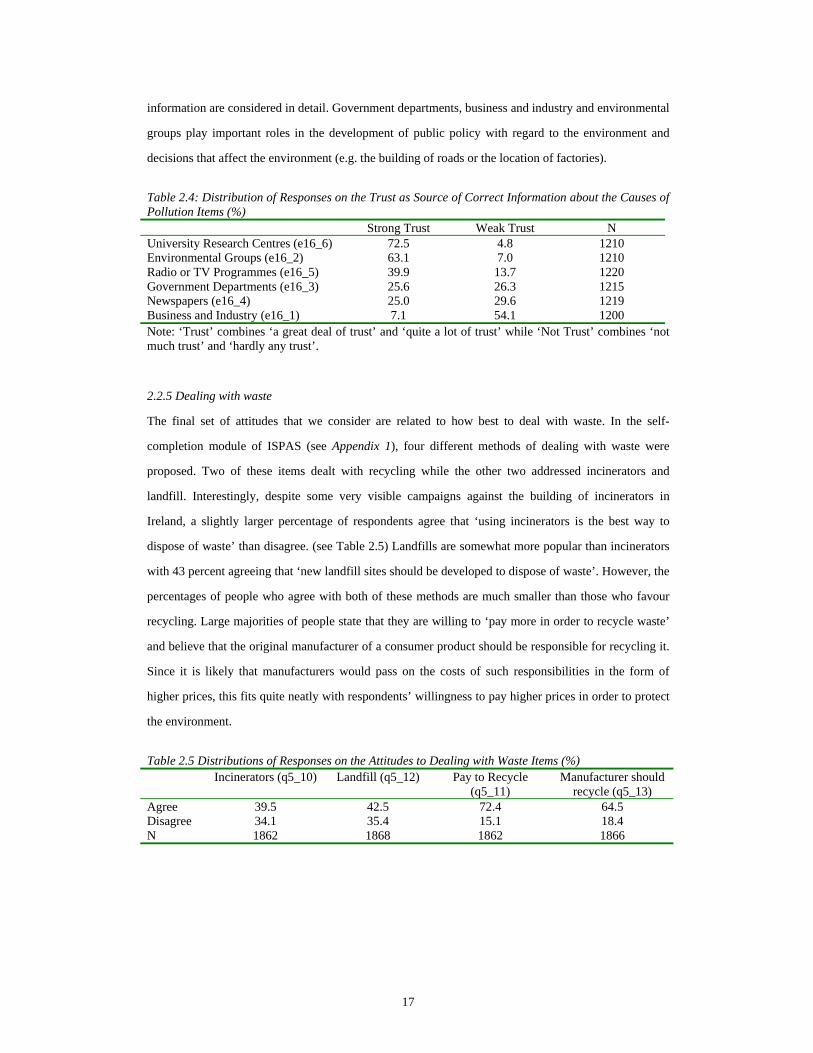
17
information are considered in detail. Government departments, business and industry and environmental
groups play important roles in the development of public policy with regard to the environment and
decisions that affect the environment (e.g. the building of roads or the location of factories).
Table 2.4: Distribution of Responses on the Trust as Source of Correct Information about the Causes of Pollution Items (%) Strong Trust Weak Trust N University Research Centres (e16_6) 72.5 4.8 1210 Environmental Groups (e16_2) 63.1 7.0 1210 Radio or TV Programmes (e16_5) 39.9 13.7 1220 Government Departments (e16_3) 25.6 26.3 1215 Newspapers (e16_4) 25.0 29.6 1219 Business and Industry (e16_1) 7.1 54.1 1200 Note: ‘Trust’ combines ‘a great deal of trust’ and ‘quite a lot of trust’ while ‘Not Trust’ combines ‘not much trust’ and ‘hardly any trust’.
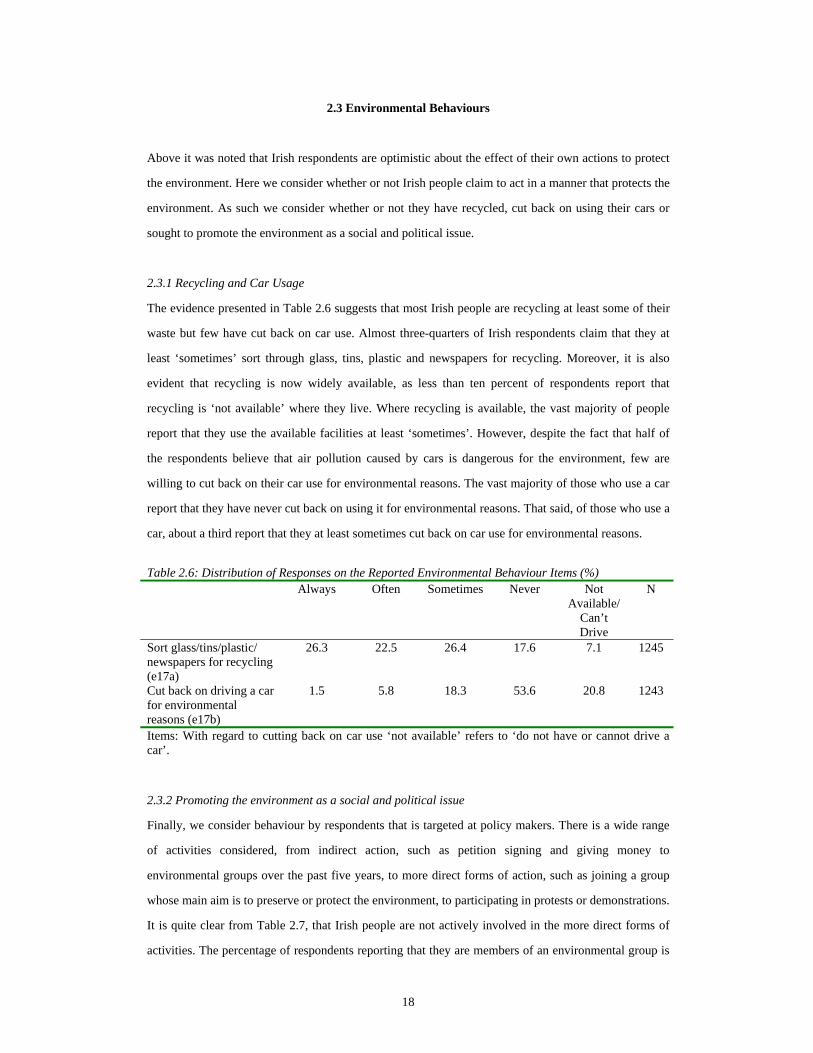
2.2.5 Dealing with waste
The final set of attitudes that we consider are related to how best to deal with waste. In the self-
completion module of ISPAS (see Appendix 1), four different methods of dealing with waste were
proposed. Two of these items dealt with recycling while the other two addressed incinerators and
landfill. Interestingly, despite some very visible campaigns against the building of incinerators in
Ireland, a slightly larger percentage of respondents agree that ‘using incinerators is the best way to
dispose of waste’ than disagree. (see Table 2.5) Landfills are somewhat more popular than incinerators
with 43 percent agreeing that ‘new landfill sites should be developed to dispose of waste’. However, the
percentages of people who agree with both of these methods are much smaller than those who favour
recycling. Large majorities of people state that they are willing to ‘pay more in order to recycle waste’
and believe that the original manufacturer of a consumer product should be responsible for recycling it.
Since it is likely that manufacturers would pass on the costs of such responsibilities in the form of
higher prices, this fits quite neatly with respondents’ willingness to pay higher prices in order to protect
the environment.
Table 2.5 Distributions of Responses on the Attitudes to Dealing with Waste Items (%) Incinerators (q5_10) Landfill (q5_12) Pay to Recycle
(q5_11) Manufacturer should
recycle (q5_13) Agree 39.5 42.5 72.4 64.5 Disagree 34.1 35.4 15.1 18.4 N 1862 1868 1862 1866
18
2.3 Environmental Behaviours
Above it was noted that Irish respondents are optimistic about the effect of their own actions to protect
the environment. Here we consider whether or not Irish people claim to act in a manner that protects the
environment. As such we consider whether or not they have recycled, cut back on using their cars or
sought to promote the environment as a social and political issue.
2.3.1 Recycling and Car Usage
The evidence presented in Table 2.6 suggests that most Irish people are recycling at least some of their
waste but few have cut back on car use. Almost three-quarters of Irish respondents claim that they at
least ‘sometimes’ sort through glass, tins, plastic and newspapers for recycling. Moreover, it is also
evident that recycling is now widely available, as less than ten percent of respondents report that
recycling is ‘not available’ where they live. Where recycling is available, the vast majority of people
report that they use the available facilities at least ‘sometimes’. However, despite the fact that half of
the respondents believe that air pollution caused by cars is dangerous for the environment, few are
willing to cut back on their car use for environmental reasons. The vast majority of those who use a car
report that they have never cut back on using it for environmental reasons. That said, of those who use a
car, about a third report that they at least sometimes cut back on car use for environmental reasons.
Table 2.6: Distribution of Responses on the Reported Environmental Behaviour Items (%) Always Often Sometimes Never Not
Available/ Can’t Drive
N
Sort glass/tins/plastic/ newspapers for recycling (e17a)
26.3 22.5 26.4 17.6 7.1 1245
Cut back on driving a car for environmental reasons (e17b)
1.5 5.8 18.3 53.6 20.8 1243
Items: With regard to cutting back on car use ‘not available’ refers to ‘do not have or cannot drive a car’.
2.3.2 Promoting the environment as a social and political issue
Finally, we consider behaviour by respondents that is targeted at policy makers. There is a wide range
of activities considered, from indirect action, such as petition signing and giving money to
environmental groups over the past five years, to more direct forms of action, such as joining a group
whose main aim is to preserve or protect the environment, to participating in protests or demonstrations.
It is quite clear from Table 2.7, that Irish people are not actively involved in the more direct forms of
activities. The percentage of respondents reporting that they are members of an environmental group is
19
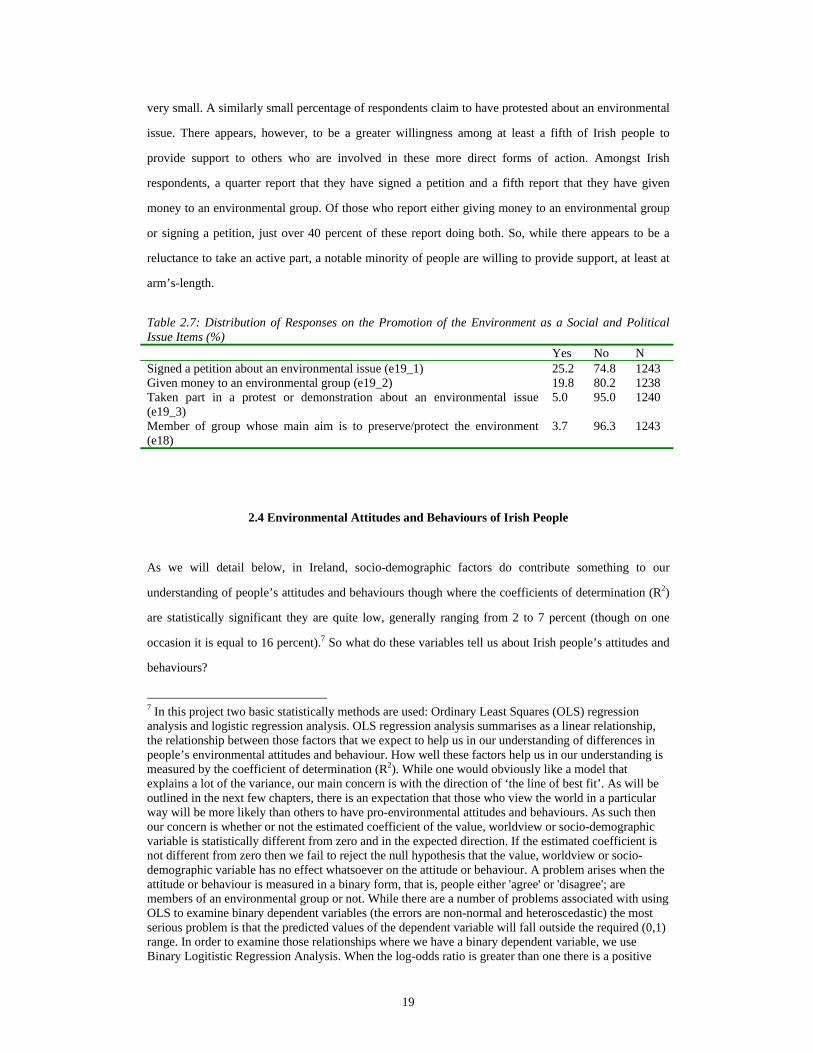
very small. A similarly small percentage of respondents claim to have protested about an environmental
issue. There appears, however, to be a greater willingness among at least a fifth of Irish people to
provide support to others who are involved in these more direct forms of action. Amongst Irish
respondents, a quarter report that they have signed a petition and a fifth report that they have given
money to an environmental group. Of those who report either giving money to an environmental group
or signing a petition, just over 40 percent of these report doing both. So, while there appears to be a
reluctance to take an active part, a notable minority of people are willing to provide support, at least at
arm’s-length.
Table 2.7: Distribution of Responses on the Promotion of the Environment as a Social and Political Issue Items (%) Yes No N Signed a petition about an environmental issue (e19_1) 25.2 74.8 1243 Given money to an environmental group (e19_2) 19.8 80.2 1238 Taken part in a protest or demonstration about an environmental issue (e19_3)
5.0 95.0 1240
Member of group whose main aim is to preserve/protect the environment (e18)
3.7 96.3 1243
2.4 Environmental Attitudes and Behaviours of Irish People
As we will detail below, in Ireland, socio-demographic factors do contribute something to our
understanding of people’s attitudes and behaviours though where the coefficients of determination (R2)
are statistically significant they are quite low, generally ranging from 2 to 7 percent (though on one
occasion it is equal to 16 percent).7 So what do these variables tell us about Irish people’s attitudes and
behaviours?
7 In this project two basic statistically methods are used: Ordinary Least Squares (OLS) regression analysis and logistic regression analysis. OLS regression analysis summarises as a linear relationship, the relationship between those factors that we expect to help us in our understanding of differences in people’s environmental attitudes and behaviour. How well these factors help us in our understanding is measured by the coefficient of determination (R2). While one would obviously like a model that explains a lot of the variance, our main concern is with the direction of ‘the line of best fit’. As will be outlined in the next few chapters, there is an expectation that those who view the world in a particular way will be more likely than others to have pro-environmental attitudes and behaviours. As such then our concern is whether or not the estimated coefficient of the value, worldview or socio-demographic variable is statistically different from zero and in the expected direction. If the estimated coefficient is not different from zero then we fail to reject the null hypothesis that the value, worldview or socio-demographic variable has no effect whatsoever on the attitude or behaviour. A problem arises when the attitude or behaviour is measured in a binary form, that is, people either 'agree' or 'disagree'; are members of an environmental group or not. While there are a number of problems associated with using OLS to examine binary dependent variables (the errors are non-normal and heteroscedastic) the most serious problem is that the predicted values of the dependent variable will fall outside the required (0,1) range. In order to examine those relationships where we have a binary dependent variable, we use Binary Logitistic Regression Analysis. When the log-odds ratio is greater than one there is a positive
20
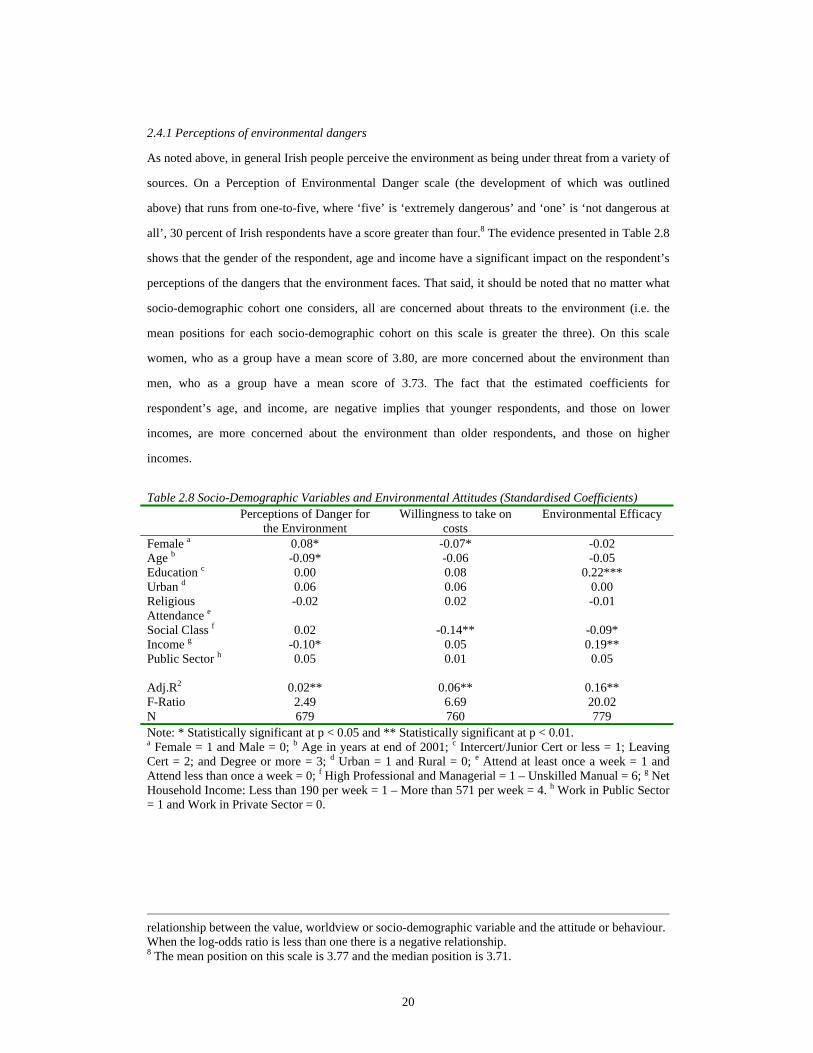
2.4.1 Perceptions of environmental dangers
As noted above, in general Irish people perceive the environment as being under threat from a variety of
sources. On a Perception of Environmental Danger scale (the development of which was outlined
above) that runs from one-to-five, where ‘five’ is ‘extremely dangerous’ and ‘one’ is ‘not dangerous at
all’, 30 percent of Irish respondents have a score greater than four.8 The evidence presented in Table 2.8
shows that the gender of the respondent, age and income have a significant impact on the respondent’s
perceptions of the dangers that the environment faces. That said, it should be noted that no matter what
socio-demographic cohort one considers, all are concerned about threats to the environment (i.e. the
mean positions for each socio-demographic cohort on this scale is greater the three). On this scale
women, who as a group have a mean score of 3.80, are more concerned about the environment than
men, who as a group have a mean score of 3.73. The fact that the estimated coefficients for
respondent’s age, and income, are negative implies that younger respondents, and those on lower
incomes, are more concerned about the environment than older respondents, and those on higher
incomes.
Table 2.8 Socio-Demographic Variables and Environmental Attitudes (Standardised Coefficients) Perceptions of Danger for
the Environment Willingness to take on
costs Environmental Efficacy
Female a 0.08* -0.07* -0.02 Age b -0.09* -0.06 -0.05 Education c 0.00 0.08 0.22*** Urban d 0.06 0.06 0.00 Religious Attendance e
-0.02 0.02 -0.01
Social Class f 0.02 -0.14** -0.09* Income g -0.10* 0.05 0.19** Public Sector h 0.05 0.01 0.05 Adj.R2 0.02** 0.06** 0.16** F-Ratio 2.49 6.69 20.02 N 679 760 779 Note: * Statistically significant at p < 0.05 and ** Statistically significant at p < 0.01. a Female = 1 and Male = 0; b Age in years at end of 2001; c Intercert/Junior Cert or less = 1; Leaving Cert = 2; and Degree or more = 3; d Urban = 1 and Rural = 0; e Attend at least once a week = 1 and Attend less than once a week = 0; f High Professional and Managerial = 1 – Unskilled Manual = 6; g Net Household Income: Less than 190 per week = 1 – More than 571 per week = 4. h Work in Public Sector = 1 and Work in Private Sector = 0.
relationship between the value, worldview or socio-demographic variable and the attitude or behaviour. When the log-odds ratio is less than one there is a negative relationship. 8 The mean position on this scale is 3.77 and the median position is 3.71.
21
2.4.2 Willingness to take on extra costs
The distribution of Irish respondents on this scale is more or less evenly divided between those who are
willing to take on extra costs and those who are not.9 The evidence presented in Table 2.8 implies that
the respondents’ gender and their social class has a significant impact on their willingness to take on
these costs. When we consider the mean positions of both genders neither appears to be willing to take
on the extra costs, but men, who as a group have a mean score of 2.91, are more willing than women,
who as a group have a mean score of 2.79. However, the mean positions of those in Social Classes I and
II suggest that these groups are willing to take on extra costs of protecting the environment as the mean
scores for both of these groups are 3.24 and 3.18 respectively. Those in the other social classes are less
willing, with the least willing being those in Social Class IV, who as a group have a mean score of 2.49.
2.4.3 Environmental efficacy
When it comes to whether or not Irish people feel their actions to protect the environment will be
effective, there is almost an even divide between the percentage of respondents who feel optimistic
about the effect of their actions and those who feel pessimistic.10 However, some interesting differences
emerge when we consider each of the different socio-demographic variables. (see Table 2.8)
Respondents’ levels of education as well as their net household income and their social class are found
to have a significant impact on their feelings of efficacy with regard to dealing with environmental
problems. On this scale high scores are associated with strong feelings of efficacy, while low scores are
associated with weak feelings and the mid-point of the scale is equal to three. At one end of this scale
are those with the weakest feelings of efficacy: those with an Intermediate/Junior Certificate or less
have a mean position of 2.84; those who earn £190 or less per week have a mean position of 2.72; and
those in Social Category VI (Unskilled Manual Labour) have a mean position of 2.93. At the other end
of this scale are those with the strongest feelings of efficacy: those with a University degree or higher
have a mean position of 3.35; those who earn £571 or more per week have a mean position of 3.48; and
those in Social Category I (Higher Managerial and Professional and Farmers with more the 200 acres)
have a mean position of 3.45.
2.4.4 Trust in sources of information
With regard to trusting groups to provide them with correct information about the causes of pollution, a
large majority of Irish people trust environmental groups to do so, with few trusting business and
industry. The results presented in Table 2.9 imply that the socio-demographic variables do not 9 The mean position on this scale is 2.85 while the median position is 3.00. 10 The mean position on this scale is 3.15 while the median position is 3.00.
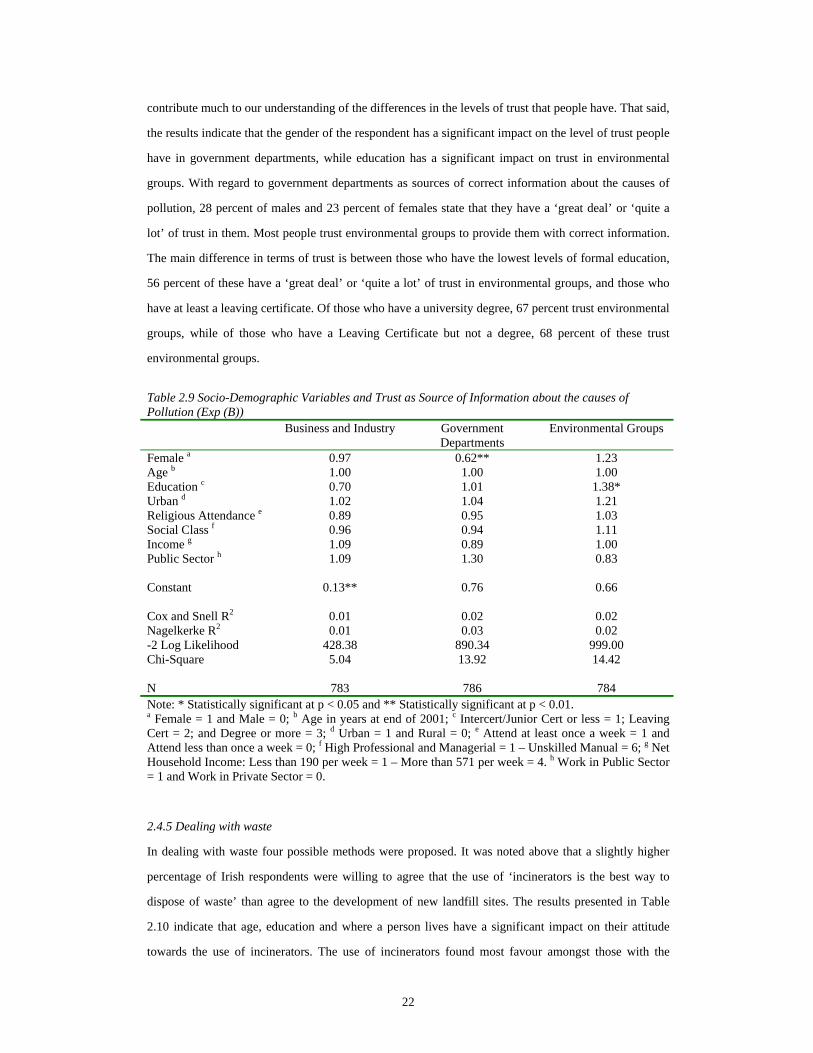
22
contribute much to our understanding of the differences in the levels of trust that people have. That said,
the results indicate that the gender of the respondent has a significant impact on the level of trust people
have in government departments, while education has a significant impact on trust in environmental
groups. With regard to government departments as sources of correct information about the causes of
pollution, 28 percent of males and 23 percent of females state that they have a ‘great deal’ or ‘quite a
lot’ of trust in them. Most people trust environmental groups to provide them with correct information.
The main difference in terms of trust is between those who have the lowest levels of formal education,
56 percent of these have a ‘great deal’ or ‘quite a lot’ of trust in environmental groups, and those who
have at least a leaving certificate. Of those who have a university degree, 67 percent trust environmental
groups, while of those who have a Leaving Certificate but not a degree, 68 percent of these trust
environmental groups.
Table 2.9 Socio-Demographic Variables and Trust as Source of Information about the causes of Pollution (Exp (B)) Business and Industry Government
Departments Environmental Groups
Female a 0.97 0.62** 1.23 Age b 1.00 1.00 1.00 Education c 0.70 1.01 1.38* Urban d 1.02 1.04 1.21 Religious Attendance e 0.89 0.95 1.03 Social Class f 0.96 0.94 1.11 Income g 1.09 0.89 1.00 Public Sector h 1.09 1.30 0.83 Constant 0.13** 0.76 0.66 Cox and Snell R2 0.01 0.02 0.02 Nagelkerke R2 0.01 0.03 0.02 -2 Log Likelihood 428.38 890.34 999.00 Chi-Square 5.04 13.92 14.42 N 783 786 784 Note: * Statistically significant at p < 0.05 and ** Statistically significant at p < 0.01. a Female = 1 and Male = 0; b Age in years at end of 2001; c Intercert/Junior Cert or less = 1; Leaving Cert = 2; and Degree or more = 3; d Urban = 1 and Rural = 0; e Attend at least once a week = 1 and Attend less than once a week = 0; f High Professional and Managerial = 1 – Unskilled Manual = 6; g Net Household Income: Less than 190 per week = 1 – More than 571 per week = 4. h Work in Public Sector = 1 and Work in Private Sector = 0.
2.4.5 Dealing with waste
In dealing with waste four possible methods were proposed. It was noted above that a slightly higher
percentage of Irish respondents were willing to agree that the use of ‘incinerators is the best way to
dispose of waste’ than agree to the development of new landfill sites. The results presented in Table
2.10 indicate that age, education and where a person lives have a significant impact on their attitude
towards the use of incinerators. The use of incinerators found most favour amongst those with the
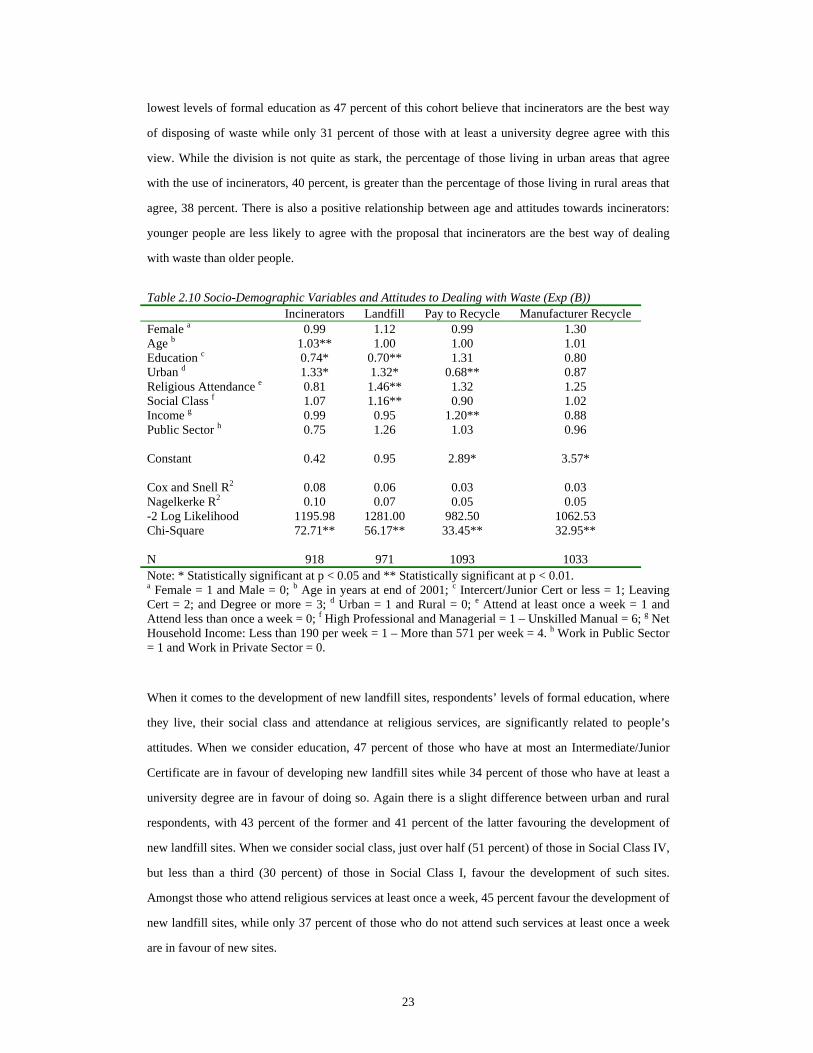
23
lowest levels of formal education as 47 percent of this cohort believe that incinerators are the best way
of disposing of waste while only 31 percent of those with at least a university degree agree with this
view. While the division is not quite as stark, the percentage of those living in urban areas that agree
with the use of incinerators, 40 percent, is greater than the percentage of those living in rural areas that
agree, 38 percent. There is also a positive relationship between age and attitudes towards incinerators:
younger people are less likely to agree with the proposal that incinerators are the best way of dealing
with waste than older people.
Table 2.10 Socio-Demographic Variables and Attitudes to Dealing with Waste (Exp (B)) Incinerators Landfill Pay to Recycle Manufacturer Recycle Female a 0.99 1.12 0.99 1.30 Age b 1.03** 1.00 1.00 1.01 Education c 0.74* 0.70** 1.31 0.80 Urban d 1.33* 1.32* 0.68** 0.87 Religious Attendance e 0.81 1.46** 1.32 1.25 Social Class f 1.07 1.16** 0.90 1.02 Income g 0.99 0.95 1.20** 0.88 Public Sector h 0.75 1.26 1.03 0.96 Constant 0.42 0.95 2.89* 3.57* Cox and Snell R2 0.08 0.06 0.03 0.03 Nagelkerke R2 0.10 0.07 0.05 0.05 -2 Log Likelihood 1195.98 1281.00 982.50 1062.53 Chi-Square 72.71** 56.17** 33.45** 32.95** N 918 971 1093 1033 Note: * Statistically significant at p < 0.05 and ** Statistically significant at p < 0.01. a Female = 1 and Male = 0; b Age in years at end of 2001; c Intercert/Junior Cert or less = 1; Leaving Cert = 2; and Degree or more = 3; d Urban = 1 and Rural = 0; e Attend at least once a week = 1 and Attend less than once a week = 0; f High Professional and Managerial = 1 – Unskilled Manual = 6; g Net Household Income: Less than 190 per week = 1 – More than 571 per week = 4. h Work in Public Sector = 1 and Work in Private Sector = 0.
When it comes to the development of new landfill sites, respondents’ levels of formal education, where
they live, their social class and attendance at religious services, are significantly related to people’s
attitudes. When we consider education, 47 percent of those who have at most an Intermediate/Junior
Certificate are in favour of developing new landfill sites while 34 percent of those who have at least a
university degree are in favour of doing so. Again there is a slight difference between urban and rural
respondents, with 43 percent of the former and 41 percent of the latter favouring the development of
new landfill sites. When we consider social class, just over half (51 percent) of those in Social Class IV,
but less than a third (30 percent) of those in Social Class I, favour the development of such sites.
Amongst those who attend religious services at least once a week, 45 percent favour the development of
new landfill sites, while only 37 percent of those who do not attend such services at least once a week
are in favour of new sites.
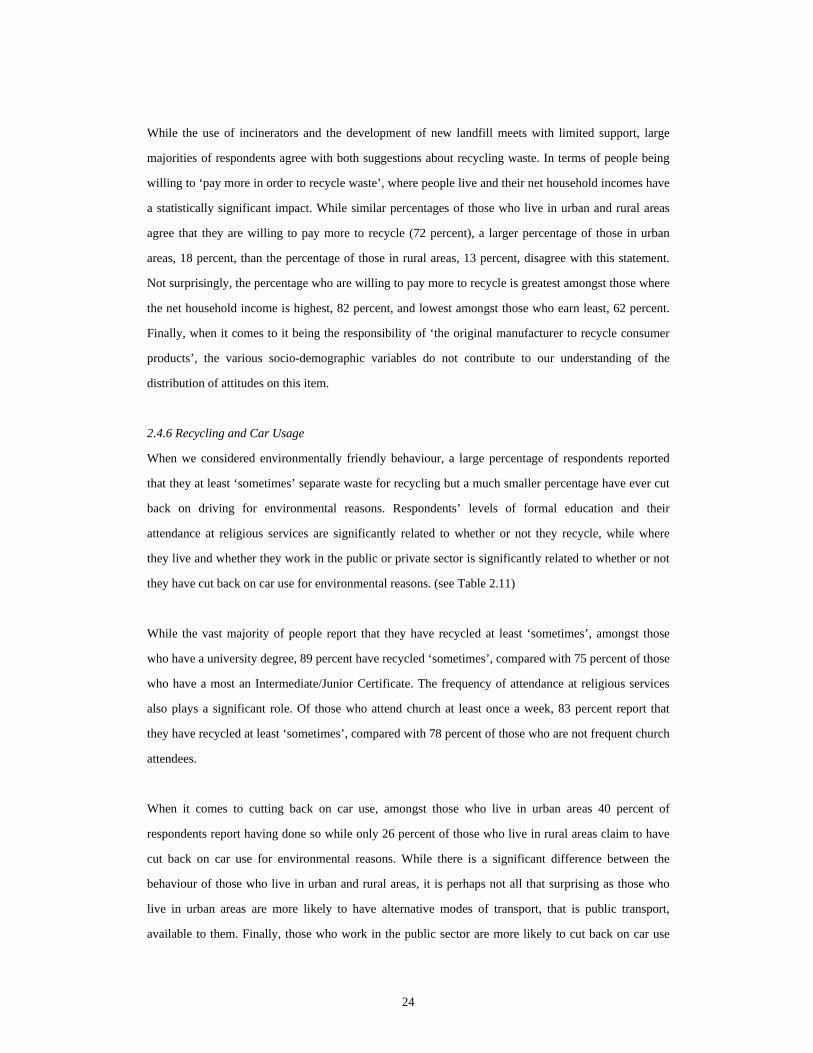
24
While the use of incinerators and the development of new landfill meets with limited support, large
majorities of respondents agree with both suggestions about recycling waste. In terms of people being
willing to ‘pay more in order to recycle waste’, where people live and their net household incomes have
a statistically significant impact. While similar percentages of those who live in urban and rural areas
agree that they are willing to pay more to recycle (72 percent), a larger percentage of those in urban
areas, 18 percent, than the percentage of those in rural areas, 13 percent, disagree with this statement.
Not surprisingly, the percentage who are willing to pay more to recycle is greatest amongst those where
the net household income is highest, 82 percent, and lowest amongst those who earn least, 62 percent.
Finally, when it comes to it being the responsibility of ‘the original manufacturer to recycle consumer
products’, the various socio-demographic variables do not contribute to our understanding of the
distribution of attitudes on this item.
2.4.6 Recycling and Car Usage
When we considered environmentally friendly behaviour, a large percentage of respondents reported
that they at least ‘sometimes’ separate waste for recycling but a much smaller percentage have ever cut
back on driving for environmental reasons. Respondents’ levels of formal education and their
attendance at religious services are significantly related to whether or not they recycle, while where
they live and whether they work in the public or private sector is significantly related to whether or not
they have cut back on car use for environmental reasons. (see Table 2.11)
While the vast majority of people report that they have recycled at least ‘sometimes’, amongst those
who have a university degree, 89 percent have recycled ‘sometimes’, compared with 75 percent of those
who have a most an Intermediate/Junior Certificate. The frequency of attendance at religious services
also plays a significant role. Of those who attend church at least once a week, 83 percent report that
they have recycled at least ‘sometimes’, compared with 78 percent of those who are not frequent church
attendees.
When it comes to cutting back on car use, amongst those who live in urban areas 40 percent of
respondents report having done so while only 26 percent of those who live in rural areas claim to have
cut back on car use for environmental reasons. While there is a significant difference between the
behaviour of those who live in urban and rural areas, it is perhaps not all that surprising as those who
live in urban areas are more likely to have alternative modes of transport, that is public transport,
available to them. Finally, those who work in the public sector are more likely to cut back on car use
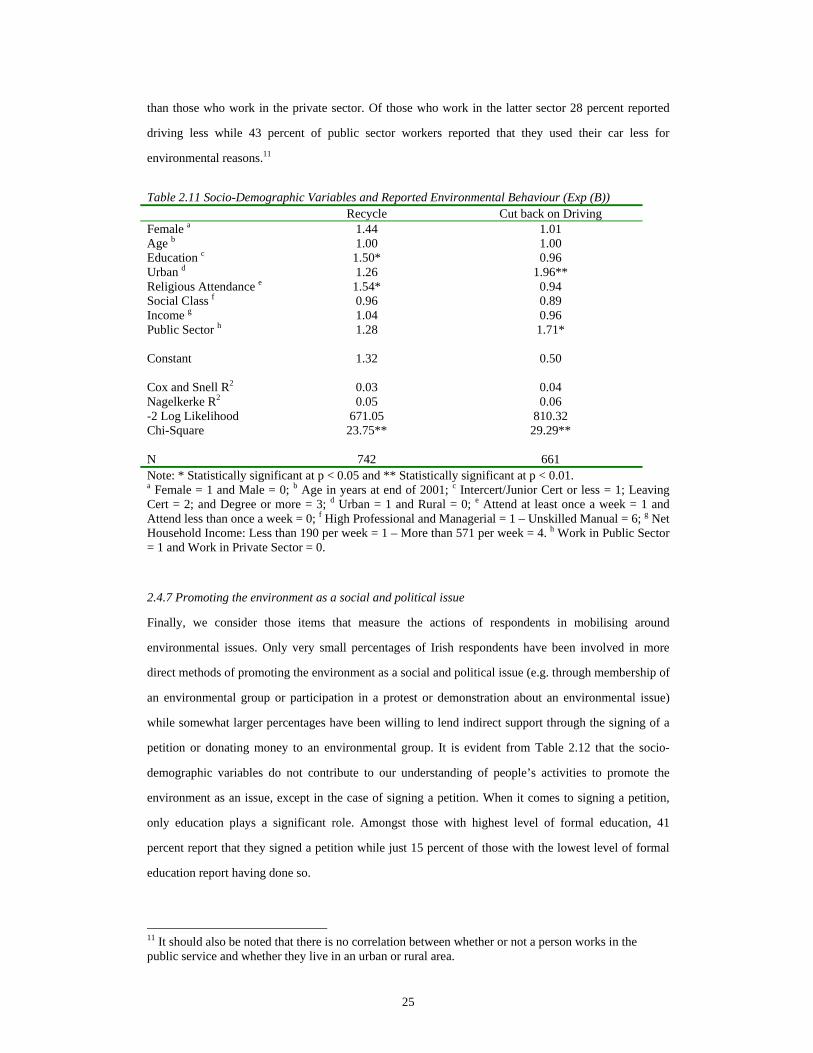
25
than those who work in the private sector. Of those who work in the latter sector 28 percent reported
driving less while 43 percent of public sector workers reported that they used their car less for
environmental reasons.11
Table 2.11 Socio-Demographic Variables and Reported Environmental Behaviour (Exp (B)) Recycle Cut back on Driving Female a 1.44 1.01 Age b 1.00 1.00 Education c 1.50* 0.96 Urban d 1.26 1.96** Religious Attendance e 1.54* 0.94 Social Class f 0.96 0.89 Income g 1.04 0.96 Public Sector h 1.28 1.71* Constant 1.32 0.50 Cox and Snell R2 0.03 0.04 Nagelkerke R2 0.05 0.06 -2 Log Likelihood 671.05 810.32 Chi-Square 23.75** 29.29** N 742 661 Note: * Statistically significant at p < 0.05 and ** Statistically significant at p < 0.01. a Female = 1 and Male = 0; b Age in years at end of 2001; c Intercert/Junior Cert or less = 1; Leaving Cert = 2; and Degree or more = 3; d Urban = 1 and Rural = 0; e Attend at least once a week = 1 and Attend less than once a week = 0; f High Professional and Managerial = 1 – Unskilled Manual = 6; g Net Household Income: Less than 190 per week = 1 – More than 571 per week = 4. h Work in Public Sector = 1 and Work in Private Sector = 0.
2.4.7 Promoting the environment as a social and political issue
Finally, we consider those items that measure the actions of respondents in mobilising around
environmental issues. Only very small percentages of Irish respondents have been involved in more
direct methods of promoting the environment as a social and political issue (e.g. through membership of
an environmental group or participation in a protest or demonstration about an environmental issue)
while somewhat larger percentages have been willing to lend indirect support through the signing of a
petition or donating money to an environmental group. It is evident from Table 2.12 that the socio-
demographic variables do not contribute to our understanding of people’s activities to promote the
environment as an issue, except in the case of signing a petition. When it comes to signing a petition,
only education plays a significant role. Amongst those with highest level of formal education, 41
percent report that they signed a petition while just 15 percent of those with the lowest level of formal
education report having done so.
11 It should also be noted that there is no correlation between whether or not a person works in the public service and whether they live in an urban or rural area.
26
Table 2.12 Socio-Demographic Variables and Promotion of the Environment as a Social and Political Issue (Exp (B)) Member Money Protest Petition Female a 0.83 1.35 1.07 1.07 Age b 1.00 0.99 1.00 0.99 Education c 1.36 1.20 1.59 1.39* Urban d 0.73 1.03 0.90 1.33 Religious Attendance e 0.62 0.77 1.11 0.83 Social Class f 1.02 0.94 1.12 0.99 Income g 0.80 1.11 0.92 1.19 Public Sector h 0.54 0.82 0.55 1.12 Constant 0.06* 0.28* 0.03** 0.19** Cox and Snell R2 0.01 0.03 0.01 0.05 Nagelkerke R2 0.02 0.04 0.02 0.07 -2 Log Likelihood 224.31 826.53 356.28 915.83 Chi-Square 4.55 23.46** 6.50 41.28** N 793 794 797 796 Note: * Statistically significant at p < 0.05 and ** Statistically significant at p < 0.01. a Female = 1 and Male = 0; b Age in years at end of 2001; c Intercert/Junior Cert or less = 1; Leaving Cert = 2; and Degree or more = 3; d Urban = 1 and Rural = 0; e Attend at least once a week = 1 and Attend less than once a week = 0; f High Professional and Managerial = 1 – Unskilled Manual = 6; g Net Household Income: Less than 190 per week = 1 – More than 571 per week = 4. h Work in Public Sector = 1 and Work in Private Sector = 0.
2.5 Conclusion
The purpose of this chapter was to first set out our measures of environmental attitudes and behaviours,
and then to examine a variety of socio-demographic variables to see if they help us understand
differences between respondents in relation to these. In Chapter 1 we noted that others have found that
socio-demographic variables only explain low levels of the variance in environmental attitudes and
behaviours. The evidence presented above suggests a similar conclusion with regard to the Irish data.
For the most part, the set of socio-demographic variables explain less than ten per cent of the variance
in Irish environmental attitudes and behaviours. Only one set of attitudes stands out from the others
with socio-demographic factors explaining 16 percent of the variance in people’s sense of
environmental efficacy.
Of the various socio-demographic variables that we consider, education appears to be the most
powerful. The level of formal education of the respondent has a significant impact in six of the sets of
environmental attitudes and behaviours that we considered. As we have seen, those with higher levels
of education are more likely than their counterparts to trust environmental groups and have a stronger
sense of environmental efficacy, they hold negative attitudes towards incinerators and landfills, and are
27
more willing to recycle and to sign an environmental petition. Those with higher incomes also have a
stronger sense of environmental efficacy and are more willing to pay for recycling than their
counterparts. When we consider social class we found a similar pattern. Those in higher social classes
are more willing to take on the extra costs of protecting the environment and have negative attitudes
towards the development of new landfill sites.

28
29
Chapter 3
The Impact of the New Environmental Paradigm on Environmental Attitudes
and Behaviours in Ireland
3.1 Introduction
In recent decades some social scientists have argued that a new environmental consciousness has begun
to emerge. Dunlap and Van Liere (1978) coined the phrase ‘New Environmental Paradigm’ (NEP) to
describe this new consciousness that links beliefs about the relationship between humanity and nature,
the importance of economic growth and the value of technology. The NEP posits that values in western
societies are changing in ways that restructure people’s relationship with the environment. Such
changes include the belief that human needs and values should no longer be of greater concern than
those of nature, and that species other than humans are considered to have rights. (Dalton and
Rohrschneider, 1998) There is also a realisation that many of the resources available on the planet are
limited. People’s expectations ought to adjust to reflect this reality, placing less emphasis on economic
growth and adopting a more sceptical attitude towards science and technology. (Dalton and
Rohrschneider, 1998)
The purpose of this chapter is to explore the extent to which NEP values may exist in Ireland and the
relationship between NEP and other environmental attitudes and behaviours. The first section of this
chapter sets out how we arrived at our measure of NEP values. We then examine the relationship
between the NEP and a variety of socio-demographic characteristics. Finally, in order to examine if this
broader set of cultural values contributes to and supports pro-environmental attitudes and behaviours,
we examine the relationship between the respondents’ NEP values and their environmental attitudes and
behaviours.
3.2 The NEP Scale in Ireland
In this chapter we propose that NEP values in Ireland are structured along a single dimension. It should
be noted that in the international literature there is little consensus as to whether the NEP measures a
single construct or is multidimensional. Studies carried out in the USA have found a single dimensional
30
NEP scale (Edgell and Nowell, 1989) while others have found more than one dimension, that is, they
have found dimensions measuring balance of nature, limits of growth and human domination of nature.
(Albrecht et al, 1982; Geller and Lasley, 1985; Noe and Snow, 1990; and Furman, 1998).
In Europe, using data from the 1993 ISSP environmental module, Dalton and Rohrschneider (1998)
developed a single NEP scale for six countries. The Dalton and Rohrschneider (1998) scale utilises
eight of the 14 relevant items in the 1993 ISSP Environmental module. These eight items were selected
on the basis that they offered the greatest empirical and theoretical reliability of the available items. The
diverse nature of NEP is reflected in the four sets of items that constitute the Dalton and Rohrschneider
(1998) NEP scale: ‘biocentric values’, ‘scepticism about science’, ‘economic growth’ and ‘social
change’.
When we focus on the 1993 Irish data we find that the Dalton and Rohrschneider (1998) NEP scale is
quite robust in that it has a Cronbach’s alpha of 0.7112. Unfortunately, direct comparability between the
two data sets is not possible because a number of the items from the 1993 scale were not included in the
2002 ISSP Environmental module. In the Dalton and Rohrschneider (1998) NEP scale three biocentric
value items were used and all of these were dropped from the 2002 ISSP Environmental module.13 In
developing a NEP scale for this report, we initially considered not only all of the theoretically relevant
items from the 2002 ISSP Environment module (twelve items) but also relevant items from the self-
completion module of the ISPAS survey (nine items).
The single-dimensional NEP scale that we propose contains seven items, three of which are taken from
2002 ISSP Environmental module and four from the ISPAS self-completion module.14 In Table 3.1, we
12 Author’s calculation using the same items for the 1993 ISSP Environmental module. 13 It was proposed by Jarvis et al (1999) that two of items used in 1993, ‘Humans should respect nature because it was created by God’ and ‘Nature would be at peace and in harmony if only human beings would leave it alone’ should be dropped because their double-barrelled nature made them difficult to interpret. Respondents could agree with one half of the item and disagree with the other. Furthermore, they suggested that the former item contained the same information as the ‘nature is sacred/spiritual’ item. The third bio-centric item that was dropped was ‘Animals should have the same moral rights that human beings do’. While Jarvis et al (1999) did not propose that this item be dropped, they instead recommended ‘It is right to use animals for medical testing if it might save human lives’, in the final version of the questionnaire. The reason for dropping one of these ‘animal rights’ items was because both were skewed in the 1993 data. The fourth item that was dropped was ‘Any change humans cause in nature – no matter how scientific – will make things worse’. That Dalton and Rohrschneider (1998) refer to this as a ‘social change’ item while Jarvis et al (1999) refer to it as a ‘science’ item, two aspects of NEP, illustrates the problem with this item: it is double barrelled, tapping attitudes towards science and attitudes towards the relationship between people and nature. 14 We began our analysis of the relevant items by first examining those items that formed the Dalton and Rohrschneider scale. One draw back with this approach is that only four items from that scale remained in the ISSP module (These four items are ‘We believe too often in science and not enough in feelings and faith’ (e3_1), ‘Overall, modern science does more harm than good’ (e3_2), ‘Economic
31
present the results of the final factor analysis. This component contains four elements of the NEP:
biocentric, limits of growth, economic growth and the impact of social change on the environment. It
should be noted that it is possible that a scale that is intended to be unidimensional may appear to have
multiple scales. The decision as to whether one or more components ought to be identified is often one
of interpreting the meaning of the various components. It is likely that factor analysis will reveal two
components, even with a small number of items, unless the items are very highly correlated with one
another. In the appendix, Table A3.1, we present the results of a factor analysis that reports the loadings
on a two component solution: on the first component the biocentric and limits of growth items load
highly while the economic growth and social change items load highly on the second component.
However, because the Cronbach’s alpha for the second component is somewhat low, we have decided
to extract just a single component from the seven items. When these items are used to construct an NEP
scale the resultant scale has a Cronbach’s alpha of 0.68 suggesting that it has good internal consistency.
While this scale is not directly comparably with Dalton and Rohrschneider’s (1998) scale, in terms of
reliability, the NEP scale that we propose is almost as good as their scale.15 The scale that we propose
runs from one-to-five and high values are associated with strong NEP values.
growth always harms the environment’ (e3_9) and ‘Almost everything we do in modern life harms the environment’. (e3_5)). When we examined the reliability of these four items in forming a linear scale we noted that they did not perform as well as they had in 1993. In the earlier study, these four items had a Cronbach’s alpha of 0.53, but for the 2002 data Cronbach’s alpha for the four items is 0.48. This suggests that in order to develop a more reliable scale it would be necessary to consider what other items were available (seven were subsequently identified). When these four items were included in a factor analysis with the seven items that form the NEP scale in this chapter, the loadings for all four items were low (all four items had loadings of less than 0.30). In carrying out the factor analysis all but one of the items proposed by the team who designed the ISSP Environment module were considered. The one item that was not considered was excluded because of its double-barrelled nature. When a respondent disagrees with ‘Modern science will solve our environmental problems with little change to our way of life’ (e3_3) it is not clear whether they are saying that ‘modern science can solve environmental problems but that in doing so it will affect our way of life’ or they are simply disagreeing with the notion that that modern science will solve environmental problems. Consequently, this item was not included in any of the analysis that we performed. Of the other items that were considered some were excluded because of low loadings. Four items have very low loadings: ‘It is right to use animals for medical testing if it might save human lives’ (e3_8), ‘The earth simply cannot continue to support population growth at its present rate’ (e3_10), ‘However much human beings try to alter nature for their own benefit it will follow its own ways’ (q5_4) and ‘You can never be sure how nature will react’ (q5_5). Others were dropped because they did not load in the expected direction. (Given the direction of ‘The Irish State should do what scientists say about protecting nature’ (q5_3) and ‘To protect nature, everybody needs to follow environmental regulation’ (q5_7), there was an expectation that both of these items would load negatively on the NEP scale but instead they had positive loadings.) Another item was excluded because despite its high loading it contributed little to the scale (When the item ‘My first priority is to provide for myself and my family, even if this means doing things that harm the environment’ (q5_8), was included the Cronbach’s alpha of the scale was more or less equal to that when this items was not included.). 15 It should be noted that in the ISSP module five-point items are used and high scores indicate ‘disagreement’ with a particular item. In the ISPAS self-completion module seven-point items are used and high scores indicate ‘agreement’ with the item. This means that in developing our scale a certain amount of recoding is required. The NEP scale that we propose runs from one-to-five and high scores indicate a person who views nature as fragile, limited and in need of our care and attention while low values indicates someone who does not. Given that the NEP scale runs from one-to-five it was
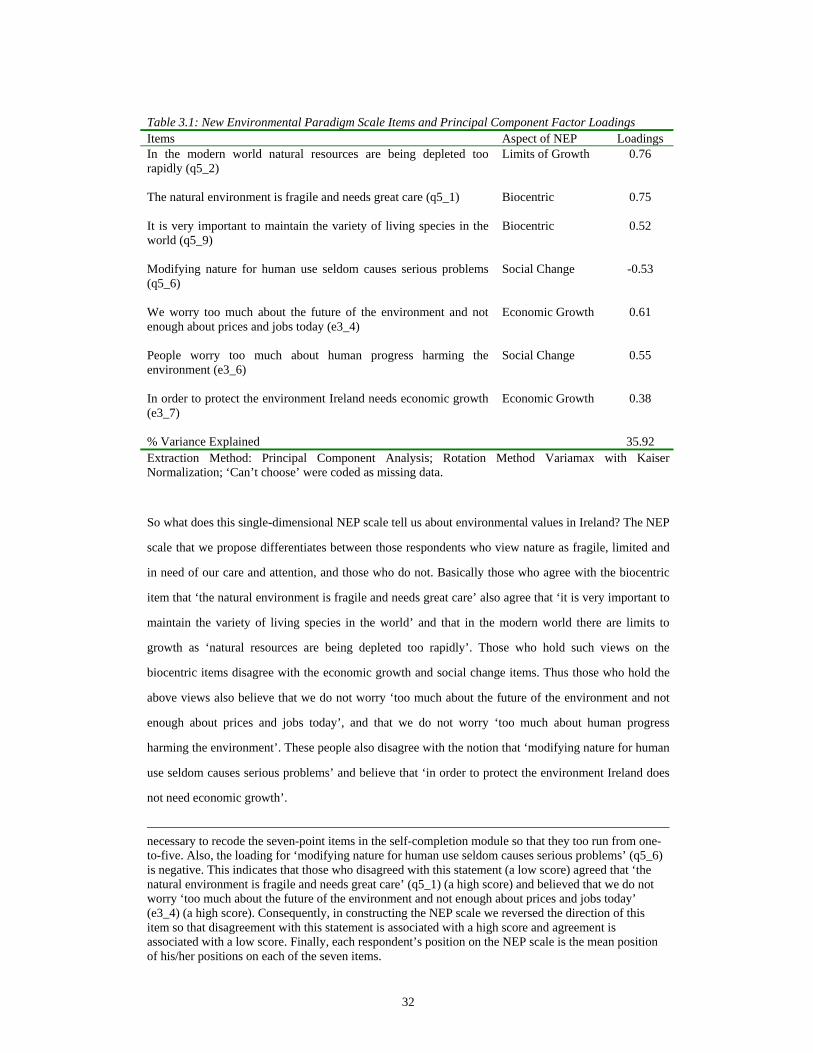
32
Table 3.1: New Environmental Paradigm Scale Items and Principal Component Factor Loadings Items Aspect of NEP Loadings In the modern world natural resources are being depleted too rapidly (q5_2)
Limits of Growth 0.76
The natural environment is fragile and needs great care (q5_1)
Biocentric 0.75
It is very important to maintain the variety of living species in the world (q5_9)
Biocentric 0.52
Modifying nature for human use seldom causes serious problems (q5_6)
Social Change -0.53
We worry too much about the future of the environment and not enough about prices and jobs today (e3_4)
Economic Growth 0.61
People worry too much about human progress harming the environment (e3_6)
Social Change 0.55
In order to protect the environment Ireland needs economic growth (e3_7)
Economic Growth 0.38
% Variance Explained 35.92 Extraction Method: Principal Component Analysis; Rotation Method Variamax with Kaiser Normalization; ‘Can’t choose’ were coded as missing data.
So what does this single-dimensional NEP scale tell us about environmental values in Ireland? The NEP
scale that we propose differentiates between those respondents who view nature as fragile, limited and
in need of our care and attention, and those who do not. Basically those who agree with the biocentric
item that ‘the natural environment is fragile and needs great care’ also agree that ‘it is very important to
maintain the variety of living species in the world’ and that in the modern world there are limits to
growth as ‘natural resources are being depleted too rapidly’. Those who hold such views on the
biocentric items disagree with the economic growth and social change items. Thus those who hold the
above views also believe that we do not worry ‘too much about the future of the environment and not
enough about prices and jobs today’, and that we do not worry ‘too much about human progress
harming the environment’. These people also disagree with the notion that ‘modifying nature for human
use seldom causes serious problems’ and believe that ‘in order to protect the environment Ireland does
not need economic growth’.
necessary to recode the seven-point items in the self-completion module so that they too run from one-to-five. Also, the loading for ‘modifying nature for human use seldom causes serious problems’ (q5_6) is negative. This indicates that those who disagreed with this statement (a low score) agreed that ‘the natural environment is fragile and needs great care’ (q5_1) (a high score) and believed that we do not worry ‘too much about the future of the environment and not enough about prices and jobs today’ (e3_4) (a high score). Consequently, in constructing the NEP scale we reversed the direction of this item so that disagreement with this statement is associated with a high score and agreement is associated with a low score. Finally, each respondent’s position on the NEP scale is the mean position of his/her positions on each of the seven items.
33
3.3 The Distribution of Irish Respondents on NEP Scales
In this section we consider the distribution of NEP values among Irish respondents. We consider not
only the sample as a whole but also the distribution of NEP values across various socio-demographic
groupings. This method allows us to identify those sub-groups that are most associated with strong NEP
values and those that are not. The distribution of NEP values among all respondents is somewhat biased
towards the strong NEP end of the scale. This is so whether the position of the typical respondent is
identified by the mean (3.64) or the median (3.67). The vast majority of Irish respondents are to some
degree disposed towards the view that nature is fragile, limited and in need of our care and attention.
Just over 30 percent of respondents have a score between four and five while less than 13 percent of
respondents have a score that is less than 3.00 on the NEP scale (that is, on the weak NEP side of the
scale). How do these attitudes to the environment differ within socio-demographic groupings?
As to whether or not respondents have strong or weak NEP values, the results presented in Table 3.2
indicate that age, education and religiosity help us understand these differences. The evidence suggests
that younger people rather than older people are more likely to view nature as fragile, limited and in
need of our care and attention, as are those with higher levels of formal education rather than those with
lower levels. However, it should be noted that when we look at the mean scores for various age cohorts
we found that all of these were greater than the mid-point on our NEP scale. This indicates that age,
rather than contributing to an understanding of differences in terms of strong NEP and weak NEP,
highlights differences between age groups in terms of the extent of their strong-NEP values. The mean
score for those aged 25-44 on this scale is 3.74 while the mean score for those over 65 years of age is
3.51. The basic finding that there is a negative relationship between age and concern for the
environment as measured on the NEP, that younger people are more likely to hold stronger NEP values
than older people, is in line with that of others (see Dunlap et al’s (2000) study of Washington State
residents).
As with age, the mean scores for each of the three educational cohorts are greater than the mid-point of
the scale. Again, this implies that education helps us understand differences between those with strong-
NEP values rather than differences in terms of those with strong and those with weak NEP values. The
mean score for those who at most completed their Intermediate/Junior Certificate is 3.49 while the
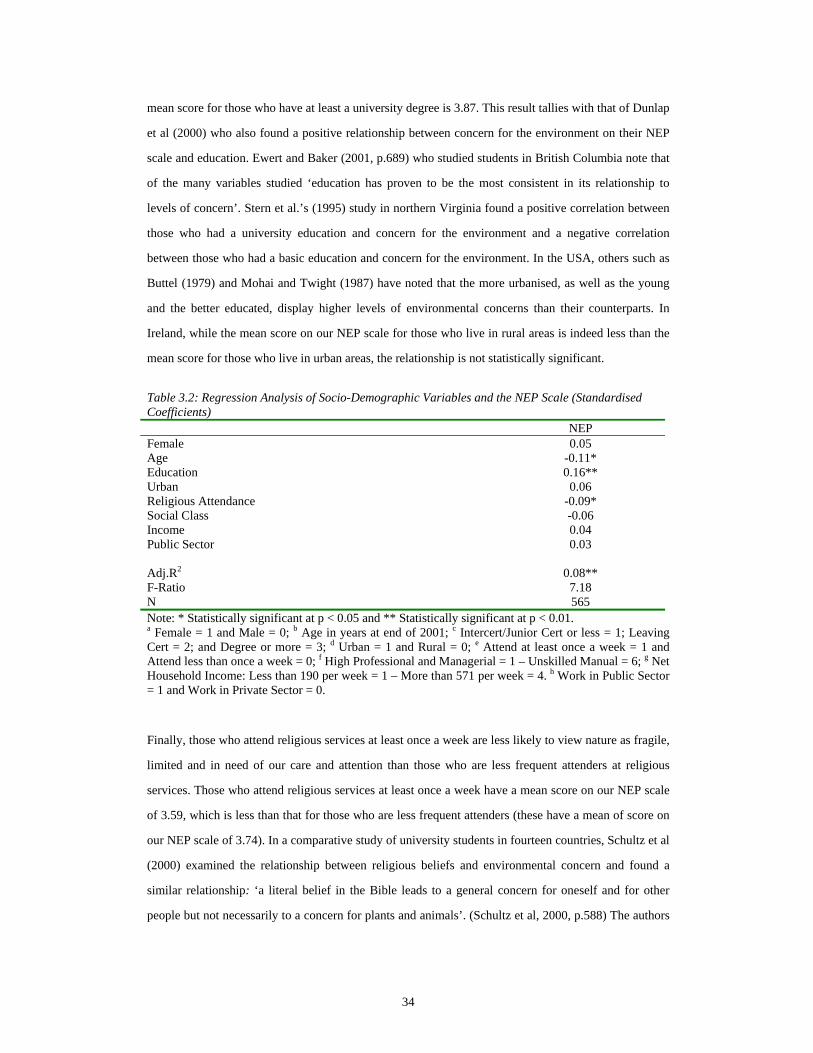
34
mean score for those who have at least a university degree is 3.87. This result tallies with that of Dunlap
et al (2000) who also found a positive relationship between concern for the environment on their NEP
scale and education. Ewert and Baker (2001, p.689) who studied students in British Columbia note that
of the many variables studied ‘education has proven to be the most consistent in its relationship to
levels of concern’. Stern et al.’s (1995) study in northern Virginia found a positive correlation between
those who had a university education and concern for the environment and a negative correlation
between those who had a basic education and concern for the environment. In the USA, others such as
Buttel (1979) and Mohai and Twight (1987) have noted that the more urbanised, as well as the young
and the better educated, display higher levels of environmental concerns than their counterparts. In
Ireland, while the mean score on our NEP scale for those who live in rural areas is indeed less than the
mean score for those who live in urban areas, the relationship is not statistically significant.
Table 3.2: Regression Analysis of Socio-Demographic Variables and the NEP Scale (Standardised Coefficients) NEP Female 0.05 Age -0.11* Education 0.16** Urban 0.06 Religious Attendance -0.09* Social Class -0.06 Income 0.04 Public Sector 0.03 Adj.R2 0.08** F-Ratio 7.18 N 565 Note: * Statistically significant at p < 0.05 and ** Statistically significant at p < 0.01. a Female = 1 and Male = 0; b Age in years at end of 2001; c Intercert/Junior Cert or less = 1; Leaving Cert = 2; and Degree or more = 3; d Urban = 1 and Rural = 0; e Attend at least once a week = 1 and Attend less than once a week = 0; f High Professional and Managerial = 1 – Unskilled Manual = 6; g Net Household Income: Less than 190 per week = 1 – More than 571 per week = 4. h Work in Public Sector = 1 and Work in Private Sector = 0.
Finally, those who attend religious services at least once a week are less likely to view nature as fragile,
limited and in need of our care and attention than those who are less frequent attenders at religious
services. Those who attend religious services at least once a week have a mean score on our NEP scale
of 3.59, which is less than that for those who are less frequent attenders (these have a mean of score on
our NEP scale of 3.74). In a comparative study of university students in fourteen countries, Schultz et al
(2000) examined the relationship between religious beliefs and environmental concern and found a
similar relationship: ‘a literal belief in the Bible leads to a general concern for oneself and for other
people but not necessarily to a concern for plants and animals’. (Schultz et al, 2000, p.588) The authors
35
do not suggest that such people are unconcerned about the environment but instead are concerned about
how environmental degradation will affect humans.
3.4 NEP and Environmental Attitudes and Behaviours
Now that we have considered the distribution of NEP values in Ireland, how do these values related to
attitudes towards the environment and people’s reported environmental behaviours? There is an
expectation that those who view nature as fragile, limited and in need of our care and attention will be
more likely than their counterparts to have pro-environmental attitudes and behaviours. For the most
part our analysis finds that the NEP scale is indeed an important factor in helping us understand
people’s environmental attitudes and behaviours. As is evident from Tables 3.3 to 3.7, where there are
statistically significant relationships between the NEP scale and measures of attitudes and behaviour,
between one and twenty percent of the variance is explained. Of course, that NEP is a statistically
significant factor in understanding environmental attitudes and behaviours is perhaps not all that
surprising as the scale is composed of items that make direct reference to the environment. However,
the items that make up the NEP scale are more general and broad based. What we explore here is the
extent to which this set of cultural values is related to, and supportive of, particular environmental
attitudes and practices.
In order to enhance our discussion of the relationship between respondents’ NEP values and their
environmental attitudes and behaviours, we not only consider the results of regressions analyses but
also, for descriptive purposes, have divided the NEP scale into two sub-groups. The two sub-groups that
we compare are, the 20 percent of respondents who have the highest scores on the NEP scale (in effect,
those who scored between 4.12 and 5.00), and the 20 per cent of respondents who have the lowest
scores on the scale (in effect, those who scored between 1.00 and 3.14). Obviously, we would prefer to
distinguish between respondents at either end of the NEP scale as this would have allowed us to
compare those who see nature as fragile, limited and in need of our care and attention and those who do
not. Given the distribution of the NEP scale, (most respondents have scores of three or more), we are
comparing those who have strong beliefs that nature is fragile, limited and in need of our care and
attention with those who are less sure about the fragility and limitations of nature (most of this sub-
group of respondents are distributed around the mid-point of the scale).
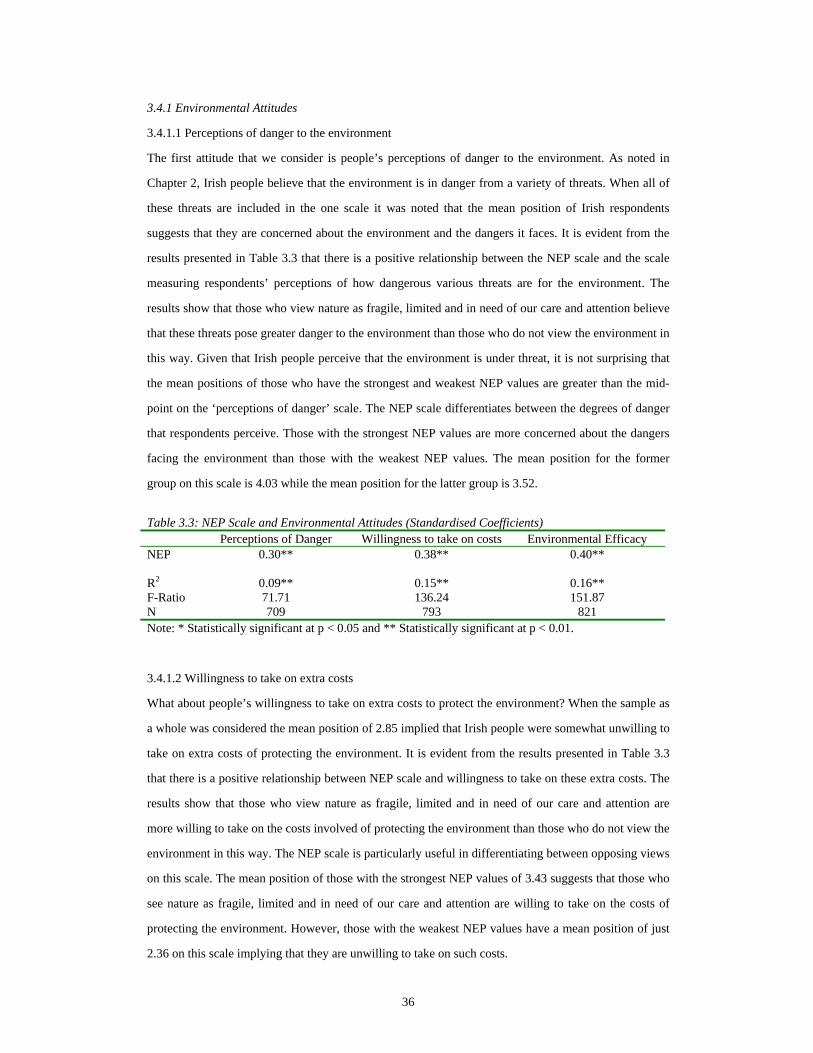
36
3.4.1 Environmental Attitudes
3.4.1.1 Perceptions of danger to the environment
The first attitude that we consider is people’s perceptions of danger to the environment. As noted in
Chapter 2, Irish people believe that the environment is in danger from a variety of threats. When all of
these threats are included in the one scale it was noted that the mean position of Irish respondents
suggests that they are concerned about the environment and the dangers it faces. It is evident from the
results presented in Table 3.3 that there is a positive relationship between the NEP scale and the scale
measuring respondents’ perceptions of how dangerous various threats are for the environment. The
results show that those who view nature as fragile, limited and in need of our care and attention believe
that these threats pose greater danger to the environment than those who do not view the environment in
this way. Given that Irish people perceive that the environment is under threat, it is not surprising that
the mean positions of those who have the strongest and weakest NEP values are greater than the mid-
point on the ‘perceptions of danger’ scale. The NEP scale differentiates between the degrees of danger
that respondents perceive. Those with the strongest NEP values are more concerned about the dangers
facing the environment than those with the weakest NEP values. The mean position for the former
group on this scale is 4.03 while the mean position for the latter group is 3.52.
Table 3.3: NEP Scale and Environmental Attitudes (Standardised Coefficients) Perceptions of Danger Willingness to take on costs Environmental Efficacy NEP 0.30** 0.38** 0.40** R2 0.09** 0.15** 0.16** F-Ratio 71.71 136.24 151.87 N 709 793 821 Note: * Statistically significant at p < 0.05 and ** Statistically significant at p < 0.01.
3.4.1.2 Willingness to take on extra costs
What about people’s willingness to take on extra costs to protect the environment? When the sample as
a whole was considered the mean position of 2.85 implied that Irish people were somewhat unwilling to
take on extra costs of protecting the environment. It is evident from the results presented in Table 3.3
that there is a positive relationship between NEP scale and willingness to take on these extra costs. The
results show that those who view nature as fragile, limited and in need of our care and attention are
more willing to take on the costs involved of protecting the environment than those who do not view the
environment in this way. The NEP scale is particularly useful in differentiating between opposing views
on this scale. The mean position of those with the strongest NEP values of 3.43 suggests that those who
see nature as fragile, limited and in need of our care and attention are willing to take on the costs of
protecting the environment. However, those with the weakest NEP values have a mean position of just
2.36 on this scale implying that they are unwilling to take on such costs.
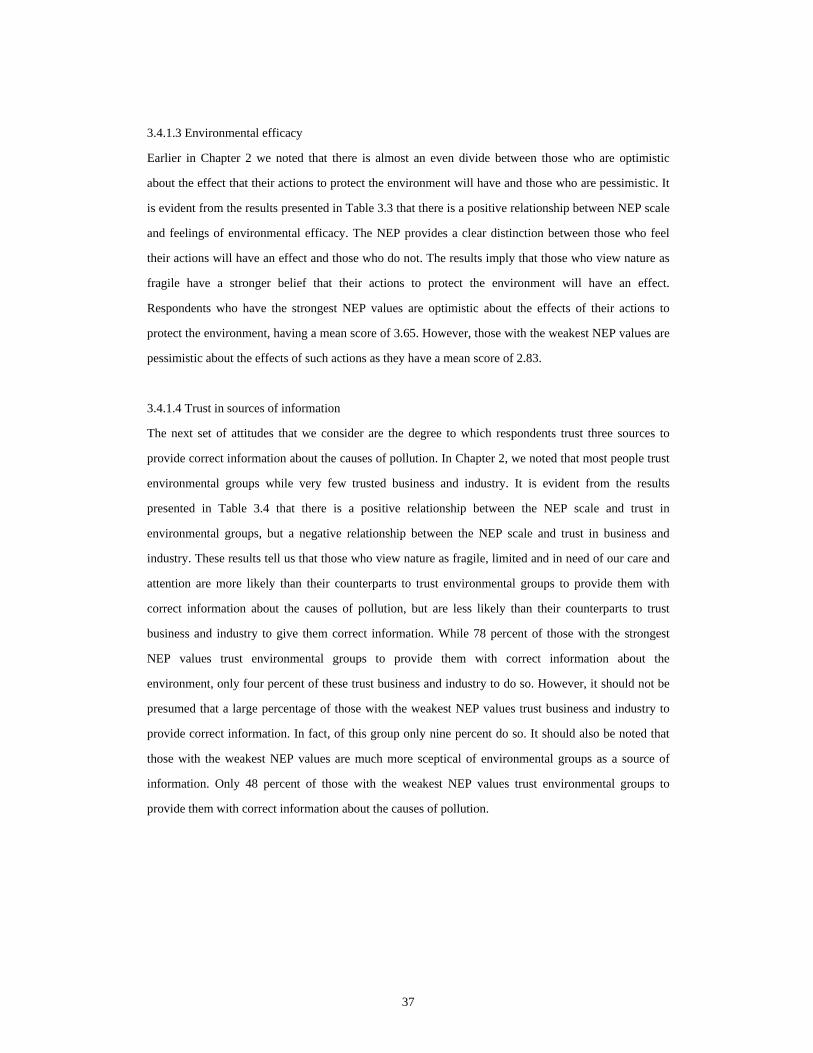
37
3.4.1.3 Environmental efficacy
Earlier in Chapter 2 we noted that there is almost an even divide between those who are optimistic
about the effect that their actions to protect the environment will have and those who are pessimistic. It
is evident from the results presented in Table 3.3 that there is a positive relationship between NEP scale
and feelings of environmental efficacy. The NEP provides a clear distinction between those who feel
their actions will have an effect and those who do not. The results imply that those who view nature as
fragile have a stronger belief that their actions to protect the environment will have an effect.
Respondents who have the strongest NEP values are optimistic about the effects of their actions to
protect the environment, having a mean score of 3.65. However, those with the weakest NEP values are
pessimistic about the effects of such actions as they have a mean score of 2.83.
3.4.1.4 Trust in sources of information
The next set of attitudes that we consider are the degree to which respondents trust three sources to
provide correct information about the causes of pollution. In Chapter 2, we noted that most people trust
environmental groups while very few trusted business and industry. It is evident from the results
presented in Table 3.4 that there is a positive relationship between the NEP scale and trust in
environmental groups, but a negative relationship between the NEP scale and trust in business and
industry. These results tell us that those who view nature as fragile, limited and in need of our care and
attention are more likely than their counterparts to trust environmental groups to provide them with
correct information about the causes of pollution, but are less likely than their counterparts to trust
business and industry to give them correct information. While 78 percent of those with the strongest
NEP values trust environmental groups to provide them with correct information about the
environment, only four percent of these trust business and industry to do so. However, it should not be
presumed that a large percentage of those with the weakest NEP values trust business and industry to
provide correct information. In fact, of this group only nine percent do so. It should also be noted that
those with the weakest NEP values are much more sceptical of environmental groups as a source of
information. Only 48 percent of those with the weakest NEP values trust environmental groups to
provide them with correct information about the causes of pollution.
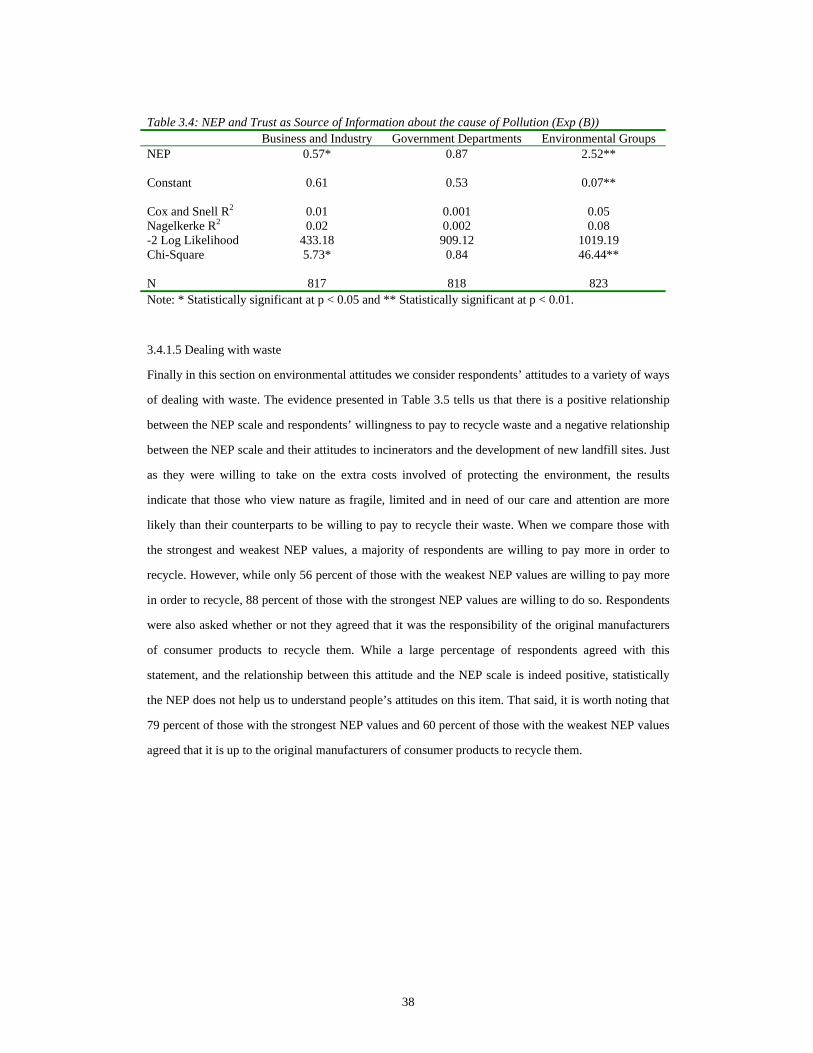
38
Table 3.4: NEP and Trust as Source of Information about the cause of Pollution (Exp (B)) Business and Industry Government Departments Environmental Groups NEP 0.57* 0.87 2.52** Constant 0.61 0.53 0.07** Cox and Snell R2 0.01 0.001 0.05 Nagelkerke R2 0.02 0.002 0.08 -2 Log Likelihood 433.18 909.12 1019.19 Chi-Square 5.73* 0.84 46.44** N 817 818 823 Note: * Statistically significant at p < 0.05 and ** Statistically significant at p < 0.01.
3.4.1.5 Dealing with waste
Finally in this section on environmental attitudes we consider respondents’ attitudes to a variety of ways
of dealing with waste. The evidence presented in Table 3.5 tells us that there is a positive relationship
between the NEP scale and respondents’ willingness to pay to recycle waste and a negative relationship
between the NEP scale and their attitudes to incinerators and the development of new landfill sites. Just
as they were willing to take on the extra costs involved of protecting the environment, the results
indicate that those who view nature as fragile, limited and in need of our care and attention are more
likely than their counterparts to be willing to pay to recycle their waste. When we compare those with
the strongest and weakest NEP values, a majority of respondents are willing to pay more in order to
recycle. However, while only 56 percent of those with the weakest NEP values are willing to pay more
in order to recycle, 88 percent of those with the strongest NEP values are willing to do so. Respondents
were also asked whether or not they agreed that it was the responsibility of the original manufacturers
of consumer products to recycle them. While a large percentage of respondents agreed with this
statement, and the relationship between this attitude and the NEP scale is indeed positive, statistically
the NEP does not help us to understand people’s attitudes on this item. That said, it is worth noting that
79 percent of those with the strongest NEP values and 60 percent of those with the weakest NEP values
agreed that it is up to the original manufacturers of consumer products to recycle them.
39
Table 3.5: NEP and Attitudes to Dealing with Waste (Exp (B)) Incinerators Landfill Pay to Recycle Manufacturer
Recycle NEP 0.34** 0.49** 2.81** 1.14 Constant 52.65** 15.32** 0.12** 2.23 Cox and Snell R2 0.08 0.03 0.05 0.001 Nagelkerke R2 0.10 0.05 0.08 0.001 -2 Log Likelihood 805.11 884.75 638.86 741.59 Chi-Square 49.87** 23.63** 34.61** 0.06 N 617 658 735 704 Note: * Statistically significant at p < 0.05 and ** Statistically significant at p < 0.01.
When it comes to attitudes towards incinerators and new landfill sites, those who have strong NEP
values are more likely than their counterparts to disagree with the suggestions that incinerators are the
best way of disposing of waste and that new landfill sites should be developed in order to dispose of
waste. The proportion of the overall sample that believes that incinerators are the best way of disposing
of waste is just less than 40 percent. When we compare those with the strongest and weakest NEP
values we find that there is quite a difference in the percentages of respondents who agree with this
statement. Amongst those with the weakest NEP values, 57 percent agree that incinerators are the best
way of disposing of waste, while just over a quarter of those who have the strongest NEP values do so.
In the sample as a whole a slightly larger percentage agreed with the development of new landfill sites
than agreed with the use of incinerators. When we compare those with the strongest and weakest NEP
values we again find that the largest percentage, 53 percent, of those who support the development of
landfill sites is amongst the group with the weakest NEP values. Amongst those with the strongest NEP
values, about a quarter of respondents agreed with the development of new landfill sites.
3.4.2 Environmental Behaviours
In this section our attention shifts from what people think about particular environmental issues to what
they actually do. The first two items that we consider refer to actions to protect the environment while
the second four items refer to respondents’ attempts to promote the environment as a social and political
issue.
3.4.2.1 Recycling and Car Usage
When it comes to sorting household waste for recycling and cutting back on driving in order to protect
the environment, Table 3.6 suggests that there is a positive relationship between NEP and those who
engage in these activities. The results indicate that those who view nature as fragile, limited and in need
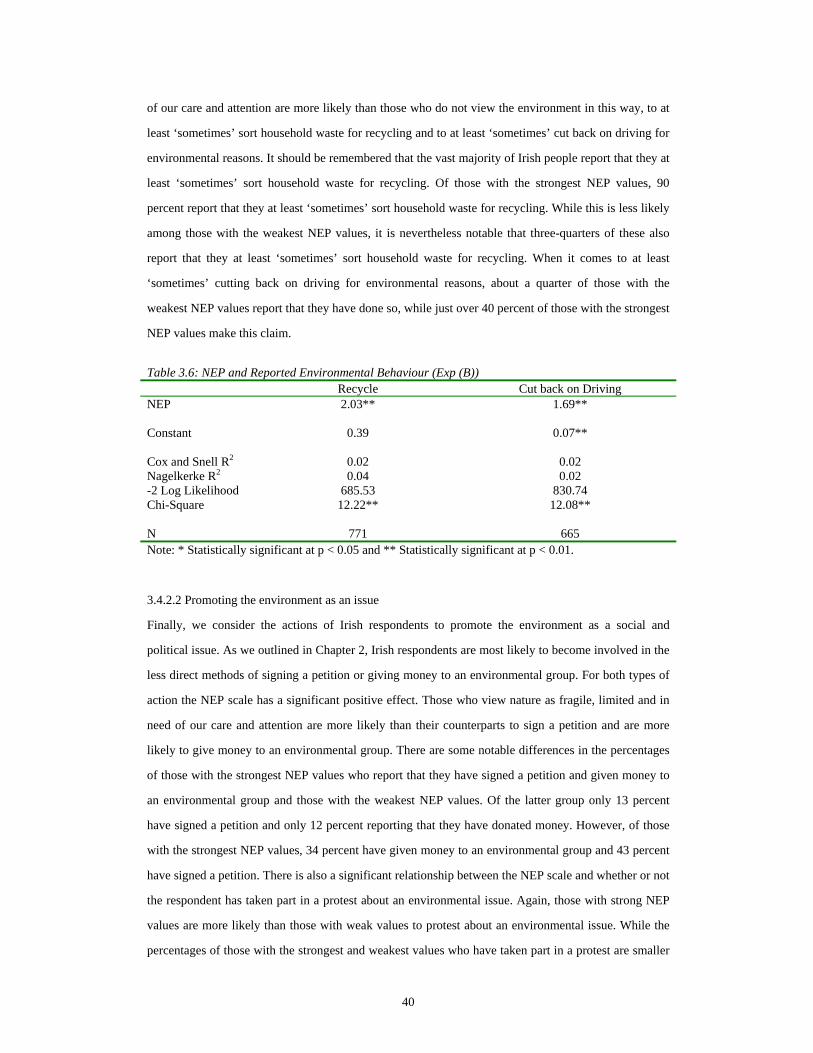
40
of our care and attention are more likely than those who do not view the environment in this way, to at
least ‘sometimes’ sort household waste for recycling and to at least ‘sometimes’ cut back on driving for
environmental reasons. It should be remembered that the vast majority of Irish people report that they at
least ‘sometimes’ sort household waste for recycling. Of those with the strongest NEP values, 90
percent report that they at least ‘sometimes’ sort household waste for recycling. While this is less likely
among those with the weakest NEP values, it is nevertheless notable that three-quarters of these also
report that they at least ‘sometimes’ sort household waste for recycling. When it comes to at least
‘sometimes’ cutting back on driving for environmental reasons, about a quarter of those with the
weakest NEP values report that they have done so, while just over 40 percent of those with the strongest
NEP values make this claim.
Table 3.6: NEP and Reported Environmental Behaviour (Exp (B)) Recycle Cut back on Driving NEP 2.03** 1.69** Constant 0.39 0.07** Cox and Snell R2 0.02 0.02 Nagelkerke R2 0.04 0.02 -2 Log Likelihood 685.53 830.74 Chi-Square 12.22** 12.08** N 771 665 Note: * Statistically significant at p < 0.05 and ** Statistically significant at p < 0.01.
3.4.2.2 Promoting the environment as an issue
Finally, we consider the actions of Irish respondents to promote the environment as a social and
political issue. As we outlined in Chapter 2, Irish respondents are most likely to become involved in the
less direct methods of signing a petition or giving money to an environmental group. For both types of
action the NEP scale has a significant positive effect. Those who view nature as fragile, limited and in
need of our care and attention are more likely than their counterparts to sign a petition and are more
likely to give money to an environmental group. There are some notable differences in the percentages
of those with the strongest NEP values who report that they have signed a petition and given money to
an environmental group and those with the weakest NEP values. Of the latter group only 13 percent
have signed a petition and only 12 percent reporting that they have donated money. However, of those
with the strongest NEP values, 34 percent have given money to an environmental group and 43 percent
have signed a petition. There is also a significant relationship between the NEP scale and whether or not
the respondent has taken part in a protest about an environmental issue. Again, those with strong NEP
values are more likely than those with weak values to protest about an environmental issue. While the
percentages of those with the strongest and weakest values who have taken part in a protest are smaller
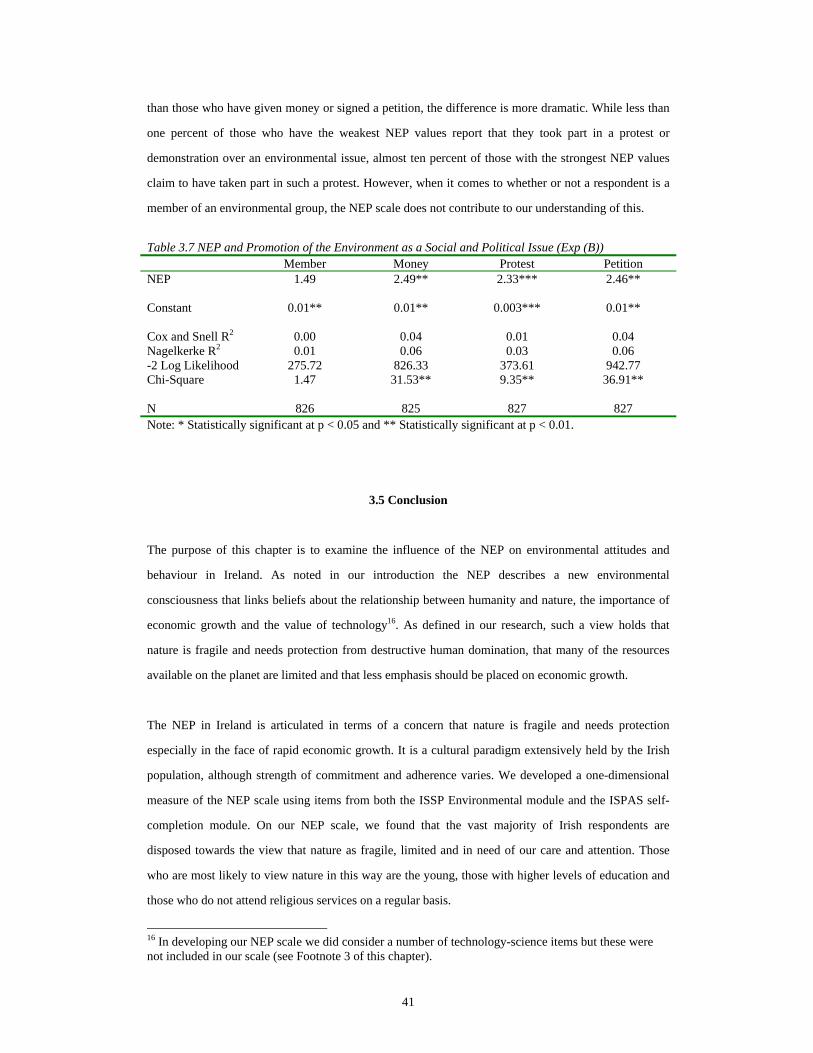
41
than those who have given money or signed a petition, the difference is more dramatic. While less than
one percent of those who have the weakest NEP values report that they took part in a protest or
demonstration over an environmental issue, almost ten percent of those with the strongest NEP values
claim to have taken part in such a protest. However, when it comes to whether or not a respondent is a
member of an environmental group, the NEP scale does not contribute to our understanding of this.
Table 3.7 NEP and Promotion of the Environment as a Social and Political Issue (Exp (B)) Member Money Protest Petition NEP 1.49 2.49** 2.33*** 2.46** Constant 0.01** 0.01** 0.003*** 0.01** Cox and Snell R2 0.00 0.04 0.01 0.04 Nagelkerke R2 0.01 0.06 0.03 0.06 -2 Log Likelihood 275.72 826.33 373.61 942.77 Chi-Square 1.47 31.53** 9.35** 36.91** N 826 825 827 827 Note: * Statistically significant at p < 0.05 and ** Statistically significant at p < 0.01.
3.5 Conclusion
The purpose of this chapter is to examine the influence of the NEP on environmental attitudes and
behaviour in Ireland. As noted in our introduction the NEP describes a new environmental
consciousness that links beliefs about the relationship between humanity and nature, the importance of
economic growth and the value of technology16. As defined in our research, such a view holds that
nature is fragile and needs protection from destructive human domination, that many of the resources
available on the planet are limited and that less emphasis should be placed on economic growth.
The NEP in Ireland is articulated in terms of a concern that nature is fragile and needs protection
especially in the face of rapid economic growth. It is a cultural paradigm extensively held by the Irish
population, although strength of commitment and adherence varies. We developed a one-dimensional
measure of the NEP scale using items from both the ISSP Environmental module and the ISPAS self-
completion module. On our NEP scale, we found that the vast majority of Irish respondents are
disposed towards the view that nature as fragile, limited and in need of our care and attention. Those
who are most likely to view nature in this way are the young, those with higher levels of education and
those who do not attend religious services on a regular basis.
16 In developing our NEP scale we did consider a number of technology-science items but these were not included in our scale (see Footnote 3 of this chapter).
42
While the NEP scale and the distribution of Irish respondents on it is interesting in and of itself, does it
tell us anything more about differences in people’s environmental attitudes and behaviours than the
socio-demographic factors? The NEP has a significant impact on differences in Irish environmental
attitudes and behaviours in eleven of the sixteen sets of environmental attitudes and behaviours that we
consider. In all cases those who regard nature as fragile, limited and in need of our care and attention
are more likely to have environmental attitudes and behaviours that reflect their broader concern for the
environment. In four of our sixteen sets of attitudes and behaviours, the impact of the NEP scale
explains more of the variance in Irish attitudes and behaviours than the socio-demographic variables.
An instance where the NEP scale stands out is with regard to people’s willingness to take on the costs
of protecting the environment. Where the socio-demographic factors explained six percent of the
variance, the NEP by itself explains fifteen percent. It should also be noted that the NEP scale also
explains as much of the variation (15 percent) in people’s feelings of environmental efficacy as does
our set of socio-demographic variables. In the remaining cases where the NEP scale has a significant
impact, the percentage of the variance that the NEP scale explains is less than ten percent. In these
instances it explains about the same amount, or slightly less, than that explained by the set of socio-
demographic variables. The instances where the NEP scale does not contribute to our understanding of
differences include trust in government departments to provide them with the correct information about
the causes of pollution, whether or not they agree that manufacturers should be responsible for
recycling the goods they produce, and why some people are members of environmental groups while
others are not. Thus the evidence suggests that the NEP scale is as important a factor in understanding
differences between people’s environmental attitudes and behaviours as the set of socio-demographic
variables that we considered in the previous chapter.
The NEP would appear to be a major cultural resource on which Irish respondents draw in developing
pro-environmental attitudes and behaviours. This is especially so among those with a higher level of
education and younger respondents. In this chapter we have reported how it is positively related to an
increased perception of and concern about the environmental dangers, contributes to an increased
willingness to pay higher costs to protect the environment and to pay for recycling, and to an increased
sense of efficacy in pursuing environmental goals. It is positively related to an increased level of trust in
environmental groups, and a strong preference for recycling rather than landfill or incineration.
Drawing on the NEP also contributes to pro-environmental practices including cutting back on driving
and sorting household waste for recycling. Furthermore, it is a cultural resource that can contribute to

43
mobilisation around environmental issues in terms of giving money to environmental groups, signing
petitions and protesting.

44
45
Chapter 4
The Impact of Post-Materialism on Environmental Attitudes and Behaviours in
Ireland
4.1 Introduction
In recent decades it has been proposed that post-war affluence in the western world, accompanied by
the absence of war, has had a profound effect on peoples’ attitudes and values across a wide range of
subjects. Those born before the Second World War are expected to have a different set of attitudes and
values, ‘materialist’, from those born after the war, ‘post-materialist’. It is argued that the latter group’s
attitudes and values will have been shaped by their experience of affluence and relative peace during
their formative years. Their ambitions and priorities for themselves and their societies are expected to
be different because, unlike earlier generations, they could take relative economic well-being and
physical security for granted. Post-materialist theory has been used to explain the appearance of new
issues, new social movements and in particular the emergence of ‘green’ and ‘new left’ parties in a
number of European countries. (Kriesi, 1989; Rohrschneider, 1990; Poguntke, 1987; Muller-Rommel,
1985, 1989 and 1990; Dalton, 1996) The new set of issues includes matters such as quality of the
environment, alternative lifestyles and minority rights. It is argued that these are not debated along
traditional lines but along a ‘materialist – post-materialist dimension’ (MPM). (Inglehart, 1984, p.25;
Poguntke, 1987, p.77; Muller-Rommel, 1989, pp115-116; Dalton, 1996, p.153)
The purpose of this chapter is to examine the influence of post-materialist values on environmental
attitudes and behaviours in Ireland. The first section of this chapter sets out how we identify those with
post-materialist values and those without. We then examine the distribution of post-materialist values
among Irish respondents taking into account a variety of socio-demographic characteristics. Finally, we
examine the influence post-materialism has on both respondents’ environmental attitudes and their
behaviours.
4.2 Measuring Post-Materialist Values
Inglehart argues that in the western world there has been a shift away from the materialist concerns of
pre-industrial and industrial societies towards post-materialist values. Where the former are concerned
46
about supporting the established order through the maintenance of law and order and preservation of
economic gains, the latter place greater emphasis on individual self-expression, greater participation in
decision-making, freedom and quality of life. (Inglehart, 1977, p.182; Inglehart, 1984; Inglehart et al,
1994, p.336; Poguntke, 1987, p.77; Muller-Rommel, 1989, pp115-116; Dalton, 1996, p.153) The theory
that Inglehart proposes is based on two hypotheses: scarcity hypothesis and socialisation hypothesis.
The scarcity hypothesis notes the role of short-term changes, or period effects, and posits that periods of
prosperity lead to an increase in post-materialist goals while periods of scarcity lead to greater concern
with materialist goals. The socialisation hypothesis implies that long-term cohort effects also exist. The
values of a given generation tend to reflect the conditions prevailing during its pre-adult years. When
both hypotheses are taken together they imply that value change is characterised by period effects
superimposed on cohort effects. (Inglehart, 1990, pp79-83) Inglehart (1981, p.886) expects that there
will be a ‘significant watershed’ in terms of values and attitudes between the pre-war and post-war
generations. Since the war, the formative years of younger generations have been ones of increased
economic and physical security so these groups are expected to be more post-materialist than older
generations.
In order to measure post-materialist orientations, the ISSP Environment module uses a forced-choice
question that asks respondents to select their first and second priority for Ireland from four items. The
four items from which a respondent must select are:
a) Maintain order in the nation;
b) Give people more say in the decisions of the government;
c) Fight rising prices; and
d) Protect freedom of speech.
The theoretical framework proposed by Inglehart (1990, pp134-135) proposes that the four items will
form two groups. Those items that emphasise physical and economic security (options a and c) will
form the materialist group, while those focused on participatory concerns (options b and d) will form
the post-materialist group. It is expected that materialist goals will be given higher priority by those
who experienced physical or economic insecurity in their formative years. However, those who were
raised under more secure conditions will have a different view and are expected to emphasise the post-
materialist goals. All other combinations of the four items are considered to be a mixed value
orientation. (Inglehart, 1990, p.75) The assumption underlying this four-item instrument is that the rank
order of people’s priorities reveals ‘something pervasive and enduring’ in their outlook. (Inglehart,
47
1990, p.131) It should be noted that although Inglehart initially developed a twelve-item measure that is
considered to be more reliable (Inglehart, 1990, pp74-75 and p.115), the ISSP has opted for the four-
item format (as have Eurobarometer). Inglehart (1990, p.131) favours a more broadly based index with
a larger number of items because responses to some of the items, such as ‘fighting rising prices’, may
be sensitive to short-term forces, that is, they may refer to a ‘serious current problem’.
4.3 Post-Materialist Values in Ireland
While Inglehart’s post-materialism has been criticised by social scientists from a variety of
perspectives, perhaps the most serious of these is that there is little evidence of people holding post-
materialist values. (Lijphart, 1981; Clarke et al, 1991) Lijphart (1981, p.40) argues that
‘postmaterialism has so far not become the source of a new ideological dimension in many party
systems’. Lijphart (1981, p.41) notes that in Inglehart’s surveys of 1970, 1973 and 1976, ‘the average
proportion of postmaterialist respondents that he found was a meagre 11.5 percent’. Inglehart (1994, see
Table 5, p.350) replied that, while all European countries cannot be regarded as post-materialist, most
are heading in that direction. Can the same be said of Ireland?
With regard to the Irish case, Inglehart (1995, p.63) concluded that there has been ‘a decline in the
proportion of Materialists, and an increase in the proportion of Postmaterialists’ between 1970 and
1993. As is evident from Table 4.1, since the 1970s, there has been a slight increase in the percentage of
people who are classified as post-materialists. The percentage of those coded as materialists is now half
what it once was. Moreover, the difference in the percentage of people who are classified as having
materialist orientations and those who are seen as having post-materialist orientations has narrowed.
However, the narrowing of the gap between percentages of materialists and of post-materialists has had
little to do with the increase in the percentage of those who have a post-materialist outlook. The
important factor contributing to the narrowing of this gap has been the sharp drop in the percentage of
those classified as materialists. While a shift in the value orientation of Irish society has indeed taken
place, it is from materialists to the ‘mixed’ group. The percentage of people in this middle group has
grown from 47 percent in 1976 to just over 68 percent in 2002. There is little evidence of a shift from
either the materialist or mixed groups to the post-materialist group. So while one can conclude that a
smaller proportion of Irish people adopt a materialist outlook, it would not be fair to suggest that
anything other than a marginal increase in the proportion of those with a post-materialist orientation has
taken place.
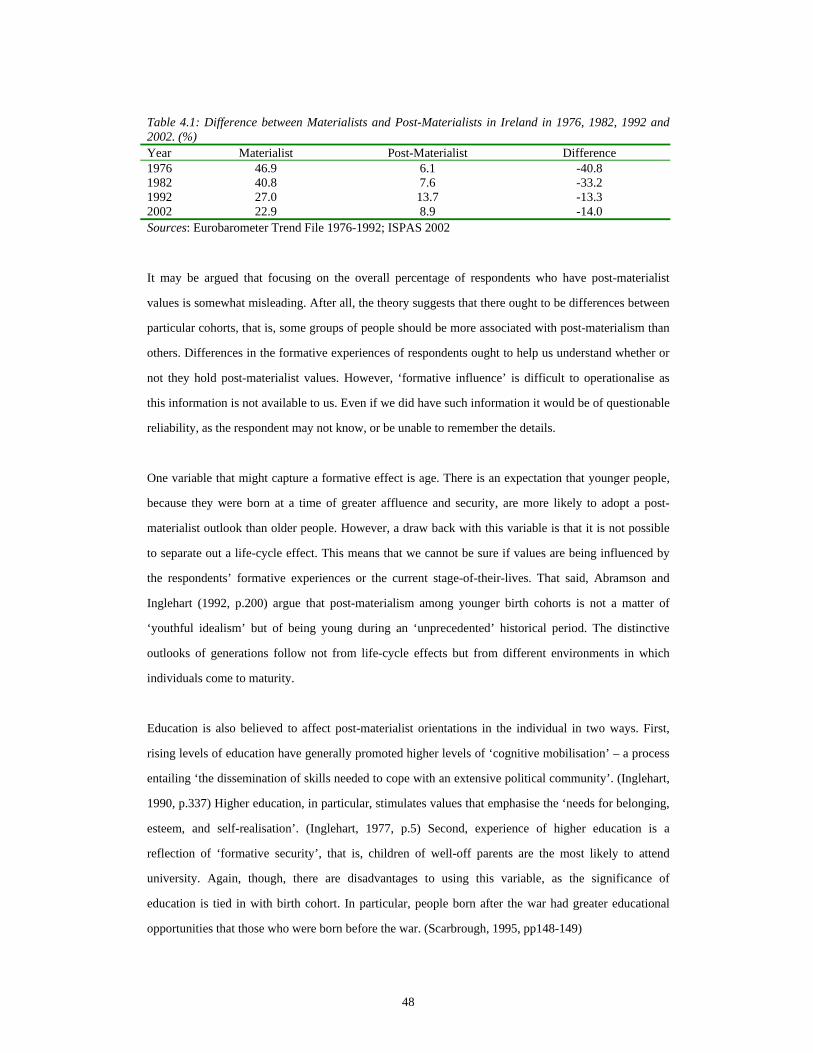
48
Table 4.1: Difference between Materialists and Post-Materialists in Ireland in 1976, 1982, 1992 and 2002. (%) Year Materialist Post-Materialist Difference 1976 46.9 6.1 -40.8 1982 40.8 7.6 -33.2 1992 27.0 13.7 -13.3 2002 22.9 8.9 -14.0 Sources: Eurobarometer Trend File 1976-1992; ISPAS 2002
It may be argued that focusing on the overall percentage of respondents who have post-materialist
values is somewhat misleading. After all, the theory suggests that there ought to be differences between
particular cohorts, that is, some groups of people should be more associated with post-materialism than
others. Differences in the formative experiences of respondents ought to help us understand whether or
not they hold post-materialist values. However, ‘formative influence’ is difficult to operationalise as
this information is not available to us. Even if we did have such information it would be of questionable
reliability, as the respondent may not know, or be unable to remember the details.
One variable that might capture a formative effect is age. There is an expectation that younger people,
because they were born at a time of greater affluence and security, are more likely to adopt a post-
materialist outlook than older people. However, a draw back with this variable is that it is not possible
to separate out a life-cycle effect. This means that we cannot be sure if values are being influenced by
the respondents’ formative experiences or the current stage-of-their-lives. That said, Abramson and
Inglehart (1992, p.200) argue that post-materialism among younger birth cohorts is not a matter of
‘youthful idealism’ but of being young during an ‘unprecedented’ historical period. The distinctive
outlooks of generations follow not from life-cycle effects but from different environments in which
individuals come to maturity.
Education is also believed to affect post-materialist orientations in the individual in two ways. First,
rising levels of education have generally promoted higher levels of ‘cognitive mobilisation’ – a process
entailing ‘the dissemination of skills needed to cope with an extensive political community’. (Inglehart,
1990, p.337) Higher education, in particular, stimulates values that emphasise the ‘needs for belonging,
esteem, and self-realisation’. (Inglehart, 1977, p.5) Second, experience of higher education is a
reflection of ‘formative security’, that is, children of well-off parents are the most likely to attend
university. Again, though, there are disadvantages to using this variable, as the significance of
education is tied in with birth cohort. In particular, people born after the war had greater educational
opportunities that those who were born before the war. (Scarbrough, 1995, pp148-149)
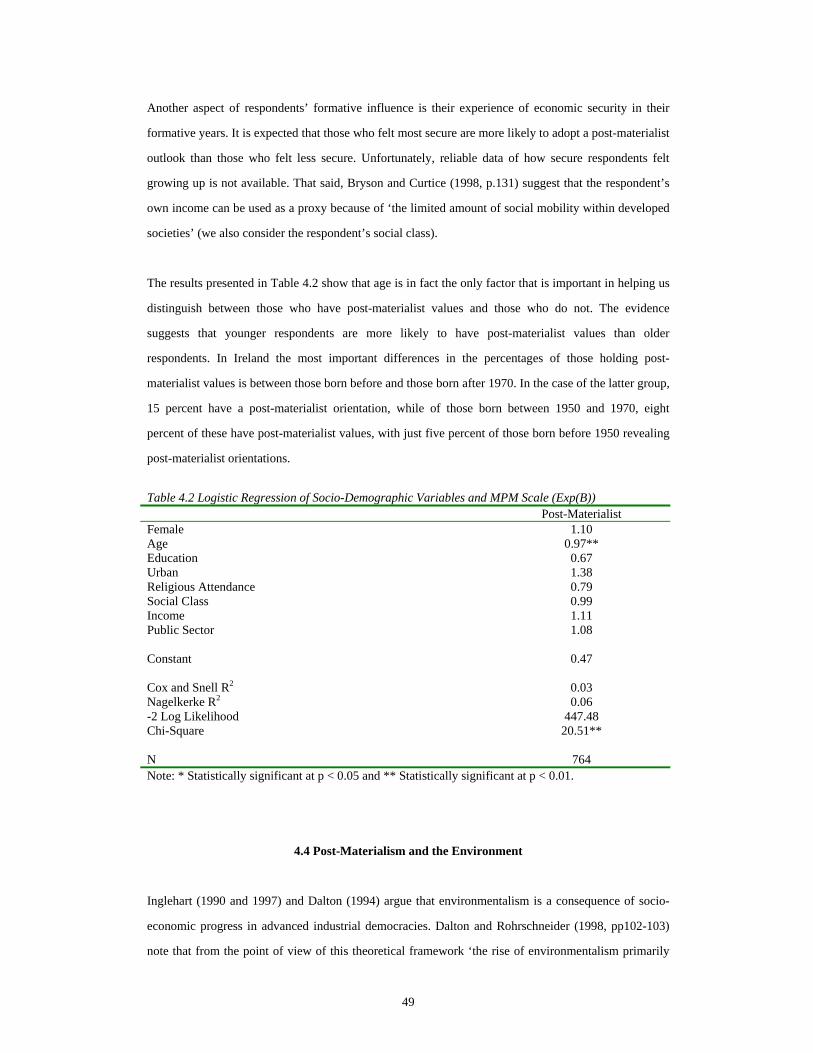
49
Another aspect of respondents’ formative influence is their experience of economic security in their
formative years. It is expected that those who felt most secure are more likely to adopt a post-materialist
outlook than those who felt less secure. Unfortunately, reliable data of how secure respondents felt
growing up is not available. That said, Bryson and Curtice (1998, p.131) suggest that the respondent’s
own income can be used as a proxy because of ‘the limited amount of social mobility within developed
societies’ (we also consider the respondent’s social class).
The results presented in Table 4.2 show that age is in fact the only factor that is important in helping us
distinguish between those who have post-materialist values and those who do not. The evidence
suggests that younger respondents are more likely to have post-materialist values than older
respondents. In Ireland the most important differences in the percentages of those holding post-
materialist values is between those born before and those born after 1970. In the case of the latter group,
15 percent have a post-materialist orientation, while of those born between 1950 and 1970, eight
percent of these have post-materialist values, with just five percent of those born before 1950 revealing
post-materialist orientations.
Table 4.2 Logistic Regression of Socio-Demographic Variables and MPM Scale (Exp(B)) Post-Materialist Female 1.10 Age 0.97** Education 0.67 Urban 1.38 Religious Attendance 0.79 Social Class 0.99 Income 1.11 Public Sector 1.08 Constant 0.47 Cox and Snell R2 0.03 Nagelkerke R2 0.06 -2 Log Likelihood 447.48 Chi-Square 20.51** N 764 Note: * Statistically significant at p < 0.05 and ** Statistically significant at p < 0.01.
4.4 Post-Materialism and the Environment
Inglehart (1990 and 1997) and Dalton (1994) argue that environmentalism is a consequence of socio-
economic progress in advanced industrial democracies. Dalton and Rohrschneider (1998, pp102-103)
note that from the point of view of this theoretical framework ‘the rise of environmentalism primarily
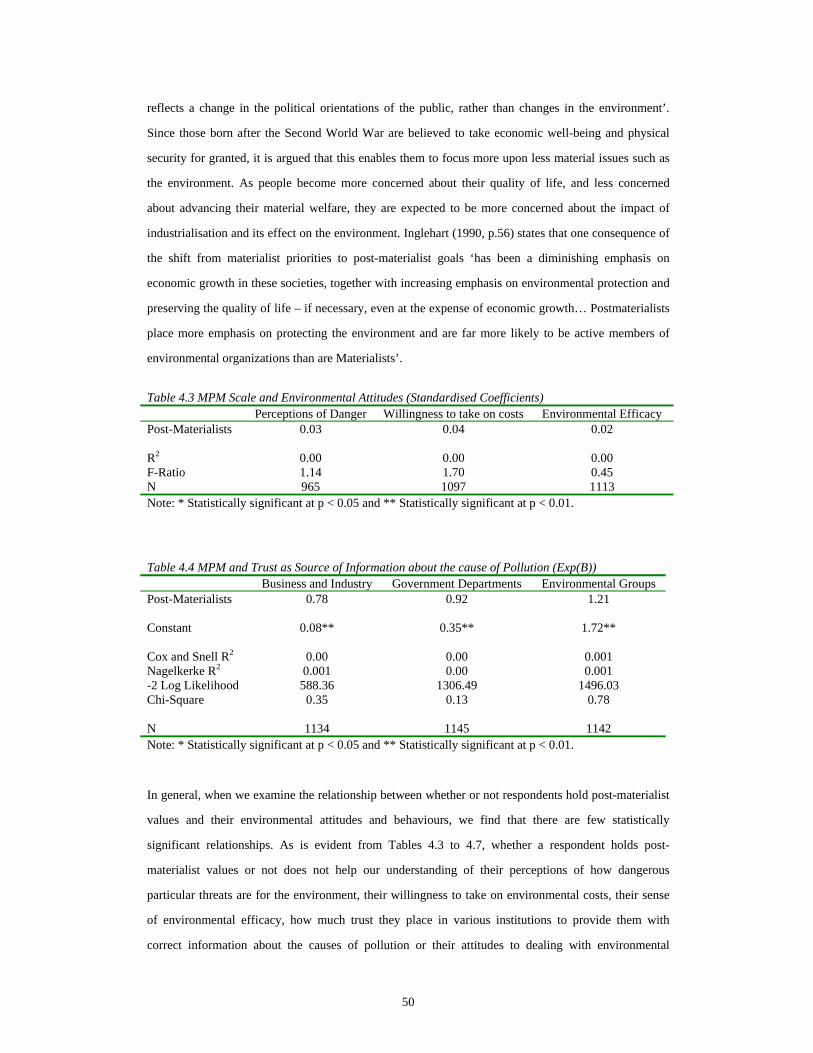
50
reflects a change in the political orientations of the public, rather than changes in the environment’.
Since those born after the Second World War are believed to take economic well-being and physical
security for granted, it is argued that this enables them to focus more upon less material issues such as
the environment. As people become more concerned about their quality of life, and less concerned
about advancing their material welfare, they are expected to be more concerned about the impact of
industrialisation and its effect on the environment. Inglehart (1990, p.56) states that one consequence of
the shift from materialist priorities to post-materialist goals ‘has been a diminishing emphasis on
economic growth in these societies, together with increasing emphasis on environmental protection and
preserving the quality of life – if necessary, even at the expense of economic growth… Postmaterialists
place more emphasis on protecting the environment and are far more likely to be active members of
environmental organizations than are Materialists’.
Table 4.3 MPM Scale and Environmental Attitudes (Standardised Coefficients) Perceptions of Danger Willingness to take on costs Environmental Efficacy Post-Materialists 0.03 0.04 0.02 R2 0.00 0.00 0.00 F-Ratio 1.14 1.70 0.45 N 965 1097 1113 Note: * Statistically significant at p < 0.05 and ** Statistically significant at p < 0.01.
Table 4.4 MPM and Trust as Source of Information about the cause of Pollution (Exp(B)) Business and Industry Government Departments Environmental Groups Post-Materialists 0.78 0.92 1.21 Constant 0.08** 0.35** 1.72** Cox and Snell R2 0.00 0.00 0.001 Nagelkerke R2 0.001 0.00 0.001 -2 Log Likelihood 588.36 1306.49 1496.03 Chi-Square 0.35 0.13 0.78 N 1134 1145 1142 Note: * Statistically significant at p < 0.05 and ** Statistically significant at p < 0.01.
In general, when we examine the relationship between whether or not respondents hold post-materialist
values and their environmental attitudes and behaviours, we find that there are few statistically
significant relationships. As is evident from Tables 4.3 to 4.7, whether a respondent holds post-
materialist values or not does not help our understanding of their perceptions of how dangerous
particular threats are for the environment, their willingness to take on environmental costs, their sense
of environmental efficacy, how much trust they place in various institutions to provide them with
correct information about the causes of pollution or their attitudes to dealing with environmental
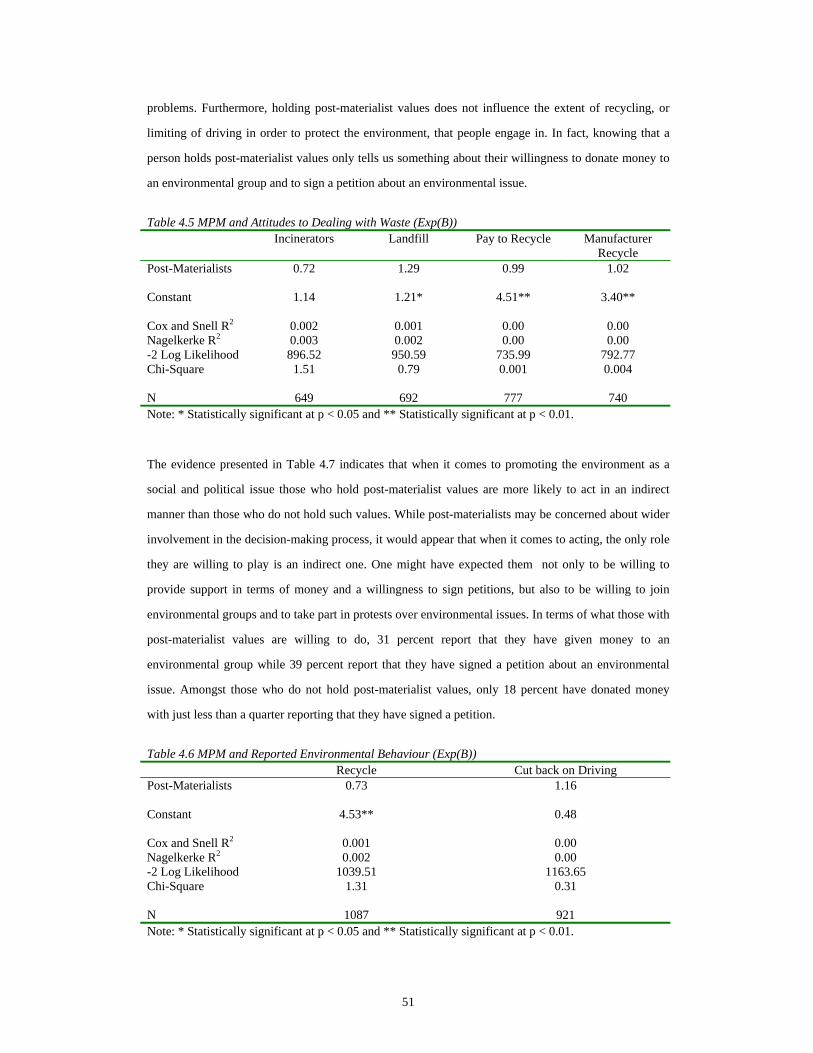
51
problems. Furthermore, holding post-materialist values does not influence the extent of recycling, or
limiting of driving in order to protect the environment, that people engage in. In fact, knowing that a
person holds post-materialist values only tells us something about their willingness to donate money to
an environmental group and to sign a petition about an environmental issue.
Table 4.5 MPM and Attitudes to Dealing with Waste (Exp(B)) Incinerators Landfill Pay to Recycle Manufacturer
Recycle Post-Materialists 0.72 1.29 0.99 1.02 Constant 1.14 1.21* 4.51** 3.40** Cox and Snell R2 0.002 0.001 0.00 0.00 Nagelkerke R2 0.003 0.002 0.00 0.00 -2 Log Likelihood 896.52 950.59 735.99 792.77 Chi-Square 1.51 0.79 0.001 0.004 N 649 692 777 740 Note: * Statistically significant at p < 0.05 and ** Statistically significant at p < 0.01.
The evidence presented in Table 4.7 indicates that when it comes to promoting the environment as a
social and political issue those who hold post-materialist values are more likely to act in an indirect
manner than those who do not hold such values. While post-materialists may be concerned about wider
involvement in the decision-making process, it would appear that when it comes to acting, the only role
they are willing to play is an indirect one. One might have expected them not only to be willing to
provide support in terms of money and a willingness to sign petitions, but also to be willing to join
environmental groups and to take part in protests over environmental issues. In terms of what those with
post-materialist values are willing to do, 31 percent report that they have given money to an
environmental group while 39 percent report that they have signed a petition about an environmental
issue. Amongst those who do not hold post-materialist values, only 18 percent have donated money
with just less than a quarter reporting that they have signed a petition.
Table 4.6 MPM and Reported Environmental Behaviour (Exp(B)) Recycle Cut back on Driving Post-Materialists 0.73 1.16 Constant 4.53** 0.48 Cox and Snell R2 0.001 0.00 Nagelkerke R2 0.002 0.00 -2 Log Likelihood 1039.51 1163.65 Chi-Square 1.31 0.31 N 1087 921 Note: * Statistically significant at p < 0.05 and ** Statistically significant at p < 0.01.
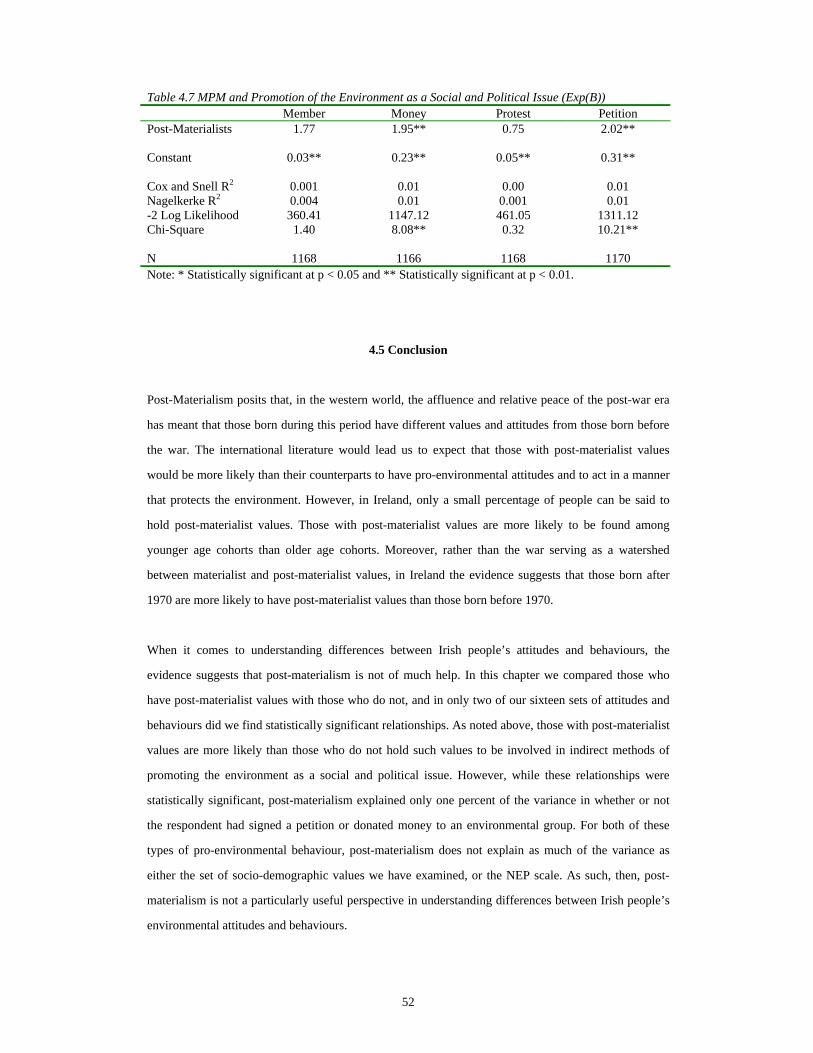
52
Table 4.7 MPM and Promotion of the Environment as a Social and Political Issue (Exp(B)) Member Money Protest Petition Post-Materialists 1.77 1.95** 0.75 2.02** Constant 0.03** 0.23** 0.05** 0.31** Cox and Snell R2 0.001 0.01 0.00 0.01 Nagelkerke R2 0.004 0.01 0.001 0.01 -2 Log Likelihood 360.41 1147.12 461.05 1311.12 Chi-Square 1.40 8.08** 0.32 10.21** N 1168 1166 1168 1170 Note: * Statistically significant at p < 0.05 and ** Statistically significant at p < 0.01.
4.5 Conclusion
Post-Materialism posits that, in the western world, the affluence and relative peace of the post-war era
has meant that those born during this period have different values and attitudes from those born before
the war. The international literature would lead us to expect that those with post-materialist values
would be more likely than their counterparts to have pro-environmental attitudes and to act in a manner
that protects the environment. However, in Ireland, only a small percentage of people can be said to
hold post-materialist values. Those with post-materialist values are more likely to be found among
younger age cohorts than older age cohorts. Moreover, rather than the war serving as a watershed
between materialist and post-materialist values, in Ireland the evidence suggests that those born after
1970 are more likely to have post-materialist values than those born before 1970.
When it comes to understanding differences between Irish people’s attitudes and behaviours, the
evidence suggests that post-materialism is not of much help. In this chapter we compared those who
have post-materialist values with those who do not, and in only two of our sixteen sets of attitudes and
behaviours did we find statistically significant relationships. As noted above, those with post-materialist
values are more likely than those who do not hold such values to be involved in indirect methods of
promoting the environment as a social and political issue. However, while these relationships were
statistically significant, post-materialism explained only one percent of the variance in whether or not
the respondent had signed a petition or donated money to an environmental group. For both of these
types of pro-environmental behaviour, post-materialism does not explain as much of the variance as
either the set of socio-demographic values we have examined, or the NEP scale. As such, then, post-
materialism is not a particularly useful perspective in understanding differences between Irish people’s
environmental attitudes and behaviours.
53
Chapter 5
The Impact of Cultural Values on Environmental Attitudes and Behaviours in
Ireland
5.1 Introduction
The third and final theoretical perspective that we consider is Grid-Group Theory (GGT) or, as it is
sometimes referred to, Cultural Theory. Initially developed in the 1970s by Douglas, and then in co-
operation with Wildavsky in the 1980s, this is a theory of social relations and cultural preferences. Two
central aspects of social relationships are explored along two dimensions. The Grid dimension focuses
on restrictions to individual behaviour, the extent of acceptance of rules and regulations and is
sometimes referred to as the ‘legitimation of external prescription’17. The Group dimension of social
relations refers to the extent of a sense of responsibility and commitment that individuals have to units
greater than themselves and the extent to which they are incorporated into these units. (Grendstad,
2003; Vaughan, 2002; Coughlin and Lockhart, 1998) Though GGT has been developed since the 1970s,
it is only in the 1990s that it has begun to be tested empirically using quantitative studies. (Thompson et
al, 1990; Coughlin and Lockhart, 1998; Ellis and Thompson, 1997; Grendstad, 2000, 2003) While the
empirical analysis has focused on the cultural biases that result from the interaction of the two
dimensions, the experimental nature of the items provided in the ISSP Environmental module, and our
analysis of the Irish data, has led us to focus our attention on the effect that each dimension has on
environmental attitudes and behaviours.
As outlined in Chapter 1, Cultural Theory is a theory about the relationship between four forms of
social organisation and the cultural biases that contribute to maintaining and legitimising these
organisational patterns. These four forms of organisation and cultural biases are ‘hierarchy’,
‘egalitarian’, ‘individualism’ and ‘fatalism’. These four organisational patterns and related biases are
the consequence of the interaction of two dimensions, Grid and Group. Grid refers to the extent to
which there are clear role definitions within a group or society, and clear requirements to maintain
them. Group refers to the strength of commitment to, and concern for, the group or society as a whole.
When the two dimensions, ‘Grid’ and ‘Group’, interact they generate the four cultural biases. Central
aspects of these cultural biases are legitimations regarding appropriate relationships between members
of each of the four forms of social organisation in order to maintain it. These legitimations also include 17 Legitimacy of external prescription refers to the varying ease with which persons accept another person’s judgements are valid for, and binding on, them. (Coughlin and Lockhart, 1998, p.35)
54
definitions of nature and the environment (see Chapter 1). This exploration of the relationship between
cultural biases and attitudes to nature, and to risk, is a prevalent preoccupation within cultural theory.
Empirical quantitative analysis of these four cultural biases as published in the international literature
have focused on exploring indices and scales indicative of each of the cultural biases, and then
exploring the relationship between these biases and environmental attitudes. This has had varying
degrees of success, especially in terms of identifying indices and scales to differentiate sufficiently
between these four biases. (Thompson et al, 1990; Coughlin and Lockhart, 1998; Ellis and Thompson,
1997; Grendstad, 2000, 2003) However, the early piloting for the ISSP Environmental module of the
proposed items to measure the cultural biases was not particularly successful (Jarvis et al, 1999), so the
relevant battery of items (E23) was included as an optional module. It was decided, due to the interest
in potential explanatory capacities of this theory, to include it in the Irish survey.
The purpose of this chapter is to use the data available to us to explore the possibility of identifying
Grid and Group dimensions and the four cultural biases. Having established sufficiently robust scales
identifying both the Grid and Group dimensions, we continue to explore their relationships to
environmental attitudes and behaviour in Ireland. The first section of this chapter sets out how we
arrived at our measures of both Grid and Group dimensions. We then examine the distribution of Irish
respondents on these dimensions taking into account a variety of socio-demographic characteristics.
Finally, we examine the influence of respondents’ Grid and Group values on both their environmental
attitudes and their behaviours.
5.2 Grid and Group Dimensions in Ireland
In the ISSP module, eight items were proposed as measuring each of the cultural biases. However, as
noted above, the team that designed the ISSP Environmental module were not happy with the results
that this battery of items produced in a pilot test. Jarvis et al (1999, pp22-26) report that 12 items were
piloted in Britain in October 1998, but that the results of this pilot were not all that encouraging18;
18 The factor analysis that they carried resulted in four factors but these were not quite as expected. On one of these factors two ‘fatalism’ items loaded together while on another three ‘hierarchy’ items loaded together. In both cases the alphas for the resulting scales were less than 0.50. Moreover, the first factor did not distinguish between ‘individualism’ and ‘egalitarianism’. That said, the resulting scale had an alpha of just less than 0.70. The fourth and final factor was composed of a ‘fatalism’ item and an ‘individualism’ item.
55
consequently it was left open to each national research team as to whether or not they would include
this battery of items.
When we examined the battery of eight items (E23) intended to identify each of the four cultural biases
we found that the scales were generally very weak. However, this analysis indicated that it might prove
fruitful to look at the two dimensions (Grid and Group) separately rather than examine the four cultural
biases directly.
The Irish research team decided to explore (a) whether we could identify indices of the Grid and Group
dimensions and scale them in a sufficiently robust manner and (b) whether these dimensions
contributed to our understanding of the 16 sets of environmental attitudes and behaviours of interest to
us. In other words, are they cultural sources of support for pro-environmental views and practices? We
were interested both in how these two dimensions might, independently, be related to environmental
attitudes and behaviours, and, if both were significantly related to the same set of attitudes or
behaviours, whether we could then identify a particular cultural bias, each bias being, in cultural theory,
identified by the interaction of the two dimensions. In developing measures of these two dimensions we
not only utilised some of the items suggested by the ISSP Environmental module for exploring cultural
biases, but also considered a variety of items from the ISPAS core module that appeared theoretically
relevant.
The Group dimension is concerned with strength of commitment to the group or society as a whole.
This can manifest itself in contemporary society in attitudes to inequality and collective attempts to
reduce it. Moreover, it has also been found that commitment to the group or society is related to
attitudes to the environment. The Grid dimension is concerned with strength of adherence to defined
roles and acceptance of authority. This can manifest itself in attitudes to authority, perceptions of
government-citizen relationships, and a sense of personal and political efficacy. Again there is some
evidence from the international literature that this may influence environmental attitudes and
behaviours. (Ellis and Thompson, 1997; Grendstad, 2000; Steg and Sievers, 2000)
The Group dimension is concerned with strength of commitment to the wider society beyond oneself
and, we have defined it in terms of attitudes to equality and collective egalitarian efforts. The factor
analysis that lead to its identification in the Irish context are presented in Table 5.1. These items refer to
attitudes to economic inequality and in particular to collective attempts to reduce it through
redistribution. Of the six items selected, agreement with four of them indicates a high-Group position
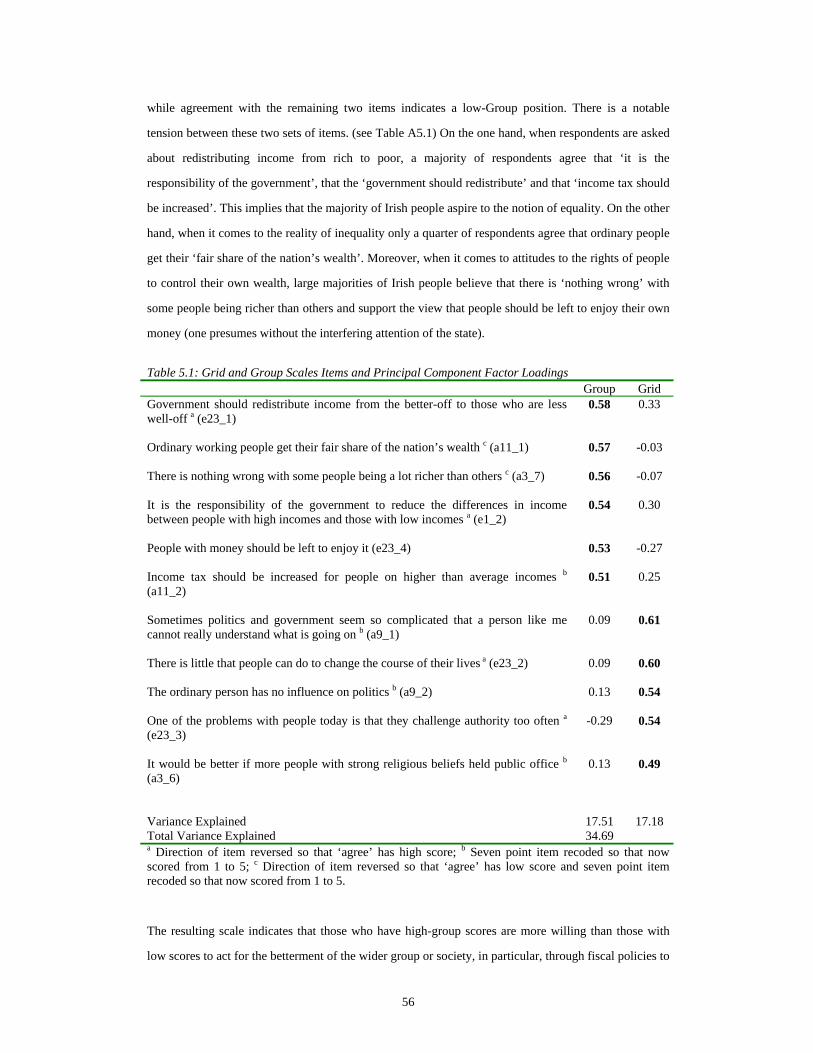
56
while agreement with the remaining two items indicates a low-Group position. There is a notable
tension between these two sets of items. (see Table A5.1) On the one hand, when respondents are asked
about redistributing income from rich to poor, a majority of respondents agree that ‘it is the
responsibility of the government’, that the ‘government should redistribute’ and that ‘income tax should
be increased’. This implies that the majority of Irish people aspire to the notion of equality. On the other
hand, when it comes to the reality of inequality only a quarter of respondents agree that ordinary people
get their ‘fair share of the nation’s wealth’. Moreover, when it comes to attitudes to the rights of people
to control their own wealth, large majorities of Irish people believe that there is ‘nothing wrong’ with
some people being richer than others and support the view that people should be left to enjoy their own
money (one presumes without the interfering attention of the state).
Table 5.1: Grid and Group Scales Items and Principal Component Factor Loadings Group Grid Government should redistribute income from the better-off to those who are less well-off a (e23_1)
0.58 0.33
Ordinary working people get their fair share of the nation’s wealth c (a11_1)
0.57 -0.03
There is nothing wrong with some people being a lot richer than others c (a3_7)
0.56 -0.07
It is the responsibility of the government to reduce the differences in income between people with high incomes and those with low incomes a (e1_2)
0.54 0.30
People with money should be left to enjoy it (e23_4)
0.53 -0.27
Income tax should be increased for people on higher than average incomes b (a11_2)
0.51 0.25
Sometimes politics and government seem so complicated that a person like me cannot really understand what is going on b (a9_1)
0.09 0.61
There is little that people can do to change the course of their lives a (e23_2)
0.09 0.60
The ordinary person has no influence on politics b (a9_2)
0.13 0.54
One of the problems with people today is that they challenge authority too often a (e23_3)
-0.29 0.54
It would be better if more people with strong religious beliefs held public office b (a3_6)
0.13 0.49
Variance Explained 17.51 17.18 Total Variance Explained 34.69 a Direction of item reversed so that ‘agree’ has high score; b Seven point item recoded so that now scored from 1 to 5; c Direction of item reversed so that ‘agree’ has low score and seven point item recoded so that now scored from 1 to 5.
The resulting scale indicates that those who have high-group scores are more willing than those with
low scores to act for the betterment of the wider group or society, in particular, through fiscal policies to
57
reduce economic inequality. Those who have low scores on this scale are less willing to consider the
needs of the wider group or society and do not favour sharing their own earnings or wealth with those
who have less (believing that not only is it theirs to enjoy but that there is nothing wrong with such
differences).
The Grid dimension is concerned with attitudes to authority and sense of efficacy and the items that
load on our second component are held to reveal this dimension. Two of the items proposed by the ISSP
Environmental module for measuring cultural biases are used while the other three are taken from the
core module of ISPAS. The items used here tap attitudes to the relationship between government and
citizen, relationships to authority and a sense of personal and political efficacy. Those who have high
scores on this dimension feel that the ordinary citizen has little influence, that authority should not be
challenged, and have little sense of personal or political efficacy. They feel that there is an order that
should be respected. These people feel that authority should not be challenged, that the world, and in
particular politics, is complicated and best left to those who understand it. At the other end of the scale
(low-grid) are those who are less willing to accept ‘external direction’, be it based on authority derived
from experience or knowledge or religious beliefs. They believe that those in positions of authority can
be challenged and that their own actions will have some effect on whatever problem they tackle.
5.3 Distribution of Irish Respondents on the Grid and Group Scales
In this section we consider how Grid and Group values are distributed not only within the sample as a
whole but also across various socio-demographic groupings. This method allows us to identify those
sub-groups that are most associated with strong Group and Grid values and those that are not. In terms
of the overall sample, on both the Grid and Group scales the mean and median scores are more or less
equal. The position of the typical respondent on the Group scale is slightly to the high-Group end of the
scale, that is, the end that favours collective action to remove inequality (both the mean and median
positions on this scale are 3.11). At the extreme ends of the Group scale about four percent of
respondents score between 1 and 2, while about five percent score between 4 and 5. On the Grid scale,
the position of the typical respondent is slightly towards to low-Grid end of the scale, that is, the end
that is critical of external direction and has a sense of efficacy in both public and private spheres (the
mean on this scale is equal to 2.82 while the median is equal to 2.83). About twelve percent of
respondents have a score between 1 and 2 on the Grid scale while four percent score between 4 and 5
58
on the Grid scale. For the most part then, the majority of Irish people cluster near the centres of both
scales. How do values on both of these scales differ within socio-demographic cohorts?
The results presented in Table 5.2 indicate that gender, education, religiosity, social class, net household
income and whether or not the respondent works in the public or private sectors help us understand
differences in respondents’ scores on the Grid scale. Moreover, these socio-demographic variables
explain a fifth of the variance in the Grid-values of Irish respondents. However, as will become evident
below, only education, social class and income help us understand the differences between those who
are critical of authority and hierarchy and who feel that they can influence what happens to them (those
who have low-Grid scores, that is, less than 3) and those who do not (those who have high-Grid scores,
that is, greater than 3).
The evidence presented in Table 5.2 suggests that women and those who attend religious services at
least once a week are more willing to accept external direction uncritically than their counterparts. That
said, the mean scores for both sexes suggest that, in general, members of both sexes are somewhat
critical of authority, the mean score for women is 2.88 while that for men is 2.76. When we compare the
religiosity of respondents the differences between the mean scores of the two groups is much greater.
The mean score on the Grid scale of those who are infrequent attendees at religious services is 2.64
while that for respondents who go to church services at least once a week is 2.94, indicating that they
are less critical of authority than those who do not go to church at least once a week. When we consider
the relationship between education and the Grid dimension, those with higher levels of formal education
are less willing to accept external direction uncritically. When we compare the mean scores of those
who have a university degree or more with those whose highest formal educational achievement is the
Intermediate/Junior Certificate, a mean score of 3.08 for the latter group suggests that they are uncritical
of external direction, while a mean score of 2.43 (the lowest mean score on the Grid scale for the
various socio-demographic variables) for the university group implies that they are much more critical
of authority and hierarchy. The relationship between income and the Grid dimension suggests that those
who earn more are less willing to accept external direction uncritically than those who earn less. A
mean score for those who earn less than £10,000 per year of 3.16 is the highest mean score for any of
the socio-demographic cohorts on the Grid scale. This indicates that as a group they are the least critical
of authority, seek direction from others, and feel that their own actions will have little or no effect on
improving their lives. The mean score on the Grid scale for those who earn more than £30,000 per year
is 2.55, which suggests that these respondents are much more willing to look to themselves rather than
others for direction. Social class and whether or not a person works in the public or private sector also
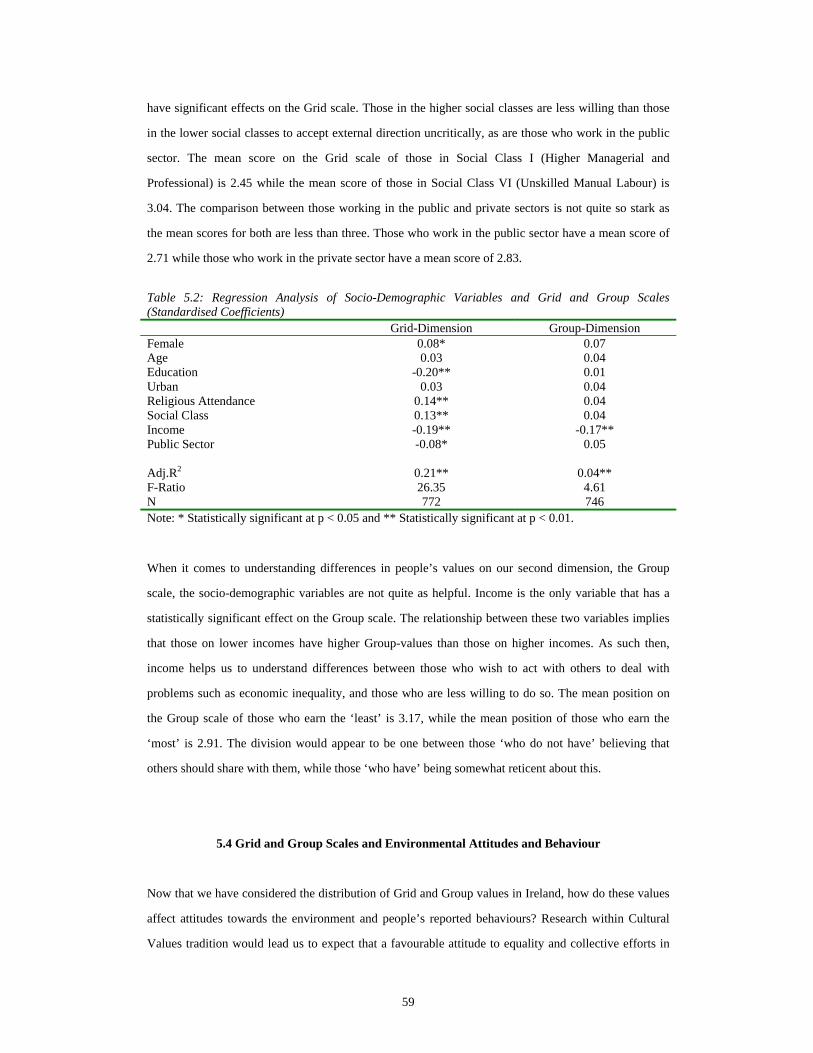
59
have significant effects on the Grid scale. Those in the higher social classes are less willing than those
in the lower social classes to accept external direction uncritically, as are those who work in the public
sector. The mean score on the Grid scale of those in Social Class I (Higher Managerial and
Professional) is 2.45 while the mean score of those in Social Class VI (Unskilled Manual Labour) is
3.04. The comparison between those working in the public and private sectors is not quite so stark as
the mean scores for both are less than three. Those who work in the public sector have a mean score of
2.71 while those who work in the private sector have a mean score of 2.83.
Table 5.2: Regression Analysis of Socio-Demographic Variables and Grid and Group Scales (Standardised Coefficients) Grid-Dimension Group-Dimension Female 0.08* 0.07 Age 0.03 0.04 Education -0.20** 0.01 Urban 0.03 0.04 Religious Attendance 0.14** 0.04 Social Class 0.13** 0.04 Income -0.19** -0.17** Public Sector -0.08* 0.05 Adj.R2 0.21** 0.04** F-Ratio 26.35 4.61 N 772 746 Note: * Statistically significant at p < 0.05 and ** Statistically significant at p < 0.01.
When it comes to understanding differences in people’s values on our second dimension, the Group
scale, the socio-demographic variables are not quite as helpful. Income is the only variable that has a
statistically significant effect on the Group scale. The relationship between these two variables implies
that those on lower incomes have higher Group-values than those on higher incomes. As such then,
income helps us to understand differences between those who wish to act with others to deal with
problems such as economic inequality, and those who are less willing to do so. The mean position on
the Group scale of those who earn the ‘least’ is 3.17, while the mean position of those who earn the
‘most’ is 2.91. The division would appear to be one between those ‘who do not have’ believing that
others should share with them, while those ‘who have’ being somewhat reticent about this.
5.4 Grid and Group Scales and Environmental Attitudes and Behaviour
Now that we have considered the distribution of Grid and Group values in Ireland, how do these values
affect attitudes towards the environment and people’s reported behaviours? Research within Cultural
Values tradition would lead us to expect that a favourable attitude to equality and collective efforts in
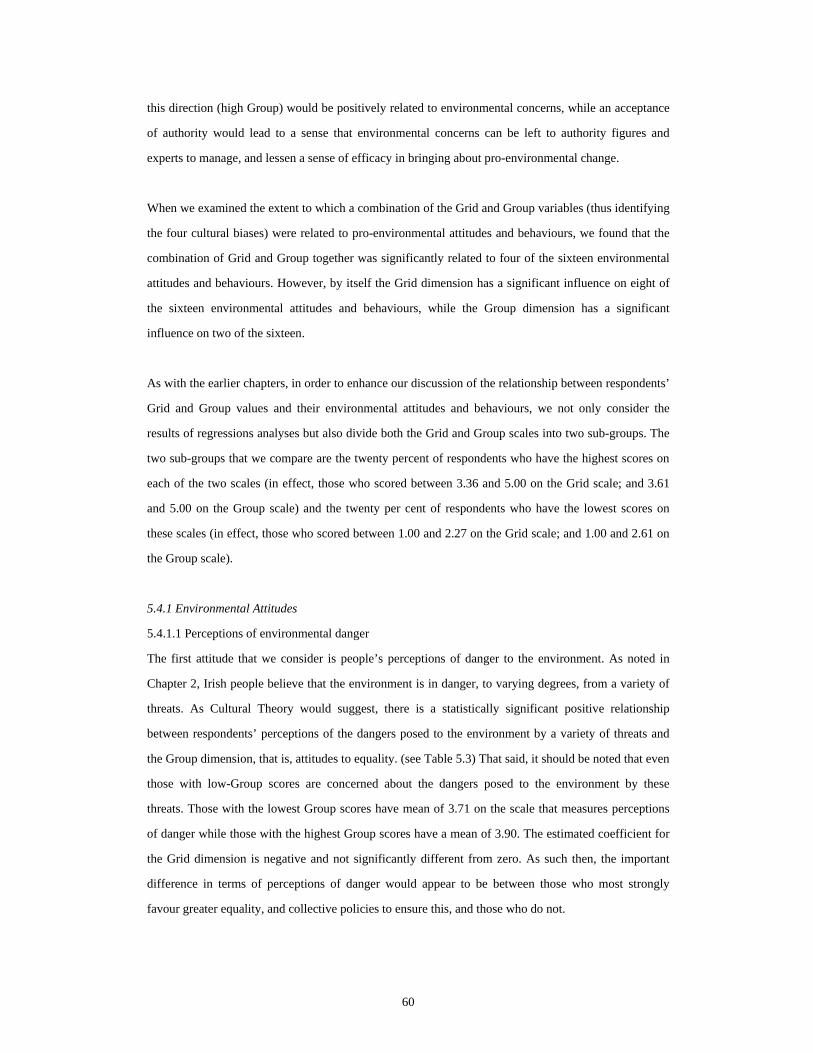
60
this direction (high Group) would be positively related to environmental concerns, while an acceptance
of authority would lead to a sense that environmental concerns can be left to authority figures and
experts to manage, and lessen a sense of efficacy in bringing about pro-environmental change.
When we examined the extent to which a combination of the Grid and Group variables (thus identifying
the four cultural biases) were related to pro-environmental attitudes and behaviours, we found that the
combination of Grid and Group together was significantly related to four of the sixteen environmental
attitudes and behaviours. However, by itself the Grid dimension has a significant influence on eight of
the sixteen environmental attitudes and behaviours, while the Group dimension has a significant
influence on two of the sixteen.
As with the earlier chapters, in order to enhance our discussion of the relationship between respondents’
Grid and Group values and their environmental attitudes and behaviours, we not only consider the
results of regressions analyses but also divide both the Grid and Group scales into two sub-groups. The
two sub-groups that we compare are the twenty percent of respondents who have the highest scores on
each of the two scales (in effect, those who scored between 3.36 and 5.00 on the Grid scale; and 3.61
and 5.00 on the Group scale) and the twenty per cent of respondents who have the lowest scores on
these scales (in effect, those who scored between 1.00 and 2.27 on the Grid scale; and 1.00 and 2.61 on
the Group scale).
5.4.1 Environmental Attitudes
5.4.1.1 Perceptions of environmental danger
The first attitude that we consider is people’s perceptions of danger to the environment. As noted in
Chapter 2, Irish people believe that the environment is in danger, to varying degrees, from a variety of
threats. As Cultural Theory would suggest, there is a statistically significant positive relationship
between respondents’ perceptions of the dangers posed to the environment by a variety of threats and
the Group dimension, that is, attitudes to equality. (see Table 5.3) That said, it should be noted that even
those with low-Group scores are concerned about the dangers posed to the environment by these
threats. Those with the lowest Group scores have mean of 3.71 on the scale that measures perceptions
of danger while those with the highest Group scores have a mean of 3.90. The estimated coefficient for
the Grid dimension is negative and not significantly different from zero. As such then, the important
difference in terms of perceptions of danger would appear to be between those who most strongly
favour greater equality, and collective policies to ensure this, and those who do not.
61
Table 5.3: Grid and Group Scales and Environmental Attitudes (Standardised Coefficients) Perceptions of Danger Willingness to take on
costs Environmental Efficacy
Grid-Dimension -0.05 -0.21** -0.37** Group-Dimension 0.13** -0.02 -0.02 Adj.R2 0.01 0.04 0.13 F-Ratio 8.29** 24.35** 82.79** N 930 1031 1046 Note: * Statistically significant at p < 0.05 and ** Statistically significant at p < 0.01.
5.4.1.2 Willingness to take on extra costs and Environmental efficacy
As is evident from Table 5.3, only the Grid scale has a significant impact on both respondents’ feelings
of efficacy in tackling environmental problems and their willingness to take on extra costs to protect the
environment. Those who are inclined to be critical of authority and who believe that their own actions
are personally and politically efficacious feel that their pro-environmental actions make a difference.
While those who feel personally and politically efficacious (low-grid) have a mean score on the
environmental efficacy scale of 3.65, those who do not feel efficacious (high-grid) have a mean score of
just 2.62.
Again, those who feel that they can act to improve their own lives and are more confident in their own
ability to make decisions are more willing to take on the extra costs necessary to protect the
environment. As with their feelings of efficacy in terms of dealing with environmental problems, the
mean positions of those with the lowest and highest Grid scores differentiates between those who are
willing to take on extra costs to protect the environment and those who are not. The mean position of
those with the lowest Grid scores is 3.27 while that for those with the highest Grid scores is 2.62.
5.4.1.3 Trust in sources of information
We noted in Chapter 2 that there are large differences in the degree to which Irish people trust a variety
of institutions to provide them with correct information about the causes of pollution. The Grid and
Group scales provide some interesting insights into the degree to which people trust industry and
business, government departments and environmental groups to provide them with this information.
The results presented in Table 5.4 suggest that those who are less inclined to be critical of authority
(those with high-Grid scores) trust business and industry (though the overall model fit is not
significant), and those who are less concerned about equality and collective action (those with low-
Group scores) trust government departments. In terms of the percentages that express trust in business
and industry, ten percent of those with the highest Grid scores said that they trusted them while six
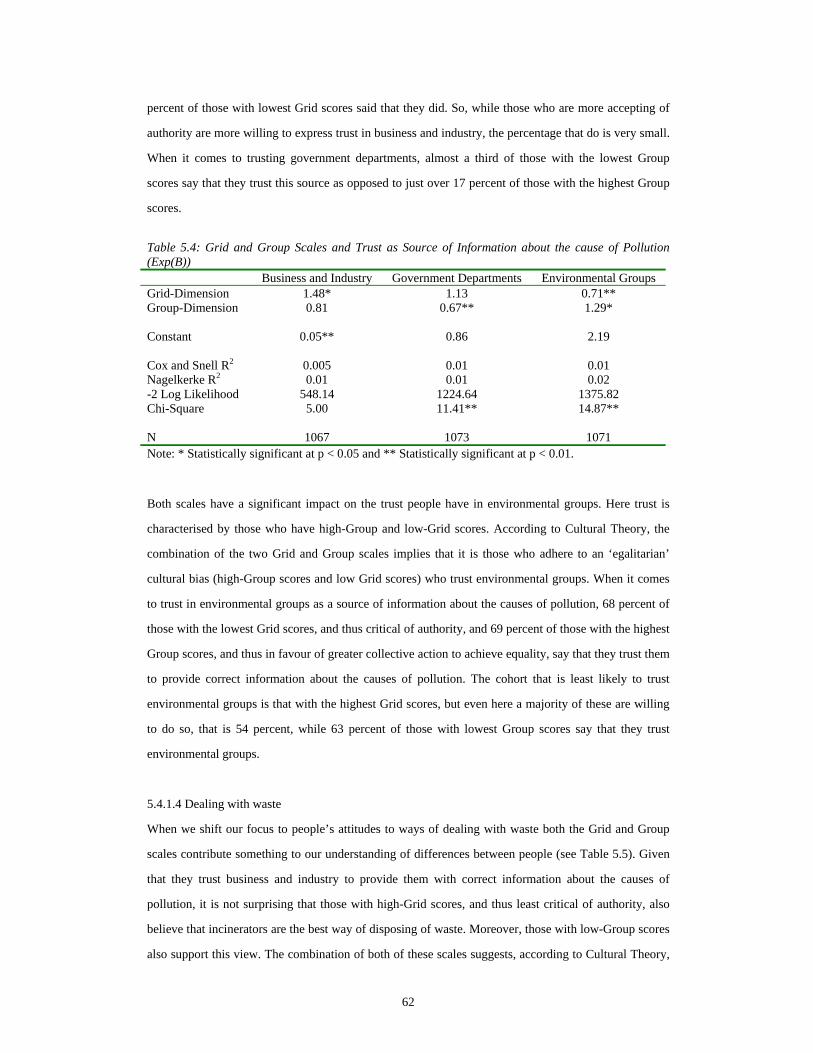
62
percent of those with lowest Grid scores said that they did. So, while those who are more accepting of
authority are more willing to express trust in business and industry, the percentage that do is very small.
When it comes to trusting government departments, almost a third of those with the lowest Group
scores say that they trust this source as opposed to just over 17 percent of those with the highest Group
scores.
Table 5.4: Grid and Group Scales and Trust as Source of Information about the cause of Pollution (Exp(B)) Business and Industry Government Departments Environmental Groups Grid-Dimension 1.48* 1.13 0.71** Group-Dimension 0.81 0.67** 1.29* Constant 0.05** 0.86 2.19 Cox and Snell R2 0.005 0.01 0.01 Nagelkerke R2 0.01 0.01 0.02 -2 Log Likelihood 548.14 1224.64 1375.82 Chi-Square 5.00 11.41** 14.87** N 1067 1073 1071 Note: * Statistically significant at p < 0.05 and ** Statistically significant at p < 0.01.
Both scales have a significant impact on the trust people have in environmental groups. Here trust is
characterised by those who have high-Group and low-Grid scores. According to Cultural Theory, the
combination of the two Grid and Group scales implies that it is those who adhere to an ‘egalitarian’
cultural bias (high-Group scores and low Grid scores) who trust environmental groups. When it comes
to trust in environmental groups as a source of information about the causes of pollution, 68 percent of
those with the lowest Grid scores, and thus critical of authority, and 69 percent of those with the highest
Group scores, and thus in favour of greater collective action to achieve equality, say that they trust them
to provide correct information about the causes of pollution. The cohort that is least likely to trust
environmental groups is that with the highest Grid scores, but even here a majority of these are willing
to do so, that is 54 percent, while 63 percent of those with lowest Group scores say that they trust
environmental groups.
5.4.1.4 Dealing with waste
When we shift our focus to people’s attitudes to ways of dealing with waste both the Grid and Group
scales contribute something to our understanding of differences between people (see Table 5.5). Given
that they trust business and industry to provide them with correct information about the causes of
pollution, it is not surprising that those with high-Grid scores, and thus least critical of authority, also
believe that incinerators are the best way of disposing of waste. Moreover, those with low-Group scores
also support this view. The combination of both of these scales suggests, according to Cultural Theory,
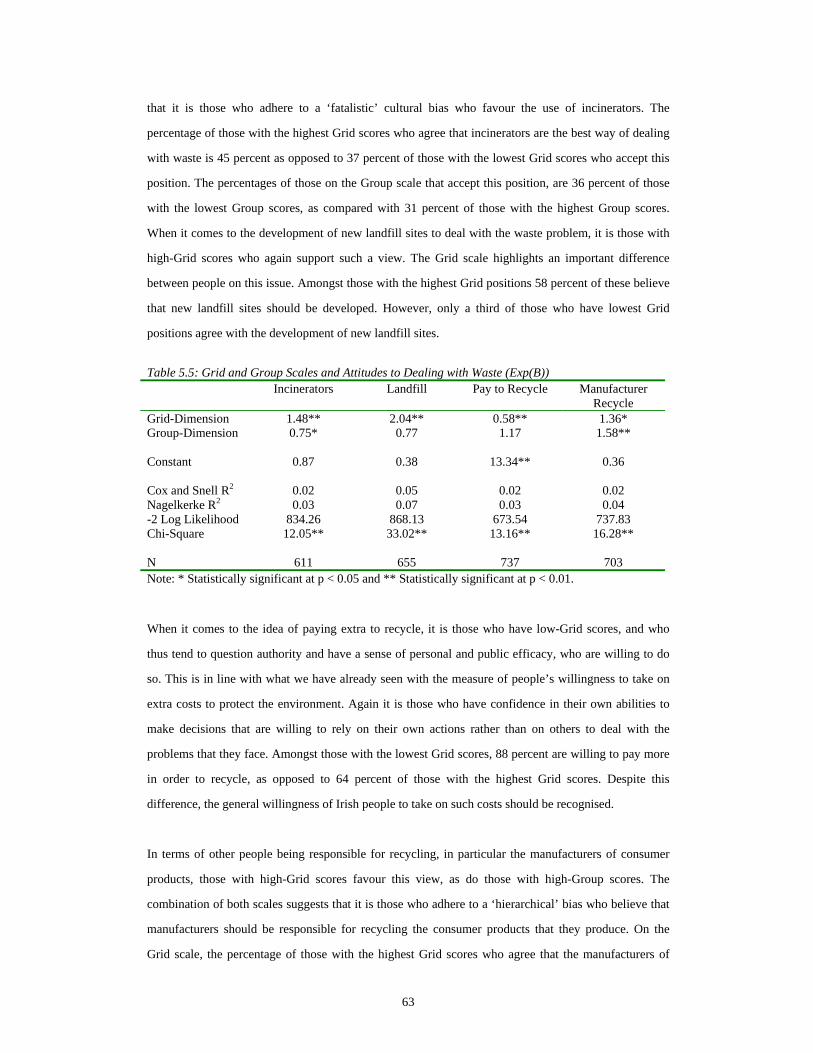
63
that it is those who adhere to a ‘fatalistic’ cultural bias who favour the use of incinerators. The
percentage of those with the highest Grid scores who agree that incinerators are the best way of dealing
with waste is 45 percent as opposed to 37 percent of those with the lowest Grid scores who accept this
position. The percentages of those on the Group scale that accept this position, are 36 percent of those
with the lowest Group scores, as compared with 31 percent of those with the highest Group scores.
When it comes to the development of new landfill sites to deal with the waste problem, it is those with
high-Grid scores who again support such a view. The Grid scale highlights an important difference
between people on this issue. Amongst those with the highest Grid positions 58 percent of these believe
that new landfill sites should be developed. However, only a third of those who have lowest Grid
positions agree with the development of new landfill sites.
Table 5.5: Grid and Group Scales and Attitudes to Dealing with Waste (Exp(B)) Incinerators Landfill Pay to Recycle Manufacturer
Recycle Grid-Dimension 1.48** 2.04** 0.58** 1.36* Group-Dimension 0.75* 0.77 1.17 1.58** Constant 0.87 0.38 13.34** 0.36 Cox and Snell R2 0.02 0.05 0.02 0.02 Nagelkerke R2 0.03 0.07 0.03 0.04 -2 Log Likelihood 834.26 868.13 673.54 737.83 Chi-Square 12.05** 33.02** 13.16** 16.28** N 611 655 737 703 Note: * Statistically significant at p < 0.05 and ** Statistically significant at p < 0.01.
When it comes to the idea of paying extra to recycle, it is those who have low-Grid scores, and who
thus tend to question authority and have a sense of personal and public efficacy, who are willing to do
so. This is in line with what we have already seen with the measure of people’s willingness to take on
extra costs to protect the environment. Again it is those who have confidence in their own abilities to
make decisions that are willing to rely on their own actions rather than on others to deal with the
problems that they face. Amongst those with the lowest Grid scores, 88 percent are willing to pay more
in order to recycle, as opposed to 64 percent of those with the highest Grid scores. Despite this
difference, the general willingness of Irish people to take on such costs should be recognised.
In terms of other people being responsible for recycling, in particular the manufacturers of consumer
products, those with high-Grid scores favour this view, as do those with high-Group scores. The
combination of both scales suggests that it is those who adhere to a ‘hierarchical’ bias who believe that
manufacturers should be responsible for recycling the consumer products that they produce. On the
Grid scale, the percentage of those with the highest Grid scores who agree that the manufacturers of
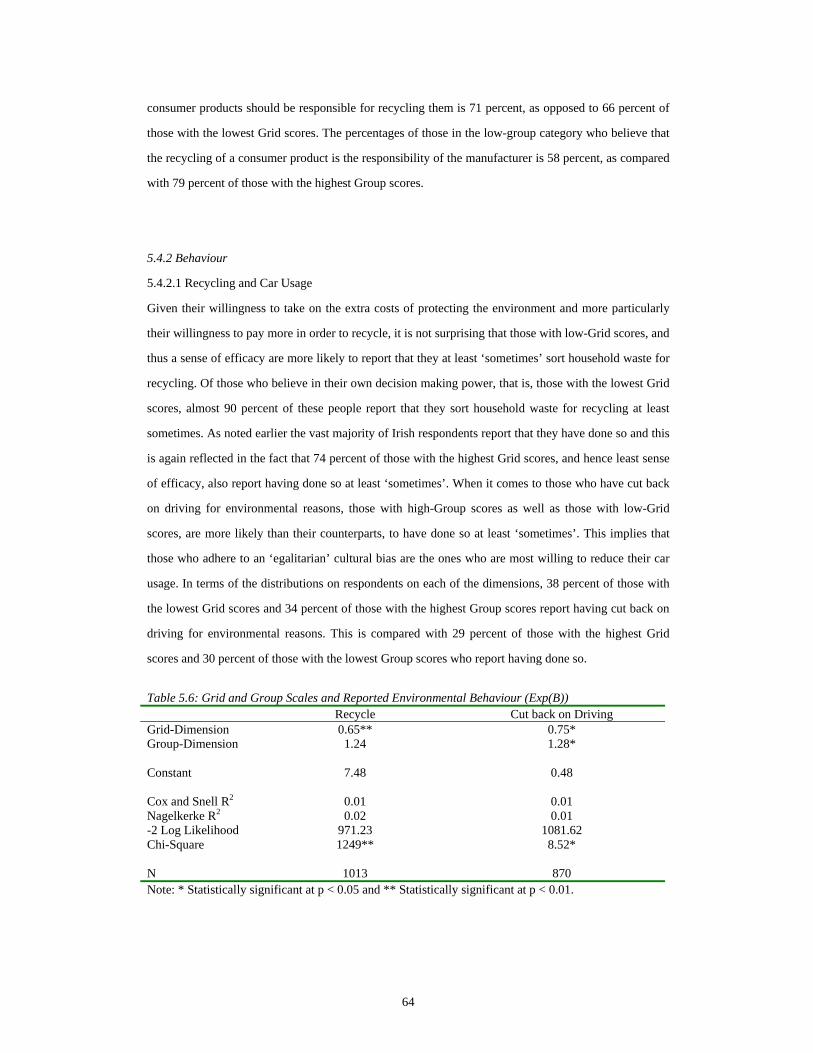
64
consumer products should be responsible for recycling them is 71 percent, as opposed to 66 percent of
those with the lowest Grid scores. The percentages of those in the low-group category who believe that
the recycling of a consumer product is the responsibility of the manufacturer is 58 percent, as compared
with 79 percent of those with the highest Group scores.
5.4.2 Behaviour
5.4.2.1 Recycling and Car Usage
Given their willingness to take on the extra costs of protecting the environment and more particularly
their willingness to pay more in order to recycle, it is not surprising that those with low-Grid scores, and
thus a sense of efficacy are more likely to report that they at least ‘sometimes’ sort household waste for
recycling. Of those who believe in their own decision making power, that is, those with the lowest Grid
scores, almost 90 percent of these people report that they sort household waste for recycling at least
sometimes. As noted earlier the vast majority of Irish respondents report that they have done so and this
is again reflected in the fact that 74 percent of those with the highest Grid scores, and hence least sense
of efficacy, also report having done so at least ‘sometimes’. When it comes to those who have cut back
on driving for environmental reasons, those with high-Group scores as well as those with low-Grid
scores, are more likely than their counterparts, to have done so at least ‘sometimes’. This implies that
those who adhere to an ‘egalitarian’ cultural bias are the ones who are most willing to reduce their car
usage. In terms of the distributions on respondents on each of the dimensions, 38 percent of those with
the lowest Grid scores and 34 percent of those with the highest Group scores report having cut back on
driving for environmental reasons. This is compared with 29 percent of those with the highest Grid
scores and 30 percent of those with the lowest Group scores who report having done so.
Table 5.6: Grid and Group Scales and Reported Environmental Behaviour (Exp(B)) Recycle Cut back on Driving Grid-Dimension 0.65** 0.75* Group-Dimension 1.24 1.28* Constant 7.48 0.48 Cox and Snell R2 0.01 0.01 Nagelkerke R2 0.02 0.01 -2 Log Likelihood 971.23 1081.62 Chi-Square 1249** 8.52* N 1013 870 Note: * Statistically significant at p < 0.05 and ** Statistically significant at p < 0.01.
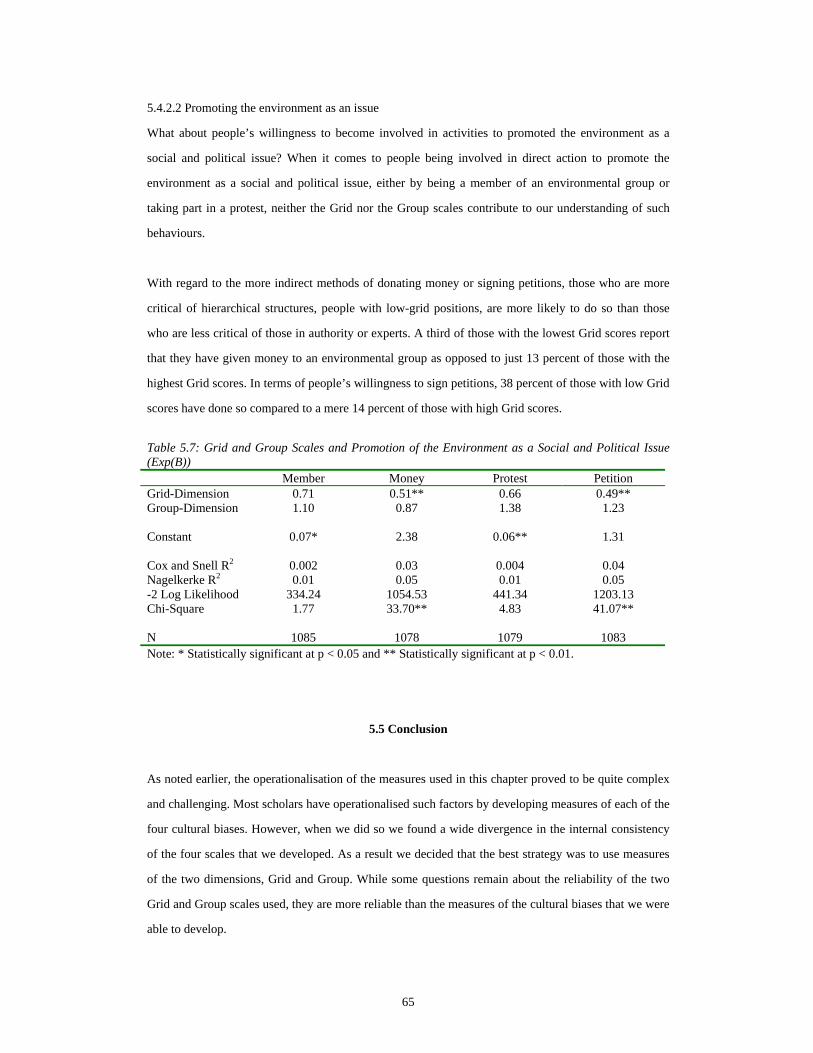
65
5.4.2.2 Promoting the environment as an issue
What about people’s willingness to become involved in activities to promoted the environment as a
social and political issue? When it comes to people being involved in direct action to promote the
environment as a social and political issue, either by being a member of an environmental group or
taking part in a protest, neither the Grid nor the Group scales contribute to our understanding of such
behaviours.
With regard to the more indirect methods of donating money or signing petitions, those who are more
critical of hierarchical structures, people with low-grid positions, are more likely to do so than those
who are less critical of those in authority or experts. A third of those with the lowest Grid scores report
that they have given money to an environmental group as opposed to just 13 percent of those with the
highest Grid scores. In terms of people’s willingness to sign petitions, 38 percent of those with low Grid
scores have done so compared to a mere 14 percent of those with high Grid scores.
Table 5.7: Grid and Group Scales and Promotion of the Environment as a Social and Political Issue (Exp(B)) Member Money Protest Petition Grid-Dimension 0.71 0.51** 0.66 0.49** Group-Dimension 1.10 0.87 1.38 1.23 Constant 0.07* 2.38 0.06** 1.31 Cox and Snell R2 0.002 0.03 0.004 0.04 Nagelkerke R2 0.01 0.05 0.01 0.05 -2 Log Likelihood 334.24 1054.53 441.34 1203.13 Chi-Square 1.77 33.70** 4.83 41.07** N 1085 1078 1079 1083 Note: * Statistically significant at p < 0.05 and ** Statistically significant at p < 0.01.
5.5 Conclusion
As noted earlier, the operationalisation of the measures used in this chapter proved to be quite complex
and challenging. Most scholars have operationalised such factors by developing measures of each of the
four cultural biases. However, when we did so we found a wide divergence in the internal consistency
of the four scales that we developed. As a result we decided that the best strategy was to use measures
of the two dimensions, Grid and Group. While some questions remain about the reliability of the two
Grid and Group scales used, they are more reliable than the measures of the cultural biases that we were
able to develop.
66
The Grid dimension in Cultural Theory focuses on restrictions to individual behaviour and the extent of
the acceptance of rules and regulations, and the Grid scale that we propose reflects this. The items used
in our scale contrast those who feel authority should not be challenged, with those who are less willing
to accept external direction, be it based on authority derived from expert knowledge, experience or
religion, and who have a sense of efficacy in both public and private spheres. The Group dimension
refers to the sense of responsibility and commitment that the individual has to units greater than
themselves. The Group scale that we propose contrasts those who favour collective action for the
betterment of the wider society, in particular by tackling economic inequality, with those who are more
reluctant to do so, seeing little wrong with differences in the wealth that people have.
Regarding the Grid dimension, the evidence presented in this chapter suggests that men, those with
higher levels of formal education, those who do not attend religious services on a regular basis, those in
the higher social classes, those who earn more and those who work in the public sector are more likely
to be critical of authority than their counterparts. On the Group scale, the only socio-demographic factor
that has a significant influence is income, with those on lower incomes being more willing than those
on higher incomes to state a strong preference for the reduction of economic inequalities between
people.
Do the two scales help us understand differences between Irish people’s environmental attitudes and
behaviours? Compared to the set of socio-demographics and the NEP scale, the Grid and Group scales
do not explain more of the variance in people’s attitudes and behaviours. The strongest influence that
they have is when we examine differences in people’s feelings of environmental efficacy. In this case
only the Grid scale has a statistically significant impact and explains thirteen percent of the variance. It
would thus appear that a general sense of efficacy in the public and private spheres carries over strongly
into the environmental arena, and is a cultural resource on which people draw.
Although the levels of variance explained are not particularly high, there are significant patterns in the
correlations between a range of environmental attitudes and behaviours and both Grid and Group
variables. The Grid scale has a significant impact on people’s willingness to take on the extra costs of
protecting the environment and of recycling, on how much they trust business and industry to provide
them with correct information about the causes of pollution, their attitude to the development of new
landfill sites, on their willingness to recycle and whether or not they report having donated money to an
environmental group or signed a petition. In all of these cases those who are more willing to question
67
authority and who have a sense of efficacy are the people who have the most pro-environmental
attitudes and behaviours.
The Group scale has significant impacts on people’s perceptions of the dangers posed to the
environment by a variety of threats, and on how much trust people have in government departments to
provide correct information about the causes of pollution. Those who feel a responsibility for society in
terms of seeking collective action to reduce inequality perceive greater dangers and are more sceptical
of the information provided by government departments than their counterparts.
Finally, in four cases both the Grid and Group scales have a significant effect, allowing us to draw on
Cultural Theory’s typology of cultural biases. As a result of this we suggest that those drawing on an
‘egalitarian’ cultural bias (low Grid and high Group) are more trusting of the information about the
causes of pollution provided by environmental groups, and more willing to cut back on driving for
environmental reasons than their counterparts. We also conclude that those drawing on a ‘fatalist’ (high
Grid and low Group) cultural bias are more inclined that their counterparts to regard incinerators as the
best means of disposing of waste, while those who adhere to a ‘hierarchical’ cultural bias (high Grid
and high Group) are more likely to agree that manufacturers of consumer products should be
responsible for recycling them.
It is evident from the above that Grid-Group Theory offers insight into some of the broader cultural
values that are related to pro-environmental attitudes and behaviour in Ireland. Although the amount of
variance explained is relatively small, the pattern of tendencies in the cultural values on which
respondents draw in their pro-environmental attitudes and behaviours is of great interest. Thus a
questioning attitude to authority and a strong sense of efficacy in both the public and private spheres,
carries over into attitudes and practices in relation to the environment. It can be concluded that
egalitarianism, attitudes to authority and sense of efficacy tend to be significant socio-political cultural
resources drawn upon by the Irish public in the movement towards environmental protection and
practices.

68
69
Chapter 6
The Impact of Underlying Values on Environmental Attitudes and Behaviours
6.1 Introduction
The approach of this report up until now has been to examine the impact on environmental attitudes and
behaviours of each of the theoretical perspectives and the set of socio-demographic variables separately.
In this chapter, we examine all of the factors that are intended to help us understand differences in Irish
people’s environmental attitudes and behaviour together. Doing so will allow us to determine which of
the theoretical perspectives and socio-demographic variables has the strongest relationship with
differences in attitudes and behaviours. As ever, we begin by considering differences in people’s
attitudes before moving on to differences in their behaviours.
6.2 Environmental Attitudes
The first set of variables that we consider are respondents’ attitudes to the environment. We begin with
Irish people’s perceptions of the dangers posed to the environment from a variety of sources. Then we
consider how willing they are to take on extra costs in order to protect the environment and how
optimistic they are about the effect of their actions to protect the environment. Once we have considered
these attitudes, we turn our attention to the degree to which Irish respondents trust business and
industry, government departments and environmental groups as sources of information about the causes
of pollution. Finally, we focus on how Irish people believe waste should be dealt with.
6.2.1 Perceptions of danger
In the ISSP Environment module respondents were asked how dangerous were seven different threats
for the environment. The evidence presented in Chapter 2 suggests that more than half of Irish
respondents consider six of the seven items to be either ‘extremely dangerous’ or ‘very dangerous’ for
the environment. The results suggest that Irish respondents see threats to the environment from a wide
variety of sources. They are convinced about the dangers posed to the environment by nuclear power
stations, water pollution, air pollution caused both by cars and industry, the ‘greenhouse effect’ and the
use of pesticides and chemicals in farming. In the case of each of these less than ten percent of
70
respondents believe that they are ‘not very dangerous’ or ‘not dangerous at all’ for the environment. In
this report, because we are interested in a wide variety of attitudes and behaviours we combine these
seven items into a single scale. On our scale that runs from one-to-five, where ‘five’ is ‘extremely
dangerous’ and ‘one’ is ‘not dangerous at all’, thirty percent of Irish respondents have a score greater
than four.19
When we examine the relationship between the New Environmental Paradigm, the Post-Materialist
thesis, the Grid-Group dimensions as well as our set of socio-demographic variables and people’s
perceptions of the danger that certain threats pose to the environment, we find that not only does the
NEP scale continue to have a significant effect when we keep all other factors constant, so too do the
Grid and Group scales. The results presented in Table 6.1 indicate that the effect of the NEP scale is
much stronger than that of either the Grid or Group scales. As we noted in Chapter 3, the NEP was
positively related to the level of danger that respondents perceive the environment to be facing. Those
with stronger feelings that the environment is fragile, limited and in need of our care and attention
believe that the proposed threats pose a great deal of danger for the environment. Furthermore, there are
positive relationships between our measure of people’s perceptions of danger and the Grid and Group
scales. On the Group scale those who are concerned about society, and in particular inequality, believe
that the environment is in danger, as do those who look to others for direction and advice. This
combination of Grid and Group scales implies that it is those who adhere to a ‘hierarchical’ cultural bias
who are most concerned about the danger of threats for the environment. Grid-Group theorists argue
that while adherents of ‘hierarchy’ may well perceive the environment to be under threat, they will only
embrace strong environmental concerns with reservations. These reservations are a consequence of their
belief that problems in nature, as in other aspects of life, can be managed, and they trust political and
scientific elites to do so. Thus adherents of a ‘hierarchical’ cultural bias place an important emphasis on
regulation, believing that if environmental ‘procedures are unheeded and limits transgressed, the system
will collapse’. (Grendstad, 2000, p.219) They accept that experts can determine an acceptable level of
risks, and threats to the environment can be dealt with through rules and regulations and by controlling
access to resources. (Steg and Sievers, 2000, p.254)
19 The mean position on this scale is 3.77 and the median position is 3.71.
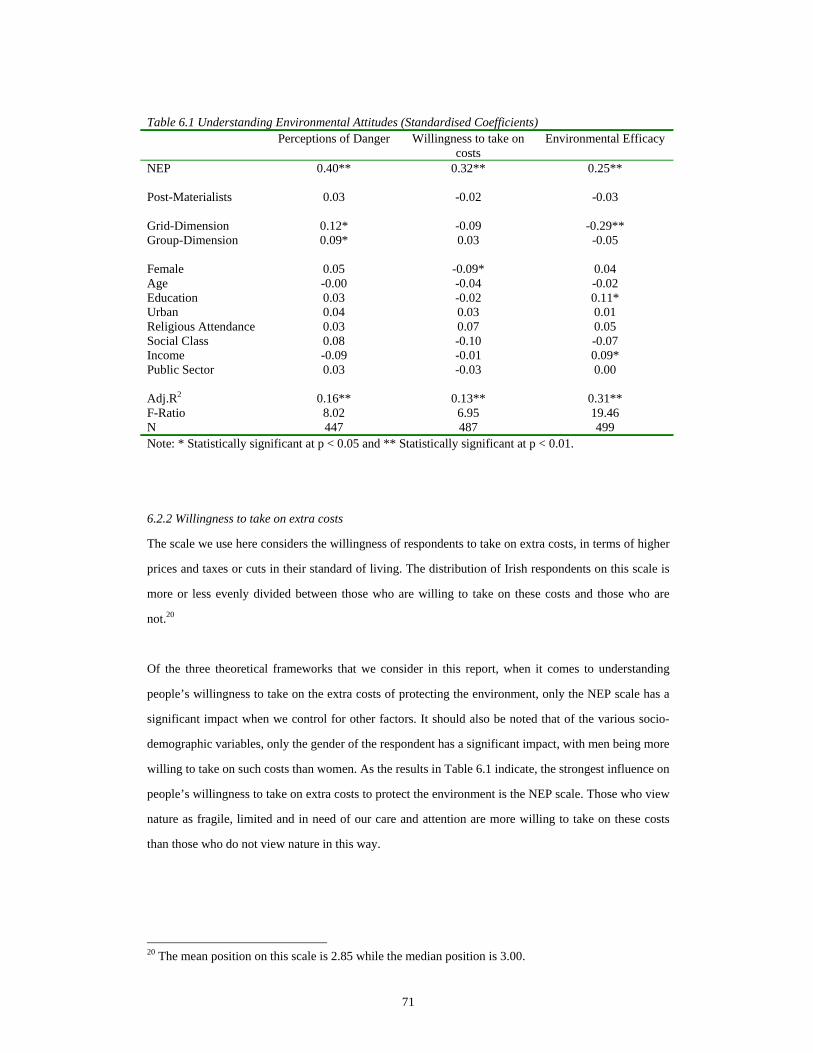
71
Table 6.1 Understanding Environmental Attitudes (Standardised Coefficients) Perceptions of Danger Willingness to take on
costs Environmental Efficacy
NEP 0.40** 0.32** 0.25** Post-Materialists 0.03 -0.02 -0.03 Grid-Dimension 0.12* -0.09 -0.29** Group-Dimension 0.09* 0.03 -0.05 Female 0.05 -0.09* 0.04 Age -0.00 -0.04 -0.02 Education 0.03 -0.02 0.11* Urban 0.04 0.03 0.01 Religious Attendance 0.03 0.07 0.05 Social Class 0.08 -0.10 -0.07 Income -0.09 -0.01 0.09* Public Sector 0.03 -0.03 0.00 Adj.R2 0.16** 0.13** 0.31** F-Ratio 8.02 6.95 19.46 N 447 487 499 Note: * Statistically significant at p < 0.05 and ** Statistically significant at p < 0.01.
6.2.2 Willingness to take on extra costs
The scale we use here considers the willingness of respondents to take on extra costs, in terms of higher
prices and taxes or cuts in their standard of living. The distribution of Irish respondents on this scale is
more or less evenly divided between those who are willing to take on these costs and those who are
not.20
Of the three theoretical frameworks that we consider in this report, when it comes to understanding
people’s willingness to take on the extra costs of protecting the environment, only the NEP scale has a
significant impact when we control for other factors. It should also be noted that of the various socio-
demographic variables, only the gender of the respondent has a significant impact, with men being more
willing to take on such costs than women. As the results in Table 6.1 indicate, the strongest influence on
people’s willingness to take on extra costs to protect the environment is the NEP scale. Those who view
nature as fragile, limited and in need of our care and attention are more willing to take on these costs
than those who do not view nature in this way.
20 The mean position on this scale is 2.85 while the median position is 3.00.
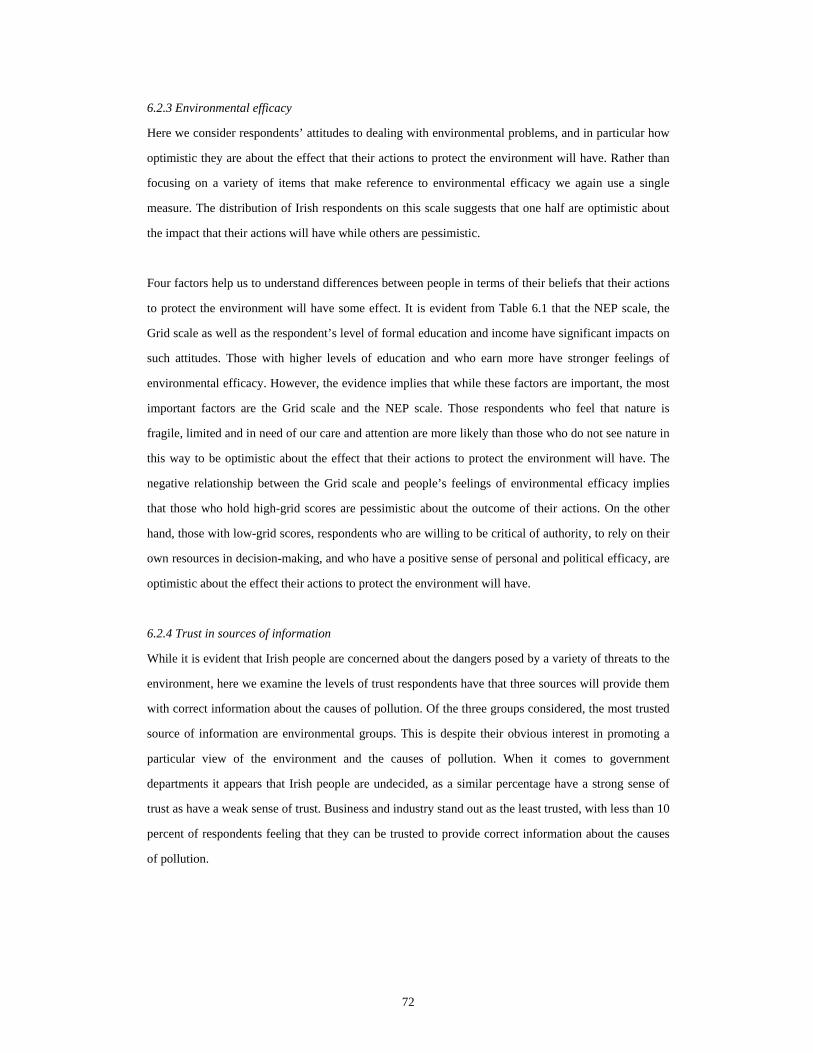
72
6.2.3 Environmental efficacy
Here we consider respondents’ attitudes to dealing with environmental problems, and in particular how
optimistic they are about the effect that their actions to protect the environment will have. Rather than
focusing on a variety of items that make reference to environmental efficacy we again use a single
measure. The distribution of Irish respondents on this scale suggests that one half are optimistic about
the impact that their actions will have while others are pessimistic.
Four factors help us to understand differences between people in terms of their beliefs that their actions
to protect the environment will have some effect. It is evident from Table 6.1 that the NEP scale, the
Grid scale as well as the respondent’s level of formal education and income have significant impacts on
such attitudes. Those with higher levels of education and who earn more have stronger feelings of
environmental efficacy. However, the evidence implies that while these factors are important, the most
important factors are the Grid scale and the NEP scale. Those respondents who feel that nature is
fragile, limited and in need of our care and attention are more likely than those who do not see nature in
this way to be optimistic about the effect that their actions to protect the environment will have. The
negative relationship between the Grid scale and people’s feelings of environmental efficacy implies
that those who hold high-grid scores are pessimistic about the outcome of their actions. On the other
hand, those with low-grid scores, respondents who are willing to be critical of authority, to rely on their
own resources in decision-making, and who have a positive sense of personal and political efficacy, are
optimistic about the effect their actions to protect the environment will have.
6.2.4 Trust in sources of information
While it is evident that Irish people are concerned about the dangers posed by a variety of threats to the
environment, here we examine the levels of trust respondents have that three sources will provide them
with correct information about the causes of pollution. Of the three groups considered, the most trusted
source of information are environmental groups. This is despite their obvious interest in promoting a
particular view of the environment and the causes of pollution. When it comes to government
departments it appears that Irish people are undecided, as a similar percentage have a strong sense of
trust as have a weak sense of trust. Business and industry stand out as the least trusted, with less than 10
percent of respondents feeling that they can be trusted to provide correct information about the causes
of pollution.
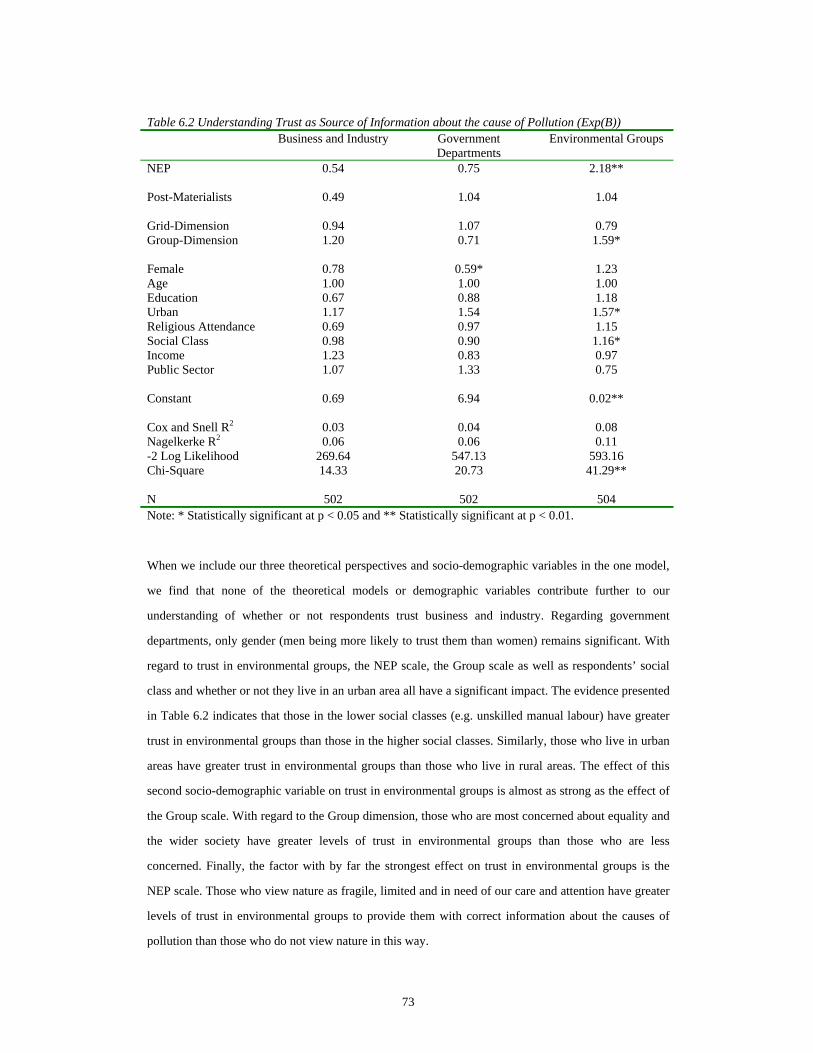
73
Table 6.2 Understanding Trust as Source of Information about the cause of Pollution (Exp(B)) Business and Industry Government
Departments Environmental Groups
NEP 0.54 0.75 2.18** Post-Materialists 0.49 1.04 1.04 Grid-Dimension 0.94 1.07 0.79 Group-Dimension 1.20 0.71 1.59* Female 0.78 0.59* 1.23 Age 1.00 1.00 1.00 Education 0.67 0.88 1.18 Urban 1.17 1.54 1.57* Religious Attendance 0.69 0.97 1.15 Social Class 0.98 0.90 1.16* Income 1.23 0.83 0.97 Public Sector 1.07 1.33 0.75 Constant 0.69 6.94 0.02** Cox and Snell R2 0.03 0.04 0.08 Nagelkerke R2 0.06 0.06 0.11 -2 Log Likelihood 269.64 547.13 593.16 Chi-Square 14.33 20.73 41.29** N 502 502 504 Note: * Statistically significant at p < 0.05 and ** Statistically significant at p < 0.01.
When we include our three theoretical perspectives and socio-demographic variables in the one model,
we find that none of the theoretical models or demographic variables contribute further to our
understanding of whether or not respondents trust business and industry. Regarding government
departments, only gender (men being more likely to trust them than women) remains significant. With
regard to trust in environmental groups, the NEP scale, the Group scale as well as respondents’ social
class and whether or not they live in an urban area all have a significant impact. The evidence presented
in Table 6.2 indicates that those in the lower social classes (e.g. unskilled manual labour) have greater
trust in environmental groups than those in the higher social classes. Similarly, those who live in urban
areas have greater trust in environmental groups than those who live in rural areas. The effect of this
second socio-demographic variable on trust in environmental groups is almost as strong as the effect of
the Group scale. With regard to the Group dimension, those who are most concerned about equality and
the wider society have greater levels of trust in environmental groups than those who are less
concerned. Finally, the factor with by far the strongest effect on trust in environmental groups is the
NEP scale. Those who view nature as fragile, limited and in need of our care and attention have greater
levels of trust in environmental groups to provide them with correct information about the causes of
pollution than those who do not view nature in this way.
74
6.2.5 Dealing with waste
The final set of attitudes that we consider are related to how best to deal with waste. In the self-
completion module of the ISPAS four items dealt with this topic. Two of these items refer to recycling
while the other two address the use of incinerators and the development of new landfill sites.
Interestingly, despite some very visible campaigns against the building of incinerators in Ireland, a
slightly larger percentage of respondents agreed that ‘using incinerators is the best way to dispose of
waste’ than disagreed. Landfills though are somewhat more popular than incinerators as just over 40
percent agree that ‘new landfill sites should be developed to dispose of waste’. However, the
percentages that agree with both of these methods are much smaller than those who favour recycling.
Large majorities of people state that they are willing to ‘pay more in order to recycle waste’ and believe
that the original manufacturer of the product should be responsible for recycling it.
Table 6.3 Understanding Attitudes to Dealing with Waste (Exp(B)) Incinerators Landfill Pay to Recycle Manufacturer
Recycle NEP 0.35** 0.68 2.19** 1.48 Post-Materialists 0.94 1.65 1.01 2.45 Grid-Dimension 1.20 2.03** 0.77 1.17 Group-Dimension 0.60* 0.69 1.28 1.41 Female 1.04 1.00 0.87 1.14 Age 1.02** 1.01 1.00 1.01 Education 1.00 0.78 1.11 0.93 Urban 1.16 1.64* 0.79 1.02 Religious Attendance 0.80 1.38 1.60 1.57 Social Class 0.97 1.01 0.86 1.02 Income 0.88 0.90 0.98 0.76 Public Sector 0.80 1.91* 0.84 0.85 Constant 81.50** 1.45 0.33 0.22 Cox and Snell R2 0.13 0.13 0.05 0.07 Nagelkerke R2 0.18 0.18 0.09 0.10 -2 Log Likelihood 466.41 495.63 375.82 423.05 Chi-Square 53.97** 57.07** 23.53* 29.55** N 376 403 451 432 Note: * Statistically significant at p < 0.05 and ** Statistically significant at p < 0.01.
The NEP scale, Group scale and age help us to understand differences in people’s attitudes to
incinerators. The evidence presented in Table 6.3 suggests that older respondents are more likely to
agree that incinerators are the best way to dispose of waste than younger respondents. On the other
hand, those who are concerned about society and inequality as well as those who regard nature as
75
fragile, limited and in need of our care and attention are more likely than their counterparts to disagree
with this view of incinerators. Of the two theoretical perspectives, the results suggest that the NEP scale
has the stronger impact on differences in people’s attitudes to incinerators.
When it comes to attitudes to developing new landfill sites, the NEP does not have a significant effect.
Instead, the factors that help us to understand differences in people’s attitudes to new landfill sites are
the Grid scale, whether or not the respondent lives in an urban area and whether or not they work in the
public sector. With regard to the socio-demographic variables, those who live in urban areas and those
who work in the public sector are more likely than their counterparts to agree with the development of
landfill sites to deal with the waste problem. That said, the strongest effect on differences between
people’s attitudes to the development of new landfill sites is whether or not they have high or low-grid
scores. Those who are less critical of authority and more willing to rely on the word of experts (that is,
those with high-grid scores) are more likely to agree with the development of new landfill sites than
those who are more critical of authority (those with low-grid scores).
When we examine the two items that refer to recycling we find that of the three theoretical perspectives
and socio-demographic factors only the NEP scale has a significant effect on respondents’ attitudes to
paying more to recycle their waste. The various factors that we examine do not help us understand
differences in people’s attitudes as to whether or not they agree that it is up to the manufacturers of
consumer products to recycle them. With regard to people’s willingness to pay extra in order to recycle
their household waste, those who view nature as fragile, limited and in need of our care and attention
are more willing to do so than their counterparts. This result is similar to that found above where people
who see nature in this way are also more willing than their counterparts to take on the extra costs of
protecting the environment.
6.3 Environmental Behaviour
Above it was noted that Irish respondents to some degree feel that they can look after the environment
through their own actions. Here we consider whether or not Irish people do act in a manner that protects
the environment. As such we consider whether or not they have recycled, cut back on using their cars or
sought to promote the environment as a social and political issue.
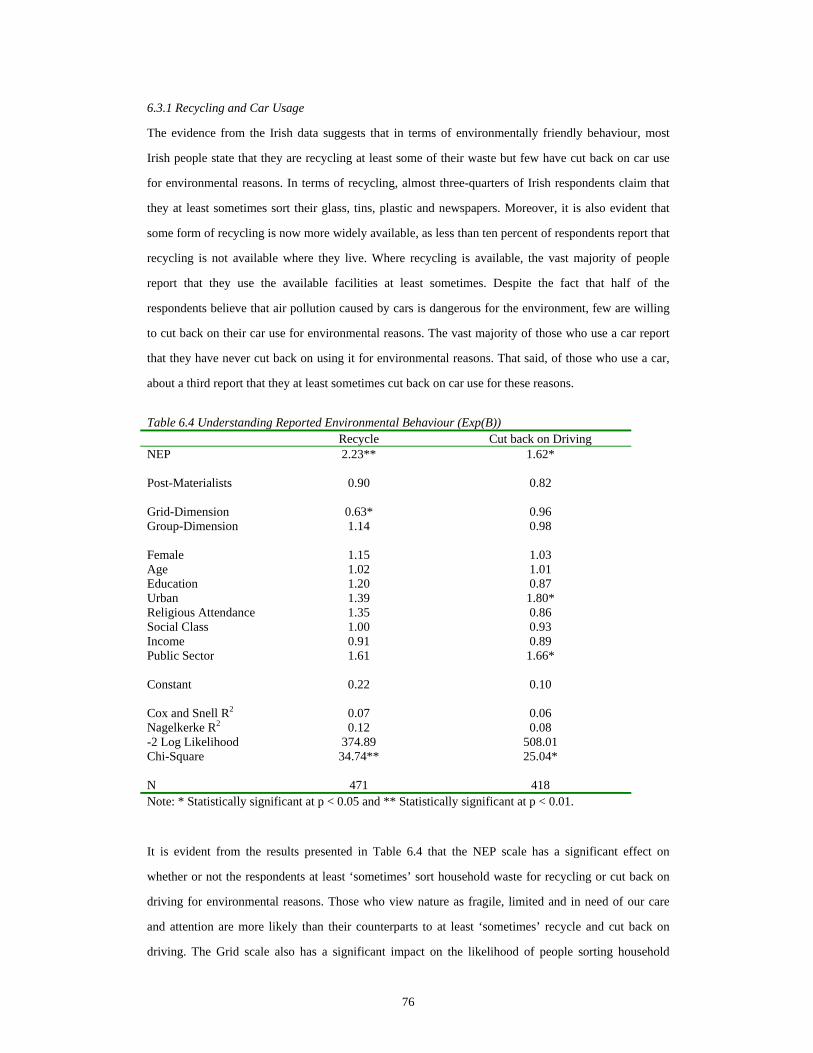
76
6.3.1 Recycling and Car Usage
The evidence from the Irish data suggests that in terms of environmentally friendly behaviour, most
Irish people state that they are recycling at least some of their waste but few have cut back on car use
for environmental reasons. In terms of recycling, almost three-quarters of Irish respondents claim that
they at least sometimes sort their glass, tins, plastic and newspapers. Moreover, it is also evident that
some form of recycling is now more widely available, as less than ten percent of respondents report that
recycling is not available where they live. Where recycling is available, the vast majority of people
report that they use the available facilities at least sometimes. Despite the fact that half of the
respondents believe that air pollution caused by cars is dangerous for the environment, few are willing
to cut back on their car use for environmental reasons. The vast majority of those who use a car report
that they have never cut back on using it for environmental reasons. That said, of those who use a car,
about a third report that they at least sometimes cut back on car use for these reasons.
Table 6.4 Understanding Reported Environmental Behaviour (Exp(B)) Recycle Cut back on Driving NEP 2.23** 1.62* Post-Materialists 0.90 0.82 Grid-Dimension 0.63* 0.96 Group-Dimension 1.14 0.98 Female 1.15 1.03 Age 1.02 1.01 Education 1.20 0.87 Urban 1.39 1.80* Religious Attendance 1.35 0.86 Social Class 1.00 0.93 Income 0.91 0.89 Public Sector 1.61 1.66* Constant 0.22 0.10 Cox and Snell R2 0.07 0.06 Nagelkerke R2 0.12 0.08 -2 Log Likelihood 374.89 508.01 Chi-Square 34.74** 25.04* N 471 418 Note: * Statistically significant at p < 0.05 and ** Statistically significant at p < 0.01.
It is evident from the results presented in Table 6.4 that the NEP scale has a significant effect on
whether or not the respondents at least ‘sometimes’ sort household waste for recycling or cut back on
driving for environmental reasons. Those who view nature as fragile, limited and in need of our care
and attention are more likely than their counterparts to at least ‘sometimes’ recycle and cut back on
driving. The Grid scale also has a significant impact on the likelihood of people sorting household
77
waste for recycling. Those who are more willing to be critical of authority and to rely on their own
decision-making resources are more likely than their counterparts to recycle at least ‘sometimes’. With
regard to cutting back on car use for environmental reasons, although the effect of the NEP scale is
significant, it does not have the strongest impact on differences in the likelihood of people cutting back
on driving. The factor that has the strongest impact on this behaviour is whether or not the respondent
lives in an urban area. Not surprisingly, given the greater access to public transport, those living in
urban areas are more likely than those living in rural areas to cut back on car use. The other variable
that has a significant effect, which is also greater than the impact of the NEP scale, is whether or not the
respondent works in the public sector. Those who work in the public sector are more likely than those
who work in the private sector to at least ‘sometimes’ cut back on driving. One might suspect that this
is because public sector workers live in urban areas; however there is a very low correlation between
whether or not respondents live in urban areas and whether or not they work in the public sector.
6.3.2 Promoting the environment as an issue
Finally, we consider behaviour by the respondents that is targeted at policy makers. There is a variety of
activities considered, from indirect action such as petition signing and giving money to environmental
groups, to more direct forms of action such as joining a group whose main aim is to preserve or protect
the environment, and participating in protests or demonstrations. It is quite clear from the evidence
present in Chapter 2 that Irish people are not actively involved in the more direct methods of targeting
policy makers, as only a tiny percentage of respondents report that they are members of an
environmental group. A similarly small percentage of respondents claim to have protested about an
environmental issue. There appears, however, to be a greater willingness among at least a fifth of Irish
people to provide support to those who are involved in these more direct forms of action. A quarter of
respondents have signed a petition while one in five have given money to an environmental group. Of
those who reported either giving money to an environmental group or signing a petition, just over 40
percent reported doing both. So, while there appears to be a reluctance to take an active part, a notable
minority of people are willing to provide support, at least at arm’s-length.
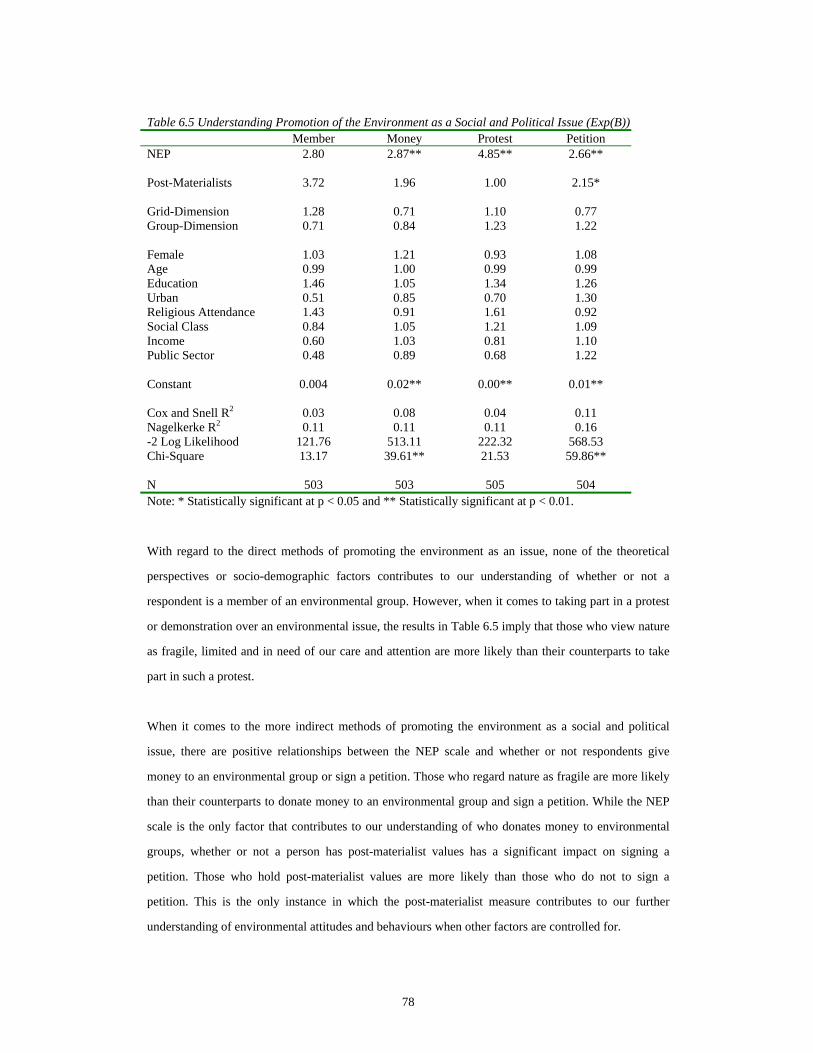
78
Table 6.5 Understanding Promotion of the Environment as a Social and Political Issue (Exp(B)) Member Money Protest Petition NEP 2.80 2.87** 4.85** 2.66** Post-Materialists 3.72 1.96 1.00 2.15* Grid-Dimension 1.28 0.71 1.10 0.77 Group-Dimension 0.71 0.84 1.23 1.22 Female 1.03 1.21 0.93 1.08 Age 0.99 1.00 0.99 0.99 Education 1.46 1.05 1.34 1.26 Urban 0.51 0.85 0.70 1.30 Religious Attendance 1.43 0.91 1.61 0.92 Social Class 0.84 1.05 1.21 1.09 Income 0.60 1.03 0.81 1.10 Public Sector 0.48 0.89 0.68 1.22 Constant 0.004 0.02** 0.00** 0.01** Cox and Snell R2 0.03 0.08 0.04 0.11 Nagelkerke R2 0.11 0.11 0.11 0.16 -2 Log Likelihood 121.76 513.11 222.32 568.53 Chi-Square 13.17 39.61** 21.53 59.86** N 503 503 505 504 Note: * Statistically significant at p < 0.05 and ** Statistically significant at p < 0.01.
With regard to the direct methods of promoting the environment as an issue, none of the theoretical
perspectives or socio-demographic factors contributes to our understanding of whether or not a
respondent is a member of an environmental group. However, when it comes to taking part in a protest
or demonstration over an environmental issue, the results in Table 6.5 imply that those who view nature
as fragile, limited and in need of our care and attention are more likely than their counterparts to take
part in such a protest.
When it comes to the more indirect methods of promoting the environment as a social and political
issue, there are positive relationships between the NEP scale and whether or not respondents give
money to an environmental group or sign a petition. Those who regard nature as fragile are more likely
than their counterparts to donate money to an environmental group and sign a petition. While the NEP
scale is the only factor that contributes to our understanding of who donates money to environmental
groups, whether or not a person has post-materialist values has a significant impact on signing a
petition. Those who hold post-materialist values are more likely than those who do not to sign a
petition. This is the only instance in which the post-materialist measure contributes to our further
understanding of environmental attitudes and behaviours when other factors are controlled for.
79
6.4 Conclusion
Up until this chapter we had examined each theoretical model and the socio-demographic variables that
were intended to help us explore and understand differences in people’s environmental attitudes and
behaviours in isolation from one another. In Chapter 2 we examined the impact that a variety of socio-
demographic variables had on such differences and in Chapter 3-5 we examined in turn the impact of
our three theoretical perspectives, the New Environmental Paradigm, Post-Materialism and Grid-Group
Theory (or Cultural Values Theory). It became evident that the set of socio-demographic factors and the
NEP scale that we propose contributed most to our understanding. That said, while post-materialism
appears to have little to contribute, the Grid and Group scales do have something to tell us. In this
chapter all of these sets of factors were included together in the analysis.
It is quite clear from the above that the NEP scale is the most important factor as it has a significant
impact in eleven of our sixteen sets of environmental attitudes and behaviours. In only two cases does
the NEP scale not have a significant impact when other factors do (i.e. trust in government departments
and attitudes towards the development of new landfill sites). The other theoretical perspectives are not
quite as helpful. However, the Grid scale has a significant impact in three instances, while the Group
scale has a significant impact in one. That said, both Grid and Group scales combined have a significant
impact on people’s perceptions of the dangers posed to the environment by a variety of threats. The
combination of both high-grid and high-group in relation to perceptions of environmental dangers
suggests that those who adhere to a ‘hierarchical’ cultural bias perceive greater dangers than those who
adhere to any of the other cultural biases. Post-materialism, as we have already seen, is not particularly
helpful, and only has a significant impact on whether or not a person signs a petition. The variables that
we include in the multivariate analysis do not have statistically significant impacts on trust in business
and industry, attitudes to the responsibilities of manufacturers to recycling the goods they produce, or
whether or not a respondent is a member of an environmental group.

80
81
Chapter 7
Environmental Values, Attitudes and Behaviours in Ireland: Some Conclusions
7.1 Introduction
So what have we learnt about Irish people’s environmental attitudes and behaviours and the cultural
sources of support on which they draw? In order to address this question we firstly review what we
know about respondents’ environmental attitudes and behaviours. Then we consider the three
theoretical perspectives and the degree to which they contribute to our understanding of differences in
people’s attitudes and behaviours. Drawing on these findings we then identify and examine those
broader cultural values on which environmentalism draws. Finally, we suggest some possible policy
implications.
7.2 Differing Attitudes and Behaviours
In this research project we consider a wide variety of environmental attitudes and behaviours. We began
by considering how dangerous Irish people perceived a variety of threats to be for the environment. The
evidence suggests that Irish respondents are deeply concerned about such threats. In particular, they are
convinced about the dangers posed to the environment by nuclear power stations, water pollution, air
pollution caused both by cars and industry, the ‘greenhouse effect’ and the use of pesticides and
chemicals in farming. In the case of each of these, less than ten percent of respondents believe that they
are ‘not very dangerous’ or ‘not dangerous at all’ for the environment. Regarding attitudes to protecting
the environment, there is a greater willingness to pay higher prices (53 percent) than pay higher taxes
(34 percent). On the question of environmental efficacy, there is an almost even divide between those
who are optimistic about the effect of their own actions to protect the environment and those who are
more pessimistic. With regard to how much trust people have in a number of institutions to provide
them with correct information about the causes of pollution, of the three groups considered in detail in
this report, the most trusted source of information is environmental groups (though it should be
remembered that university research centres are trusted by the largest percentage of people). When it
comes to government departments, a similar percentage of people have a strong sense of trust as have a
weak sense of trust. Industry and business stand out as the least trusted source of information as less
than 10 percent of respondents feel a strong sense of trust in business and industry.
82
Finally, we asked people about four ways of dealing with waste. Two of these items deal with recycling
while the other two address the use of incinerators and the development of new landfill sites. Large
majorities agree with the idea of paying ‘more in order to recycle waste’ and believe that the original
manufacturer of the product should be responsible for recycling it. Interestingly, despite some very
visible campaigns against the building of incinerators in Ireland, the percentage of respondents who
agree that ‘using incinerators is the best way to dispose of waste’ (40 percent) is slightly greater than
the percentage that disagree with this idea. The development of new landfills meets with only slightly
more approval than incinerators, 43 percent agreeing that ‘new landfill sites should be developed to
dispose of waste’.
Once we had considered people’s attitudes to the environment we asked them about their own
behaviour. The first two behavioural items asked about sorting household waste for recycling and how
often they cut back on car use for environmental reasons. The evidence suggests that recycling facilities
are now more widely available, as less than ten percent of respondents report that no such facilities are
available where they live. Where they are available, almost three-quarters of the respondents claim that
they at least sometimes sort through glass, tins, plastic and newspapers. However, despite the fact that
half of the respondents believe that air pollution caused by cars is dangerous for the environment, few
are willing to cut back on their car use for environmental reasons. The majority of those who use a car
report that they have never cut back on using it for environmental reasons, with about a third reporting
that they have at least sometimes done so.
We also asked respondents about their activities to promote the environment as a social and political
issue. Again there is an important difference between ‘doing your own bit’ and supporting others ‘doing
their bit’. It is quite clear from the evidence we present that few Irish people are actively involved in the
more direct forms of activities intended to promote the environment as a social and political issue. Only
a tiny percentage of respondents (4 percent) report that they are members of an environmental group
and a similarly small percentage of respondents (5 percent) claim to have protested about an
environmental issue. However, there appears to be a willingness among Irish people to provide support
to those who are involved in these more direct forms of action. A quarter of respondents have signed a
petition, while a fifth have given money to an environmental group. Of those who reported giving
money to an environmental group or signing a petition, just over forty per cent reported doing both. So,
while there appears to be a reluctance to take an active part, a notable minority of people are willing to
provide support, at least at arm’s-length.
83
7.3 Socio-Demographic and Cultural Sources of Differing Environmental Attitudes and
Behaviours
In this project we not only identified the differences that exist between people’s environmental attitudes
and behaviours, but also set out to explore some of the socio-demographic and cultural sources of
support for these differences. Of the various socio-demographic variables considered (gender, age,
education, residence, religious attendance, social class, income and employment in the public sector),
education proved to be the most powerful predictor of pro-environmental attitudes, with high incomes
and social class also predictive in this direction.
In Ireland, as in other countries, socio-demographic variables do not explain much of the variance in
environmental attitudes and behaviours. It was found that in all but one case, environmental efficacy,
less than ten percent of the variance was explained by all of the socio-demographic variables together.
We also explored whether broader sets of cultural values might be identified which could be shown to
contribute to environmental concerns and practices. The ISSP Environmental module proposed three
theoretical frameworks.
The first, the New Environmental Paradigm (NEP), examines a set of broad cultural values regarding
nature, the environment and socio-economic change. It proposes that there has been increasing concern
in developed western economies regarding the impact of economic development on what is seen as a
fragile environment and a nature that needs care rather than reckless exploitation and domination. We
found that in Ireland, as in other countries, the great majority of people are favourably disposed towards
this view. Those most strongly supportive are the young and those with higher levels of education.
People with strong NEP values are more likely than others to express concern about environmental risks
and dangers and to be willing to pay for protecting the environment. They have a sense of
environmental efficacy (that their actions on behalf of the environment can be significant), they trust the
information on pollution provided by environmental groups, and they are more likely than others to
give money and sign petitions to promote environmental issues. They have a strong preference for
recycling, and are more likely to recycle and cut back on driving than other groups. They have a strong
dislike of landfill and incineration. Certainly the NEP would appear to be a major cultural value system
around which pro-environmental sentiment is mobilising.
84
In contrast, post-materialism as a set of cultural values does not appear to be a potent cultural resource.
Only a small percentage (9 percent) hold post-material values, with most respondents holding mixed
materialist and post-materialist views. Post-materialists are younger. The watershed for the
development of these values in Ireland is the early 1970s rather than the immediate years after the
Second World War as Inglehart suggests for other nations. However holding post-materialist values was
not found to be significantly correlated with any of the pro-environmental attitudes that we explored.
The only pro-environmental behaviours with which it was significantly related were signing a petition
or donating money to an environmental group.
The research findings regarding the Cultural Values or Grid-Group paradigm are of considerable
interest. The values explored using this perspective are broader socio-political cultural values. The
items do not refer to the environmental in the same way as the items used to construct the NEP scale.
The initial approach that we took, an attempt to identify the four cultural biases of hierarchy,
egalitarianism, individualism and fatalism, using the battery of items provided in the ISSP
Environmental module (E27), did not prove to be very reliable. We therefore decided to identify each
dimension, Grid and Group, separately. This proved more successful, both in terms of developing scales
and in the significant correlations to environmental attitudes and behaviours found. Although the
amount of variance explained is relatively small, a consistent pattern emerges, and is in the direction
that Cultural Theory would lead us to expect.
A strong sense of egalitarianism, and an approval of collective political action to redistribute income
more equitably (Group variable), is related to heightened concerns regarding a range of environmental
threats. When there is a strong ‘egalitarian cultural bias’ there tends to be a high level of trust in the
information provided by environmental groups. Some cultural theorists have thus argued that
environmentalism can be interpreted as a cultural and symbolic stick whereby egalitarians can criticise
and beat a government that they see as supporters of an inequitable and unjust society. Thus Wildavsky
and Dake (1990, p.56) argue that, in the USA, nuclear energy became ‘a surrogate issue for more
fundamental criticism of US institutions’.
A questioning attitude to authority and a strong sense of personal and political efficacy (Grid variable)
was also found to contribute to pro-environmental mobilisation. These values are related to an increased
willingness to pay for protecting the environment, to practice recycling and cutting back on driving, and
to supporting environmental activism by giving money to environmental groups and signing petitions.
85
Again drawing on Cultural Theory’s ‘cultural biases’, it is those who draw on a ‘fatalist bias’, which
combined a lack of concern about equality with an acceptance of hierarchy and authority, who most
favoured using incineration as a method of disposing of waste.
To conclude, this research has identified three sets of broadly based cultural values that contribute to
environmentalism in Ireland. One is the NEP in which there is a deep concern for the fragility of nature
and for the need to protect it, particularly from possible over-exploitation and destruction due to rapid
economic and social change. A second is egalitarianism, which expresses a concern for society’s
unequal structures and the need for collective political efforts to change this. The third is a set of values
around empowerment, including a sense of efficacy in bringing about change, and criticism of
authoritarian hierarchical structures.
7.4 What can we do?
It is perhaps somewhat premature to outline some of the policy implications of this report, given that a
further quantitative report comparing Irish and European values remains to be done, and, perhaps even
more pertinent, the qualitative research on environmental discourses, based on data from 21 focus group
discussions with both the general public and ‘accredited’ environmental experts also remains to be
completed (both are due in February 2004). Nevertheless, some policy indications might be noted on
three fronts.
Regarding environmental charges and taxes (waste charges and carbon taxes are both high on the
political agenda at present), two factors might be noted. Firstly, there is a greater willingness to pay the
cost of environmental protection if it is not imposed on all, such as a tax, but instead there is some
element of choice, as in the plastic bag levy. Furthermore, relating environmental charges and taxes to
the ability to pay, will draw on that egalitarianism which is supportive of environmentalism and which
is also particularly prevalent among those with lower incomes.
Regarding mobilisation of the public to care for the environment, the longer-term role of a critical and
liberal education should be noted, as well as the role of empowerment of individuals and communities
in order to support and develop a sense of socio-political efficacy. This latter aspect may be
strengthened through the continuation, and further development, of partnerships within and between
communities, interest groups, environmental groups and decision-makers. Of course, sufficient support
86
for such partnership must be forthcoming from decision-makers to ensure that efforts (frequently
voluntary) are repaid by implementing negotiated partnership decisions.
Finally, the success of pro-environmental information campaigns would be increased by focusing not
only on the information being communicated, but by drawing on the core cultural values which are
supportive of pro-environmental attitudes and behaviours.

87

88
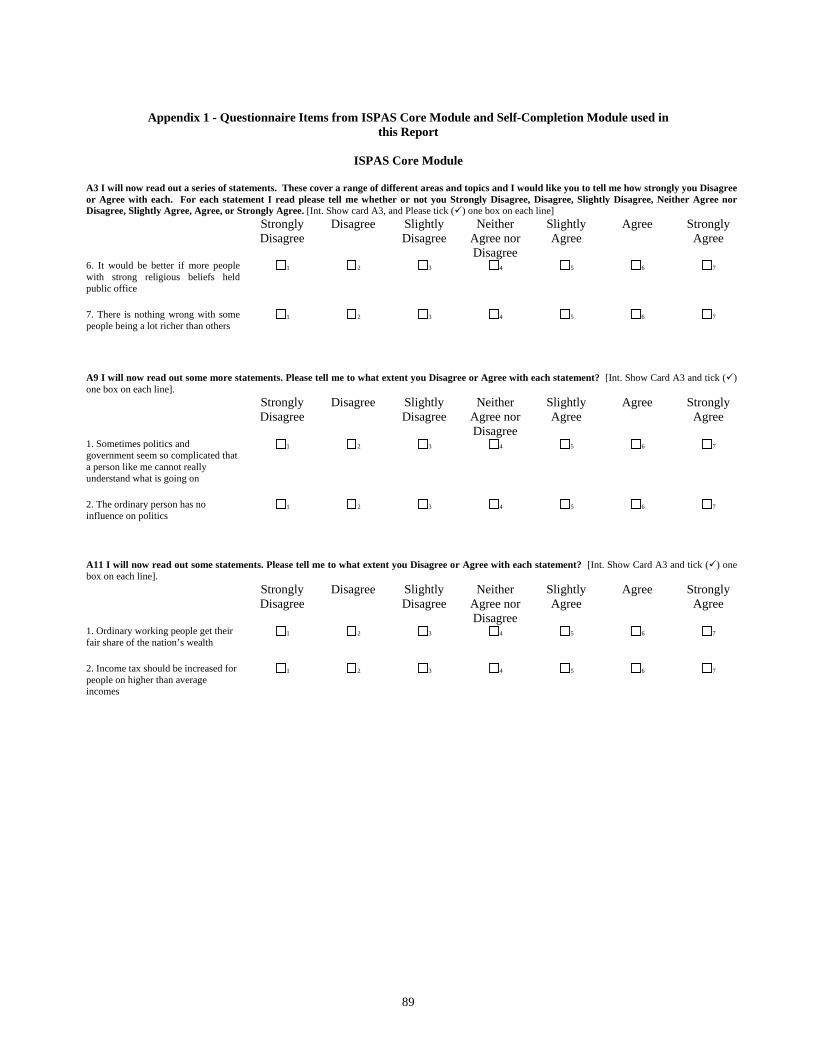
89
Appendix 1 - Questionnaire Items from ISPAS Core Module and Self-Completion Module used in
this Report
ISPAS Core Module
A3 I will now read out a series of statements. These cover a range of different areas and topics and I would like you to tell me how strongly you Disagree or Agree with each. For each statement I read please tell me whether or not you Strongly Disagree, Disagree, Slightly Disagree, Neither Agree nor Disagree, Slightly Agree, Agree, or Strongly Agree. [Int. Show card A3, and Please tick ( ) one box on each line] Strongly
Disagree Disagree Slightly
Disagree Neither
Agree nor Disagree
Slightly Agree
Agree Strongly Agree
6. It would be better if more people with strong religious beliefs held public office
1 2 3 4 5 6 7
7. There is nothing wrong with some people being a lot richer than others
1 2 3 4 5 6 7
A9 I will now read out some more statements. Please tell me to what extent you Disagree or Agree with each statement? [Int. Show Card A3 and tick ( ) one box on each line]. Strongly
Disagree Disagree Slightly
Disagree Neither
Agree nor Disagree
Slightly Agree
Agree Strongly Agree
1. Sometimes politics and government seem so complicated that a person like me cannot really understand what is going on
1 2 3 4 5 6 7
2. The ordinary person has no influence on politics
1 2 3 4 5 6 7
A11 I will now read out some statements. Please tell me to what extent you Disagree or Agree with each statement? [Int. Show Card A3 and tick ( ) one box on each line]. Strongly
Disagree Disagree Slightly
Disagree Neither
Agree nor Disagree
Slightly Agree
Agree Strongly Agree
1. Ordinary working people get their fair share of the nation’s wealth
1 2 3 4 5 6 7
2. Income tax should be increased for people on higher than average incomes
1 2 3 4 5 6 7
90
Self-Completion Questionnaire
The Economic and Social Research Institute
4 Burlington Road Dublin 4 Ph. 6671525
IRISH SOCIAL ATTITUDES SURVEY, WINTER 2001/2002
Interviewer’s Number Area Code Respondent Code Date of Interview: Day Month
Self-Completion Questionnaire
Thank you for having completed the Irish Social and Political Attitudes Survey, 2001. We would now ask you to please complete this final section of the questionnaire and return it, as soon as possible, in the pre-paid envelope provided to The Economic and Social Research Institute.
Most questions will require you to put a tick (4) in a single box or series of boxes. For example:
Male Female
Please complete using a blue or black pen and mark your answers as clearly as possible. Only you should fill in the questionnaire, and not anyone else at your address. ALL ANSWERS WILL BE TREATED AS STRICTLY CONFIDENTIAL.
EVERYONE WHO COMPLETES AND RETURNS THIS FINAL SECTION OF THE QUESTIONNAIRE WILL BE ENTERED INTO A LOTTERY, WITH A FIRST PRIZE OF £1,000; A SECOND PRIZE OF £500; FOUR £100 PRIZES; AND FOUR £50 PRIZES. MANY THANKS FOR YOUR HELP!
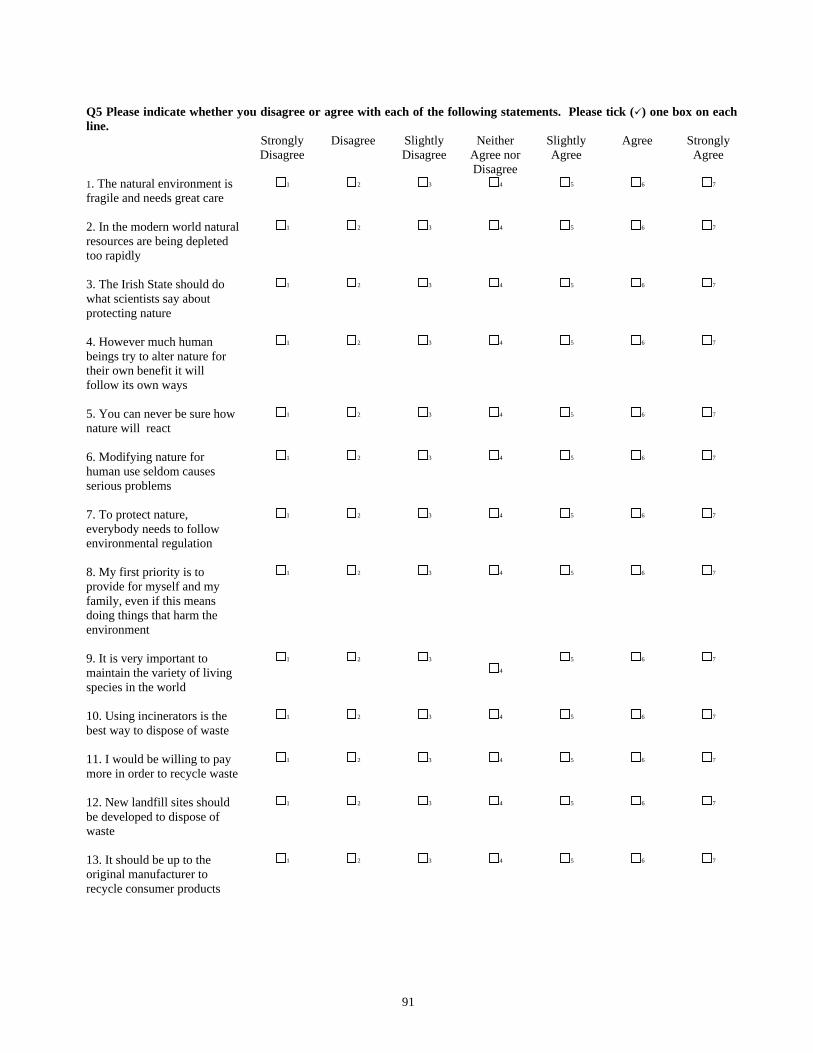
91
Q5 Please indicate whether you disagree or agree with each of the following statements. Please tick ( ) one box on each line. Strongly
Disagree Disagree Slightly
Disagree Neither
Agree nor Disagree
Slightly Agree
Agree Strongly Agree
1. The natural environment is fragile and needs great care
1 2 3 4 5 6 7
2. In the modern world natural resources are being depleted too rapidly
1 2 3 4 5 6 7
3. The Irish State should do what scientists say about protecting nature
1 2 3 4 5 6 7
4. However much human beings try to alter nature for their own benefit it will follow its own ways
1 2 3 4 5 6 7
5. You can never be sure how nature will react
1 2 3 4 5 6 7
6. Modifying nature for human use seldom causes serious problems
1 2 3 4 5 6 7
7. To protect nature, everybody needs to follow environmental regulation
1 2 3 4 5 6 7
8. My first priority is to provide for myself and my family, even if this means doing things that harm the environment
1 2 3 4 5 6 7
9. It is very important to maintain the variety of living species in the world
1 2 3 4
5 6 7
10. Using incinerators is the best way to dispose of waste
1 2 3 4 5 6 7
11. I would be willing to pay more in order to recycle waste
1 2 3 4 5 6 7
12. New landfill sites should be developed to dispose of waste
1 2 3 4 5 6 7
13. It should be up to the original manufacturer to recycle consumer products
1 2 3 4 5 6 7

92
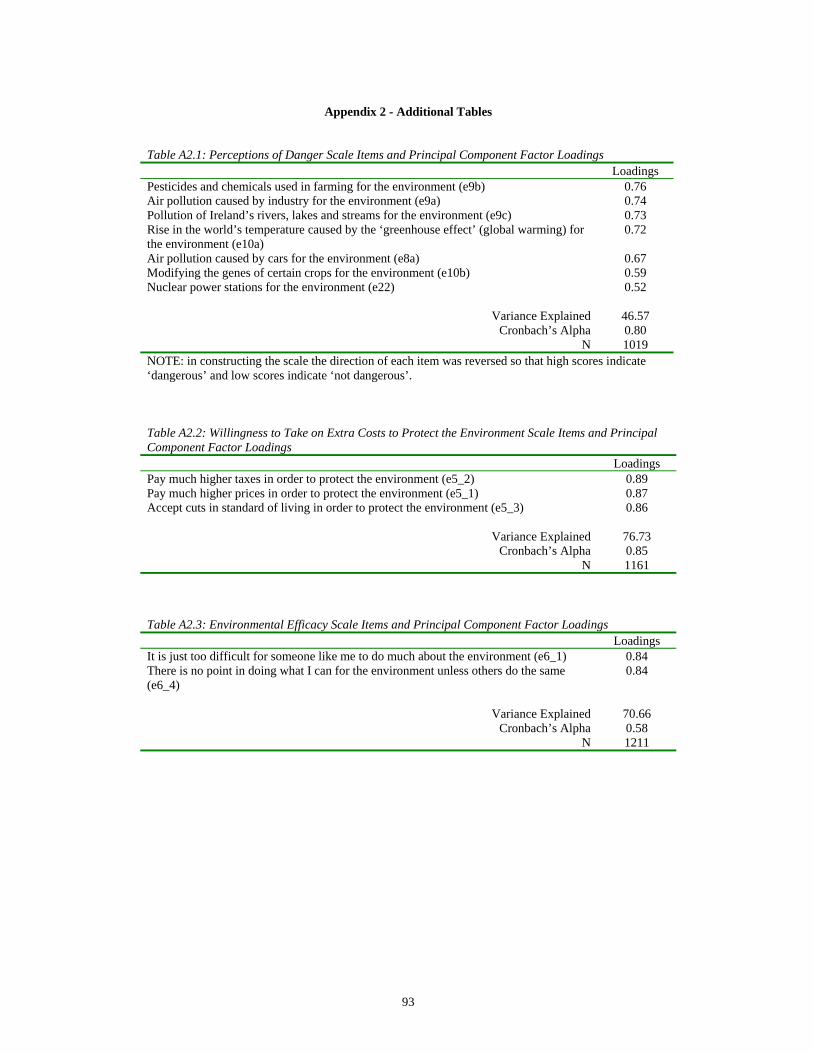
93
Appendix 2 - Additional Tables
Table A2.1: Perceptions of Danger Scale Items and Principal Component Factor Loadings Loadings Pesticides and chemicals used in farming for the environment (e9b) 0.76 Air pollution caused by industry for the environment (e9a) 0.74 Pollution of Ireland’s rivers, lakes and streams for the environment (e9c) 0.73 Rise in the world’s temperature caused by the ‘greenhouse effect’ (global warming) for the environment (e10a)
0.72
Air pollution caused by cars for the environment (e8a) 0.67 Modifying the genes of certain crops for the environment (e10b) 0.59 Nuclear power stations for the environment (e22) 0.52
Variance Explained 46.57 Cronbach’s Alpha 0.80
N 1019 NOTE: in constructing the scale the direction of each item was reversed so that high scores indicate ‘dangerous’ and low scores indicate ‘not dangerous’. Table A2.2: Willingness to Take on Extra Costs to Protect the Environment Scale Items and Principal Component Factor Loadings Loadings Pay much higher taxes in order to protect the environment (e5_2) 0.89 Pay much higher prices in order to protect the environment (e5_1) 0.87 Accept cuts in standard of living in order to protect the environment (e5_3) 0.86
Variance Explained 76.73 Cronbach’s Alpha 0.85
N 1161 Table A2.3: Environmental Efficacy Scale Items and Principal Component Factor Loadings Loadings It is just too difficult for someone like me to do much about the environment (e6_1) 0.84 There is no point in doing what I can for the environment unless others do the same (e6_4)
0.84
Variance Explained 70.66
Cronbach’s Alpha 0.58 N 1211
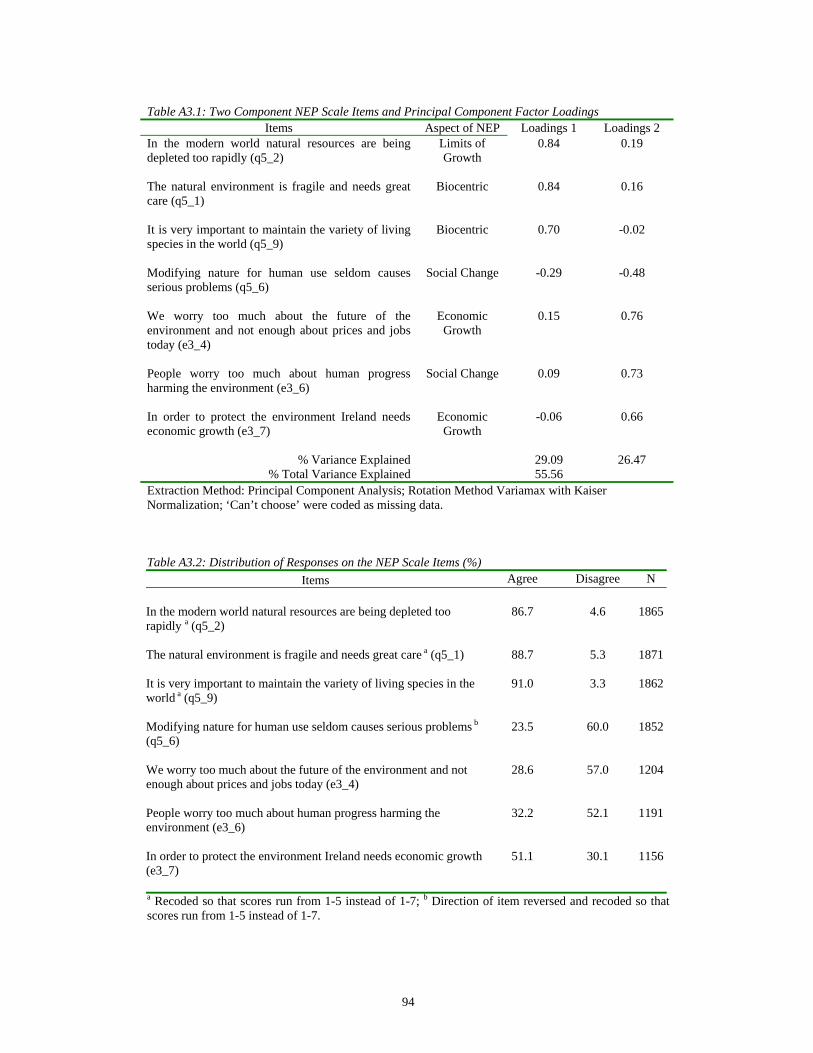
94
Table A3.1: Two Component NEP Scale Items and Principal Component Factor Loadings
Items Aspect of NEP Loadings 1 Loadings 2 In the modern world natural resources are being depleted too rapidly (q5_2)
Limits of Growth
0.84 0.19
The natural environment is fragile and needs great care (q5_1)
Biocentric 0.84 0.16
It is very important to maintain the variety of living species in the world (q5_9)
Biocentric 0.70 -0.02
Modifying nature for human use seldom causes serious problems (q5_6)
Social Change -0.29 -0.48
We worry too much about the future of the environment and not enough about prices and jobs today (e3_4)
Economic Growth
0.15 0.76
People worry too much about human progress harming the environment (e3_6)
Social Change 0.09 0.73
In order to protect the environment Ireland needs economic growth (e3_7)
Economic Growth
-0.06 0.66
% Variance Explained 29.09 26.47
% Total Variance Explained 55.56 Extraction Method: Principal Component Analysis; Rotation Method Variamax with Kaiser Normalization; ‘Can’t choose’ were coded as missing data. Table A3.2: Distribution of Responses on the NEP Scale Items (%)
Items Agree Disagree N In the modern world natural resources are being depleted too rapidly a (q5_2)
86.7 4.6 1865
The natural environment is fragile and needs great care a (q5_1)
88.7 5.3 1871
It is very important to maintain the variety of living species in the world a (q5_9)
91.0 3.3 1862
Modifying nature for human use seldom causes serious problems b (q5_6)
23.5 60.0 1852
We worry too much about the future of the environment and not enough about prices and jobs today (e3_4)
28.6 57.0 1204
People worry too much about human progress harming the environment (e3_6)
32.2 52.1 1191
In order to protect the environment Ireland needs economic growth (e3_7)
51.1 30.1 1156
a Recoded so that scores run from 1-5 instead of 1-7; b Direction of item reversed and recoded so that scores run from 1-5 instead of 1-7.
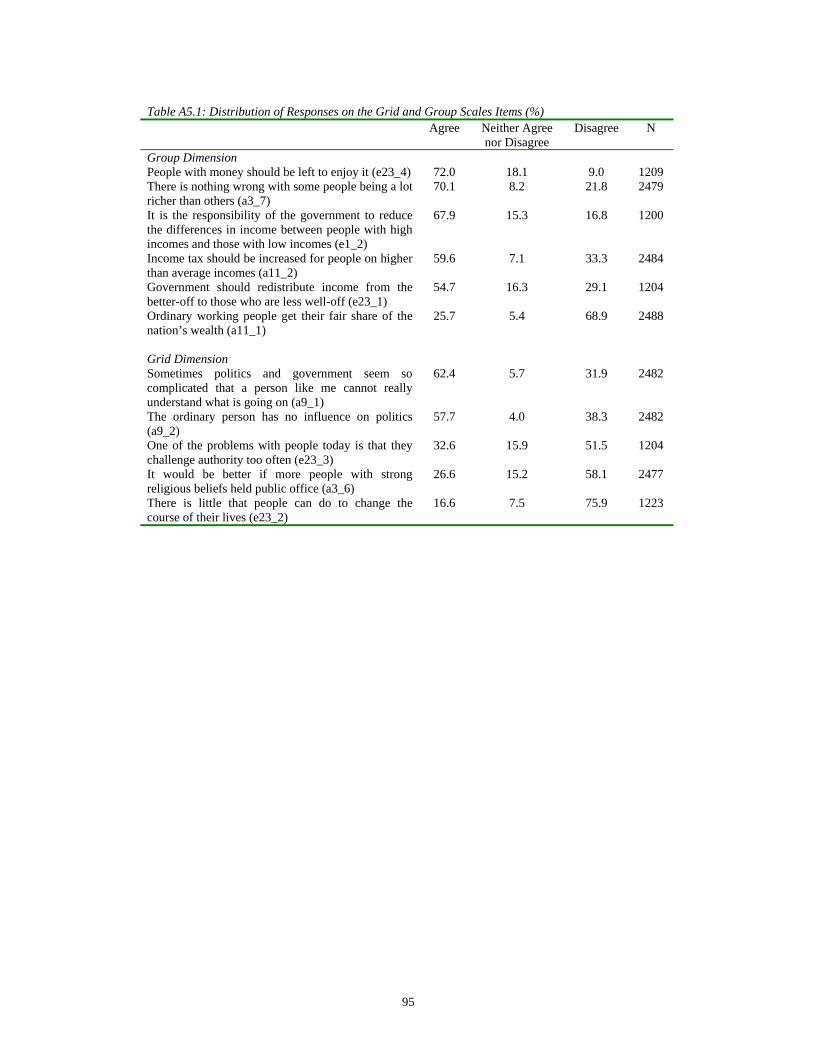
95
Table A5.1: Distribution of Responses on the Grid and Group Scales Items (%) Agree Neither Agree
nor Disagree Disagree N
Group Dimension People with money should be left to enjoy it (e23_4) 72.0 18.1 9.0 1209 There is nothing wrong with some people being a lot richer than others (a3_7)
70.1 8.2 21.8 2479
It is the responsibility of the government to reduce the differences in income between people with high incomes and those with low incomes (e1_2)
67.9 15.3 16.8 1200
Income tax should be increased for people on higher than average incomes (a11_2)
59.6 7.1 33.3 2484
Government should redistribute income from the better-off to those who are less well-off (e23_1)
54.7 16.3 29.1 1204
Ordinary working people get their fair share of the nation’s wealth (a11_1)
25.7 5.4 68.9 2488
Grid Dimension Sometimes politics and government seem so complicated that a person like me cannot really understand what is going on (a9_1)
62.4 5.7 31.9 2482
The ordinary person has no influence on politics (a9_2)
57.7 4.0 38.3 2482
One of the problems with people today is that they challenge authority too often (e23_3)
32.6 15.9 51.5 1204
It would be better if more people with strong religious beliefs held public office (a3_6)
26.6 15.2 58.1 2477
There is little that people can do to change the course of their lives (e23_2)
16.6 7.5 75.9 1223

96
97
References
Abramson, P.A. and R. Inglehart (1992) ‘Generational replacement and value change in eight West European societies’, British Journal of Political Science, Vol.22, pp183-228. Albrecht, D., G. Bultena, E. Hoiberg and P. Novak (1982) ‘The New Environmental Paradigm Scale’, Journal of Environmental Education, Vol.13, pp39-43. Bagozzi, R.P., Z. Gurhan-Canli and J.R. Priester (2002) The Social Psychology of Consumer Behaviour, Buckingham: Open University Press. Bryson, C. and J. Curtice (1998) ‘The end of materialism?’ in R. Jowell et al (eds.), British – and European – Social Attitudes, the 15th BSA Report, Aldershot: Ashgate. Buttel, F. (1979) ‘Age and environmental concern: a multivariate analysis’, Youth and Society, Vol.10, pp237-256. Clarke, H.D. and N. Dutt (1991) ‘Measuring value change in western industrialised societies’, American Political Science Review, Vol.85, pp905-920. Coughlin, R.M. and C. Lockhart (1998) ‘Grid-Group Theory and political ideology: a consideration of their relative strengths and weaknesses for explaining the structure of mass belief systems’, Journal of Theoretical Politics, Vol.10 (1), pp35-58. Dalton, R.J. (1994) The Green Rainbow: Environmental Interest Groups in Western Europe, New Haven: Yale University Press. Dalton, R.J. (1996) Citizen Politics, 2nd Edition, Chatham: Chatham House Publications. Dalton, R.J. and R. Rohrschneider (1998) ‘The Greening of Europe’, in R. Jowell et al (eds.), British – and European – Social Attitudes, the 15th BSA Report, Aldershot: Ashgate. Deth, J.W. van and E. Scarbrough (1995) ‘The concept of values’, in J.W. van Deth and E. Scarbrough (eds.) The Impact of Values, Oxford: Oxford University Press. Dietz, T., P.C. Stern and G.A. Guagnano (1998) ‘Social structural and social psychological bases of environmental concern’, Environment and Behavior, Vol.30, pp450-471. Douglas, M. (1970) Natural Symbols: Explorations in Cosmology, London: Barrie and Rockliff. Douglas, M. (1982) ‘Cultural Bias’, in M. Douglas In The Active Voice, London: Routledge. Douglas, M. and A. Wildavsky (1982) Risk and Culture. An Essay on the Selection of Technical and Environmental Dangers, Berkley: University of California Press. Dunlap, R. and K. Van Liere (1978) ‘The New Environmental Paradigm’, The Journal of Environmental Education, Vol.9, pp10-19. Dunlap, R.E, K.D. Van Liere, A.G. Mertig and R.E. Jones (2000) ‘Measuring Endorsement of the New Ecological Paradigm: A Revised NEP Scale’, Journal of Social Issues, Vol.56, pp425-442. Edgell, M.C.R. and D.E. Nowell (1989) ‘The New Environmental Paradigm Scale: wildlife and environmental beliefs in British Columbia’, Society and Nature Resources, Vol.2, pp258-296. Ellis, R.J. and F. Thompson (1997) ‘Culture and the environment in the Pacific Northwest’, American Political Science Review, Vol.91 (4), pp885-897.
98
Ewert, A. and D. Baker (2001) ‘Standing for where you sit: an exploratory analysis of the relationship between academic major and environmental beliefs’, Environment and Behavior, Vol.33 (5), pp687-707. Faughnan, P. and B. McCabe (1998) Irish Citizens and the Environment: a cross national study of environmental attitudes, perceptions and behaviours, Wexford: EPA. Furman, A. (1998) ‘A note on environmental concern in a developing country: results from an Istanbul survey’, Environment and Behavior, Vol.30 (4), pp520-534. Geller, J. and P. Lasley (1985) ‘The New Environmental Paradigm scale: a re-examination’, Journal of Environmental Education, Vol.17, pp9-12. Grendstand, G. (2000) ‘Grid-Group Theory and political orientations: effects of cultural biases in Norway in the 1990s’, Scandinavian Political Studies, Vol.23 (3), pp217-244. Grendstad, G. (2003) ‘Comparing political orientations: Grid-Group Theory versus the Left-Right dimension in five Nordic countries’, European Journal of Political Research, Vol.42, pp1-21. Inglehart, R. (1977) The Silent Revolution: Changing Values and Political Styles, Princeton: Princeton University Press. Inglehart, R. (1981) ‘Post-materialism in an environment of insecurity’, American Political Science Review, Vol.75, pp880-900. Inglehart, R. (1984) ‘The changing structure of political cleavages in western society’, in R.J. Dalton, S.C. Flanagan and P.A. Beck (eds.), Electoral Change in Advanced Industrial Democracies: Realignment or Dealignment?, Princeton: Princeton University Press. Inglehart, R. (1990) Cultural Shift in Advanced Industrial Society, Princeton: Princeton University Press. Inglehart, R. (1995) ‘Public support for environmental protection: objective problems and subjective values in 43 countries’, PS: Political Science and Politics, Vol.28 (1), pp57-72. Inglehart, R. (1997) Modernization and Post-Modernization, Princeton: Princeton University Press. Inglehart, R. and P.A. Abramson (1994) ‘Economic security and value change’, American Political Science Review, Vol.88, pp336-354. Jarvis, L., A. Park and R. Jowell (1999) ‘ISSP 2000: Environment module draft questionnaire and commentary’, London: National Centre for Social Research. Jones, R.E. and R.E. Dunlap (1992) ‘The social bases of environmental concern: have they changed over time’, Rural Sociology, Vol.57 (1), pp28-47. Kim, J.-O. and C.W. Muller (1994a) ‘Introduction to factor analysis: what it does and how to do it’, in M.S. Lewis-Beck (ed.) Factor Analysis and Related Techniques, International Handbooks of Quantitative Applications in the Social Sciences, Vol.5, London: Sage Publications. Kim, J.-O. and C.W. Muller (1994b) ‘Factor analysis: statistical methods and practical issues’, in M.S. Lewis-Beck (ed.) Factor Analysis and Related Techniques, International Handbooks of Quantitative Applications in the Social Sciences, Vol.5, London: Sage Publications. Kriesi, H.P. (1989) ‘New social movements and the new class in the Netherlands’, American Journal of Sociology, Vol.94, pp1078-1116. Lijphart, A. (1981) ‘Political parties: ideologies and programs’, in D. Butler, H. Penniman and A. Ranney (eds.) Democracy at the Polls: A Comparative Study of Competitive National Elections, Washington DC: American Enterprise Institute.
99
Mohai, P. and B. Twight (1987) ‘Age and environmentalism: an elaboration of the Buttel model using national survey evidence’, Social Science Quarterly, Vol.68, pp798-815. Muller-Rommel, F (1985) ‘New social movements and smaller parties: a comparative perspective’, West European Politics, Vol.5, pp68-74. Muller-Rommel, F (1989) ‘The German Greens in the 1980s: short-term cyclical protest or indicator of transformation?’, Political Studies, Vol.37, pp114-122. Muller-Rommel, F. (1990) ‘New political movements and new politics parties in Western Europe’, in R.J. Dalton and M. Kuchler (eds.) Challenging the Political Order: New Social and Political Movements in Western Democracies, Oxford: Polity Press. Noe, F.P. and R. Snow (1990) ‘The New Environmental Paradigm and further scale analysis’, Journal of Environmental Education, Vol.21, pp20-26. Poguntke, T. (1987) ‘New politics and party systems: the emergence of a new type of party’, West European Politics, Vol.10, pp76-88. Prescott-Clarke, P. and A. Hedges (1987) Radioactive Waste Disposal: the Public’s View, London: SCPR. Rohrscheider, R. (1990) ‘The roots of public opinion towards New Social Movements: an empirical test of competing explanations’, American Journal of Political Science, Vol.34, pp1-30. Scarbrough, E. (1995) ‘Materialist – Post-Materialist Value Orientations’ in J.W. van Deth and E. Scarbrough (eds.) The Impact of Values, Oxford: Oxford University Press. Schultz, P.W., L. Zelezny and N.J. Dalrymple (2000) ‘A multinational perspective on the relation between Judeo-Christian religious beliefs and attitudes of environmental concern’, Environment and Behavior, Vol.32 (4), pp576-591. Schwartz, S.H. (1992) ‘Universals in the content and structure of values: theoretical advances and empirical tests in 20 countries’, in M.P. Zanna (ed.) Advances in Experimental Social Psychology, Vol.25, San Diego: Academic Press. Steg, L. and I. Sievers (2000) ‘Cultural Theory and individual perceptions of environmental risk’, Environment and Behavior, Vol.32 (2), pp250-269. Stern, P.C., T. Dietz and G.A. Guagnano (1995) ‘The New Ecological Paradigm in social-psychological context’ Environment and Behavior, Vol.27, pp723-743. Thompson, M., R. Ellis and A. Wildavsky (1990) Cultural Theory, Boulder: Westview Press. Vaughan, B. (2002) ‘Cultured punishments: the promise of Grid-Group Theory’, Theoretical Criminology, Vol.6 (4), pp411-431. Wildavsky, A. (1987) ‘Choosing preferences by constructing institutions: a cultural theory of preference formation’, American Political Science Review, Vol.81 (1), pp3-21. Wildavsky, A. and K. Dake (1990) ‘Theories of risk perception: who fears what and why’, Daedalus, Vol.119 (4), pp41-60. Witherspoon, S. (1996) ‘Democracy, the environment and public opinion in Europe’, in W. Lafferty and J. Meadowcroft (eds.), Democracy and the Environment, Cheltenham: Edward Elgar Young, K. (1990) ‘Shades of green’ in R. Jowell et al (eds.) British Social Attitudes: the 8th Report, Aldershot: Dartmouth Publishing.

100