Embed Size (px)
Citation preview
Cultural Values, CEO Risk Aversion and Corporate Takeover Decisions†
BART FRIJNSa,*, AARON GILBERTa, THORSTEN LEHNERTb
and ALIREZA TOURANI-RADa
aDepartment of Finance, Auckland University of Technology, Auckland, New Zealand
bLuxembourg School of Finance, Luxembourg.
†We like to thank Ning Gao and Hubert de la Bruslerie and seminar participants at the University of Bath, UK; Georg August University, Goettingen, Germany; Massey University, Auckland, New Zealand; and the University of Technology Sydney, Australia, for their useful comments and suggestions. *Corresponding author. Tel.: +64 9 921 9999 (ext. 5706); Fax: +64 9 921 9940; Email: [email protected]
1
Cultural Values, CEO Risk Aversion and Corporate Takeover Decisions
Abstract In this paper, we examine the role of culture in corporate takeover decisions. In particular, we argue that managerial risk aversion, at the national level, is a cultural trait and affects the required net synergies. First, we propose a model that links CEO risk aversion to the required net synergies. Second, we empirically show that CEOs of firms located in countries with higher levels of risk aversion, measured by Hofstede’s (2001) uncertainty avoidance score, show less takeover activity, engage more in diversifying takeovers and require higher premiums on takeovers. Third, we show that risk aversion plays a greater role in relatively large takeovers. Our results are robust to the inclusion of many other possible explanatory variables, such as legal structures, method of payment, etc.
This version: August 2011
JEL Codes: D81; G34; M14.
Key Words: Financial Decision Making; Risk Aversion; Synergies; Culture; Takeovers.
2
1. Introduction
There is an established literature that has linked culture to economic decisions, outcomes and
institutions (see e.g. Weber, 1905; Landes, 2000, among others). As culture can be seen as
“the collective programming of the mind that distinguishes the members of one group or
category of people from another” (Hofstede, 2001, p. 9), it is not surprising that culture also
affects the way that people in a society shape their legal structures and financial institutions.
Several studies have examined the role of culture in finance. For example, Stulz and
Williamson (2003) show that culture (measured by the principle religion of a country) plays
an important role in explaining the protection of creditor rights (more so than traditional
arguments such as a country’s wealth or legal system). Licht, Goldschmidt and Schwartz
(2005) and Doidge, Karolyi and Stulz (2007) further show that culture affect the corporate
governance of firm within a country.
Besides affecting legal structures and institutions at the aggregate level, culture may also
affect the individual decisions made by people in a society. As Hilary and Hui (2009, p. 455)
note, “firms do not make decisions, people do and what they do outside work is likely to
affect the way they make these decisions inside work”, and several studies have empirically
shown how culture affects financial decision making. For instance, Beugelsdijk and Frijns
(2010) and Andersen et al. (2011), show that culture (in particular a country’s degree of
uncertainty avoidance) affects foreign investment decisions. Further, in corporate finance,
Hilary and Hui (2009) use religiosity of people within a US county as a measure of risk
aversion and show that firms located in counties with higher levels of religiosity display
lower degrees of risk exposure. Their study suggests that risk aversion may to some extent be
3
culturally determined. Beyond this, little empirical research has been done on the effects of
culture in financial decision making. This paper intends to fill part of this gap.
One question in corporate finance that has yet to be resolved convincingly is why firms
undertake takeovers. Several studies have suggested that a CEO’s personal interests and
characteristics often drive these decisions, one factor being the CEO’s degree of risk
aversion. Since CEOs have a disproportionate exposure to the performance of the firm and
are unable to fully diversify, takeovers have a direct effect on their personal wealth. Amihud
and Lev (1981) first explored this idea and found evidence that risk aversion indeed causes
managers to acquire outside their core industries as a way to diversify their personal wealth.
This suggests that the degree of CEO risk aversion has an impact on takeover decisions as has
been suggested by various other studies (e.g., May, 1995; Hall and Murphy, 2002; Lewellen,
2006; and Graham, Harvey and Puri, 2010).
In this paper, we revisit the issue of how risk aversion affects the corporate takeover decision.
In contrast to prior studies, we explore the question of how risk aversion as a cultural trait
affects takeover decisions at a country level using a national measure of risk aversion,
Hofstede’s (2001) uncertainty avoidance score. We argue that since takeovers are a risk to the
firm’s value and hence a CEO’s position, a more risk averse CEO will require higher
compensation before undertaking an acquisition. Hence, a more risk averse CEO will only
engage in a takeover if the expected net synergies1 are large enough.
1Net synergies refer to the value of the target to the acquiring firm minus the price paid for the target firm.
4
To examine this issue, we first develop a theoretical model based on Aktas et al. (2009) that
establishes a link between CEO risk aversion and expected net synergies. This model
suggests that 1. expected net synergies are higher for CEOs with higher degrees of risk
aversion; 2. there will be less takeover activity for CEOs with higher degrees of risk aversion;
and 3. risk version plays a greater role for deals that can potentially lead to greater losses.
Next, we empirically examine these predictions using Hofstede’s (2001) degree of
uncertainty avoidance as a measure for risk aversion and short-term cumulative abnormal
returns (CARs), as a measure of expected net synergy. Using a sample of 25,843 takeovers
from 39 countries, we confirm that CEOs from more risk avoiding nations engage in less
takeover activity and when they engage in a takeover, they have a preference for diversifying
takeovers (see Amihud and Lev, 1981). We further find that risk aversion has a strong
positive relationship with CARs, indicating that CEOs from more risk averse nations require
higher premiums on takeovers, leading to a more than 2.4% difference in average CAR
between the most and the least uncertainty avoiding nation. We also find that relative deal
size is positively related to CARs, indicating that larger takeovers require higher premiums,
and that uncertainty avoidance plays a greater roll in relatively large deals compared with
relatively small deals. We perform several robustness checks to validate our results, such as
alternative estimations techniques, sub-sample analysis and the addition different controls.
However, our main results largely obtain.
The paper proceeds as follows. In section 2, we provide a theoretical framework to show the
relationship between CEO risk aversion and expected net synergies and develop several
testable hypotheses. Section 3 discusses the data employed in the empirical part of the study.
Section 4 presents and discusses our empirical results and robustness tests. We conclude in
section 5.
5
2. CEO Risk Aversion and Net Synergies
2.1 Theoretical Framework
In this section, we argue that the CEO’s degree of risk aversion is positively related to the
expected net synergies on takeovers. We establish this link by developing a framework
similar to Aktas et al. (2009).
We assume that the CEO is facing a takeover decision on target firm T. Let VT be the current
market value of the target firm and s~ be the potential (percentage) synergies that the
acquiring firm can obtain by acquiring the target. The potential synergies, s~ , are not known
with certainty, but come from a distribution with a mean and variance known to the CEO of
the acquiring firm. Let TV~
be the value of the target firm to the acquirer, i.e.,
)~1(~
sVV TT += , (1)
which is also a random variable dependent on s~ . The net synergies of the target, Tδ~
, will be
defined as the difference between the value of the target to the acquirer and the price paid for
the target firm, P, i.e.,
PVTT -~
=~δ , (2)
which again is a random variable. The percentage net synergies of the target to the acquiring
firm, Aδ~
, are given as
6
A
TA
A V
V δδ
~+
=~
, (3)
where VA is the current market value of the acquiring firm.
The CEO will need to decide what price, P, he is willing to pay for the target. In doing so, we
assume that he faces the following decision problem. The CEO has a current wage package,
W, from which he derives utility U(W).2 Based on the expected net synergies that can be
obtained, the CEO makes a bid for the target. The bid can be accepted with probability Dφ , or
can be rejected with probability (1 - Dφ ), where Dφ is an increasing function in P (i.e. if the
CEO bids more, there is a greater probability of the bid being accepted). If the bid gets
rejected nothing will happen and the CEO keeps his current utility, U(W). If the deal gets
accepted, the acquisition may be considered successful (i.e. positive net synergies are
realized) with probability Sφ , or a failure with probability (1 - Sφ ), where Sφ is a decreasing
function in P (i.e. if the CEO offers more, there is a lower probability of positive net
synergies being realized). If positive net synergies are realized the CEO receives a bonus
)~
( AC δ , which is increasing in Aδ~
. As in Aktas et al. (2009), we assume that )~
( AC δ is linear
in Aδ~
, i.e.
AA baC δδ~
+=)~
( , (4)
2W can be thought of as the present value of his wage package and bonuses conditional on no offer being made
for the target firm.
7
consisting of a fixed component a and a variable component b depending on the size of the
net synergies. In the case of a successful deal the CEO’s total expected utility will be E[U(W
+ )~
( AC δ )]. If the acquisition is considered a failure, the CEO stands to make a loss, L, and
his total utility will be U(W – L).3 The decision problem facing the CEO is summarized in
Figure 1.
INSERT FIGURE 1 HERE
From this decision problem, we can compute the expected utility of the CEO
{ }))]~
(+([+)-()-1(+)()- 1(=][ ASSDD CWUELWUWUUE δφφφφ , (5)
where we can obtain expressions for E[U(W + )~
( AC δ )] and U(W – L) by using a first and
second order Taylor approximations around W. As per Pratt (1964), we obtain
)(')]~
([+)(=))]~
(+([ WUCEWUCWUE AA δδ , (6)
and
)(''2/1)(')()( 2 WULWLUWULWU +−=− , (7)
3Similar to Aktas et al. (2009), we assume that L represents a major loss to the CEO (e.g. the CEO may lose his job, bonuses or other perks, reputation, etc.). This idea is supported by the findings of, for example, Lehn and Zhao (2006) who show that CEOs who initiate value destroying takeovers face a much higher probability of being involuntarily replaced.
8
where U’(W) and U’’(W) are the first and second order derivatives with respect to W.
Substituting (6) and (7) into (5) yields
)}(')]~
([+))(''2
1+)('-)(-1{(+)(=][ 2 WUCEWULWLUWUUE ASSD δφφφ . (8)
To determine the price at which the CEO will undertake the acquisition, or stated differently,
to determine the premium the CEO requires on the takeover, we maximize Equation (8) with
respect to P. Thus we solve
0=)('''2
1-)('')-1('
2
1+
)(''+)(')-1('-)('-)(')]~
([)'(=C
)(C
22 WULWUL
WLUWLUWbUWUCEP
UE
SDSD
SDSDSDASD
φφφφ
φφφφφφδφφ
(9)
for E[ )~
( AC δ ], which yields
)'(
'2
1-)-1('
2
1+'-)-1('+
=)]~
([
22
SD
SDSDSDSDSD
A
LLLLb
CEφφ
γφφγφφφφφφφφδ , (10)
where, assuming that utility is increasing and concave in W, )('
)(''
WU
WU−=γ is the Arrow and
Pratt coefficient of absolute risk aversion, and 'Dφ , 'Sφ and )'( SDφφ are the first-order
derivatives with respect to P. Since 0'>Dφ (as the probability of getting a deal accepted
increases in P) and 0'<Sφ (as the probability of positive net synergies decreases in P),
Equation (10) shows that there is a positive relationship between the compensation required
9
by the CEO and his degree of risk aversion (for γ > 0, 0)1(2
1 2' >− γφφ LSD , as 0'>Dφ , and
02
1 2' >− γφφ LSD , as 0'<Sφ ).
We can further solve Equation (10) for the expected net synergies, E[ Aδ~
], as we have
assumed an explicit form for )~
( AC δ :
b
a
b
LLLL
ESD
SDSDSDSD
SD
SD
A -)'(
'2
1-)-1('
2
1+'-)-1('
+)'(
=]~
[
22
φφ
γφφγφφφφφφ
φφ
φφδ . (11)
Several implications can be derived from Equation (11). First, Equation (11) shows that the
required (expected) net synergies are a positive function of the CEO’s risk aversion (since
'Sφ is negative). Thus a higher degree of risk aversion would induce a CEO to offer less, so
that greater net synergies can be expected. Second, as a risk averse CEO would offer less, it is
expected that less deals would get accepted (as Dφ is increasing in P). Hence, we would
expect to see less takeover activity for more risk averse CEOs. Finally, Equation (11) shows
that the required net synergies are positively related to L, i.e. expected net synergies need to
be greater when the loss is greater. This loss furthermore interacts with the degree of risk
aversion.
2.2 Implementation of the Theoretical Framework
The framework presented above establishes a positive relationship between net synergies and
CEO risk aversion. However, net synergies and CEO risk aversion are not directly
observable. In this section, we first establish a link between net synergies and cumulative
10
abnormal returns (CARs), and second argue that risk aversion at the national level is a
cultural trait. As a result, the link between net synergies and CEO risk aversion can be tested
by examining the relationship between cumulative abnormal returns and cultural traits.
While expected net synergies are unobservable, they can be evaluated on the basis of CARs.
As expected net synergies (E[ Aδ~
]) obtained from the takeover are the expected gains to the
shareholders of the acquiring firm, we can expect the value of the acquiring firm to increase
by the value of net synergies created (see also Lehn and Zhao, 2006). The expected
percentage net synergies (E[ Aδ~
]), should be the same as the percentage increase in the share
price of the acquirer at the time of the announcement(controlling for the dilution that may
take place if all or part of the acquisitions is financed by equity).4 Hence, the short-term
cumulative abnormal returns (CARs) around the announcement should provide a signal of the
expected net synergies.
We further argue that aggregate risk aversion at the national level is a cultural trait. Although
risk aversion itself is an individual characteristic, Hilary and Hui (2009) argue that
individuals have the tendency to conform to the dominant values and behavior of the group.
In their study on how religiosity affects risk aversion and corporate decision making, they
note that, “To the extent that religious individuals cluster in a county, firms located in this
county should employ a larger proportion of religious people at different levels of the
organization. As a result, the extent to which religious employees, managers in particular,
tend to be more risk averse should be reflected in a firm’s corporate culture and its behaviour.
This should generate a greater aggregate risk aversion for firms that are located in more
religious counties than for firms that are located in less religious counties” (Hilary and Hui,
4We control for the potential dilution in section 4.5.
11
2009, pp. 458-459). Hilary and Hui (2009) empirically confirm the relationship between
religiosity, risk aversion and corporate decision making by showing that firms located in US
counties with high levels of religiosity have lower risk exposures, higher returns on assets
and lower investment rates.
This argument for the impact of religiosity on corporate decision making can easily be
extended to culture and its impact on corporate decision. Focusing on the decision making of
executive management, Geletkanycz (1997) notes that culture has an important impact on the
executive mindset. Geletkanycz (1997) notes: “As members of national societies, managers
not only contribute to the collective formulation of cultural norms and views, they experience
social reinforcement pressures which bring their individual-level assumptions and
preferences into close alignment with those of their native culture” (Geletkanycz, 1997, pp.
617). Indeed Geletkanycz (1997) empirically shows that culture, as measured by Hofstede’s
(2001) cultural values affects the executive mindset.
In line with Hilary and Hui (2009) and Geletkanycz (1997), we argue that as individuals with
the same cultural norms and views are clustered in a country, firms in this country are more
populated by people that are driven by the same cultural norms and values. Consequently,
risk aversion at a national level should be reflected in a firm’s corporate culture and its
behaviour, in particular that of its management (see Geletkanycz, 1997). This should generate
more risk averse behavior, on aggregate, for firms located in more uncertainty avoiding/risk
averse countries and, therefore, should generate differences in risk aversion across countries.5
5We note that in our study we measure risk aversion for the country where the acquiring firm is located and not
risk aversion of the CEO’s nationality. One could argue that as firms may be run by foreign CEOs, it is the
CEO’s national culture that should affect his risk aversion. However, as Geletkanycz (1997) argues social
reinforcement pressures bring individual-level assumptions and preferences into close alignment with their
12
The above mentioned literature provides arguments why culture may affect risk aversion and
decision making of individuals within a country. Besides these arguments, there has been a
vast amount of empirical literature studying the impact of culture on economic decision
making (see e.g. Kirkman et al., 2006 for an overview of this literature). Many of these
studies rely on the cultural framework provided by Hofstede (2001). Hofstede (2001) defines
four cultural dimensions that capture the cultural traits of members of that society. These
dimensions are: Uncertainty Avoidance; Individualism; Power Distance and Masculinity.6
These four dimensions are assumed to reflect key aspects of a society’s culture. Hofstede
(2001) then assigns a score to each country on each cultural dimension to indicate how
people from different cultures feel about the above societal issues.
Of these four dimensions, we are particularly interested in uncertainty avoidance as a national
measure of risk aversion, and although Hofstede’s (2001) uncertainty avoidance score
captures more than just risk aversion, numerous studies have used uncertainty avoidance as a
measure for risk aversion. For example, Kwok and Tadesse (2006) show that high uncertainty
avoiding countries are characterized by a (relatively risk-averse) bank-based financial system,
native culture, suggesting that the risk aversion for the country of the acquiring firm should matter more than the
risk aversion of the CEO’s nationality. Furthermore, Graham, Harvey and Puri (2010) demonstrate that there is a
link between CEO characteristics and company profile, suggesting that CEO either select firms whose corporate
culture fits their personal characteristics or vice versa. If, however, the CEO’s decisions are driven by his
national culture, then our results should understate the true relationship between risk aversion and required net
synergies.
6Uncertainty Avoidance captures a society’s tolerance for uncertainty and ambiguity. It indicates to what extent
a culture programs its members to feel either uncomfortable or comfortable in unstructured situations.
Individualism measures the degree to which individuals are integrated into groups. Power distance measures the
extent to which members of organizations accept and expect that power is distributed unequally. Masculinity
refers to a society’s focus on assertiveness and competitiveness on one side (masculine features) versus modesty
and caring for the quality of life on the other side (feminine features).
13
and low uncertainty avoiding countries by a market-based financial system. Chui and Kwok
(2008) further show that high uncertainty avoiding countries have higher levels of life
insurance consumption. Finally, in a cross-country study on international mutual funds’ asset
allocations, Beugelsdijk and Frijns (2010) and Anderson et al. (2011) show that high
uncertainty avoiding countries allocate fewer funds to foreign markets and display a greater
home bias. These studies demonstrate a clear link between uncertainty avoidance and risk
aversion.
Based on the arguments presented above, we expect that CARs around the takeover
announcement reflect the net synergies created by a takeover, while Hofstede’s (2001)
uncertainty avoidance score is related to (country-level) risk aversion. We use these measures
to test various implications of the framework presented in section 2.1.
3. Data
We obtain data on mergers and acquisitions undertaken around the world from the Thomson
One Banker database. This database contains detailed information on mergers and
acquisitions around the world, including details on the specific deal (date of announcement,
completion status, date of completion, percentage of shares bought, dollar size of the deal,
etc.), the acquirer (acquirer nationality, industry, etc.) and the target (target nationality,
industry, etc.). From this database, we collect data on all mergers and acquisitions over the
period January 1990 to August 2008. The database contains data on 136,086 mergers and
acquisitions attempted within this period. However, to be included in the sample, we only
select those takeovers for which the deal size is at least US$ 1 million, at least 50% of the
shares are sought in the takeover, and the deal has been completed. Furthermore, the acquirer
14
needs to be a publicly traded company from a country where Hofstede (2001) scores are
available. Finally, we only select those firms for which we obtain daily stock price and firm
size data from Thompsen Datastream. This provides us with a final sample of 25,750
acquisitions made by 7,681 firms from 39 countries.
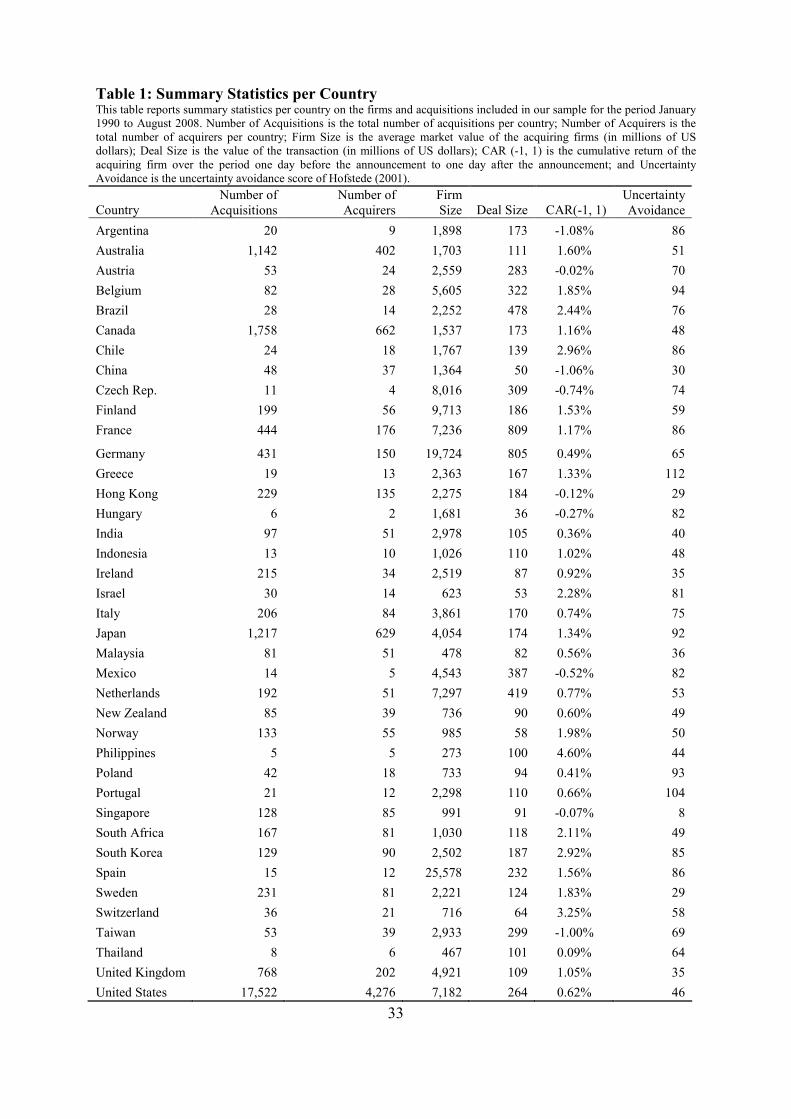
In Table 1, we report some summary statistics of our sample per country. The first and
second columns report the number of acquisitions and the number of acquirers originating
from each country. The number of acquisitions are the largest for the US (17,757
acquisitions), covering nearly 70% of all acquisitions, followed by Canada, Japan and the
UK. These are also the countries with the largest number of acquirers. The smallest number
of acquisitions is from emerging markets, such as the Philippines, Hungary and Thailand.
Acquiring firms from less developed markets appear to be smaller, with the smallest average
firm size in the Philippines at US$272 million, although interestingly the largest firms, on
average, are from Spain at US$25 billion. The smallest average deal size is for Hungary at
US$35 million, while the largest is for France at US$808 million.
INSERT TABLE 1 HERE
In column 5 of Table 1, we report the average CARs for the -1 to 1 day window for each
country. In most countries, we find that the average CARs are positive, and CARs are highest
in the Philippines at 4.60% and lowest in Argentina at -1.08%.
The last column of Table 1 reports the Hofstede (2001) uncertainty avoidance score for each
country. There is a wide variation in the degree of uncertainty avoidance per country. The
15
most uncertainty avoiding nations, according to Hofstede (2001), are Greece and Portugal,
while the least uncertainty avoiding countries are Singapore, Hong Kong and Sweden.
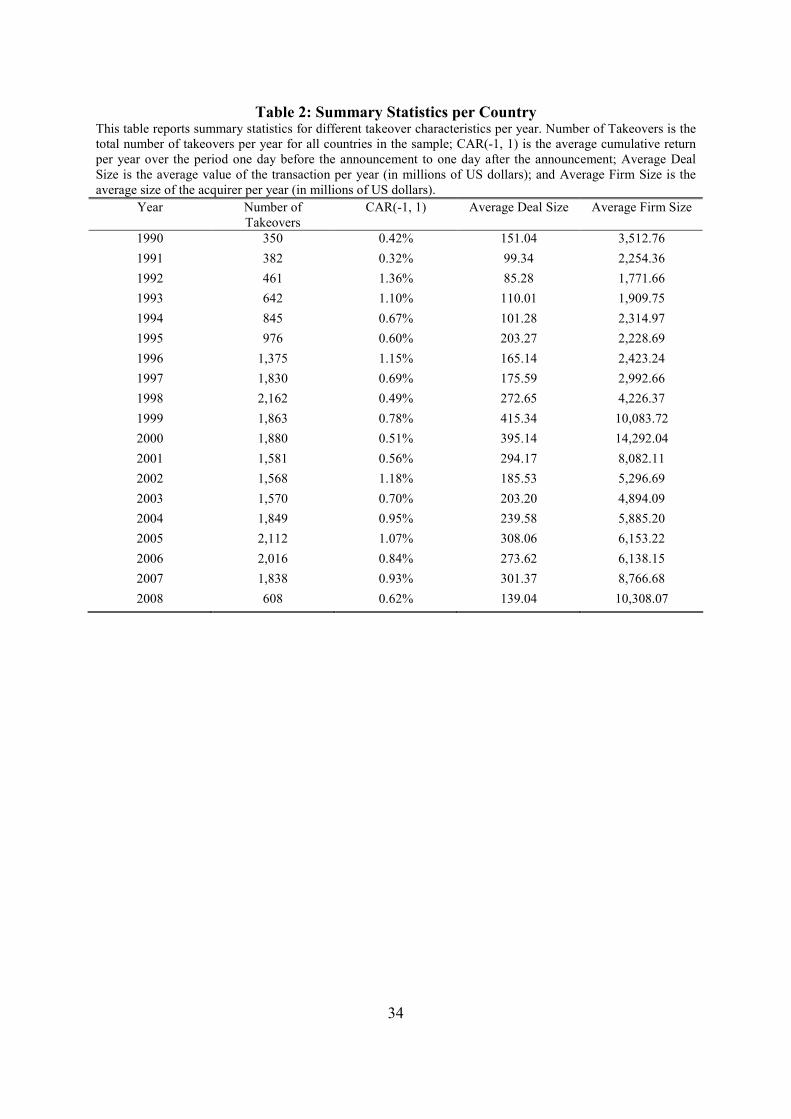
INSERT TABLE 2 HERE
In Table 2, we report summary statistics for our sample over time. In the first column of
Table 2 we report the number of takeovers per year. Over time, we observe an increase in the
number of takeovers, with a spike in the number of takeovers in the years 1997-2000 (which
to some extent may be driven by the large merger wave in the US over this period). The final
year shows a drop in the number of takeovers. This is due to the fact that our sample ends in
August 2008. The next column shows the average cumulative abnormal return per year.
Although we do not observe any discernable trend in CARs, we do note that CARs are
positive for all years. CARs seem to be most depressed in 1990, 1991 and during the merger
wave from 1997-2001, an observation which is in line with Moeller et al. (2005). The next
two columns of Table 2 report the average deal size and average acquiring firm size (in
millions of US dollars). As with CARs there is no clear trend although again we note a spike
in both deal and firm size during the 1997-2001 merger wave.
4. Empirical Findings
4.1 Takeover Activity and Uncertainty Avoidance
As a first empirical test to establish the link between risk aversion, uncertainty avoidance and
corporate decision making, we investigate the relationship between takeover activity (the
number of acquisitions made) and the uncertainty avoidance score. Based on our model, we
expect a negative relationship between the degree of uncertainty avoidance and the number of
16
acquisitions. If more risk averse managers require higher premiums on takeovers, then we
also expect them to engage in fewer takeovers, because there are fewer takeovers offering the
required net synergies. We test this hypothesis by estimating the following regression:
ijjkkjij ControlsUANUM εγβα +++= 1 , (12)
where NUMij is the total number of acquisitions made by firm i from country j over the
sample period, UAj is the Hofstede (2001) uncertainty avoidance score for country j, and
Controlsjk is a set of control variables that are added to the model. Since NUMij is a count
variable we use Poisson regressions to estimate Equation (12).7
INSERT TABLE 3 HERE
In the first column of Table 3, we report the results of Equation (12), where we add a control
variable that captures the fact that firms in emerging markets engage in less takeover activity.
The relationship between the number of acquisitions made and the uncertainty avoidance
score is negative and significant at the 1% level. These results support our argument that if
more risk averse managers require higher premiums on takeovers they will engage in less
takeover activity, and is consistent with the findings of Graham, Harvey and Puri (2010), who
show that more risk tolerant CEOs engage in more M&A activity. To examine the robustness
of these results, we extend Equation (12) by including industry effects and the average (log)
size of the acquiring firm (columns 2 and 3). However, these factors do not affect the
7Note that we only observe NUMij for firms that have completed an acquisition, which introduces a self-
selection bias. This bias cannot be resolved as we cannot observe whether or how often a CEO has contemplated
not to make a bid. However, we can give our results of this regression a conditional interpretation, i.e. for the
subset of firms that have completed takeovers, how does risk aversion affect their takeover activity.
17
significance and direction of the relationship between uncertainty avoidance and number of
acquisitions.
4.2 Industry Diversification and Uncertainty Avoidance
Our second test follows Amihud and Lev (1981) who argue that more risk averse CEOs
engage in more diversifying takeovers. They measure diversifying takeovers by a dummy
variable that is equal to 1 if the acquisition is outside the industry of the acquiring firm and
measure risk aversion by considering the equity stake of managers in the firm. Amihud and
Lev (1981) find a positive relationship between the proportion of equity held by management
and diversifying takeovers. We investigate the same issue by linking diversifying takeovers
to uncertainty avoidance, and estimate the following relationship,
ijtijt
ijt
ijt
jijt MVLogMV
DealSizeUADivers εβββα ++++= )(321 , (13)
where Diversijt is an indicator variable equal to 1 if the deal is diversifying, and 0 if it is not.
We classify a takeover as diversifying if the acquirer and target have different SIC codes. We
look at two separate definitions of a diversifying takeover. We first consider situations where
there is a difference in all four digits of the SIC code (incorporating both major and minor
industry diversification) and second where there is a difference in the first two digits of the
SIC (major industry diversification). We control for the relative size of the deal (ijt
ijt
MV
DealSize)
and the (log) size of the acquirer (Log(MVijt)). In addition, we control for time effects and
industry fixed effects. Since the dependent variable is an indicator variable, we estimate
Equation (13) as a Probit model.
18
INSERT TABLE 4 HERE
In the first two columns of Table 4 we show the results for the Clustered-Probit model, where
we control the standard errors for clustering at the country-level (see Petersen, 2009). In the
last two columns we estimate the coefficients using the Fama and McBeth (1973) approach,
by estimating cross-sectional Probit models for each year. For both Clustered-Probit and
Fama-McBeth, we find that uncertainty avoidance is significant for both groups of
diversifying takeovers. However, the relationship is stronger for major diversifying
takeovers. These results suggest that more risk averse CEOs (from more uncertainty avoiding
nations) engage more in diversifying takeovers. This confirms the findings of Amihud and
Lev (1981) and provides additional evidence that uncertainty avoidance indeed captures risk
aversion. In addition, the results also show that larger acquirers engage more in diversifying
takeovers (confirmed by both Probit and Fama-McBeth), and relatively smaller deals are
more likely to be diversifying.
Combined, these two results suggest that acquirers from high uncertainty avoiding countries
tend to engage in less takeover activity altogether, but when they engage in a takeover, they
are more inclined to engage in diversifying takeovers.
4.3 Cumulative Abnormal Returns and Uncertainty Avoidance
The framework developed in section 2 posits a positive relationship between risk aversion
(measured by uncertainty avoidance) and expected net synergies (measured by short-term
CARs around the announcement of a takeover). We assess this relationship by regressing
CARs on uncertainty avoidance scores, i.e.
19
ijtkijtkjijt ControlsUACAR εγβα +++= , , (14)
where CARijt is the cumulative abnormal return of firm i from country j in year t. Controlsijt,k
captures other factors that may affect CARs around takeovers. We add the following controls.
First, we control for the relative size of the deal (computed as deal size divided by market
value of the acquiring firm). Second, we control for the (log) size of the acquiring firm
(measured in millions of US dollars), because small firms typically make acquisitions that
result in higher CARs (see Moeller et al., 2004). Third, we control for whether a takeover was
diversifying or not. We do this at two levels: 1) by controlling for country diversification (i.e.
whether an acquisition was made in a foreign country); and 2) by controlling for industry
diversification (based on difference in 2-digit SIC codes). Fourth, we control for the number
of prior acquisitions made by the firm as CEOs may learn over time, and this may affect the
net synergies on subsequent takeovers (see e.g. Aktas et al., 2009). Fifth, we control for legal
origin (see La Porta et al., 1998, 1999, 2000) as the effect of uncertainty avoidance may just
be a proxy for different legal structures. Finally, we control for time effects, by including year
dummies, as CARs are shown to vary over time (see e.g. Moeller et al., 2005 and Table 2),
and include industry dummies, because Mulherin and Boone (2000) document significant
industry clustering in acquisition and divestitures activity.
INSERT TABLE 5 HERE
Table 5 reports the regression results for CARs (in percentages) on uncertainty avoidance,
where we include the different control variables incrementally. For all regressions, we
compute robust standard errors controlling for clustering at the country level (see Petersen,
20
2009). Column 1 reports the regression results where we only include uncertainty avoidance,
relative deal size and acquiring firm size. Uncertainty avoidance has the expected positive
sign, i.e. CARs are positively related to the degree of uncertainty avoidance of a nation, and a
coefficient value of 0.018. This finding is highly significant, providing strong evidence for
our theoretical motivation. Moreover, this finding is also economically significant. As seen in
Table 1, uncertainty avoidance scores range from 8 to 112, more than a 100 point difference.
In our model this translates to more than a 1.8% difference in CARs between the most and
least uncertainty avoiding country. Relative deal size is positively related to CAR implying
that relatively larger deals provide greater CARs. This may be linked back to our framework,
as the consequences for the CEO of getting a relatively large deal wrong may be greater than
the consequences of getting a small deal wrong. Hence larger deals should carry a greater risk
premium and should therefore result in a greater CAR. Finally, we find a negative and
significant relationship between the size of the acquiring firm and CARs, i.e. larger firms
have lower CARs on the takeover announcement. Again, this can be linked back to our
model, as we may expect that an unsuccessful takeover may be more consequential for a
small firm than for a large firm.
The next variables that we consider are our diversification measures (column 2). We find that
country diversification is positively related to CARs while industry diversification is
insignificant. This suggests that acquiring abroad generates higher net synergies. However,
inclusion of these variables does not affect the relationship between uncertainty avoidance
and CAR in a material way.
21
In columns 3 to 5 we add time effects and industry effects separately and jointly. Although
the inclusion of these variables affects the R2 of the regression, it does not affect the
magnitude and significance of all other coefficients.
Next, we include a variable for the number of prior acquisitions. As noted by Aktas et al.
(2009), CEOs may learn about the distribution of possible outcomes from a deal in the
process of undertaking acquisitions. This reduces the uncertainty of future deals, and so
reduces the risk premium CEOs require when undertaking future acquisitions. Accordingly,
CARs should decrease as CEOs undertake more deals. Alternatively, it could be argued that
CEO’s become better at identifying the synergy gains from deals, and so would only pursue
deals with higher CARs. This would lead to a positive relationship between CARs and prior
acquisitions. The results in column 6 of Table 5 show a positive and significant relationship
between number of prior acquisitions and the CARs earned in a deal. This suggests that
CEOs become better at identifying target companies that could generate synergies and
therefore pick better deals. Again the relationship between uncertainty avoidance and CAR is
not affected by the inclusion of this variable.
Finally, we add the legal origin dummies based on the studies of La Porta et al. (1998, 1999,
2000), where we include three dummies for French, German and Scandinavian Civil law
countries (using Common law countries as the base case). The results in column 7 show that
including legal origin dummies actually strengthens the relationship between risk aversion
and CARs. None of the basic controls are affected by legal origin. Of the legal origin
variables, the German dummy is significantly negative and the Scandinavian dummy shows a
significantly positive coefficient. This latter finding is in line with the evidence presented by
22
Mueller and Yurtoglu (2007), who find that Scandinavian mergers perform better than US
mergers.
4.4 Robustness Tests
To assess the robustness of our findings we proceed in two ways. First, we estimate the
previous regressions using the Fama and McBeth (1973) approach. These Fama-McBeth
results are presented in Table 6. Broadly speaking, the results are in line with the Clustered
OLS results presented in Table 5, supporting the hypothesis that risk aversion affects CARs.
Most of the control variables also remain unchanged with the exception of prior acquisitions
which loses significance in these models and the legal origin dummies, where Scandinavian
loses its significance.
INSERT TABLE 6 HERE
Second, we investigate various sub-samples and report results in Table 7. We first split our
sample approximately in half and examine the pre-2000 period (1990 – 1999) and the post-
2000 period (2000 – 2008). Columns 1 and 2 show that uncertainty avoidance is significant
only in the post-2000 period and not the pre-2000 period. The insignificance of uncertainty
avoidance in the earlier part of the sample could be attributed to the merger wave of the late
1990s (see Moeller et al., 2005), as acquisitions in this period are likely more affected by
hubris than risk aversion. Some evidence for this possible explanation can be found when
considering the coefficient on prior acquisitions in both sub-samples. In the pre-2000 sample
the coefficient on prior acquisitions is significantly negative, indicating that the cumulative
abnormal returns for repeat acquirers decrease. This has often been used as an indicator of
managerial hubris (see Billett and Qian, 2008). In the post-2000 sub-sample, we observe that
23
the coefficient on prior acquisitions becomes significantly positive, suggesting that learning
(i.e. recognizing better deals) dominates over hubris.
As a second test, we exclude the US from the sample. We do this because takeovers
originating from the US make up nearly 70% of the total sample, and so the results reported
in Table 5 and 6 may be driven by the US. In column 3 of Table 7, we report the regression
results for the model excluding the US. We note that the sample size decreases considerably
to 8,291 takeovers. However, we find that the coefficient on uncertainty avoidance remains
significant, showing that uncertainty avoidance is not a US effect. Most of the significance of
other variables remains unchanged as well, except for prior acquisitions, which becomes
insignificant after dropping the US.
INSERT TABLE 7 HERE
As a third test, we split the sample into developed and emerging markets. In our sample, we
have 26 developed nations and 13 emerging nations. We report the results for the two sub-
samples in the last two columns of Table 7. For the developed markets, we find that the
results are similar to the results reported in Table 5. For emerging markets, uncertainty
avoidance becomes insignificant, indicating that uncertainty avoidance does not play a role in
these markets. However, we note that the sample size for emerging markets is considerably
smaller with 545 acquisitions.
4.5 Omitted Variables
One remaining concern is that our results may be driven by an omitted variable bias. For this
to be the case the omitted variable would have to be correlated with uncertainty avoidance
24
and with the different dependent variables used in our analysis. These correlations would
have to be consistent with the results found in our study. Although we may postulate a
relationship between several omitted variables, uncertainty avoidance and CARs, postulating
a consistent relationship between with all other dependent variables (number of deals and
diversification) is more difficult. We nevertheless examine the relevance of several control
variables that may affect our results (see also Hilary and Hui, 2009 who address this issue in
a similar way) and report the results in Table 8.8
A first factor that may affect the relationship between risk aversion and CARs is the method
of payment (note that we do not include method of payment in our main results as we only
have payment data for approximately half of our sample). Many studies have shown that the
method of payment (cash versus shares) affects the CARs of the bidding firm (see e.g.
Travlos, 1987; Martin, 1996, among many others). Payment in shares is often shown to have
a negative impact on the CARs of the bidding firm (see Travlos, 1987) as share payments
dilute the equity of the merged entity and also dilute the expected net synergies of the
takeover. Method of payment can also be related to risk aversion. Cash payments raise the
leverage of the bidding firms and risk averse managers may have a tendency to maintain
lower levels of leverage. Therefore, risk averse managers may prefer financing by means of
shares. Moreover, Martin (1996) finds that acquiring firms with higher managerial ownership
are more likely to pay in shares. This again suggests a link between risk aversion and
payment in shares as CEOs with higher ownership are likely to be less diversified and would
engage more in risk reducing activities (see Amihud and Lev, 1981). To examine whether the
relationship between uncertainty avoidance and CARs is driven by the method of payment
8We only report the results for the uncertainty avoidance score and the specific variable that we have added.
However, all other controls used in Table 5 are included in these regressions as well.
25
we include two dummy variables, one being equal to 1 if the payment was entirely in shares
and 0 otherwise, and one being equal to 1 if the payment is mixed (shares and cash) and 0
otherwise. This leaves pure cash payments as the base case. In column 1 of Table 8 we
present the results of this regression. We first note that the sample size reduces considerably
as we only have payment data for 13,213 observations in our sample. The results show that
the inclusion of method of payment does not affect the positive relationship between
uncertainty avoidance and CARs. In fact, the relationship becomes stronger with a coefficient
of 0.033. Method of payment does have an impact on CARs, where payment in shares
reduces CARs significantly, whereas mixed payments are insignificant.
A second factor that may affect the relationship between risk aversion and CARs is the
degree of legal protection of shareholders against expropriation by corporate insiders, also
known as self-dealing (see Djankov et al., 2008). We could expect a relationship between the
degree of uncertainty avoidance of a country and its strength of investor protection laws,
where more uncertainty avoiding nations would likely have stronger regulations. We could
also expect a positive relationship between CARs and stronger regulations, because if
regulation with regards to self-dealing is weak, management could extract private benefits
from takeovers which could compensate for lower cumulative abnormal returns (and hence
lower bonuses) on the takeover. To examine whether this relationship actually drives the
relationship between uncertainty avoidance and cumulative abnormal returns, we employ
Djankov et al.’s (2008) anti-self-dealing index and add this to our regression model. In
column 2 of Table 8, we report the results for this regression. The relationship between
uncertainty avoidance and CAR is not affected by the inclusion of the anti-self-dealing index
and remains significant. Furthermore, the anti-self-dealing index is not significant in the
regression.
26
Another possibility is that the lack of transparency about the financial situation of the firm is
driving the relationship between uncertainty avoidance and CARs. If disclosure requirements
of a firm are relatively weak, not well enforced, or open to managerial manipulation, then
there will be greater uncertainty about the performance and position of the firm with regards
to the takeover. We would therefore expect a positive relationship between disclosure
standards and CARs.9 In countries with higher levels of uncertainty avoidance we would also
expect disclosure standards to be more rigorous. Hence the positive relationship between
CAR and uncertainty avoidance may be driven by disclosure standards. To examine whether
disclosure standards affects the relationship between CARs and uncertainty avoidance, we
employ Bushman and Piotroski’s (2004) disclosure index (see also La Porta et al., 2006).
This index measures the prevalence of disclosure of specific accounting items including
R&D, capital expenditure, segment break-downs and subsidiary information, amongst others.
As shown in column 3 of Table 8, disclosure standards do not have a significant relationship
with CARs. The inclusion of this variable also does not affect the direction or strength of the
relationship between uncertainty avoidance and CARs.
A fourth control we add is ownership concentration as used by La Porta et al. (2006). We
include this variable, because the relationship between uncertainty avoidance and cumulative
abnormal returns so far has been attributed to managerial risk aversion. However, when
ownership is concentrated, shareholder face the same issue as managers in that they may not
be fully diversified, giving them an exposure to the firm’s specific risk. If this is the case, it
may be the risk aversion of shareholders that defines the relationship between uncertainty
9If disclosure standards are low, the announcement could be a noisy signal. If the noise in the announcement is
random, CARs would be biased down towards zero.
27
avoidance and CARs. As shown in column 4 of Table 8, ownership concentration does not
have a significant relationship with CARs, and does not affect the relationship between
uncertainty avoidance and CARs.
Finally, we add the other Hofstede (2001) cultural dimensions to the regression model,
individualism, masculinity and power distance. We include these variables to examine
whether the uncertainty avoidance score of a nation may be a proxy for another cultural
characteristic of a nation. We include these variables and show the result in column 5 of
Table 8.We find that none of the other cultural scores are significant and that the result for the
uncertainty avoidance score remains highly significant.
4.6 The Interaction of Relative Deal Size and Uncertainty Avoidance
According to our model, relatively larger deals could lead to larger losses for the CEO. If risk
aversion affects the CEO’s decision making, then relatively larger deals should be considered
more risky and carry a higher premium than smaller deals. In this case, risk aversion should
play a greater role in relatively large deals. We explore this issue by creating quartiles based
on the relative deal size and construct four new uncertainty avoidance variables. UA1 is equal
to the country’s uncertainty avoidance score for the acquiring firm if the relative deal size
was in the smallest quartile and zero otherwise and UA2, UA3, and UA4 are defined similarly.
Next, we perform a regression where we replace the uncertainty avoidance score with our
four new variables.
INSERT TABLE 9 HERE
28
In Table 9, we report the results of this regression. In column 1, we report the results for the
Clustered OLS. We find that uncertainty avoidance is significant in all size quartiles and
coefficients on uncertainty avoidance increase as the relative deal size gets larger. Therefore,
as predicted by our model, the importance of uncertainty avoidance increases when the
relative size of the deal becomes larger. Individual Wald tests on the coefficients show that
only the increase between quartile 2 and 3 is significant (and hence also between 1 and 3, 1
and 4, and 2 and 4). A joint Wald test confirms that uncertainty avoidance has a significantly
different impact for different size quartiles. The next column shows the results for the same
model using the Fama-McBeth (1973) estimation procedure. The results are supportive of the
Clustered OLS results. We see a similar pattern of the increasing importance of uncertainty
avoidance as deal sizes increase.
5. Conclusion
In this paper, we examine the role of culture in corporate takeover decisions. In particular, we
argue that risk aversion, to some extent is a cultural trait and affects the takeover decision of
the CEO. We propose a theoretical framework that shows how expected net synergies are
linked to CEO risk aversion, and this model predicts that 1. more risk averse CEOs require
higher expected net synergies on a takeover; 2. more risk averse CEOs will engage in less
takeover activity; and 3. CEO risk aversion plays a greater roll in takeovers where the
potential losses are greater.
In the empirical part of our study we use Hofstede (2001) uncertainty avoidance score as a
measure of country-level measure of managerial risk aversion. Using a sample of 25,843
takeovers from 39 countries, we find that more risk averse CEOs engage in less takeover
29
activity. Additionally, we confirm the findings of previous work that shows that a more risk
averse manager engages in more diversifying takeovers. In line with our theoretical model,
expected net synergies, approximated by the short-term CARs around the takeover
announcement, are positively related to the degree of uncertainty avoidance of a country.
This finding is not only statistically significant but also economically so, yielding a difference
of more than 2.4% in CAR between the most and least uncertainty avoiding country. We
perform several robustness checks to validate our results, such as alternative estimations
techniques, sub-sample analysis and the addition different controls. However, our main
results largely obtain. In line with our prediction we also find that the relative size of a deal is
an important determinant of CAR, and that risk aversion plays a greater role in relatively
large deals than in relatively small ones.
30
References Aktas, N., de Bodt, E. and Roll, R. (2009). Learning, hubris and corporate serial acquisitions. Journal of Corporate Finance 15, 543-561. Amihud, Y. and Lev, B. (1981). Risk reduction as a managerial motive for conglomerate mergers. Bell Journal of Economics 12, 605-617. Anderson, C., Fedenia, M., Hirschey, M. and Skiba, H. (2011). Cultural influences on home bias and international diversification by institutional investors. Journal of Banking and
Finance 35, 916-934. Beugelsdijk, S. and Frijns, B. (2010). A cultural explanation of the foreign bias in international asset allocation. Journal of Banking and Finance 34, 2121-2131. Billett, M. T. and Qian, Y. (2008). Are overconfident managers born or made? Evidence of self-attribution bias from frequent acquirers. Management Science 54, 1037-1051. Bushman, R. and Piotroski, J. (2004). Financial reporting incentives for conservative accounting: The influence of legal and political institutions. Journal of Accounting and
Economics 42, 107-148. Chui, A. and Kwok, C. (2008). National culture and life insurance consumption. Journal of
International Business Studies 39, 88-101. Djankov, S., La Porta, R., Lopez-de-Silanes, F. and Shleifer, A. (2008). The law and economics of self-dealing. Journal of Financial Economics 88, 430-465. Doidge, C., Karolyi, G. and Stulz, R. (2007). Why do countries matter so much for corporate governance? Journal of Financial Economics 86, 1-39. Fama, E. and McBeth, J. (1973). Risk, return and equilibrium: Empirical tests. Journal of
Political Economy 81, 607-636. Geletkanycz, M. (1997). The salience of ‘culture’s consequences’: The effects of cultural values on top executive commitment to the status quo. Strategic Management Journal 18, 615-634. Graham, J., Harvey, C. and Puri, M. (2010). Managerial Attitudes and Corporate Actions. Working Paper, Duke University. Halek, M., and Eisenhauer, J. (2001). Demography of risk aversion. Journal of Risk and
Insurance 68, 1–24. Hall, B. and Murphy, K. (2002). Stock options for underdiversified executives. Journal of
Accounting and Economics 33, 3-42. Hilary, G. and Hui, K. (2009), Does religion matter in corporate decision making in America? Journal of Financial Economics 93, 474-489.
31
Hofstede, G. (2001). Culture’s Consequences: International Differences in Work-Related
Values. Sage Publications: Beverly Hills, CA, 2nd edition.
Kirkman, B., Lowe, K. and Gibson, C. (2006). A quarter century of Culture’s Consequences: A review of empirical research incorporating Hofstede’s cultural values framework. Journal
of International Business Studies 37, 285-320.
Kwok, C. and Tadesse, S. (2006). National culture and financial systems. Journal of
International Business Studies 37, 227-247.
La Porta, R., Lopez-de-Silanes, F., Shleifer, A., and Vishny, R. (1998). Law and Finance, Journal of Political Economy 52, 1113-1155. La Porta, R., Lopez-de-Silanes, F., Shleifer, A., and Vishny, R. (1999). Corporate ownership around the world. Journal of Finance 54, 471-517. La Porta, R., Lopez-de-Silanes, F., Shleifer, A., and Vishny, R. (2000). Agency problems and dividend policies around the world. Journal of Finance 55, 1-33.
La Porta, R., Lopez-de-Silanes, F., Shleifer, A., and Vishny, R. (2006). What works in securities laws. Journal of Finance 61, 1-32.
Landes, D. (2000). Culture makes almost all the difference. In: Harrison, L. and Huntington, S. (Eds.), Culture Matters. Basic Books, New York, NY. Lehn, K. and Zhao, M. (2006). CEO Turnover after Acquisitions: Are Bad Bidders Fired? Journal of Finance 61, 1759-1811.
Lewellen, K. (2006). Financing decisions when managers are risk averse. Journal of
Financial Economics 82, 551-589.
Licht, A., Goldschmidt, C., and Schwartz, S. (2005). Culture, law and corporate governance. International Review of Law and Economics 25, 229-255. Martin, K. J. (1996). The method of payment in corporate acquisitions, investment opportunities, and management ownership. Journal of Finance 51, 1227-1246. May, D. (1995). Do managerial motives influence firm risk reduction strategies? Journal of
Finance 50, 1291-1308. Moeller, S., Schlingemann, F. and Stulz, R. (2004). Firm size and gains from acquisitions. Journal of Financial Economics 73, 201-228. Moeller, S., Schlingemann, F. and Stulz, R. (2005). Wealth destruction on a massive scale? A study of acquiring-firm returns in the recent merger wave. Journal of Finance 60, 757-782. Mueller, D., and Yurtoglu, B. (2007). Corporate governance and the returns to acquiring firms‘ shareholders: an international comparison. Managerial and Decision Economics 28, 879-896.
Mulherin, J., and Boone, A. (2000). Comparing acquisitions and divestitures. Journal of
Corporate Finance 6, 117-139.

32
Petersen, M. (2009). Estimating Standard Errors in Finance Panel Data Sets: Comparing Approaches. Review of Financial Studies 22, 435-480.
Pratt, J. (1964). Risk Aversion in the Small and in the Large. Econometrica 32, 122-136.
Stulz, R. and Williamson, R. (2003). Culture, openness and finance. Journal of Financial
Economics 70, 313-349. Travlos, N. G. (1987). Takeover bids, methods of payment, and bidding firms’ stock returns. Journal of Finance 42, 943-963. Weber, M. (1905). The Protestant Ethic and the Spirit of Capitalism. Allen & Unwin, London.
33
Table 1: Summary Statistics per Country This table reports summary statistics per country on the firms and acquisitions included in our sample for the period January 1990 to August 2008. Number of Acquisitions is the total number of acquisitions per country; Number of Acquirers is the total number of acquirers per country; Firm Size is the average market value of the acquiring firms (in millions of US dollars); Deal Size is the value of the transaction (in millions of US dollars); CAR (-1, 1) is the cumulative return of the acquiring firm over the period one day before the announcement to one day after the announcement; and Uncertainty Avoidance is the uncertainty avoidance score of Hofstede (2001).
Country Number of
Acquisitions Number of Acquirers
Firm Size Deal Size CAR(-1, 1)
Uncertainty Avoidance
Argentina 20 9 1,898 173 -1.08% 86
Australia 1,142 402 1,703 111 1.60% 51
Austria 53 24 2,559 283 -0.02% 70
Belgium 82 28 5,605 322 1.85% 94
Brazil 28 14 2,252 478 2.44% 76
Canada 1,758 662 1,537 173 1.16% 48
Chile 24 18 1,767 139 2.96% 86
China 48 37 1,364 50 -1.06% 30
Czech Rep. 11 4 8,016 309 -0.74% 74
Finland 199 56 9,713 186 1.53% 59
France 444 176 7,236 809 1.17% 86
Germany 431 150 19,724 805 0.49% 65
Greece 19 13 2,363 167 1.33% 112
Hong Kong 229 135 2,275 184 -0.12% 29
Hungary 6 2 1,681 36 -0.27% 82
India 97 51 2,978 105 0.36% 40
Indonesia 13 10 1,026 110 1.02% 48
Ireland 215 34 2,519 87 0.92% 35
Israel 30 14 623 53 2.28% 81
Italy 206 84 3,861 170 0.74% 75
Japan 1,217 629 4,054 174 1.34% 92
Malaysia 81 51 478 82 0.56% 36
Mexico 14 5 4,543 387 -0.52% 82
Netherlands 192 51 7,297 419 0.77% 53
New Zealand 85 39 736 90 0.60% 49
Norway 133 55 985 58 1.98% 50
Philippines 5 5 273 100 4.60% 44
Poland 42 18 733 94 0.41% 93
Portugal 21 12 2,298 110 0.66% 104
Singapore 128 85 991 91 -0.07% 8
South Africa 167 81 1,030 118 2.11% 49
South Korea 129 90 2,502 187 2.92% 85
Spain 15 12 25,578 232 1.56% 86
Sweden 231 81 2,221 124 1.83% 29
Switzerland 36 21 716 64 3.25% 58
Taiwan 53 39 2,933 299 -1.00% 69
Thailand 8 6 467 101 0.09% 64
United Kingdom 768 202 4,921 109 1.05% 35
United States 17,522 4,276 7,182 264 0.62% 46
34
Table 2: Summary Statistics per Country This table reports summary statistics for different takeover characteristics per year. Number of Takeovers is the total number of takeovers per year for all countries in the sample; CAR(-1, 1) is the average cumulative return per year over the period one day before the announcement to one day after the announcement; Average Deal Size is the average value of the transaction per year (in millions of US dollars); and Average Firm Size is the average size of the acquirer per year (in millions of US dollars).
Year Number of Takeovers
CAR(-1, 1) Average Deal Size Average Firm Size
1990 350 0.42% 151.04 3,512.76
1991 382 0.32% 99.34 2,254.36
1992 461 1.36% 85.28 1,771.66
1993 642 1.10% 110.01 1,909.75
1994 845 0.67% 101.28 2,314.97
1995 976 0.60% 203.27 2,228.69
1996 1,375 1.15% 165.14 2,423.24
1997 1,830 0.69% 175.59 2,992.66
1998 2,162 0.49% 272.65 4,226.37
1999 1,863 0.78% 415.34 10,083.72
2000 1,880 0.51% 395.14 14,292.04
2001 1,581 0.56% 294.17 8,082.11
2002 1,568 1.18% 185.53 5,296.69
2003 1,570 0.70% 203.20 4,894.09
2004 1,849 0.95% 239.58 5,885.20
2005 2,112 1.07% 308.06 6,153.22
2006 2,016 0.84% 273.62 6,138.15
2007 1,838 0.93% 301.37 8,766.68
2008 608 0.62% 139.04 10,308.07
35
Table 3: Number of Deals and Uncertainty Avoidance This table reports results for the Poisson regressions of the number of deals per acquiring firm on uncertainty avoidance and several control variables. Number of Deals is measured as the total number of deals made by one acquiring firm over the sample period January 1990 to August 2008. Uncertainty Avoidance is the uncertainty avoidance score of Hofstede (2001); Emerging is an emerging markets dummy, equal to 1 if the firm is from an emerging market and 0 otherwise; Log Av. Market Cap. is the natural log of the average market capitalization of the acquiring form over time; and Industry Effects are dummies that are equal to 1 if the firm is from a specific industry (measured by the 2-digit SIC code) and 0 otherwise. We compute robust standard errors controlling for clustering at the country level and report t-statistics in parentheses where we indicate significance at the 10%, 5%, and 1% levels by *, **, ***, respectively.
(1) (2) (3)
Uncertainty Avoidance -0.0093*** -0.0088*** -0.0098***
(-2.66) (-2.64) (-2.97)
Emerging -0.6609*** -0.6552*** -0.6449***
(-4.94) (-4.64) (-4,44)
Log Av. Market Cap. 0.0801***
(8,18)
Industry Effects NO YES YES
N 7,681 7,681 7,681
36
Table 4: Diversification and Uncertainty Avoidance This table reports results for the Probit regression. We report Probit regression results for diversification dummy variables on uncertainty avoidance and several controls. The 4-digit (2-digit) diversification dummy is equal to 1 if the acquiring firm conducts a takeovers of firm that is outside its own industry (measured by the difference in the 4-digit (2-digit) SIC code) and 0 otherwise. The diversification variable based on 4-digit SIC codes measures all diversifying takeover activity, whereas the diversification variable based on 2-digit SIC codes measures major diversifying takeover activity. Uncertainty Avoidance is the uncertainty avoidance score of Hofstede (2001); Rel. Deal Size is computed as the size of the deal divided by the market capitalization of the firm; Log Market Cap. is the natural logarithm of the size of the acquiring firm (measured in US dollars); Time Effects are dummies equal to 1 if the takeover took place in a given year and 0 otherwise; and Industry Effects are dummies that are equal to 1 if the firm is from a specific industry (measured by the 2-digit SIC code) and 0 otherwise. The first two columns report Clustered - Probit results, where we compute robust standard errors controlling for clustering at the country level. The last two columns report the Fama-McBeth (1973) estimator based on probit regressions for each year. We report t-statistics in parentheses and indicate significance at the 10%, 5%, and 1% levels by *, **, ***, respectively.
Clustered – Probit Fama-McBeth
4-digit SIC 2-digit SIC 4-digit SIC 2-digit SIC
Uncertainty Avoidance 0.0034* 0.0038** 0.0025* 0.0038**
(1.75) (2.15) (1.90) (2.59)
Rel. Deal Size -0.125*** -0.148*** -0.005 -0.040
(-3.45) (-3.13) (-0.19) (-1.61)
Log Market Cap. 0.012*** 0.015*** 0.032*** 0.039***
(2.77) (2.71) (3.15) (4.22)
Time Effects YES YES - -
Industry Effects YES YES YES YES
N 25,741 25,741
37
Table 5: Cumulative Abnormal Returns and Uncertainty Avoidance This table reports results for clustered OLS regressions of the Cumulative Abnormal Return (CAR) around takeover announcements over the period January 1990 to August 2008 on uncertainty avoidance and various control variables. CAR is measured as the cumulative return of the acquiring firm over the period one day before the announcement to one day after the announcement. Uncertainty Avoidance is the uncertainty avoidance score of Hofstede (2001); Rel. Deal Size is computed as the size of the deal divided by the market capitalization of the firm; Log Market Cap. is the natural logarithm of the size of the acquiring firm (measured in US dollars); Country Divers. is a dummy variable equal to 1 if the acquiring firm conducts a takeovers of firm that is outside its own country and 0 otherwise; Industry Divers. is a dummy variable equal to 1 if the acquiring firm conducts a takeovers of firm that is outside its own industry (measured by the difference in the 2-digit SIC code) and 0 otherwise; Prior Acquisitions is a count variable indicating the number of prior acquisitions the firm has already conducted in the sample period; French is a dummy variable that is equal to 1 if the country has French civil law as legal origin and 0 otherwise; German is a dummy variable that is equal to 1 if the country has German civil law as legal origin and 0 otherwise; Scandinavian is a dummy variable that is equal to 1 if the country has Scandinavian law as legal origin and 0 otherwise; Time Effects are dummies equal to 1 if the takeover took place in a given year and 0 otherwise; and Industry Effects are dummies that are equal to 1 if the firm is from a specific industry (measured by the 2-digit SIC code) and 0 otherwise. We compute robust standard errors controlling for clustering at the country level and report t-statistics in parentheses. Significance at the 10%, 5%, and 1% levels are indicated by *, **, ***, respectively.
(1) (2) (3) (4) (5) (6) (7)
Uncertainty Avoidance 0.016*** 0.015*** 0.015*** 0.014*** 0.013*** 0.014*** 0.024***
(6.26) (6.08) (5.98) (4.99) (4.95) (5.18) (3.97)
Rel. Deal Size 0.668*** 0.670*** 0.669*** 0.658*** 0.660*** 0.659*** 0.657***
(4.29) (4.23) (4.04) (4.64) (4.42) (4.40) (4.42)
Log Market Cap. -0.348*** -0.359*** -0.359*** -0.353*** -0.353*** -0.365*** -0.361***
(-10.69) (-9.68) (-9.50) (-10.73) (-9.99) (-10.41) (-10.85)
Country Divers. 0.427*** 0.428*** 0.316* 0.321* 0.325* 0.316*
(3.12) (3.17) (1.79) (1.84) (1.88) (1.83)
Industry Divers. -0.087 -0.089* -0.082 -0.086 -0.088 -0.089
(-1.58) (-1.69) (-1.21) (-1.32) (-1.35) (-1.35)
Prior Acquisitions 0.009*** 0.009**
(2.93) (2.74)
French -0.369
(-1.24)
German -0.514*
(-1.79)
Scandinavian 0.707***
(2.85)
Time Effects NO NO YES NO YES YES YES
Industry Effects NO NO NO YES YES YES YES
N 25,750 25,750 25,750 25,750 25,750 25,750 25,750
R2 0.0162 0.0170 0.0182 0.0234 0.0246 0.0247 0.0251
38
Table 6: Cumulative Abnormal Returns and Uncertainty Avoidance (Fama-McBeth) This table reports Fama-McBeth results for the Cumulative Abnormal Return (CAR) around takeover announcements over the period January 1990 to August 2008 on uncertainty avoidance and various control variables. CAR is measured as the cumulative return of the acquiring firm over the period one day before the announcement to one day after the announcement. Uncertainty Avoidance is the uncertainty avoidance score of Hofstede (2001); Rel. Deal Size is computed as the size of the deal divided by the market capitalization of the firm; Log Market Cap. is the natural logarithm of the size of the acquiring firm (measured in US dollars); Country Divers. is a dummy variable equal to 1 if the acquiring firm conducts a takeovers of firm that is outside its own country and 0 otherwise; Industry Divers. is a dummy variable equal to 1 if the acquiring firm conducts a takeovers of firm that is outside its own industry (measured by the difference in the 2-digit SIC code) and 0 otherwise; Prior Acquisitions is a count variable indicating the number of prior acquisitions the firm has already conducted in the sample period; French is a dummy variable that is equal to 1 if the country has French civil law as legal origin and 0 otherwise; German is a dummy variable that is equal to 1 if the country has German civil law as legal origin and 0 otherwise; Scandinavian is a dummy variable that is equal to 1 if the country has Scandinavian law as legal origin and 0 otherwise; and Industry Effects are dummies that are equal to 1 if the firm is from a specific industry (measured by the 2-digit SIC code) and 0 otherwise. We compute Fama-McBeth standard errors and report t-statistics in parentheses. Significance at the 10%, 5%, and 1% levels are indicated by *, **, ***, respectively.
(1) (2) (3) (4) (5)
Uncertainty Avoidance 0.009*** 0.008*** 0.010*** 0.010*** 0.023***
(2.83) (2.82) (3.31) (3.19) (4.83)
Rel. Deal Size 0.692*** 0.694*** 0.589*** 0.579*** 0.595**
(3.27) (3.30) (2.72) (2.69) (2.72)
Log Market Cap. -0.363*** -0.370*** -0.358*** -0.364*** -0.363***
(-9.11) (-9.91) (-10.89) (-10.79) (-10.56)
Country Divers. 0.321*** 0.195* 0.197* 0.193*
(2.92) (1.69) (1.72) (1.70)
Industry Divers. -0.123 -0.195 -0.202* -0.205*
(-1.34) (-1.64) (-1.70) (-1.74)
Prior Acqs. -0.027 -0.025
(-1.14) (-1.10)
French -0.477*
(-1.77)
German -0.628***
(3.18)
Scandinavian 0.616
(1.44)
Industry Effects NO NO YES YES YES
39
Table 7: Cumulative Abnormal Returns and Uncertainty Avoidance for
Different Sub-Samples This table reports results for clustered OLS regressions of the Cumulative Abnormal Return (CAR) around takeover announcements on uncertainty avoidance and various control variables. CAR is measured as the cumulative returns of the acquiring firm over the period one day before the announcement to one day after the announcement. Uncertainty Avoidance is the uncertainty avoidance score of Hofstede (2001); Rel. Deal Size is computed as the size of the deal divided by the market capitalization of the firm; Log Market Cap. is the natural logarithm of the size of the acquiring firm (measured in US dollars); Country Divers. is a dummy variable equal to 1 if the acquiring firm conducts a takeovers of firm that is outside its own country and 0 otherwise; Industry Divers. is a dummy variable equal to 1 if the acquiring firm conducts a takeovers of firm that is outside its own industry (measured by the difference in the 2-digit SIC code) and 0 otherwise; Prior Acquisitions is a count variable indicating the number of prior acquisitions the firm has already conducted in the sample period; French is a dummy variable that is equal to 1 if the country has French civil law as legal origin and 0 otherwise; German is a dummy variable that is equal to 1 if the country has German civil law as legal origin and 0 otherwise; Scandinavian is a dummy variable that is equal to 1 if the country has Scandinavian law as legal origin and 0 otherwise; and Industry Effects are dummies that are equal to 1 if the firm is from a specific industry (measured by the 2-digit SIC code). Column 1 presents the results for the period 1990-1999; column 2 presents the results for the period 2000-2008; column 3 presents the results for the model excluding the US; column 4 presents the results for the model including only developed markets; and column 5 presents the results for the model including only emerging markets. For all models we compute robust standard errors controlling for clustering at the country level and report t-statistics in parentheses. Significance at the 10%, 5%, and 1% levels are indicated by *, **, ***, respectively.
Pre
2000 Post 2000
Excluding US
Developed Markets
Emerging Markets
Uncertainty Avoidance 0.014 0.027*** 0.025*** 0.022*** 0.007
(1.07) (5.40) (4.22) (3.25) (0.66)
Rel. Deal Size 0.893*** 0.478*** 0.430* 0.686*** 0.096
(3.16) (3.79) (1.74) (4.69) (0.18)
Log Market Cap. -0.279*** -0.414*** -0.426*** -0.357*** -0.676**
(-9.86) (-9.20) (-5.61) (-10.79) (-2.28)
Country Divers. 0.256 0.357** 0.631** 0.270 1.491*
(1.44) (2.03) (2.67) (1.60) (1.90)
Industry Divers. -0.159** -0.070 -0.037 -0.075 -1.046***
(-2.07) (-0.62) (-0.24) (-1.07) (-3.20)
Prior Acquisitions -0.015*** 0.019*** -0.004 0.009*** -0.128
(-2.99) (4.82) (-0.23) (2.79) (-1.24)
French -0.054 -0.432** -0.356 -0.259 -0.104
(-0.09) (-2.04) (-1.27) (-0.78) (-0.12)
German -0.523 -0.538* -0.490* -0.365 -1.513**
(-1.12) (-1.92) (-1.85) (-1.20) (-2.92)
Scandinavian 0.887* 0.659*** 0.633** 0.736*** -
(1.94) (3.14) (2.63) (3.21)
Time Effects YES YES YES YES YES
Industry Effects YES YES YES YES YES
Number of countries included 38 39 38 26 13
N 10,795 14,955 8,291 25,205 545
R2 0.0257 0.0300 0.0390 0.0251 0.2082
40
Table 8: Omitted Variables This table reports results for clustered OLS regressions of the Cumulative Abnormal Return (CAR) around takeover announcements over the period January1990 to August 2008 on uncertainty avoidance and various control variables. CAR is measured as the average cumulative return of the acquiring firm over the period one day before the announcement to one day after the announcement. Uncertainty Avoidance is the uncertainty avoidance score of Hofstede (2001); Payment in Shares is a dummy variable equal to 1 if the takeover was completely financed by shares and 0 otherwise; Mixed Payment is a dummy variable equal to 1 if the takeover was financed by a mix of shares and cash and 0 otherwise; Anti-Self-Dealing is the anti-self-dealing index of Djankov et al. (2008); Disclosure is the disclosure index by Bushman and Piotroski (2004); Ownership Concentration is the ownership concentration measure used by La Porta et al. (2006); Individualism is the individualism score of Hofstede (2001); Masculinity is the masculinity score of Hofstede (2001); Power Distance is the power distance score of Hofstede (2001); Other controls represents all other control variables as in column (7) of Table 5; Time Effects are dummies equal to 1 if the takeover took place in a given year and 0 otherwise; and Industry Effects are dummies that are equal to 1 if the firm is from a specific industry (measured by the 2-digit SIC code) and 0 otherwise. We compute robust standard errors controlling for clustering at the country level and report t-statistics in parentheses. Significance at the 10%, 5%, and 1% levels are indicated by *, **, ***, respectively.
(1) (2) (3) (4) (5)
Uncertainty Avoidance 0.033*** 0.023*** 0.022*** 0.019*** 0.024***
(3.93) (4.44) (3.63) (3.24) (4.99)
Payment in Shares -0.260***
(-3.41)
Mixed Payment -0.069
(-0.91)
Anti-Self-Dealing -0.688
(-1.42)
Disclosure -0.429
(-1.20)
Ownership Concentration -0.426
(-0.79)
0.008
(1.48)
Individualism -0.008
(-1.09)
Masculinity -0.003
(-0.49)
Power Distance
Other Controls YES YES YES YES YES
Time Effects YES YES YES YES YES
Industry Effects YES YES YES YES YES
Countries 37 39 36 36 39
N 13,213 25,750 25,642 25,642 25,750
R2 0.0247 0.0251 0.0252 0.0252 0.0253
41
Table 9: Interaction of Uncertainty Avoidance and Relative Deal Size This table reports results for clustered OLS and Fama-McBeth (1973) regressions of the Cumulative Abnormal Return (CAR) around takeover announcements over the period January 1990 to August 2008 on interaction terms of uncertainty avoidance and relative deal size, and various control variables. CAR is measured as the average cumulative return of the acquiring firm over the period one day before the announcement to one day after the announcement. In the first two columns, UA1 is the uncertainty avoidance score of Hofstede (2001) if the relative deal size was in the first quartile; UA2, UA3, and UA4 are defined likewise. In the last two columns, UA1 is the uncertainty avoidance score of Hofstede (2001) if the relative deal size was in the first quartile (relative to the size of the firm); UA2, UA3, and UA4 are defined likewise. Rel. Deal Size is computed as the size of the deal divided by the market capitalization of the firm; Log Market Cap. is the natural logarithm of the size of the acquiring firm (measured in US dollars); Country Divers. is a dummy variable equal to 1 if the acquiring firm conducts a takeovers of firm that is outside its own country and 0 otherwise; Industry Divers. is a dummy variable equal to 1 if the acquiring firm conducts a takeovers of firm that is outside its own industry (measured by the difference in the 2-digit SIC code) and 0 otherwise; Prior Acquisitions is a count variable indicating the number of prior acquisitions the firm has already conducted in the sample period; French is a dummy variable that is equal to 1 if the country has French civil law as legal origin and 0 otherwise; German is a dummy variable that is equal to 1 if the country has German civil law as legal origin and 0 otherwise; Scandinavian is a dummy variable that is equal to 1 if the country has Scandinavian law as legal origin and 0 otherwise; Time Effects are dummies equal to 1 if the takeover took place in a given year and 0 otherwise; and Industry Effects are dummies that are equal to 1 if the firm is from a specific industry (measured by the 2-digit SIC code) and 0 otherwise. We compute robust standard errors controlling for clustering at the country level and report t-statistics in parentheses. Significance at the 10%, 5%, and 1% levels are indicated by *, **, ***, respectively.
Relative Deal Size
Clustered OLS Fama-McBeth
UA1 0.020*** 0.019*** (3.21) (3.43) UA2 0.022*** 0.022*** (3.63) (4.14) UA3 0.026*** 0.024*** (4.41) (4.64) UA4 0.030*** 0.026*** (4.28) (6.16) Rel. Deal Size 0.453** 0.481** (2.27) (1.99) Log Market Cap. -0.332*** -0.341*** (-10.38) (-8.38) Country Divers. 0.335* 0.195* (1.87) (1.74) Industry Divers. -0.068 -0.191 (-0.98) (-1.64) Prior Acquisitions 0.010*** -0.026 (3.42) (-1.08) French -0.384 -0.460* (-1.27) (-1.67) German -0.465 -0.563*** (-1.65) (-2.94) Scandinavian 0.707*** 0.557 (2.76) (1.30) Time Effects YES - Industry Effects YES YES N 25,750 R2 0.025 * Wald Tests:
UA1 – UA2 = 0 0.14 UA2 – UA3 = 0 18.49*** UA3 – UA4 = 0 1.55 UA1 – UA2 – UA3 – UA4 = 0 9.53***
42
Figure 1: CEO’s Decision Problem
E[U]
ΦS
E[U(W + C( A))]
U(W - L)
U(W)
δ~
1 - ΦS
ΦD
1 - ΦD