Embed Size (px)
Citation preview

Culture Change The EHS Professionals Role
ASSE SF PDC 2012
Steve Bowers, CSP
President
1
This material has been published and copyrighted by GSMC. All rights reserved. No part of this material may be reproduced in any form by any electronic or mechanical means (including photocopying, recording, or information storage and retrieval) without permission in writing from GSMC.

Today’s Journey
• Safety Professional Defined
• Construction Safety- State of the State
• The Need for Change
• Our we Focusing on the Right Things
• How Culture Effects Safety
• Effective Cultural Change Tools!
2

Safety Professional Defined
• ASSE defines a Safety Professional as:
“an individual who by nature of academic preparation, work experience, and
accredited certification or licensing has mastered and applies a recognized body of
knowledge to prevent injury, illness, property and environmental damage, while
adhering to the code of professional conduct.”
3

Safety Professional Requirements
– Education, training and experience in a common body of knowledge;
– A fundamental knowledge of: • Physics
• Chemistry
• Biology
• Physiology
• Statistics
• Mathematics
• Computer science
• Engineering mechanics
• Industrial processes
• Business
• Communication
• Psychology.
4

Safety Professional Qualifications
• Expertise – Specialist – Generalist
• Experience • Knowledge • Leader • Educator • Creator/Writer • Coach & Mentor • Change Agent • Improvement Oriented
• Skills – Technically Proficient – Interpersonal Intelligence – Management – Computer literacy
• Word, Excel, PowerPoint, etc.
– Communicator – Strategist – Statistician – Tactician – Motivator – Visionary
5
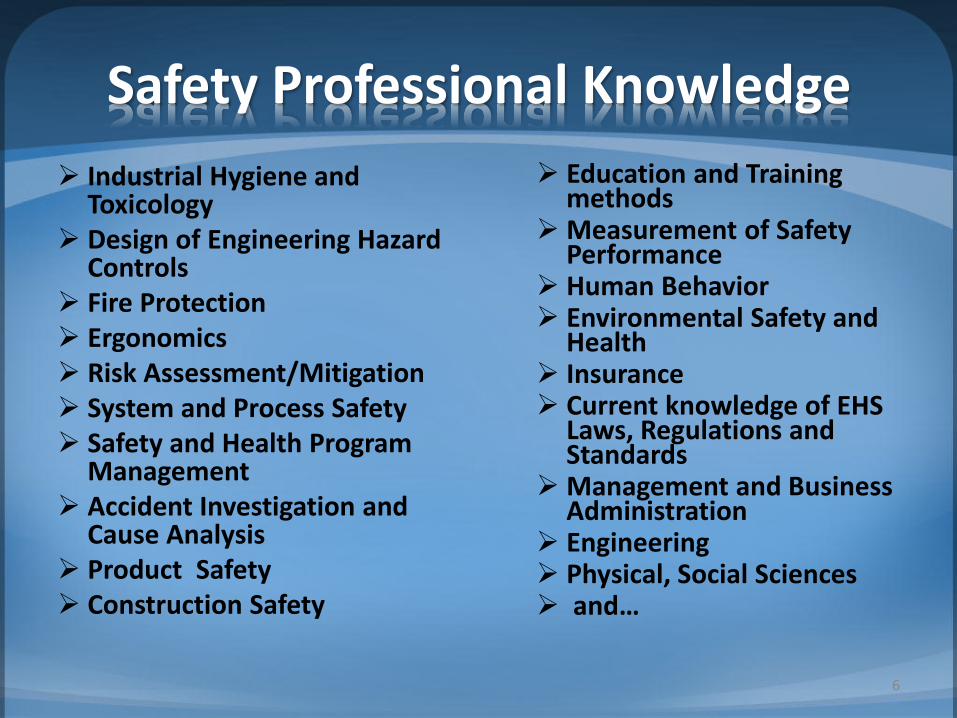
Safety Professional Knowledge
Industrial Hygiene and Toxicology
Design of Engineering Hazard Controls
Fire Protection Ergonomics Risk Assessment/Mitigation System and Process Safety Safety and Health Program
Management Accident Investigation and
Cause Analysis Product Safety Construction Safety
Education and Training methods
Measurement of Safety Performance
Human Behavior Environmental Safety and
Health Insurance Current knowledge of EHS
Laws, Regulations and Standards
Management and Business Administration
Engineering Physical, Social Sciences and…
6

Safety Professional Role
• Protect PPE:
–People –Property – Environment
• Serve the Public, Employees, Employers, Clients and the Society with Fidelity, Honesty and Impartiality.
• Achieve & Maintain Competency • Avoid Conflicts of Interest and Compromise of
Professional Conduct. • Maintain Confidentiality of Privileged Information.
7

What About Our Industry?
• Everyday in construction we are Challenged with: – Problems, Incidents, Near Misses
– Employee Injuries & Illness
– New Projects/Staffing Issues
– New Regulations/Interpretations
– Communication Issues
• Our companies look to us to do all the right things
• We are responsible to do what Safety Professionals do
So… How are WE doing in the Construction Industry?
8
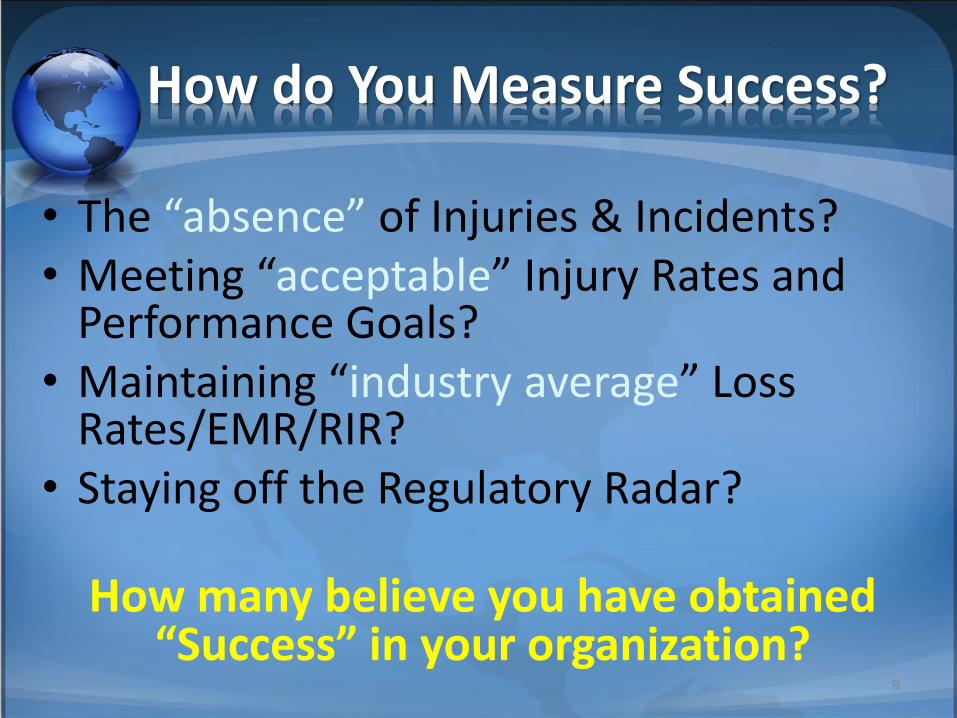
How do You Measure Success?
• The “absence” of Injuries & Incidents? • Meeting “acceptable” Injury Rates and
Performance Goals? • Maintaining “industry average” Loss
Rates/EMR/RIR? • Staying off the Regulatory Radar?
How many believe you have obtained “Success” in your organization?
9
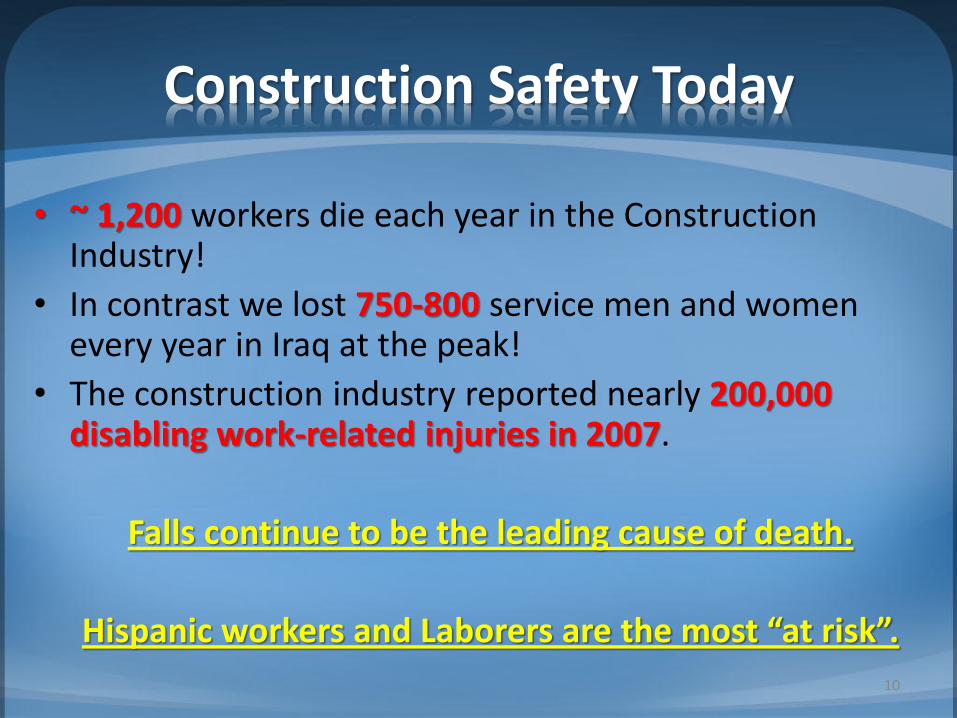
Construction Safety Today
• ~ 1,200 workers die each year in the Construction Industry!
• In contrast we lost 750-800 service men and women every year in Iraq at the peak!
• The construction industry reported nearly 200,000 disabling work-related injuries in 2007.
Falls continue to be the leading cause of death.
Hispanic workers and Laborers are the most “at risk”.
10

How WE Compare!
11 4.4
4.8
5.0
5.9
6.0
7.0
9.8
11.1
14.0
14.0
Sweden
Switzerland
Canada (Ontario)
Australia
Germany
Norway
Finland
United States
Spain
Italy
Deaths per 100,000 workers
Data: 2008 CPWR Study

Death Rates by Industry
12
4.2
1.0
2.1
2.3
3.0
4.5
11.1
12.7
20.7
30.9
All industries
Finance
Services
Manufacturing
Wholesale and Retail
Public admin
Construction
Transportation
Mining
Agriculture
Rate per 100,000 full-time workers
Data: 2008 CPWR Study
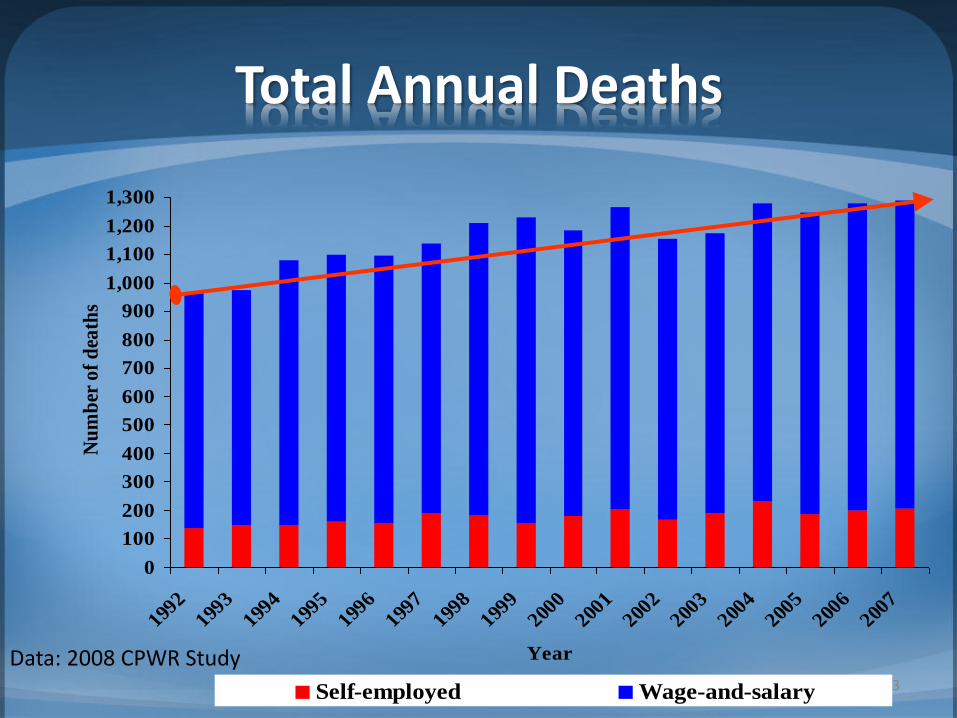
Total Annual Deaths
13
0
100
200
300
400
500
600
700
800
900
1,000
1,100
1,200
1,300
1992
1993
1994
1995
1996
1997
1998
1999
2000
2001
2002
2003
2004
2005
2006
2007
Year
Nu
mb
er o
f d
eath
s
Self-employed Wage-and-salary
Data: 2008 CPWR Study
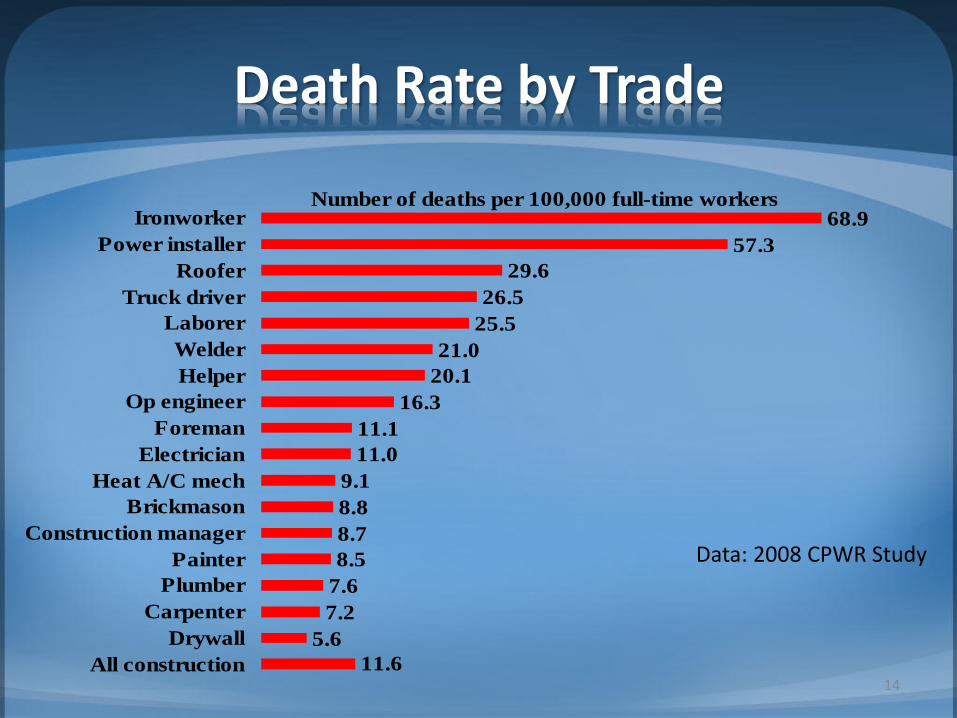
Death Rate by Trade
14 11.6
5.6
7.2
7.6
8.5
8.7
8.8
9.1
11.0
11.1
16.3
20.1
21.0
25.5
26.5
29.6
57.3
68.9
All construction
Drywall
Carpenter
Plumber
Painter
Construction manager
Brickmason
Heat A/C mech
Electrician
Foreman
Op engineer
Helper
Welder
Laborer
Truck driver
Roofer
Power installer
IronworkerNumber of deaths per 100,000 full-time workers
Data: 2008 CPWR Study

Total Deaths by Trade 2003-2005
36
53
54
65
65
70
98
108
143
152
159
198
202
220
297
316
884
Drywall
Brickmason
Power installer
Welder
Helper
Heat A/C mech
Ironworker
Plumber
Painter
Op engineer
Truck driver
Roofer
Electrician
Construction manager
Foreman
Carpenter
LaborerNumber of deaths
15
Data: 2008 CPWR Study

Leading Causes of Deaths
16
50
100
150
200
250
300
350
400
450
1992 1993 1994 1995 1996 1997 1998 1999 2000 2001 2002 2003 2004 2005
Year
Nu
mb
er o
f d
eath
s
Fall to lower levelContact with electric currentHighway accidentStruck by object
Data: 2008 CPWR Study

Death Rate Trend
17
0
5
10
15
20
25
30
35
1992 1993 1994 1995 1996 1997 1998 1999 2000 2001 2002 2003 2004 2005
Year
Rat
e p
er 1
00,0
00 f
ull-
tim
e w
ork
ers
Construction Agriculture Mining Manufacturing
Data: 2008 CPWR Study

DAWC Rate Trend
18
100
200
300
400
500
600
1992 1993 1994 1995 1996 1997 1998 1999 2000 2001 2002 2003 2004 2005
Year
Ra
te p
er 1
0,0
00
fu
ll-t
ime
wo
rker
s
Construction Agriculture Mining Manufacturing
Data: 2008 CPWR Study

Recordable Injury Trend
19
US Construction Industry (OSHA), 5.4
0.00
2.00
4.00
6.00
8.00
10.00
1994 1995 1996 1997 1998 1999 2000 2001 2002 2003 2004 2005 2006 2007

SO…
20
100
200
300
400
500
600
1992 1993 1994 1995 1996 1997 1998 1999 2000 2001 2002 2003 2004 2005
Year
Ra
te p
er 1
0,0
00
fu
ll-t
ime
wo
rker
s
Construction Agriculture Mining Manufacturing
WE ARE GREAT AT DROPPING DAY AWAY CASE RATES

And…
21
US Construction Industry (OSHA), 5.4
0.00
2.00
4.00
6.00
8.00
10.00
1994 1995 1996 1997 1998 1999 2000 2001 2002 2003 2004 2005 2006 2007
WE ARE EVEN BETTER AT PREVENTING INJURIES!
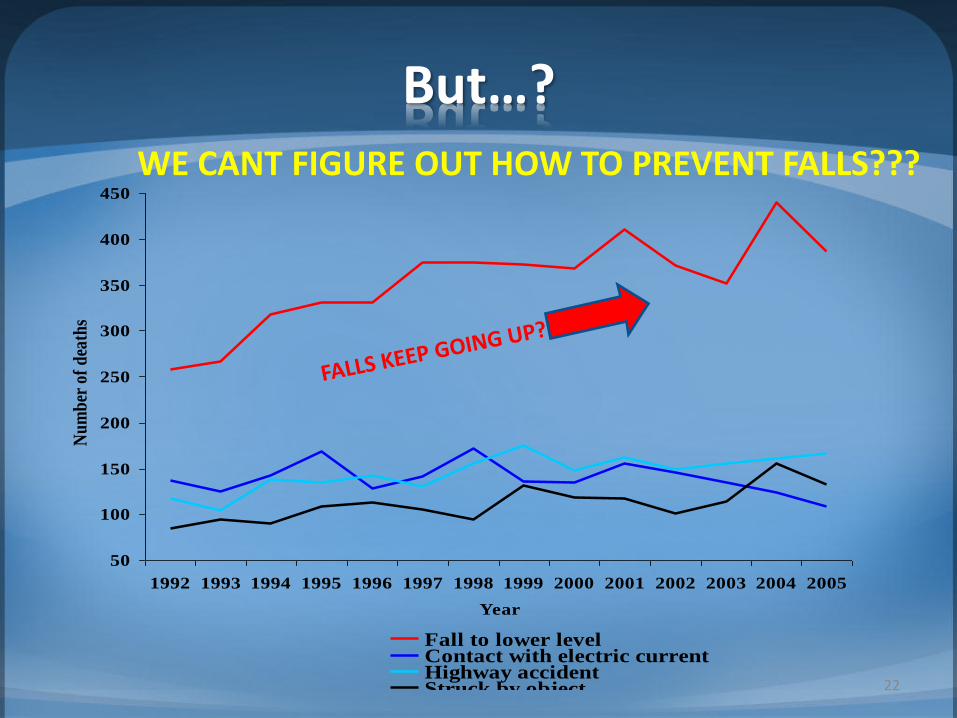
But…?
22
50
100
150
200
250
300
350
400
450
1992 1993 1994 1995 1996 1997 1998 1999 2000 2001 2002 2003 2004 2005
Year
Nu
mb
er o
f d
eath
s
Fall to lower levelContact with electric currentHighway accidentStruck by object
WE CANT FIGURE OUT HOW TO PREVENT FALLS???

AND…
23
0
5
10
15
20
25
30
35
1992 1993 1994 1995 1996 1997 1998 1999 2000 2001 2002 2003 2004 2005
Year
Rat
e p
er 1
00,0
00 f
ull-
tim
e w
ork
ers
Construction Agriculture Mining Manufacturing
PREVENTING DEATHS IS SEEMINGLY BEYOND OUR ABILITIES…
IF INJURIES & SEVERITY HAVE DROPPED DRAMATICALLY… WHY NOT DEATHS!

Performance Discussion
• Why have injury rates dropped while death rates remain steady? – Is construction just Inherently Dangerous?
– Are we Focused on the Right Things?
– Are Unsafe Acts and Behaviors the only problem?
Could WE be part of the problem?
24

Are we Focusing on the Right Things?
• What is “acceptable” performance?
• Are actual injuries reported… higher or lower? Why?
• Do Safety Incentives reduce injuries… or?
• How good are you…
– Do you include management & administrative hours in your rate calculations?
25

“Our” Current State
• Too many “Safety Professionals” are: – Ineffective
– Unmotivated
– Accepting Status Quo!
• Many lack knowledge/understanding of regulations & best known methods: – silo effect
– failure to benchmark
• Many companies don't see safety as an expertise
• WE are not aligned on critical safety management practices
26

So… What is our Greatest Value?
LEADERSHIP
OUR ABILITY TO AFFECT CHANGE!
27

How can we have the greatest Impact?
Leading Change of YOUR Safety Culture
28

Culture, Behavior & Leadership
• Culture is to a group as personality is to an individual
• Cultural behaviors are learned… from the beliefs, values and shared assumptions of both the workforce and management
• Cultures, like humans, strive for stability, consistency and meaning
• Cultures “Adapt” to “Cultural Norms”
29

Cultural Adaptation
Culture adaptation is an evolutionary process by which humans modify habits and customs to fit in
within existing norms.
Your Safety Culture is a subset of your Corporate Culture
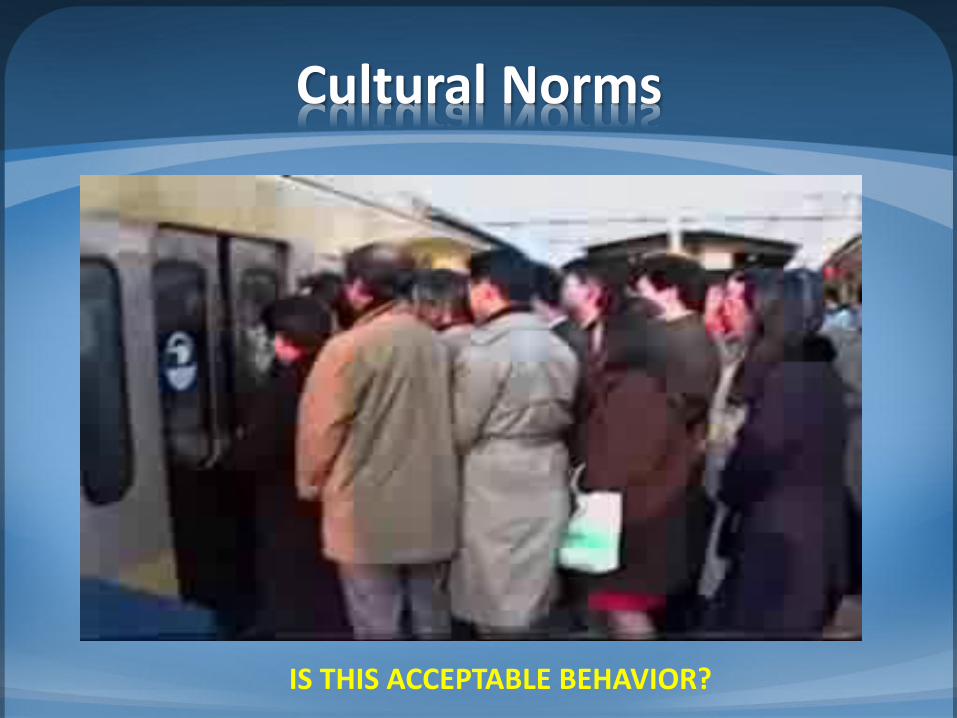
Cultural Norms
IS THIS ACCEPTABLE BEHAVIOR?

Cultural Norms
IS THIS ACCEPTABLE BEHAVIOR?

Cultural Norms
IS THIS ACCEPTABLE BEHAVIOR?

Changing a Safety Culture
• Culture Change is dependent on 5 Critical Elements:
–Co-Created & Shared Vision of the Change
–Demonstrated Executive Leadership
–100% Commitment from all levels
– Effective Communication
–Accountability to Embrace the Change!
34

Vision & Change
• Vision is the ability to look ahead and define what you want the future to look like.
• Vision is about establishing Change • A defined & shared Vision empowers
both Leaders & Followers to embrace Change
• We can Change our industry thru a Collective Vision!
35

36
BEHAVIORS
ATTITUDES ACTIONS
UNSAFE CONDITIONS INJURIES & INCIDENTS
POLICIES & PROCEDURES
HIGHLY VISIBLE
INVISIBLE
BELIEFS
VALUES
PERCEPTIONS
NORMS
MOTIVATORS
CORPORATE CULTURE
TRUST RESPECT
ASSUMPTIONS
UNREPORTED INJURIES & INCIDENTS
OUR TRUE VALUE TO AN ORGANIZATION LIES BELOW THE WATER LINE

SAFETY’S ROLE IN THE VISION
• Successful Safety Leaders possess:
– Excellent Leadership Skills
– Excellent Management Skills
– Ability to Coach & Mentor Project Executives
– Even Keel and Cool Demeanor
– Trust & Respect of Workforce
– Vision, Passion and Tenacity
THE ABILITY TO AFFECT CHANGE!
37

Safety Leadership Qualities
• Safety Leaders are responsible for: – Establishing Corporate Goals/Vision
– Creating Safety Leaders/Role Models
– Implementing World Class Safety Programs
– Developing Safety Expertise of Staff & Management
– Evaluating Cultures, Behaviors & Trends
– Enabling Change at ALL levels
– Role Modeling Trust & Respect
– Taking Ownership for Cultural Change!
38

Managements Role
• Executive Leadership is vital to creating Change
– Nearly impossible to sustain without it. (flavor of the month)
• Executive Management MUST be responsible for: – Sharing the Vision – Establishing Success Criteria/Performance Goals – Communicating Expectations – Role Modeling Expected Behaviors – Holding Management Accountable – Rewarding & Recognizing Acceptable Performance – Leading the Organization to Success!
39

Management & Safety Culture
• Once leadership establishes its commitment to safety, Cultural Boundaries are formed.
• Your Leaders Actions demonstrate their commitment: – What management pays attention to:
• SAFETY vs. SCHEDULE vs. CO$T • Decisions that are made & why
– What management ignores: • Employee concerns, feedback, suggestions • Production or Schedule overriding safety issues
– What management measures and how they respond: • What does management really care about?
40

Management Engagement
• Key Management Leadership Qualities
– Personal Commitment to Safety
– Positive Role Model of Safe Behaviors
– Open 2-way Communication at all levels
– Demonstrated Engagement in all aspects of the Safety Program
– Understanding of “Behavior Based Safety”
– Management Accountability
– Active Participation in the Recognition Program
41

Employee Engagement
• Key employee needs: – Appreciated
– Respected
– Feel that management “cares” about their safety
• Employee perceptions represent the true safety culture
• The employees at greatest risk of injury must be: – Engaged
– Enabled
– Empowered
Before Cultural Change will be realized!
42
The 3 E’s in Employee
• Engaged in the development, implementation and continuous improvements of the safety program
• Enabled to participate in safety committees, task forces, provide direct feedback, recognize other employees, provide feedback on supervisors
• Empowered to coach peers, subordinates and supervisors, to stop unsafe acts and correct unsafe conditions.
High levels of Trust and Respect must exist between management and employees before sustainable change can occur!
43

Effective Safety Training
• Most training programs are dry, boring and ineffective in educating the workforce
• Effective Training must be designed to address the needs of the employees, not to satisfy regulatory requirements
• Training should include feedback from trainees to enable continuous improvements
44

Elements of Effective Training
• Key Elements of an Effective Safety Training Program include: – Trainers have the Greatest Impact on Effectiveness!
– Delivery is EVERYTHING! - the average attention span is 12 minutes
– Interaction - employees must be engaged to learn
– Clear, Concise & To The Point - remove non value added material
– Test for Competence – ensure that knowledge has been transferred
45

Best Known Methods
• World Class Results depend on utilizing
Best Known Methods
• Improve your methods by Benchmarking:
– World Class Organization
– Competitors
– Trade Organizations
– Consultants
46

Executive Safety Structure
• Ideal Safety Structure: – VP level or higher with Safety Responsibilities
– Safety department Head is a VP or reports directly to President… but NEVER to operations
• Safety is embedded as a Core Value
• Safety staff are highly respected and recognized as an integral component of the corporation
• Safety is acknowledged as a
Strategic Business Partner
47
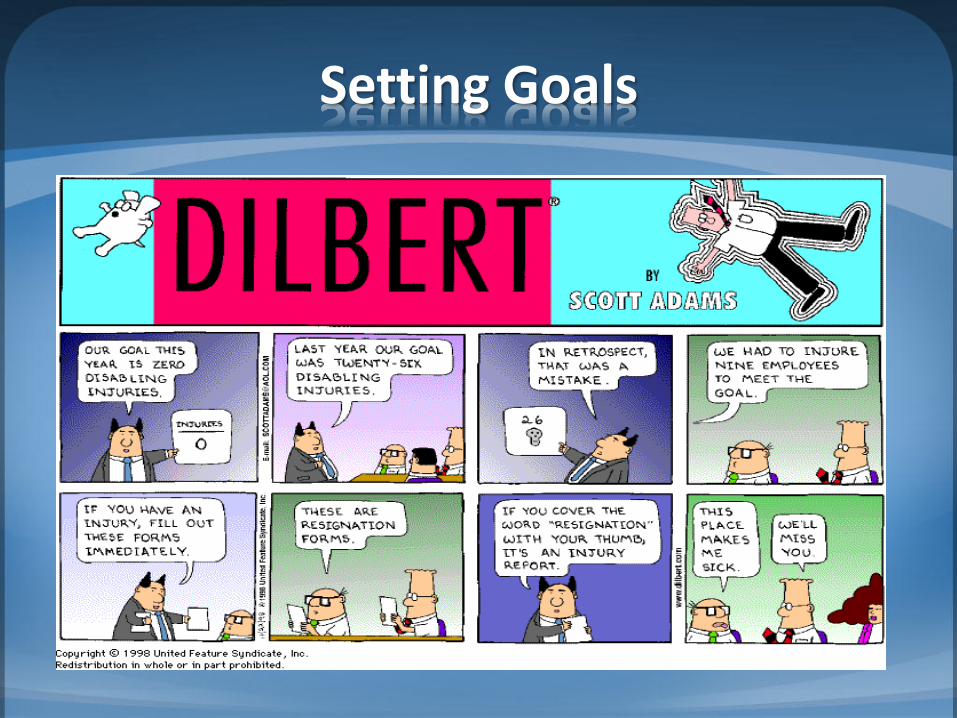
Setting Goals

Effective Goals & Indicators
• Setting safety goals other than zero sends the wrong message to your employees
• Reactive or lagging indicators measure what happened to Prevent Recurrence
• Proactive or leading indicators measure Culture, Leadership, Behaviors & Conditions to Prevent Occurrence
49

Proactive Indicators • Behaviors
– Behavioral Observation Process • Conditions
– Collecting data from field walks and employee feedback • Training
– Competency, Compliance and Retention testing of employees
• Work Planning – Use of JHA’s, Pre Task Planning, permits
• Management Leadership & Commitment – Measure time in field, Classroom Instruction, Leadership
efforts, % complete of assigned safety tasks • Project’s Cultural Maturity
– Project team performance assessments, contractor feedback, Safety Self Assessments, 3rd party audits
50
Recognition not Incentives
• Incentives create undesired results: – Non reporting of incidents – Hiding of injuries – Creates feelings of entitlement
• Positive Recognition Benefits: – Rewards Observed/Desired Behaviors and Performance – Effective as Spontaneous and Milestone Recognition – Encourages Employees to Maintain Recognized Behaviors – Employees Feel Appreciated – Engages Management and Field Personnel – Helps Sustain Functioning Culture
51

Continuous Improvement Processes
Keys to Sustaining a World Class Safety Culture
• All Injuries & Incidents must be analyzed to determine Root Cause & Preventative Measures
• Review (include employees) all Programs, Policies & Procedures annually to ensure material is up to date and useful to end users
• Self-performed or 3rd party assessments should be conducted to ensure the overall safety culture is healthy and program is meeting the needs of the organization
52

World Class Safety Programs
• Most organizations have safety programs that are designed to meet regulatory requirements…
NOT EMPLOYEE NEEDS!
• Safety Programs should: – Go above and beyond OSHA requirements
– Engage employees in their development
– Be living documents that change as conditions and needs change
– Protect your most valuable asset, your employees!
53

Value to the Bottom line
• World Class Safety Cultures instill loyalty and caring among employees.
• Managements role is to Empower, Engage & Energize Employees through committed leadership!
• Committed employees work harder, longer, more efficiently and have better attitudes about their job!
• Employees that BELIEVE their company cares about them, care about their company and the quality of the work they perform!
Safety Culture & Teamwork
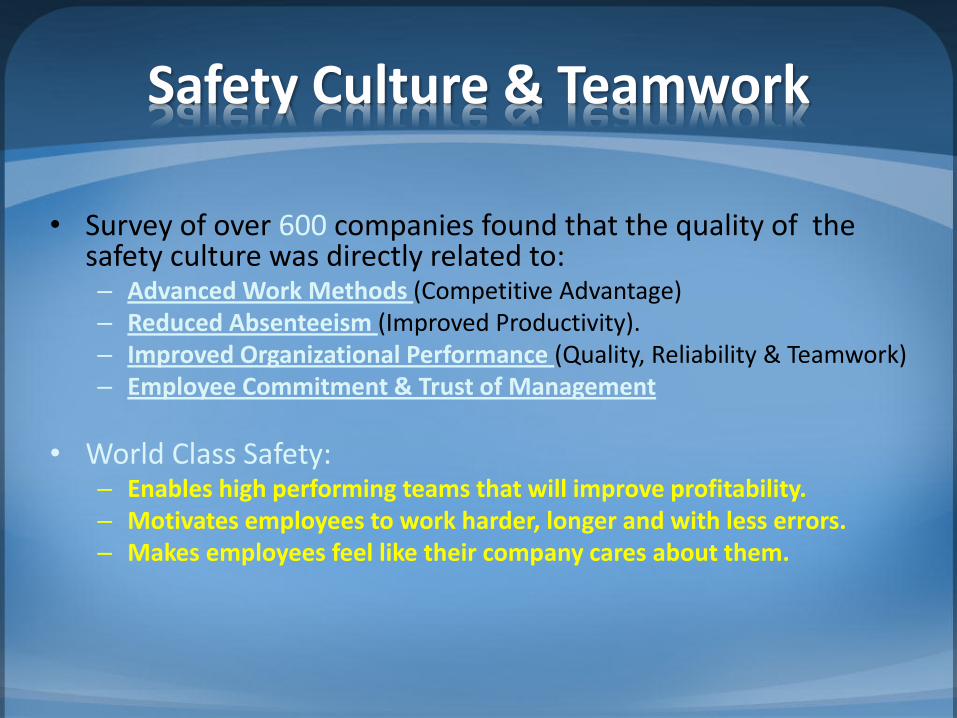
• Survey of over 600 companies found that the quality of the safety culture was directly related to: – Advanced Work Methods (Competitive Advantage) – Reduced Absenteeism (Improved Productivity). – Improved Organizational Performance (Quality, Reliability & Teamwork) – Employee Commitment & Trust of Management
• World Class Safety: – Enables high performing teams that will improve profitability. – Motivates employees to work harder, longer and with less errors. – Makes employees feel like their company cares about them.

World Class Programs
• World Class Safety Programs demand excellent processes, procedures and policies to exist.
• Surveys of companies with World Class Safety Cultures show: – Safety process expectations are mirrored across all other
functional areas. – Reliability improvements as high as a factor of 10 due to:
• Fewer human errors • Continuous Improvement Processes • Feedback Mechanisms
– Improvements in employee attitudes towards safety transferred over to all other functional areas.
Our Role in Leading Change
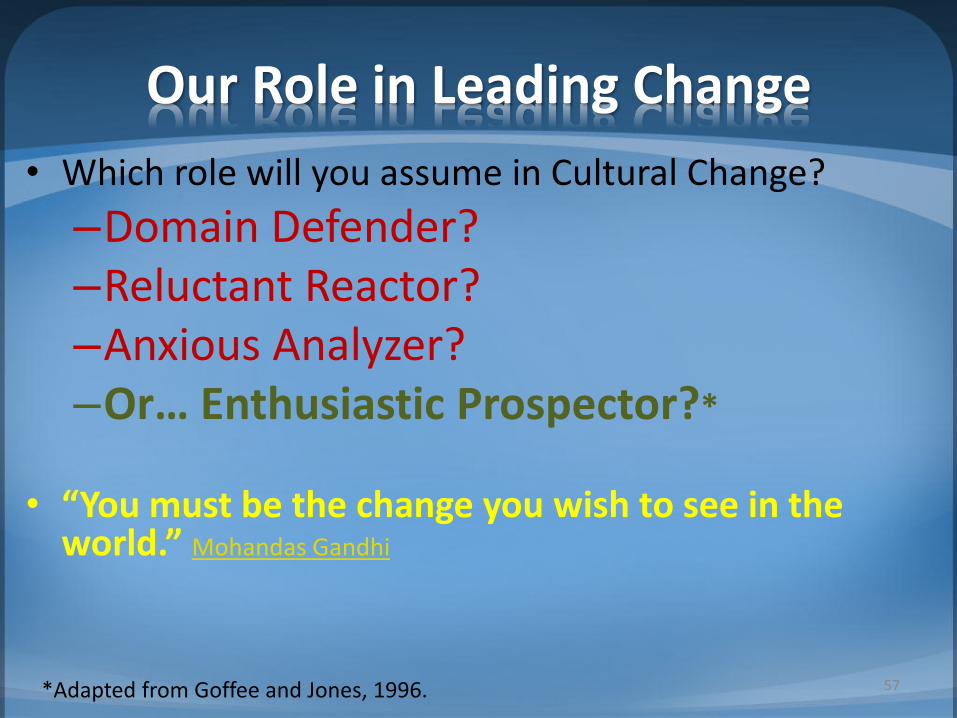
• Which role will you assume in Cultural Change?
–Domain Defender? –Reluctant Reactor? –Anxious Analyzer? –Or… Enthusiastic Prospector?*
• “You must be the change you wish to see in the
world.” Mohandas Gandhi
57 *Adapted from Goffee and Jones, 1996.

In Review
• A World Class Safety Culture depends on: – Knowledgeable, Engaged, Committed & Respected Safety
Leadership
– Executive Leadership & Commitment
– World Class Processes & Best Known Methods
– Employee Engagement, Trust & Respect
– Recognition of Desired Behaviors
– Leading & Lagging Indicators
– Effective Goals
– Effective Training & Communication
58