Embed Size (px)
Citation preview

D R A F T
Culture Matters: A Hierarchical Linear Random Parameters Model for Predicting Success of US Films in Foreign Markets
C. Samuel Craig William H. Greene Susan P. Douglas
Stern School of Business New York University
August 2003
8/27/03
1

Abstract
Culture matters in ways that are salient for products with significant
cultural content. In particular, the cultural context in which a product is launched
plays an important role in its success. The present study examines the impact of
cultural context on the box office performance of US films in foreign markets. A
hierarchical linear random parameters model is used to assess the impact of
national culture, degree of Americanization, US box office and film genre on
performance in eight foreign markets. The model allowed for film-specific
heterogeneity to be accounted for and for hypotheses to be tested at both the film
level and the country level. Results indicate that films perform better in countries
that are culturally closer to the US and those that have a higher degree of
Americanization. The genre of the film and US box office success also had a
significant impact on performance. Some implications are drawn for managers
releasing films in foreign markets.
2

Culture Matters: A Hierarchical Linear Random Parameters Model for Predicting Success of US Films in Foreign Markets
1. Introduction Film, along with other creative goods, represents a distinctive product category.
Each film is unique and demand for any given film is difficult to predict (DeVany and
Walls 1996, 1999). Even when a film uses the same talent, is of the same genre, is a
sequel or a new version of a previously released film, there is still considerable
uncertainty as to whether or not it will be successful. Caves (2000) characterizes this as,
“nobody knows.” Further, while consumer testing is often used to guide promotional
efforts and perhaps even change an ending, unlike other consumer products, films are not
designed systematically based on prior consumer research. Even where some market
research is undertaken, films remain a creation of the culture in which they are
developed. Films inevitably reflect the writer’s view, the director’s vision, and the actor’s
interpretation of the script, all of which are influenced by the cultural context.
The uniqueness of each film coupled with the limited ability to apply marketing
research to refine the product offering, results in considerable uncertainty about consumer
response to a given film. Previous research examining factors underlying box office
success in the film industry has focused primarily on distribution factors. In particular
attention has centered on the number of screens, the use of local (independent)
distributors, the size of the advertising budget and characteristics such as the presence of
stars and the genre of the film (Sawhney and Eliashberg 1996). These studies have
3

largely found the number of screens to be the most critical factor in affecting box office
revenues. With the exceptions of Neelameghan and Chintagunta (1999) and Elberse and
Eliashberg ( 2002), attention has focused on the US market. Little attention has been paid
to the context in which films are released or the factors underlying success in different
overseas markets.
This paper will examine the extent to which the cultural environment in which a
film is released affects its success. The study is based on data drawn from the
Variety.com website on the top 50 films in eight foreign countries for six consecutive
years. First, some background on the film industry and previous literature are reviewed.
Then, the research approach and the hierarchical regression model used to analyze the
data are presented. Next, the results are discussed and some conclusions drawn relating to
the role of cultural factors in the success of US films in international markets.
2. Background
2.1. The Film Industry
Film is the primary engine of the entertainment industry and the US is the
dominant player. Of the 256 top grossing films of all time in terms of non-US box office
(gross revenue of $100 million or more outside the US), all but six were US films and
three of these remaining films were from the UK (imbd.com). In aggregate, non-US
films accounted for only two percent of the total revenue. The pattern is consistent from
year to year. For example, in 2002 the top five films in Germany, UK, Australia, Spain,
Argentina, The Netherlands, Japan, South Korea, and China were US films, while in
Mexico and France, all but one of the top five films were from the US (Variety 2003a).
4

While studios generate revenue from multiple windows, the theatrical release
window is the most critical as it establishes the value of the film for subsequent windows,
such as pay-per-view, cable, home video, and broadcast TV. In addition to these
windows, successful films also represents substantial opportunities for licensing,
merchandising, and other entertainment products, such as TV shows, books, plays, and
theme park attractions. In 2002, theatrical release revenues from films in the US were
over $9.5 billion (MPA 2002) and US studios could expect to receive equivalent
theatrical revenue from foreign markets as well. In 2002, US theatrical revenue
represented only 9.7 percent of the total revenue studios received from key film release
windows (Variety 2003b).
The film industry is characterized by rapid new product development and heavy
marketing expenditures (Krider and Weinberg 1998, Litman 1983). In 2002 the average
major studio film cost almost $60 million to produce and another $30 million to promote
(MPA 2002). The heavy up front investment and short life of a film means that it is
critical to promote it heavily and release it simultaneously on multiple screens. Marketing
efforts create audience interest prior to release and a large number of screens ensures
widespread availability. A film is released simultaneously on thousands of screens to
capitalize on this expenditure and take maximum advantage of the “buzz” surrounding
the launch. Films are then released subsequently in major film markets overseas to
capture additional revenue. Success at the box office in the US is often viewed as a signal
of how the film will perform in markets outside the US.
The high costs of production and promotion for a feature film require a large
market with relatively homogeneous tastes to be profitable. Even with the large US
5

market, most films are not profitable based on their US box office revenue alone and
studios rely heavily on foreign markets for profitability. For example, while Titanic, the
top grossing film of all time, achieved sales of over $600 million in the US, it realized
twice that amount outside the US.
2.2. Previous Research
Research examining factors underlying success in the film industry have typically
focused on modeling distribution intensity, distribution characteristics, film
characteristics such as genre, and presence of stars in order to predict box office revenues
(Jedidi, Krider and Weinberg 1998, Krider and Weinberg 1998). Some studies have, for
example examined the pattern of weekly box office revenues (Jedidi, Krider and
Weinberg 1998) and the degree of competition between motion pictures (Krider and
Weinberg 1999). Others have examined the impact of both distribution and marketing
policies and film and critics’ reviews on box office revenue (Sawhney and Eliashberg
1996, Neelamgan and Chintagunta 1999, Ravid 1999, deVany and Walls 1999). Decision
support systems to aid exhibitors make better and more timely scheduling decisions have
also been developed (Swami, Eliashberg and Weinberg 1999). More complex models
examining the interaction between audience and exhibitor characteristics have also been
developed (Elberse and Eliashberg 2002).
Only two studies (Elberse and Eliashberg 2002, Neelamgan and Chintagunta
1999) have examined the performance of US films in foreign markets. Neelamegham and
Chintagunta (1999) developed a Bayesian modeling framework to predict first week
viewership for 35 new films in the US and in 14 international markets, based on the
number of screens in which a film was released, the cumulative number of viewers as a
6

proxy for word of mouth, the number of weeks since the initial release, and film
attributes such as the presence of major stars and the genre of the film. For all countries,
the number of screens on which a film was released was found to be the most important
influence on viewership. Local distribution was also found to improve film sales
internationally. Differences were also found in genre preference across countries,
although no systematic pattern was identified and similar genre preferences were evident
in geographically disparate countries.
Elberse and Eliashberg (2002) conducted an extensive study covering 164 films
over two years in the US and four foreign countries, France, Germany, Spain and the
U.K. They used an econometric modeling approach to predict the opening week box
office, second week and beyond. They examined the adaptive behavior of both audiences
and exhibitors and included a range of drivers of these behaviors including, advertising
budget, presence of star, director, advertising expenditure, critical reviews, major
distributors, word of mouth communication, competition for screen space, competition
for attention of audiences, seasonality, domestic and foreign performers. They also
examined the time lag between domestic and foreign market introduction to assess the
extent to which performance of a film in a foreign market is influenced by its
performance in the domestic market, and whether this relationship was moderated by the
time lag between the film’s introduction in each market. Again, the number of screens on
which a film was distributed was found to be the key factor underlying its success
(Elberse and Eliashberg 2002).
Both these studies have provided considerable insight into the film-specific
factors associated with box office performance in foreign markets. Both studies also
7

demonstrate that a film’s box office performance in the US is a strong predictor of its
success outside the US. However, neither study examined how the cultural aspects of the
contexts in which different types of films are released influence their success.
2.3. Research Hypotheses
In addition to their economic importance, films play an important role in the
transmission of culture. They are both culturally rich and culturally complex. They
constitute a form of entertainment that reflects both daily life, often emphasizing
romantic, humorous, and violent elements as well as the fantasies, dreams and
imagination through which individuals escape from the realities of daily existence. Films,
like other forms of entertainment, mirror the culture in which they are created. Chekhov’s
plays reflect the life of the Russian landowner at the turn of the 20th century, just as
Wilde reflects the mannerisms of Edwardian culture or Weill the ideological conflicts of
Germany in the 1930s. Similarly, Italian opera, Brazilian samba, the Indian dance of
Shiva, or Spanish bullfights are integral parts of Italian, Brazilian, Indian and Spanish
culture and appeal to a broad spectrum of society (Gannon 2001). French films by
Truffaut, Swedish films by Bergman, Italian films by Felini, Spanish films by Bunuel,
Indian films produced in “Bollywood,” and Japanese films by Kurosawa all reflect the
vision of the directors and the cultures that produced them.
Over time, the film industry has come to be dominated by US studios and filmed
entertainment represents a major US export. The rich cultural content of films suggests
the need to examine the role of content and context in influencing their success in foreign
markets. Insofar as US films reflect US values, they may be expected to be more
successful in countries that are culturally similar to the US and less successful in cultures
8

distant from the US. While culture has not been examined specifically in relation to film,
there is a rich tradition in the international business literature examining the impact of
culture on foreign market entry (Mitra and Golder 2002), selection of mode of entry
(Kogut and Singh 1988) and the effect of culture on consumer traits such as
innovativeness (Steenkamp, ter Hofstede and Wedel 1999). Such factors suggest the
following research hypothesis:
Hypothesis 1: The more similar a country is to the US, the more likely a US film will be successful at the box office.
Countries vary in the extent to which they have emulated a US life-style or have
adopted products typical of that lifestyle as for example, fast food, carbonated soft drinks,
casual clothes such as jeans and t-shirts and running shoes or US sports such as
basketball and baseball. The icons or role models of US culture such as Michael Jordan,
Tom Cruise, or Eminen may be embraced by those in other countries. Equally, members
of other cultures may have adopted traits typical of US culture, such as concern with
cleanliness (as reflected in frequent showers and daily hair washing), preoccupation with
time and a fast-paced life, casual dress and fast food. Consequently, it is hypothesized
that US films, as conveyors of US values, will be more successful in countries where life-
styles have become more Americanized.
Hypothesis 2: The higher the degree of Americanization in a country, the more likely a US film is to be successful. Language is an important factor influencing the success of US films. It is
important not only for effective understanding of the film’s content, but also because it is
an important component of culture. Language reflects specific cultural attitudes and
behavior patterns that may be alien to an audience which speaks a different language and
9

act as a barrier to acceptance or empathy with the film’s storyline and presentation. In
non-English-speaking countries films need to be dubbed to ensure comprehension of the
dialogue. This may diminish their effectiveness and impact due to loss of fluency and
synchronization of dialogue and action. In some cases there may also be inconsistency
between the scenario and the language spoken, as for example when an American
Western is dubbed in French, Arabic or Mandarin.
More importantly, insofar as language is an important element in the transmission
of cultural patterns and behavior, and according to one school of thought (Whorf 1956)
plays an important role in the formation of thought patterns, one may expect speakers of
the same language to have similar cultural beliefs, attitudes and behavior patterns. In
addition, language plays an important role in linking cultural communities and forging a
bond between its members, resulting in similar preferences and behavior norms (Hall
1976, Usunier 2000). Consequently, members of countries speaking a common language
are expected to be more culturally similar than those speaking another language.
Hypothesis 3: US films are more likely to be successful in English-speaking countries than in non-English speaking countries.
So far the hypotheses have centered on the cultural environment into which a film
is released and how that impacts the degree of success. The host culture, degree of
Americanization and language are all hypothesized to exert some influence. It is also
important to consider how different types of films will be received by different cultural
groupings. Films are complex multi-faceted creations of a particular culture (Austin
1987). Each is unique and the nature and extent of their cultural content will vary. At the
extreme, westerns are unmistakably American, portraying a particular period of US
history. Comedy is a genre that tends to be embedded in a particular culture and
10

appreciation of a particular type of humor, for example British humor, is not universal.
Notions of romance and courtship vary considerably from culture to culture and may not
correspond to contemporary US mores. On the other hand, fantasy and science fiction are
not necessarily anchored in any particular culture, although members of a particular
culture may exhibit preferences (or dislike) for these genres. Prior research on US films
in foreign markets (Neelamegham and Chintagunta 1999) has demonstrated that genre
has an impact on a film’s performance in different countries. However, results varied
considerably and there was no specific pattern of acceptance of a particular genre across
countries.
Hypothesis 4: The genre of a US film will influence its performance in foreign markets.
3. Data In order to examine these hypotheses, a hierarchical regression model specifying
the impact of both film-level and country-level independent variables on box office
receipts was developed. The dependent variable consisted of annual box office receipts
(foreign) for the top 50 US films, based on US theatrical box office revenue, that were
subsequently released in eight foreign countries. The independent variables consisted of
two groups; the first measured film characteristics, specifically box office revenue and
film genre, and the second measured country characteristics -- cultural distance, degree of
Americanization, and language.
3.1. Film-level data
Data were obtained from the Variety.com web site on the top 50 US films (gross
box office receipts) for a six-year period, 1997 through 2002. Approximately 500 films
are released each year in the US. Focusing on the top 50 films for each year insures a
11

sample of films that are not only released in the US but are ones that will be released
subsequently in foreign markets. In any given year to be in the top 50 a film had to have a
domestic gross revenue of approximately $50 million. Corresponding data for the same
films were obtained for the eight foreign countries available on the Variety.com web site
(Australia, UK, Austria, Germany, Argentina, Chile, Mexico, and Spain). While Variety’s
domestic data go back to 1982, complete data on foreign box office receipts begins in
1997. However, data on box office receipts in Australia, Austria and Argentina are very
sparse for 1997. One top 50 film, Everest, was excluded from the analysis as data were
available for only one country outside the US. This provided a total of 299 films and
2,198 observations. The missing observations are attributable to a film not being released
in a particular country or the incompleteness of the Variety.com database in the early
years.
When a film’s revenue stream spanned two years it was assigned to the year in
which the majority of its gross revenue was realized. Popular films released in December
may obtain more than half their gross revenue in the subsequent year. Also, studios may
arrange for a limited release of the film in late December to qualify for that year’s
Academy Awards and then substantially expand the number of screens in January. This
approach also provided a better match between the US year and the foreign year as the
foreign release window is after the US release date. For example, a film released in the
US in December 1997 would typically have the majority of this revenue in 1998 with
virtually all the foreign revenues occurring in 1998. These data were adjusted to per
capita values and expressed as logs.
12

A film’s genre was obtained from the Internet Movie Data Base (imdb.com).
IMDB often assigns a secondary and tertiary genre to a film. Only the first listed genre
was used as the film’s genre for the purposes of the analysis. This resulted in 13 primary
genres. These data were coded as dummy variables in the analysis to assess the impact of
a film’s genre on its performance in foreign markets. Tables 2 and 4 each contain a listing
of 12 of the genre. The 13th genre was crime.
Film-level predictor variables for the analysis were limited to the per capita US
box office and its genre. Since the data were for the entire run in all the countries, factors
normally examined, such as screens and stars were not used. The number of screens
varies week by week so that one number would not suffice. Further, previous studies that
incorporated screens were interested in predicting opening week box office and week-by-
week revenues. The present paper is concerned with answering a different question
relating to the impact of cultural factors on a film’s gross revenue in foreign countries.
Also, since the data are for the entire run, the effect of screens and stars is reflected in the
overall revenue number for the US and the foreign countries.
3.2. Country-level data
Cultural distance was measured based on distance from the US on a composite
index of Hofstede’s four value orientations. These value orientations represent the
“collective programming of the mind that distinguishes one nation from another”
(Hofstede 2000). They were developed from data drawn from interviews with employees
of a large US multinational firm. There are four value orientations,
Individualism/Collectivism, Power Distance, Uncertainty Avoidance, and
Masculinity/Feminity. Individualism/Collectivism represents the degree to which an
13

individual perceives him or herself to be separate from a group and pressure to conform;
Power Distance reflects the degree to which members of a society accept a hierarchical or
unequal distribution of power in society; Uncertainty Avoidance reflects the degree to
which members of a society are willing to deal with the uncertainty or risk of daily living
and prefer to work with long-established friends and acquaintances, and
Masculinity/Feminity represent the degree to which a society looks favorably on
materialistic and aggressive rather than nurturing behavior. Following Kogut and Singh
(1988) an index of cultural distance from the US was developed for each country.
Population and per capita income were obtained from the World Bank for all
countries for 2000 (World Bank Development Report 2001). This is roughly in the
middle of the period for the film data. These numbers are stable and do not change
appreciably in a relatively short period of time. Population was used to express box
office receipts on a per capita basis. Per capita income data were used as a covariate to
control for the wealth of the population and hence their ability to afford discretionary
leisure time activities. The degree of Americanization was assessed based on the number
of McDonald’s outlets per capita in each country. The number of McDonald’s restaurants
was obtained from McDonald’s web site. McDonalds is a key symbol of US values and
life-style overseas (Ritzer 2002). Those who admire and seek to emulate US lifestyle see
McDonalds’ restaurants as emblematic of that lifestyle. Equally, those who resent the
growing dominance of US culture and US economic and military power see them as a
target for their animosity. The number of McDonald’s restaurants per capita was used as
a measure of a country’s “degree of Americanization” and hence the propensity to accept
American films.
14

All of the films in the data base, with the exception of Chocolat and Crouching
Tiger, Hidden Dragon, were originally released in English. A dummy variable was
coded as one if the foreign country was English-speaking and zero otherwise. This also
served as another measure of cultural proximity as countries that share a common
language have other elements of culture in common. Language is also expected to affect
box-office revenues. As noted earlier, films that are dubbed may have less appeal than in
their original language, as the language may be incongruent with the stars or context of
the film, or alternatively idioms may translate poorly into another language. More
importantly, language is a key element of culture and communication and hence may
reflect important cultural differences. The country-level data are summarized in Table 1.
Table 1. Country Data
Country Population (Millions)
Per capita Income (US $)
McDonalds per million people
Cultural distance from the US
Argentina 37 12,900 4.68 3.20
Chile 15 9,110 4.0 6.10
Spain 39 19,180 7.69 4.02
Mexico 98 8,810 2.76 6.01
Germany 82 25,010 14.05 .97
Austria 8 26,310 19.9 1.51
Australia 19 25,370 37.8 .45
UK 60 23,550 14.05 .52
15

4. Model and Estimation Methods
The hypotheses involve variables at two levels, film and country. In addition,
each film is unique and consequently it was also desirable to be able to account for film-
specific heterogeneity. Consequently, a hierarchical random parameters regression model
was formulated as follows:
, , 1 2 3
1298 1998 02 2002 , ,1
...
f c f f f US c c
g f g f cg
cB B CD MACSPC English
D D G=
= α +β + γ + γ + γ
+ δ + + δ + η + ε∑
αf = α0 + α1logIncomec + uα,f (1)
βf = β0 + β1logIncomec + uβ,f
where “f” denotes film, f = 1,…,F = 299 and “c” denotes country = UK, Australia,
Germany, Austria, Argentina, Chile, and Mexico. In the primary equation, Bf,c is the log
of the per capita box office revenues for film f in country c; Bf,US is the same for the
United States. CDc is our measure of the cultural distance of country j from the US.
Hofstede’s (2001) four measures of cultural distance were used to examine the impact of
culture on a film’s performance. Following Kogut and Singh (1988) cultural distances
were indices based on Hofstede’s measures of Individualism, Power Distance,
Uncertainty Avoidance and Masculinity. This provided an overall measure of cultural
distance from the US. Deviations were corrected for differences in the variance of each
of the four dimensions. The aggregate measure of cultural distance is
24 , ,
1
( )1 , , ,..., , ,...4 =
−= = =∑ i c i US
c ii
I ICD c UK Australia i power distance uncertainty
V (2)
where Vi is the variance across countries of the ith cultural distance index. MACSPCc is
the number of McDonald’s restaurants per capita in country c in 2000; Englishc is a
16

dummy variable for whether the country is an English-speaking country (UK, Australia).
Note that these three variables are the same for every film and in every year for country c.
The time dummy variables are denoted DYEAR for 1998 – 2002. We fixed 1997 as the
base year and dropped this dummy variable from the equation. Thus, each of these five
remaining dummy variable coefficients measures the residual effect relative to the base
year, 1997. The variables Gf,g are 12 dummy variables for primary genre; the 13th, Crime,
is fixed as the basis. The disturbance, εf,c is assumed to be normally distributed with
mean zero and constant variance σ2.
Two random parameters in the model capture unobserved film specific
heterogeneity. The constant term, αf,c includes a pure ‘random effect.’ The coefficient
on US box office, βf is film specific; we have assumed that the direct relationship
between the US and local box office receipts has a film-specific component. The two
random parameters are also assumed to be affected by the per capita income in the
country in 2000, which provides an indication of the standard of living as well as
discretionary income and the population’s ability to engage in paid leisure-time activities.
The stochastic nature of these two parameters is imparted by the random components, uα
and uβ, which are assumed to be normally distributed with means zero and variances σα2
and σβ2, respectively. Although the film industry has certain market characteristics that
underlie the relationship between foreign and US box office receipts, each film is a
separate project with characteristics of its own, sufficiently distinct that we felt it
appropriate to allow for the film-specific heterogeneity in the fashion described. A
likelihood ratio test for the presence of these effects supported the hypothesis that there is
film-specific heterogeneity (LR=428.12, d.f.=4).
17

The parameters of the model are estimated by the method of maximum simulated
likelihood. For convenience, gather the full set of independent variables in the equation
not including the constant and Bf,US in a vector xf,c and denote zf = (1,Bf,US). Denote the
random parameters in the model as θf(uf,Ic) where the subscript f denotes the specific
film, Ic denotes the log of per capita income in the country, and uf denotes the vector of
two random components, uα,f and uβ,f. Thus, θf(uf,Ic) denotes the 2×1 random parameter
vector for the model and let λ denote the remaining fixed parameters (that is,
homogenous across films – we have no prior beliefs that these other coefficients vary
across films). Then, the model may be written
Bf,c = θf(uf,Ic)′zf + λ′xf,c + εf,c, εf,c ~ N[0,σ2] (3)
θf(uf,Ic) = θ0 + θ1Ic + uf, uf ~ N2[(0,0),(σα2,σβ
2),σαβ]
with θ0 = (α0,β0)′ and θ1 = (α1,β1)′ and σαβ = 0. Conditioning on the film specific
random effect, uf, the density for a particular observation is
2, ,
,
, ,
( , )1 1( ) exp22
( , )1
f c f f c f f cf c f
f c f f c f f c
B If B
B I
⎡ ⎤′ ′− −⎛ ⎞= −⎢ ⎥⎜ ⎟σσ π ⎢ ⎥⎝ ⎠⎣ ⎦
′ ′− −⎛ ⎞= φ⎜ ⎟σ σ⎝ ⎠
u z x| u
u z x
θ λ
θ λ (4)
where φ(t) denotes the standard normal density. We assume that the country specific
observations on box office receipts are independent save for the common film-specific
heterogeneity, so the contribution of a particular film to the likelihood for the sample is
the product of the country specific observations:
8 , ,, , 1
( , )1( , ,... ) f c f f c f f cf UK f Australia f c
B IL B B
=
′ ′− −⎛ ⎞= φ⎜ ⎟σ σ⎝ ⎠∏
u z x| u
θ λ. (5)
18

(We have simplified the notation slightly by specifying that each film is observed in all 8
countries. In the sample data, in fact, some films are not observed in some of the
countries. The estimation procedure is not changed by this complication – sums and
products are simply based on the available data.)
Terms in the likelihood are conditioned on the unobserved heterogeneity, uf
which must now be integrated out of the function in order to obtain the sample likelihood
function for the observed data;
Lf = 8 , ,1
( , )1 ( )f
f c f f c f f cf fc
B Ig d
=
′ ′− −⎛ ⎞φ⎜σ σ⎝ ⎠
∏∫uu z x
u uθ λ
⎟ . (6)
Finally, the log likelihood for the full sample to be maximized is
LogL = . (7) 299
1log ff
L=∑
This is maximized over the structural parameters,
θ = (α0,α1,σα2),(β0,β1,σβ
2),γ1,γ2,γ3,δ98,…,δ02,η1,…,η12,σ2. (8)
A practical obstacle to maximizing the log likelihood is the integration of the
heterogeneity out of the function. There are two approaches available, quadrature and
simulation. Quadrature is usually an effective technique when integration is over a single
dimension, but it is generally ineffective when integration is in two or more dimensions,
and is infeasible for three or more. We have chosen the simulation procedure, which
works effectively even in high dimensional applications. [See Train (2003) for
discussion.] The simulated log likelihood is obtained as follows: First, write uα,f as σαvα,f
and uβ = σβvβ,f where vα,f and vβ,f have normal distributions with mean zero and standard
deviations 1. The contribution to the log likelihood for the observations on film f is then
19

(9)
, ,
, 0 1 ,
8 0 1 , , ,, , , ,1
( )
( )1log log ( , )f f
f c c f
c f f US f cf f f fcv v
B I v
I v BL g v v dv dv
α β
α α
β βα β β α=
⎛ − α +α +σ − ⎞⎡ ⎤⎜ ⎟⎢ ⎥′β +β +σ −⎢ ⎥⎜ ⎟⎣ ⎦= φ⎜ ⎟σ σ⎜ ⎟⎜ ⎟⎝ ⎠
∏∫ ∫xλ
f
The double integral in this expression is the expected value of the product of densities
over the range of vα,f and vβ,f. This can be simulated satisfactorily by averaging the
function over a sufficient number of draws, R, on vα,f and vβ,f. [The relevant theory is
summarized in Gourieroux and Monfort (1996).] The contribution of film f to the
simulated log likelihood is, thus
,
, 0 1 , , 0 1 , , , ,1 1
log
( ) ( )1 1log
S f
CR f c c f r c f r f USr c
L
B I v I v BR
α α β β
= =
=
′− α +α +σ − β +β +σ −λ⎛ ⎞φ⎜ ⎟σ σ⎝ ⎠
∑ ∏ f cx
S fL
(10)
[See Train (2003).] (Note the subscripts, “r” on vα,f,r and vβ,f,r which denote the simulated
draws.) The simulated log likelihood function is then
(11) ,1log logN
S fL
==∑
This smooth, continuous function is then maximized over the structural parameters in (8).
The “random draws” for maximum simulated likelihood estimation are generally
created by using a random number generator to simulate a sample from the required
distribution. In practice, this is done by simulating a series of draws from the standard
uniform distribution, e.g., wα,f,r ~ U[0,1]. Draws from the normal distribution are then
obtained by the using the inverse probability transformation, vα,f,r = Φ-1(wα,f,r), where
Φ-1(t) denotes the inverse function of the standard normal CDF. Recent research [e.g.,
Bhat (1999)] has found that this process of sampling for the purpose of integration can be
20

done faster and more rapidly (i.e., with fewer simulation points) by using “intelligent”
draws which, rather than being random samples from the uniform distribution are
deterministic Markov sequences of values from the unit interval. The foundation result is
that it is not randomness of the sample of draws that is important for accurate integration;
it is even coverage of the unit interval with a carefully constructed sequence of values
that is uncorrelated with the data. We have used the method of Halton sequences for this
purpose to speed up convergence and to stabilize the estimators. [See, e.g., Train (2003),
Greene (2001) and Bhat (1999) for discussion of Halton sequences.] Evidence suggests
that for a low dimension problem such as ours (two), using Halton sequences can reduce
the required number of draws needed by a factor of five or ten. Formalities of computing
Halton sequences are given in Train (2003) and Greene (2001).
5. Results
All films for all six years were analyzed together to test the hypotheses using the
hierarchical linear random parameters regression model. In addition as a purely
descriptive statistic, an ordinary least squares regression was run to provide some
indication of the amount of variation in foreign box office receipts accounted for by the
independent variables. Overall, the independent variables explained 47 percent of the
variance in foreign box office receipts (adjusted R2 .475). All the hypotheses were tested
controlling for the effect of per capita income to account for that source of country-to-
country variation. As indicated earlier, individuals with higher incomes also have more
discretionary income and are better able to engage in paid leisure time activities. As
expected the effect of income was positive (.359) and highly significant.
21

5.1. US Box Office
Assessing the significance of the relationship between U.S. box office (log, per
capita) success and local box office (log, per capita) success is more involved in the
random parameters setting than simply examining the estimated coefficients and their
estimated standard errors. In the hierarchical model, we have
βf | Incomec = β + δlogIncomec + σβvf, where vf ~ N[0,1] . (12)
A finding that estimates of β and δ are “significant” does not imply that the random
coefficient on the left is, in total, correspondingly so. Large variation due to the normally
distributed component, σβvf, might dominate the random parameter. Simply computing
and examining the marginal mean, β + δlogIncomec, at the estimated parameters is
likewise non-conclusive. We propose to examine the distribution of the random
parameters as follows: For each film, we can estimate the posterior mean,
E[βf|Bf,c,xf,c,zc,c = 1,…,8], using Bayes theorem, where zc is log per capita income and xf,c
is all other variables in the model including the log per capita U.S. box office, and Bf,c is
the log of the local per capita box office (the dependent variable). The empirical
distribution of the estimated film specific estimates will then suggest whether the results
document a systematic relationship between U.S. and local box office receipts.
For convenience, let Bf denote the observations on the local box office for this
film for all countries for which it is observed, and let Xf denote the observations on all
other variables for this film, including genre, MACSPC, log of per capita income, and so
on, again for all countries. Then, the desired mean for the specific film is
E[βf | Bf, Xf] = ( | , )f
f f f f ff dββ β β∫ B X (13)
22

where f(βf|Bf,Xf) is the conditional density of βf given all the information available in the
sample on this film. This conditional distribution is constructed using Bayes theorem as
follows:
f(βf|Bf,Xf) = ( , | )
( | )f f f
f f
ffβ B X
B X (14)
= ( | , ) ( | )
.( | , ) ( | )
f
f f f f f
f f f f f f
f ff f
βd
β β
β β β∫B X XB X X
The joint density in the numerator is the product of the marginal distribution of βf, which
is the normal distribution defined by (12), and the conditional distribution of the
dependent variable given the parameter βf, which is the term in the likelihood function
before the integration (5). The denominator is the marginal distribution of Bf obtained by
integrating βf out of the joint distribution. The conditional mean of this distribution is
then obtained by the definition,
E[βf | Bf, Xf] = ( | , ) ( | )
.( | , ) ( | )
f
f
f f f f f f f
f f f f f f
f f
f fβ
β
β β β
β β β
∫∫
B X X
B X X
d
d
β (15)
In order to estimate this quantity, we would insert the estimated parameters for the
remainder of the model in the likelihood function and the marginal density of βf, then
compute the integrals. However, the integrals will not exist in closed form. They can be
computed by simulation, by the same method used to computed the simulated likelihood
earlier. The simulation estimator of the conditional mean function is, then
,1
,1
ˆ ˆ(1/ ) ( , , )ˆ[ | , ]ˆ(1/ ) ( , , )
R,f r f f f rr
f f f Rf f f rr
R L vE
R L v=
=
ββ = ∑
∑B X
B XB X
(16)
23

where is the contribution to the likelihood function (not its log) of film f
evaluated at all the estimated parameters and the rth simulated value,
,ˆ( , ,f f f rL B X v )
, ,,ˆ ˆ ˆ ˆlogf r c f rpercapitaIncome vβ ββ = β+ δ +σ . Note that the simulation is over the draws of
vβ,f,r. (Also, we note that the random constant term in the model is also simulated.) In the
results below, we will also make use of the estimated posterior variance of βf,
Var[βf | Bf, Xf] = E[βf2|Bf,Xf] – (E[βf|Bf,Xf])2. This is estimated in the same fashion by
first estimating the expected conditional square, then subtracting the square of the
estimated conditional mean.
Figure 1 below shows for each of the 299 films the range given by the mean plus
and minus 2.5 standard deviations from the conditional distribution. With conditional
normality, this range would encompass about 99% of the mass of each conditional
distribution. Since the conditional distributions are not necessarily normal nor
symmetric, the actual mass may be slightly less than this, but will be more than 95%.
The horizontal lines in the figure are drawn at the sample mean of the 299 estimated
conditional means (1.21) and zero. The vertical bars divide the data into the six years of
observations. Only one of these intervals comes close to including zero, and that one
only slightly. We conclude that the relationship between US and foreign box office is
indeed, positive and significant. Figure 2 summarizes these with a kernel density
estimate of the marginal distribution of βf, averaged across all films. Once again, the
results strongly suggest the significance of the relationship. (See Greene 2003, pp. 453-
456 for discussion of kernel density estimation.)
24
Figure 1. 99% Confidence Intervals for Film Specific Coefficients on logUSBox
Plot of 99% Probability Interval for USBox Coefficient
MOVIES
.00
.50
1.00
1.50
2.00
2.50
3.00
-.5060 120 180 240 3000
99%
Ran
ge
25

B_USBOX
.29
.58
.87
1.16
1.45
.001 2 30
Kernel density estimate for B_USBOX
Den
sity
Figure 2. Estimate of the Density of US Box Office Coefficient, Averaged Over Films
26

Table 2. Estimated Regressions for Log Per Capita Box Office, All Countries (Estimated Standard Errors in Parentheses)a
Fixed Parameters Model (OLS)
Random Parameters Model
Variable Fixed Parameters Cultural Distance -0.155 (0.017)** -0.156 (0.010)** -0.156 (0.010)** Macs Per Capita 0.040 (0.004)** 0.040 (0.003)** 0.040 (0.003)** English Language 0.120 (0.079) 0.138 (0.052)** 0.135 (0.052)** Drama -0.130 (0.142) -0.138 (0.086) Romance 0.022 (0.207) 0.042 (0.127) Comedy -0.151 (0.138) -0.140 (0.085) Action 0.118 (0.137) 0.092 (0.084) Fantasy 0.526 (0.191)** 0.559 (0.123)** Adventure 0.110 (0.161) 0.141 (0.099) Family -0.498 (0.165)** -0.591 (0.092)** Animated 0.152 (0.165) 0.149 (0.103) Thriller -0.033 (0.176) -0.074 (0.106) Mystery 0.383 (0.304) 0.227 (0.198) Science Fiction 0.039 (0.179) 0.009 (0.112) Horror 0.157 (0.165) 0.058 (0.112)
Year 1998 -0.314 (0.084)** -0.566 (0.050)** -0.584 (0.045)** Year 1999 -0.245 (0.087)** -0.445 (0.050)** -0.481 (0.047)** Year 2000 -0.410 (0.085)** -0.587 (0.051)** -0.644 (0.045)** Year 2001 -0.419 (0.085)** -0.640 (0.052)** -0.646 (0.047)** Year 2002 -0.701 (0.087)** -0.929 (0.050)** -0.935 (0.043)** Random Parameters Constant Constant Intercept -0.975 (0.183)** -3.649 (1.313)** -4.939 (1.290)** Income Effect 0.000 (0.000) 0.359 (0.164)** 0.526 (0.161)** Standard Deviation 0.000 0.177 0.304 Per Capita US Box Per Capita US Box Intercept 1.204 (0.047)** 1.669 (0.917)* 0.770 (0.907) Income Effect 0.000b (0.000) -0.057 (0.114) 0.063 (0.113) Standard Deviation 0.000b 0.369 0.354 Disturbance S.D. 1.053 0.934 0.938 Log Likelihood -3220.691 -3007.729 -3021.050 R2 0.475 a * (**) Indicates significant at 95% (99%) significance level. bFixed at this value.
5.2. Effect of Culture on Film Performance
Cultural distance had a significant effect on the performance of films (see Table 2
above). The coefficient was negative (-.156) and highly significant. Films released in
countries that were culturally close to the US were more likely to perform well.
Conversely, films released in countries that were farther from the US in terms of cultural
distance did not perform as well. This confirms the key premise of the study that culture
27
does matter. It supports hypothesis 1 that the cultural context in which a film is released
is an important factor influencing its success.
5.3. Effect of Americanization on Film Performance
Closely related to cultural distance is the extent to which the country has
embraced elements of American culture. The number of McDonald’s outlets per capita
provided some indication of the extent to which a population has accepted aspects of
American culture. The coefficient for number of McDonald’s outlets per capita was
positive (.040) and highly significant supporting Hypothesis 2. Films had higher per
capita box office receipts in countries that had more McDonalds outlets per capita.
5.4. Effect of Language on Film Performance
Related to cultural distance, was whether the film was released in an English-
speaking country. The coefficient for the English language dummy variable was positive
(.138) and highly significant supporting hypothesis 3. When films were released in other
English-speaking countries, the UK and Australia, they performed better than when they
were released in non-English speaking countries. Not only would the non-English
speaking countries be more culturally distant, but also the films would either be dubbed
or subtitled. This would lessen their appeal and enhance the perception that they were
from another culture.
5.5. Genre Effect
To determine whether there was a significant effect of genre, a likelihood ratio
test was performed between the same equation with and without genre (see Table 2). The
overall effect of genre was significant (LR=26.64, d.f.=12) supporting hypothesis 4.
Individually, however, only two of the genre had an impact on how films performed in
28

foreign countries. Fantasy performed significantly better (.559) and family performed
significantly worse (-.591). For the other ten genres, the coefficients were not significant.
5.6. Year Effect
Dummy variables were included to account for the six different years for which
data were available with the base year as 1997. All the year effects were significant with
negative coefficients. In each year subsequent to 1997, the relationship between per
capita US box office and foreign box office was not as strong in 1997. Table 3 shows per
capita US and foreign box office for the 50 films in the sample for each year. Per capita
US box office for these generally increased from 1997 to 2002, with some minor
fluctuations. Foreign per capita box office receipts were always lower than the US. They
decreased from 1997 to 1999, increased again in 2000, declined in 2001 and then
increased in 2002. In 1997, foreign box office for the films in the sample was 60 percent
of the US box office. In each of the subsequent years, it was lower (ranging between 51
to 38 percent). This partly explains the negative coefficients for the year dummy
variables.
Table 3. Per capita Box Office Receipts for Top 50 Films, per film– 1997 to 2002 Year 1997 1998 1999 2000 2001 2002
Foreign countries1
.1972 .168 .137 .174 .138 .162
US .33 .33 .31 .37 .36 .40
Foreign as a percent of US Box Office
60% 51% 44% 47% 38% 40%
1 Argentina, Australia, Austria, Chile, Germany, Mexico, Spain, and UK. 2 US dollars, gross per capita box office revenue for all 50 films would be $9.85
29

5.7. Country Effects
The combined effect of cultural distance and language suggested that it would be
useful to analyze the data by three language groupings, English, Spanish and German. A
likelihood ratio test was performed to test whether there was a significant difference
between the overall equation and separate equations for the three language groupings.
The test indicates that there are significant differences between the country groupings
(LR=751.23, d.f.=44).
Cultural distance was dropped from the equations since for the English and
German groupings with only two countries, the number of McDonald’s per capita was
collinear with cultural distance. Also, from a conceptual standpoint, the countries within
a language grouping already tended to be culturally similar. Ordinary least squares
regressions were run to provide descriptive R2 statistic. The adjusted R2 was 0.55 for the
English-language group, 0.41 for the German-language group, and 0.22 for the Spanish-
language group. As in the aggregate analysis, the per capita US box office was a strong
predictor of performance in each of the country language groupings. The results are
shown in Table 4.
30
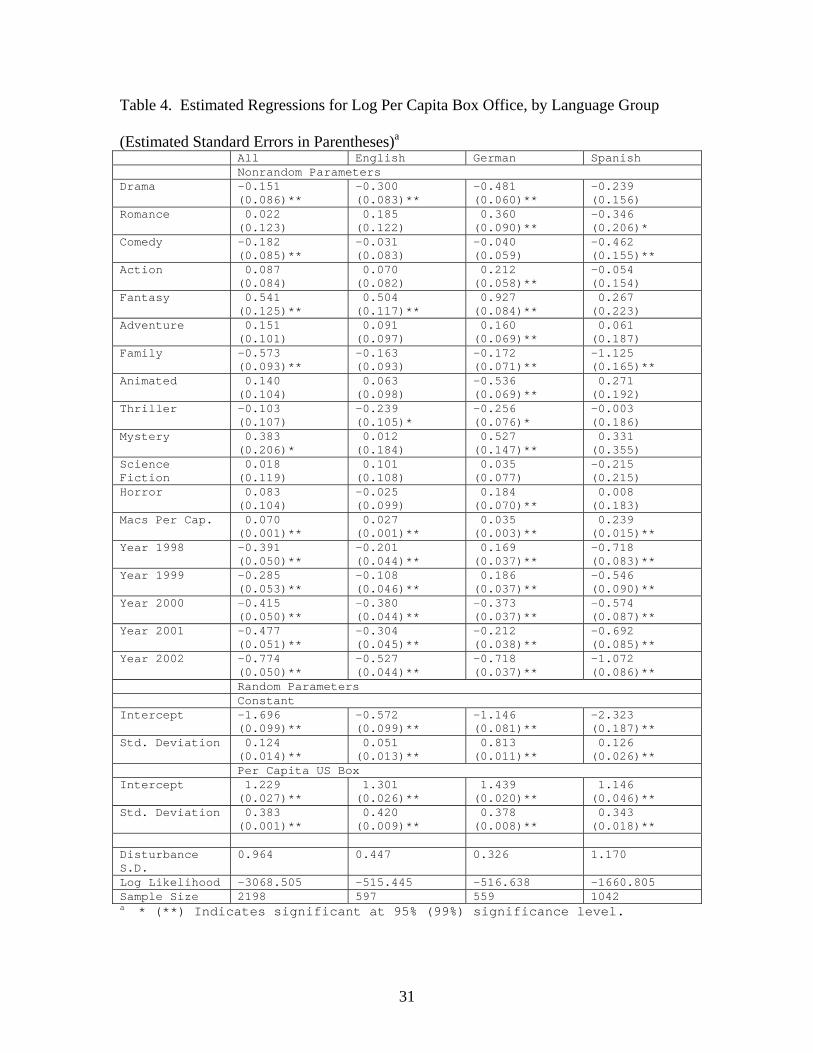
Table 4. Estimated Regressions for Log Per Capita Box Office, by Language Group
(Estimated Standard Errors in Parentheses)a
All English German Spanish Nonrandom Parameters Drama -0.151
(0.086)** -0.300 (0.083)**
-0.481 (0.060)**
-0.239 (0.156)
Romance 0.022 (0.123)
0.185 (0.122)
0.360 (0.090)**
-0.346 (0.206)*
Comedy -0.182 (0.085)**
-0.031 (0.083)
-0.040 (0.059)
-0.462 (0.155)**
Action 0.087 (0.084)
0.070 (0.082)
0.212 (0.058)**
-0.054 (0.154)
Fantasy 0.541 (0.125)**
0.504 (0.117)**
0.927 (0.084)**
0.267 (0.223)
Adventure 0.151 (0.101)
0.091 (0.097)
0.160 (0.069)**
0.061 (0.187)
Family -0.573 (0.093)**
-0.163 (0.093)
-0.172 (0.071)**
-1.125 (0.165)**
Animated 0.140 (0.104)
0.063 (0.098)
-0.536 (0.069)**
0.271 (0.192)
Thriller -0.103 (0.107)
-0.239 (0.105)*
-0.256 (0.076)*
-0.003 (0.186)
Mystery 0.383 (0.206)*
0.012 (0.184)
0.527 (0.147)**
0.331 (0.355)
Science Fiction
0.018 (0.119)
0.101 (0.108)
0.035 (0.077)
-0.215 (0.215)
Horror 0.083 (0.104)
-0.025 (0.099)
0.184 (0.070)**
0.008 (0.183)
Macs Per Cap. 0.070 (0.001)**
0.027 (0.001)**
0.035 (0.003)**
0.239 (0.015)**
Year 1998 -0.391 (0.050)**
-0.201 (0.044)**
0.169 (0.037)**
-0.718 (0.083)**
Year 1999 -0.285 (0.053)**
-0.108 (0.046)**
0.186 (0.037)**
-0.546 (0.090)**
Year 2000 -0.415 (0.050)**
-0.380 (0.044)**
-0.373 (0.037)**
-0.574 (0.087)**
Year 2001 -0.477 (0.051)**
-0.304 (0.045)**
-0.212 (0.038)**
-0.692 (0.085)**
Year 2002 -0.774 (0.050)**
-0.527 (0.044)**
-0.718 (0.037)**
-1.072 (0.086)**
Random Parameters Constant Intercept -1.696
(0.099)** -0.572 (0.099)**
-1.146 (0.081)**
-2.323 (0.187)**
Std. Deviation 0.124 (0.014)**
0.051 (0.013)**
0.813 (0.011)**
0.126 (0.026)**
Per Capita US Box Intercept 1.229
(0.027)** 1.301 (0.026)**
1.439 (0.020)**
1.146 (0.046)**
Std. Deviation 0.383 (0.001)**
0.420 (0.009)**
0.378 (0.008)**
0.343 (0.018)**
Disturbance S.D.
0.964 0.447 0.326 1.170
Log Likelihood -3068.505 -515.445 -516.638 -1660.805 Sample Size 2198 597 559 1042 a * (**) Indicates significant at 95% (99%) significance level.
31

The number of McDonald’s per capita remains a strong predictor of a film’s
performance for all three-language groupings. Genre effects revealed some important
differences that were not evident in the initial analysis (Table 2, both fixed and random
parameters models). Fantasy and family continued to be significant with the same sign as
in Table 2. However, the positive effect of fantasy was only evident in English and
German-speaking countries and the negative effect of family only in German and
Spanish-speaking countries. The coefficients for drama and comedy were not significant
when language and cultural distance were in the equation (Table 2). Without language
and cultural distance in the equation, drama was significantly negative for all countries
combined (Table 4, column labeled “All”), for English-speaking, and German-speaking
countries, but not for Spanish-speaking countries. Comedy had a negative impact for all
countries, but this was significant only in Spanish-speaking countries. Romance was not
significant in the aggregate analysis but was positively related to performance for the
German-language group and negatively related for the Spanish-language group.
Adventure films did significantly better in German-speaking countries. Animation had
not been significant in the overall analysis, but had a negative effect in German speaking
countries. Thriller films did significantly worse in English-speaking and German-
speaking countries. Mystery, science fiction and horror films did significantly better in
German-speaking countries. Finally, action and science fiction films performed the same
across all groups.
Overall, genre effects were most pronounced in German-speaking countries with
10 of the 12 genres having a significant effect. These effects are somewhat different from
Neelamegham and Chintagunta (1999), but do reflect the same mixed pattern of certain
32

genres being significant in some countries and not in others.. They looked at only five
genres and examined the effects for individual countries, rather than country groupings.
More genres allows for a more precise match between the film and its genre, while
grouping the countries may mask individual country differences.
The year effect evident in the initial analysis (Table 2) was also evident in the
country-grouping analyses. The year dummy coefficients were all significant and
negative. The significant year effect suggests some erosion in the overall performance of
US films in foreign markets. However, given the extremely strong performance of US
films in 1997, it may simply suggest atypicality in that year and a more typical
relationship in the other five. This may also reflect a difference in the mix of genres of
films released into foreign markets and the variation in their underlying appeal to foreign
audiences.
6. Discussion
A key finding of the study is that performance of US films in their domestic
market was found to be a strong predictor of their success in foreign markets. This is
consistent with the findings of previous studies (Neelamegham and Chintagunta 1999,
Elberse and Eliashberg 2002). More significantly, US films were substantially more
successful in culturally proximate countries than in those that were culturally distant.
This was reinforced by the finding that films performed better in English-speaking
countries. This provides support for hypotheses 1 and 3 and confirms that cultural context
is an important factor in determining the success of culturally sensitive products. Thus,
not only does the cultural connotation of a product need to be considered in evaluating its
success, but also its compatibility with the cultural context in which it is launched.
33

The greater the degree of Americanization of a culture, as reflected in the number
of McDonald’s per capita, the more likely US films were to be successful. Insofar as US
films reflect US culture they are more likely to be successful in cultures that have already
embraced the symbols and ethos of American culture. This is a rather intriguing finding
using an innovative measure that may ultimately prove useful as a more general surrogate
for the likely success of products that have a strong US identity.
The findings also have a number of important implications for studio executives
and film distributors both in terms of where US films are most likely to be successful and
which genre of film is likely to be most successful depending on the language grouping.
However, at the same time the underlying heterogeneity of films suggests that each film
performs differently and that different factors underlie the success or failure of individual
films. Managers should take this into consideration and assess relevant factors for each
film independently.
Additional promotional efforts, taking into account the popularity of different
genres, may also be necessary to ensure successful performance of films in other
countries. This is particularly marked in German-speaking countries where 10 out of the
12 genres were significantly more or less successful. In German-speaking countries,
romance, comedy, fantasy, adventure, mystery, and horror were all likely to be more
successful than other genres, while drama, family, animated and thriller genre were likely
to be less successful. This is somewhat counter to what might be expected a priori as
drama and family genres may reflect cultural values, mores and life styles, while
animated and thriller genres may be less anchored in a particular culture. The results with
regard to thrillers are particularly surprising given that adventure, mystery and science
34

fiction and horror which on the surface would all appear to be similar to thriller, were all
more likely to be successful in German-speaking countries. This suggest that in the case
of drama, family, animated and thriller films, distributors should promote the film based
on the secondary or tertiary classification in Germany and Austria, where these fall into
genre categories that are more likely to be successful.
In English-speaking countries nine of the 12 genres enjoyed the same degree of
success as they did in the US. Fantasy films were more likely to be successful. However,
as in Germany, drama and thriller genre were less likely to be successful, suggesting that
these genres should be de-emphasized in favor of the secondary or tertiary genres. This is
somewhat surprising given the overall success of US films in English-speaking countries.
One might reasonably expect that these genres would also be successful. However, it may
indicate that the type of drama and thriller may be uniquely American and hence not
translate effectively into other English-speaking cultures.
In Spanish-speaking countries, none of the genres were particularly likely to be
more successful than others suggesting a general acceptance of American films in
Spanish cultures. Three genres were, however, significantly likely to be less successful,
romance, comedy and family. Again this may reflect differences in the concepts of
romance, comedy and family between US and Spanish culture. In particular Spanish
concepts of family tend to focus around the extended family as compared with the
nuclear family in the US. Equally, concepts of comedy may differ. Concepts of romance
may also differ with greater emphasis placed on traditional concepts of romance in which
the male takes the initiative and dominates a romantic relations, while the female play a
more traditional, responsive and submissive role than in the typical modern US romance.
35

6.1. Future Research
The present study was limited by the availability of data. It would be useful to
examine a broader range of countries to assess the generality of the impact of culture on
the performance of US films in a broader array of foreign markets. Data on three major
film markets, France, Italy and Japan, were not available for the analysis. The addition of
Japan and other Asian countries would introduce a very different cultural perspective.
Also inclusion of more countries might help further explain the role of language on film
performance.
It would also be intriguing to reverse the study and determine whether foreign
films perform better in the US, if they are from countries that are culturally closer to the
US. This would be more difficult as foreign films in the US are generally relegated to art
houses and appeal to a relatively narrow audience. It would also be useful to construct
country-specific models to enable studio executives to refine their expectations and
marketing efforts even more.
7. Conclusion
Culture matters in important ways that are salient for products with significant
cultural content. The present study focused on films, quintessential experience goods that
are rich in cultural content and symbolic meaning. However, films are not the only
product with cultural content and symbolic meaning. Entertainment products such as
television shows, music, theater, dance and opera are equally replete with cultural
content. In addition, products such as sports, games and household décor reflect strong
cultural influences (Costa and Bamossy 1995, Gannon 2001). Other products and brands,
such as Coca-Cola, Marlboro, sushi, futons and fish and chips, are all seen as symbols of
36

the culture from which they emanate (Ritzer 2002). While largely neglected to date, the
results of the present study suggest that the cultural context is an important factor to
consider, both in understanding and predicting the success of culturally embedded
products. In particular, cultural distance from the US and the degree of Americanization
appear to be particularly fruitful avenues to explore in predicting the success of US
products that contain significant cultural content.
37

References
Austin, Bruce, T.F. Gordon. 1987. “ Film genres: toward a conceptualized model and standard definitions”, Bruce A Austin ed. Current Research in Film Audiences, Economics and Law: vol 3 Ablex Publishing Corporation, Norwood, NJ Bhat, C. 1999. “Quasi-Random Maximum Simulated Likelihood Estimation of the Mixed Multinomial Logit Model,” Manuscript, Department of Civil Engineering, University of Texas, Austin. Caves, Richard E. 2000. Creative Industries: Contracts between Art and Commerce. Harvard University Press, Cambridge, MA. Costa, J. and Gary Bamossy. 1955. Marketing in a Multicultural World. Sage. Thousand Oaks, CA. De Vany, Arthur and H. David Walls. 1996. “Bose-Einstein Dynamics and Adaptive Contracting in the Motion Picture Industry,” The Economic Journal 106 (November), 1493-1514. De Vany, Arthur and Walls W. David. 1999. Uncertainty in the film industry: Does star power reduce the terror of the box office? Journal of Cultural Economics 23 (4) 285-318 Elberse, Anita and Jehoshua Eliashberg. 2002. “ Demand and Supply Dynamics for Sequentially Released Products in International Markets: the Case of Motion Pictures” working paper, The Wharton School. Gannon, Martin J. 2001 Understanding Global Cultures: Metaphorical journeys through 23 nations second edition Sage Publications: Thousand Oaks London Gourieroux, C. and A. Monfort 1996. Simulation Based Econometric Methods, Oxford University Press, Oxford. Greene, W. 2003. Econometric Analysis, 5th ed., Prentice Hall, Englewood Cliffs, NJ. Greene, W. 2001. “Fixed and Random Effects in Nonlinear Models,” New York University, Stern School of Business, Department of Economics, Working Paper 01-01. Hall, Edward. 1976. Beyond Culture. Anchor Press/Doubleday, Garden City, NY. Hofstede, Geert, (2001) Culture’s Consequences: Comparing Values, Behaviors, Institutions and Organizations Across Cultures. Sage: Thousand Oaks, CA. Imdb.com Jedidi, Kamel, Robert E. Krider and Charles B.Weinberg 1998. “ Clustering at the Movies,” Marketing Letters, 9 (4) 393-405
38

Kogut, Bruce and H. Singh. 1988. “The Effect of National Culture on the Choice of Entry Mode,” Journal of International Business Studies, 19 (3), 411-432. Krider, Robert E and Weinberg, Charles B.1998. Competitive dynamics and the introduction of new products: The motion picture timing game. Journal of Marketing Research 35 ( February) 1-15. Litman, Barry R. 1983. Predicting success of theatrical films: an empirical study. Journal of Popular Culture 16 159-175. MPA. 2002. US Entertainment Industry: 2002 MPA Market Statistics. MPAA.com. Mitra, Debanjan and Peter N Golder. 2002. Whose culture matters? Near market knowledge and its impact on foreign market entry timing, Journal of Marketing Research vol XXXIX (August) 350-365 Neelamegham, Ramya and Pradeep Chintagunta. 1999. A Bayesian Model to Forecast New Product Performance in Domestic and International Markets”, Marketing Science 18,2 115-136 Ravid, S. Abraham.1999. Information, blockbusters and stars: a study of the film industry, Journal of Business 72 (4) 463-492. Ritzer, George (ed.) 2002. McDonaldization. Pine Forge Press, Thousand Oaks, CA. Sawhney, Mohanbir S. and Eliashberg, Jehoshua. 1996. A parsimonious model for forecasting gross box office revenues of motion pictures, Marketing Science 15 (2) 113-131. Steenkamp Jan-Benedict E.B., Frenkel ter Hofstede, Michel Wedel. 1999. A cross-national investigation into the individual and national cultural antecedents of consumer innovativeness J. Marketing 63 (April) 55-69 Swami, Sanjeev, Joshua Eliashberg and Charles B. Weinberg, 1999. “SILVERSCREENER: A Modeling Approach to Movie Screen Management,” Marketing Science, 18 (3), 352-372. Train, K. 2003. Discrete Choice Methods with Simulation, Cambridge University Press, Cambridge. Usunier, Jean-Claude. 2000. Marketing Across Cultures, Pearson Educational: Harlow U.K. Variety 2003a, “The Year Abroad”, January 20-26, pp. A17-20.
39

Variety 2003b, “Media Congloms’ Global Grip Grows”, April 14-20, p.4. Variety.com Whorf, Benjamin. 1956. Language,Thought and Reality. John Wiley & Sons, New York. World Bank. 2001. World Development Report. Oxford University Press, New York.
40

Success or failure of new products is influenced by many factors ranging from
product design, customer response to the marketing strategy used to launch the new
product. Often there is a tendency to focus on product characteristics and marketing
strategy variables and their influence on new product success as these are more readily
measurable. Less attention has been paid to the cultural context or cultural characteristics
of the product in order to understand their impact on new product success.
Genre also influences the likelihood of a film’s success in foreign markets, although the
nature of the effect varied considerably. Again, the overall pattern is consistent with the
findings of Neelemegham and Chintagunta (1999), but the results cannot be directly
compared. One genre, action, had no effect, suggesting that action films that do well in
the US will do equally well in other countries. Six genres were significant across two
language grouping. In German-speaking countries all but one of the genres was
significant. This suggests a much greater sensitivity to cultural nuances than in the other
language groupings. Fantasy films performed significantly better in German-speaking
and English-speaking countries while in the Spanish-speaking countries there was no
effect. Drama and thriller films had less appeal in German and English-speaking
countries. The coefficients for romance and comedy were significant in German-speaking
and English speaking countries, but the signs were reversed. In Germany-speaking
countries, romance and comedy has positive coefficients while in Spanish-speaking
countries, the coefficients were negative. Adventure, action, mystery, science fiction and
horror films were more popular in German-speaking countries, while animated films
were less popular. Family films had less appeal outside the US, although the coefficients
were significant for only the German-speaking and Spanish-speaking countries.
41

The dominance of US films in world markets together with the extent to which
they reflect US values gives rise to a number of issues relating to the success of US films
in international markets. Insofar as US films reflect US cultural values one may expect
they are likely to be more successful in countries and markets which are closer in terms
of cultural values to the US and those which have adopted other US products.
Conversely, the expectation is that US films would be less successful in countries that are
culturally distant from the US.
Films of different genres may also vary in the extent to which they are successful
in foreign markets. Fantasy, action and adventure films, may, for example, be more likely
to appeal to audiences worldwide insofar as they tap universal values and interests and do
not reflect the day-to-day context of a particular culture or location. Further, they are
more visual and rely less on dialogue to communicate with the audience and hence suffer
less from the dubbing and comprehension issues. Family, romance and comedy films, on
the other hand, which are embedded in a specific social context, are less likely to travel
well.
42