Embed Size (px)
Citation preview

Culture, Perceptions and Social Norms
Dr. Jeff Linkenbach,National MOST Of Us® Institute
Montana State University
Copyright-- Linkenbach 2009
Are you getting the results that you want?
To change your results you must transform your paradigm

Why Safety Culture?
Because it works!Decades of research demonstrating how to
positively impact culture by correcting misperceptions

“Organizations with a safety culture are characterized by communications founded on
mutual trust, by shared perceptions of the importance of safety and by confidence in the
efficacy of prevention measures.”
Advisory Committee on the Safety of Nuclear Installations (U.K.)

“People live with a lot of wrong perceptions, ideas, and notions, and when they invest their lives in them, it is dangerous.”
Ticht Nhat Hanh

““Perception is Perception is everything,everything,but so too is but so too is MisperceptionMisperception””Linkenbach, 1999Linkenbach, 1999

The Norm The Perceived Norm
The GAP
The actual behavior or attitude of the majority of a population; what most people do or believe.
The perceived behavior or perceived attitude of most people; what we think most people do or believe.
Social Norms Theory
“How often do you smoke?”
“How often do most students in your school smoke?”

Norms are majority data (51% or better)
54% of MN high school senior girls (51% boys) report not drinking alcohol in the past 30 days. (MN Student Survey, 2007)
75% of MN high school senior girls (65% boys) report not binge drinking in the last 2 weeks. (MN Student Survey, 2007)
92% of MN high school senior girls (72% boys) report not smoking tobacco in the past 30 days. (MN Student Survey, 2007)
99% of MN high school senior girls (97% boys) have not used methamphetamines in the past year. (MN Student Survey, 2007)
Copyright © Linkenbach 2008

Positive Community Norms (PCN) Frames Data for Changing Perceptions
Traditional Frame MNSenior males who sometimes or never wore a seat belt when riding in a car driven by someone else
25%
Positive Community Norms Frame MNSenior males who often or always wore a seat belt when riding in a car driven by someone else
75%
Source: MN Student Survey, 2007.

What’s the norm?
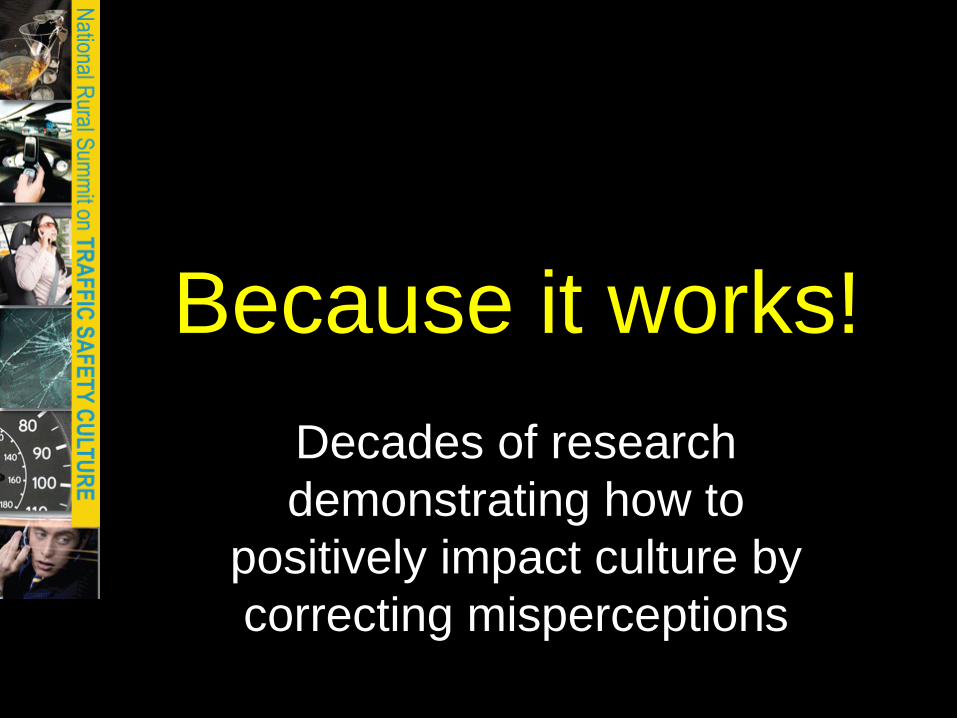
Non-norms are minority data (49% or less)
4% of MN high school senior boys reported smoking half a pack or more per day of cigarettes during the past 30 days. (MN Student Survey, 2007)
27% of MN high school senior girls reported smoking marijuana one or more times in the past year. (MN Student Survey, 2007)
17.6% of MN adults reported binge drinking in the past 30 days. (BRFSS, 2006)
18.3% of MN adults are current cigarette users. (BRFSS, 2006)
Copyright © Linkenbach 2008

A normative misperception is over-estimating or under- estimating norms.
What is a normative What is a normative misperception?misperception?

Linkenbach & Perkins, 1998
Over-estimate the amount of risky or harmful behaviors in their “peers.”
Under-estimate the amount of healthy or protective behaviors.
Misperceptions of Norms Misperceptions of Norms for RISK and PROTECTIONfor RISK and PROTECTION
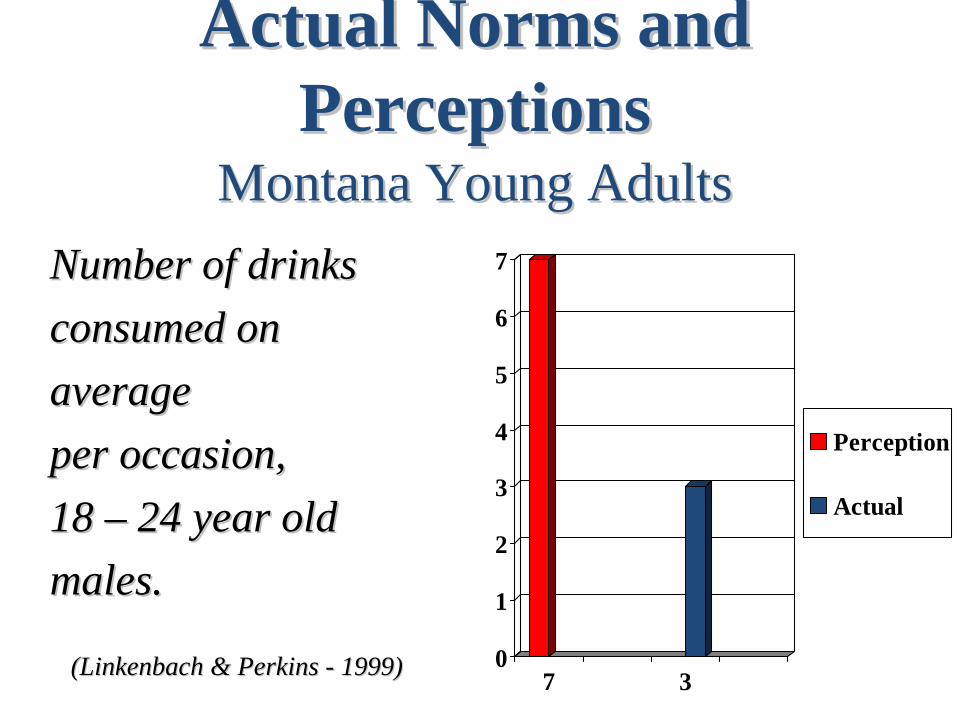
Actual Norms and Actual Norms and PerceptionsPerceptions
Montana Young AdultsMontana Young AdultsNumber of drinksNumber of drinksconsumed on consumed on averageaverageper occasion,per occasion,18 18 –– 24 year old 24 year old males.males.
(Linkenbach & Perkins (Linkenbach & Perkins -- 1999)1999) 0
1
2
3
4
5
6
7
7 3
Perception
Actual

Actual Norms and Actual Norms and PerceptionsPerceptions
Montana Young AdultsMontana Young AdultsPercent of 18 Percent of 18 –– 2424year olds who hadyear olds who hadintervened to stopintervened to stopsomeone they knewsomeone they knewfrom driving after thefrom driving after theperson consumed 2+person consumed 2+drinks within an hour.drinks within an hour.
(Linkenbach & Perkins (Linkenbach & Perkins -- 1999)1999)
0%
10%
20%
30%
40%
50%
60%
70%
17% 61%
Perception
Actual

% of Parent R
espondents
Montana Parent Norms Survey
58
19
46
32
75
15
01020
304050
6070
80
%
Have great influence overteen's decision to use
substances
Discussed rules &expectations w/teen aboutalcohol during past month
Discussed rules aboutalcohol/drug non-use
w/teen in past 3 months
ParentRespondent
Perception ofOther Parents
Linkenbach, 1999
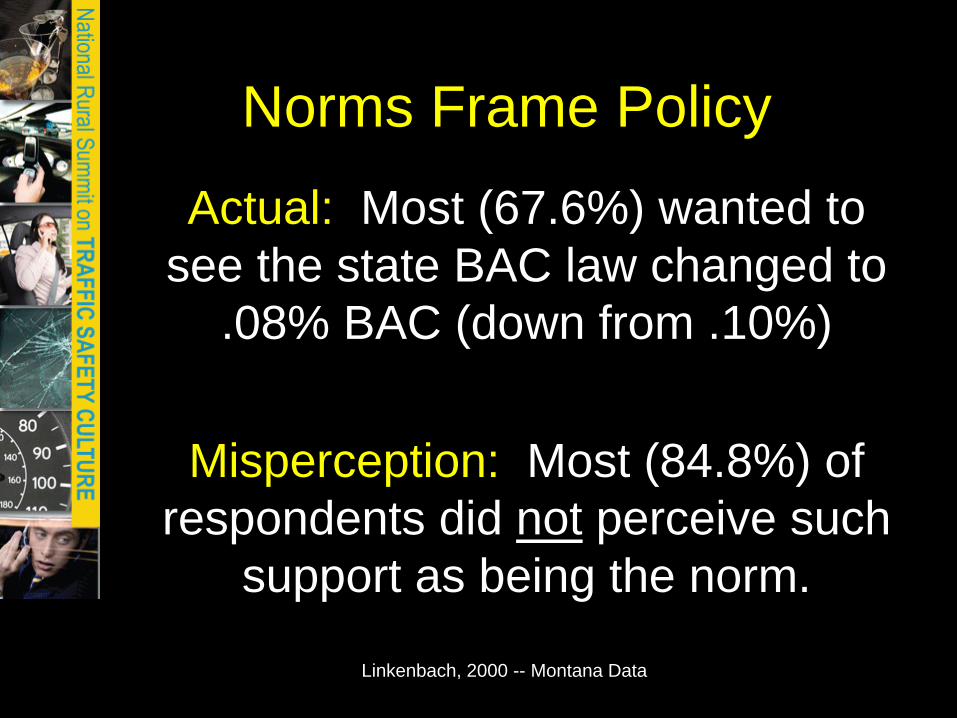
Norms Frame Policy Actual: Most (67.6%) wanted to
see the state BAC law changed to .08% BAC (down from .10%)
Misperception: Most (84.8%) of respondents did not perceive such
support as being the norm.
Linkenbach, 2000 -- Montana Data

Misperceptions are Pervasive
Alcohol, tobacco, drugs (all ages)Traffic safety (seatbelts, laws, dui,…)Different populationsEnergy consumption, paying taxes,…Self report, triangulated and observedWorldwide for various issues

What can we do to correct misperceptions of norms and change behavior?

Pathways of Influence on Seat Belt Use of
Student Drivers
.58
.74
Student Driver:
Reported Seat belt Use
Perception of Peers
Use of Seat belts
.66
Values Responsible
Driving
Has Anti-social
Attitudes
-.32
Always Concentrates
on Driving
.21
Values Use of Seat belts
.42
-.45
Finds Non-Driving
Activities Distracting
.42
Parent Seat belt Use
Expectations
.36
.30
.29

Change
Bystander
Change
Attitudes
Change
Policies &
Regulations
HealthyBehaviors
Change
Perceived
Norm

Billboard from Montana Project

Arizona Teen Seatbelt Research Project
Funded by NHTSA

Poster from Minnesota Project
Most of Us 2008 28

Table tent from Edmonton Project

Billboard from Montana Project

College Newspaper ad from University of Arizona

Navajo Nation
Most of Us 2008 32

Results

Northern Illinois University -18%University of Arizona -21%Western Washington University -20%Hobart & Wm. Smith, Geneva, NY -21%University of Missouri, Columbia -21%Rowan University -20%Others -same…
Reduction of Rate in Heavy Reduction of Rate in Heavy Drinking at different schools over Drinking at different schools over 2 year periods (early research)2 year periods (early research)

MOST Of Us Don't' Drink and Drive -- Linkenbach & Perkins, 2005
• 16.5% increase in support of .08 BAC law
• 13.7% decrease in driving after 2+ drinks then driving w/in one hour in past month
• 15% increase in use of non-drinking designated drivers when drinking
Results of Western vs. Eastern Montana Results of Western vs. Eastern Montana after 15 month campaignafter 15 month campaign
Impaired Driving Among Young Impaired Driving Among Young Adults in MontanaAdults in Montana

Alcohol Perceptions and Behaviors at Powell High School Sources: PNA 2004, 2006; Youth Survey 2003; YRBS 2005, 2007; RAA 2006, 2007
76%
56%
43%50%
47%
39% 37%39%36%
30% 28%
0%
10%
20%
30%
40%
50%
60%
70%
80%
90%
100%
2003-2004 2004-2005 2005-2006 2006-2007
students who believe most of their peers drink once a week or morestudents who report using alcohol in the past 30 daysstudents who report dangerous drinking (binge drinking)
Copyright © Linkenbach 2008

10%
17%
0%2%4%6%8%
10%12%14%16%18%
Treatment Control
Tried Smoking forFirst Time between2000 and 2001
%
41% difference in proportion *Statistically significant at p < .05
MT Youth Trying Smoking for the MT Youth Trying Smoking for the First Time Between 2000First Time Between 2000--20012001

“If you are here to help me, then you are wasting your time – But, if you have come because your liberation is tied up in mine then let us begin”
Lilly Walker, Australian Aborigine

““By investing in By investing in correcting correcting misperceptions, we misperceptions, we change behavior change behavior and transform and transform community norms.community norms.””

Montana Summer Institute
July 9th-11th, 2009