Embed Size (px)
Citation preview
COP"'( ;;..~ .. C"-. .... :1';- r"J p'-
::,~'::"._L .
CUMULATIVE DAMAGE IN STRUCTURAL JOINTS
By
JAMES R. FULLER
KENNETH S. PETERSEN
and
W. H. MUNSE
UNIVERSiTY OF ILLINOIS
URBANA, ILLINOIS
;.,
- 1 - .~ ~~'of ~


CUMULATIVE DAMAGE IN STRUCTURAL JOINTS
by
James R. Fuller
Kenneth S. Petersen
and
W. H. Munse
A Progress Report of an Investigation Conducted
by
THE UNIVERSITY OF TI..LINOIS ENGINEERING EXPERJNENT STATION
in Cooperation with
The Research Council on Riveted and Bolted structural Joints,
The Illinois Division of Highways
and
The Department of Commerce - Bureau of Public Roads
PROJECT VIII
University of Illinois Urbana, Illinois
January 1957
, f


CONTENTS
I. INTRODUCTION
1. Preliminary Remarks
2. Fatigue Damage Studies
3. Cumulative Damage in Fatigue
4. Object and Scope of Investigation • •
5. Acknowledgment
II. DISCUSSION OF OTHER TESTS
• • • • • 0 • • • • • • •
1. Spectrum Type Fatigue Tests •
ii
1
2
5
12
15
17
2. Statistical Nature of Fatigue Test Results ',. 25
III. TEST EQUIPMENT
1. Variable -Cycle Fatigue Machine
2. Electrical Control and Measurement System 32
3. Programming System
IV. DESCRIPTION OF SPECIMENS AND RESULTS OF TESTS
1. Specimens and Material
2. Joint Fasteners • . • .
3. Constant-Cycle Fatigue Tests
4. Variable-Cycle Fatigue Tests
5. Static Tests
V • SUMMARY OF RESULTS
1. Summary of Previous Studie s •
2. Summary of Present Study
37
39
40
41
45
49
51
52

VI. CONCLUSIONS
BIBLIOGRAPHY •
TABLES
FIGURES
CONTENTS (Continued)
iii
57
59
62
7l

LIST OF TABLES
Table No. Title
1 Comparison of Freudenthal's Test Results on 75S-T6 Aluminum Alloy wit...'l-J. Computed Results •
2 Characteristics of Variable-Cycle Test System
3
4
5
6
7
Average Mechanical Properties of 5/16-in. Structural Steel Plate for Test Specimen
Results of Constant-Cycle Fatigue Tests of Joint Specimens . . . · · · · · · Resul ts of Const811t-Cycle Fatigue Tests of Plain Plate Specimens · · · · · · Results of Variable-Cycle Fatigue Tests of Joint Specimens . . . · · · 0 · · Results of Variable..cycle Fatigue Tests of Plain Plate Specimens · · · · · ·
8 Predicted Results for Variable-Cycle Fatigue Tests • • • • • •
9 Ultimate Strengths and Efficiencies of Joint Specimens • • • • • • • • • • • • •
iv
64
66
68
70

v
LIST OF FIGURES
Fig. No. Title
1 Results for Rotating Beam Tests of SAE 1020 Steel, Kommers, 1945, (14)
2 Diagrams Illustrating How Total Cycles to Failure May Vary with the Prestress
3 Comparison of Miner's Theory with Test Results for SAE 1020 Steel, Kommers, 1945, (14)
4 Fre~uency Distribution of Maximum ptresses Obtained from AAR Tests
5 Test Results for Unnotched Rotating Beam Specimens of SAE 1045 Steel Subjected to Load Cycle B, Dolan et 81, 1949, (19)
6 Test Results for Unnotched Rotating Beam Specimens of SAE 4340 Steel for Load Cycle B, Dolan et al, 1949, (19)
7 Test Results for Unnotched Rotating Beam Specimens of SAE 4340 Steel with a Minor Stress Amplitude of 78,000 psi for Load Cycle A, Dolan et al, 1949, (19)
8 Variation of Distribution Coefficient, ~, for Loading Spectrums of Two Stress Levels, from Tests of Dolan et ai, 1949, (19)
9 Test Results for Unnotched Rotating Beam Specimens of SAE 4340 Steel with a Mlnor Stress Amplitude of 78,000 psi for Load Cycle G, Dolan et al, 1949, (19)
10 Fre~uency Distribution and Log-Distribution Diagrams for a Sine Wave Loading Spectrum
II Distribution Patterns Used by Freudenthal for Tests on 75S-T6 Aluminum Alloy and Derived 3-Cycle Log-Distribution Patterns.
12 Distribution Patterns Used by Freudenthal for Tests on 75S-T6 Aluminum Alloy and Derived 3-Cycle Log-Distribution Patterns.
13 Freudenthal t s Tests on Rotating Beam Specimens of 75,S-T6 Aluminum Alloy (These data represent the results of 300 fatigue tests.)

vi
LIST OF FIGURES (Continued)
Fig. No. Title
14 Distributions for Fatigue Failures
15 50,000 Ib Variable-Cycle Fatigue Testing Machine
l6 Schematic Diagrams of Linkage Mechanism for Range Control
17 Views of Control Mechanisms for Variable-Cycle Fatigue Testing Machine
18 Block Diagram for Electrical Load Control and Measurement System
19 Sample Record of Load Pattern for Present Test Series
20 View of Load Control and Recording Equipment
21 View of Programming Unit
22 Details of Specimens
23 S-N Diagram for Joint Specimens, Constant-Cycle Tests
24 S-N Diagram for Plain Plate Specimens, Constant-Cycle Tests
25 Log-Normal Probability Diagrams for Constant-Cycle Tests of Joint Specimens
26 Results of Variable-Cycle Fatigue Tests on Joint Specimens
27 Results of Variable-Cycle Fatigue Tests on Plain Plate Specimens
28 Comparison of Test Cycles with Time for Testing
29 Average Load-Slip Curves for Slip at First Row Fasteners, Static Tests


I. INTRODUCTION
1. PRELIMINARY REMARKS
In this age of fast moving vehicles and high speed machinery,
engineers are often confronted with problems which were not important
a number of years ago. Not only must present day structural elements
often sustain higher stresses than formerly, but in many cases they
must also sustain a larger number of repetitions of these stresses. Of
the many problems in our modern technology few are as perplexing as
those of guarding against failures of metal by fatigue.
The fatigue strengths of metals in structures hav~ not been
advanced to the same degree as their static strength properties and, as
a result, fatigue failures have become more prominent. A large per
centage of present day structural failures are in some way related to
the repeated application of relatively high service stresses.
Such failures are difficult to anticipate because so little
is known about the basic nature of fatigue. There are questions as to
how the erac~ originate and how fast they are likely to grow under
repeated loadings and render the structural element unfit or unsafe.
When does fatigue damage begin and how does it accumulate? Qualita
tively, it is known that points of high stress concentration are
danger points for fatigue failures. Therefore, actual tests must be
conduc.ted- on specific parts, which are loaded precisely as they are
in service and under similar environmental conditions, before a
reasonably accurate estimate of the fatigue life can be ascertained.

2
Since the formation of a fatigue crack is a very localized
phenomenon, its place and time of inception depend not only on the
geometry and general stress condition in the part, but also on the
textural stresses in the metal at critically stressed regions. The
size, shape, and orientation of the individual grains as well as
their crystalline structure and boundaries all influence the forma
tion and growth of the crack from a microscopic or submicroscopic
point of weakness until it can be seen with the naked eye. Any in
fluence that affects the mechanical behavior of the metal can cer
tainly be expected to have some effect on its fatigue properties.
However, attempts to predict the fatigue life of a metal from a
knowledge of its various measurable properties have not met with
complete success for even the simplest type of specimen and a con
stant stress cycle.
In actual service, structural elements are seldom sub
jected to simple constant stress cycles. The loads which come onto
most structures cause stresses which vary considerably from one
cycle to the next 0 Therefore, it is desirable to supplement basic
research in fatigue by considering the effects of mixed cycles of
loading to determine how fatigue damage accumulates.
2. FATIGUE DAMAGE STUDIES
Studies were started more than twenty years ago to try
to correlate the fatigue lives of standard type specimens which
have been subjected to mixed cycles of stress with conventional S-N
3
relationships for the same type of specimen. Most of this research
has been done on round polished specimens stressed in reversed bend-
ing; however, some tests have been made using direct axial loads.
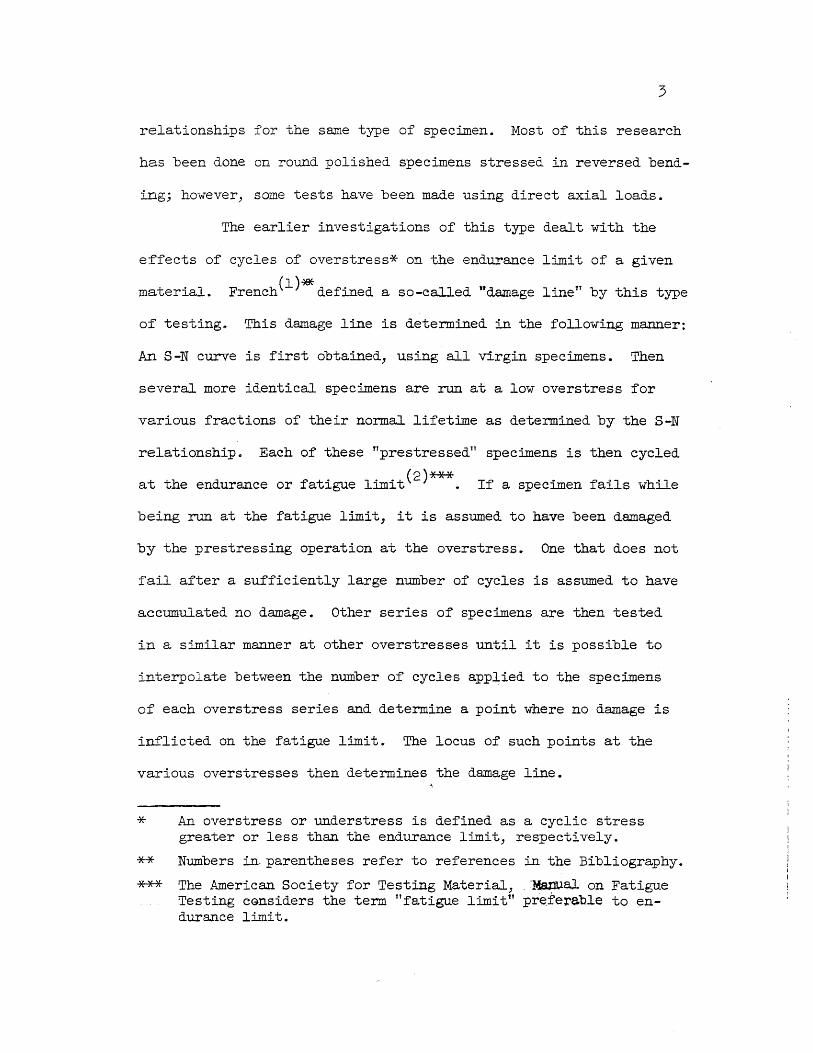
The earlier investigations of this type dealt with the
effects of cycles of overstress* on the endurance limit of a given
material. French (1)"** defined a so-called "damage linefT by this type
of testing.. This damage line is determined in the following manner:
An S-N curve is first obtained, using all virgin specimens. Then
several more identical specimens are run at a low overstress for
various fractions of their normal lifetime as determined by the S-N
relationship 0 Each of these rtprestressedTl specimens is then cycled
at the endurance or fatigue limit (2)***. If a specimen fails while
being run at the fatigue limit, it is assumed to have been damaged
by the prestressing operation at the overstress. One that does not
fail after a sufficiently large number of cycles is assumed to have
accumulated no damage. Other series of specimens are then tested
in a similar manner at other overstresses until it is possible to
interpolate between the number of cycles applied to the specimens
of each overstress series and determine a point where no damage is
inflicted on the fatigue limit. The locus of such points at the
various overstresses then determines the damage line.
* An overstress or understress is defined as a cyclic stress greater or less than the endurance limit, respectively.
** Numbers in-parentheses refer to references in the Bibliography.
*** The American Society for Testing Material, -Manual on Fatigue Testing cGnsiders the term "fatigue limi t 11 pr~ferable to endurance limit.

Similar tests have also been conducted by Moore(3),
Kommers(4,5), and others. Kommers determined new fatigue limits
for the prestressed specimens 0 He then expressed the damage as
4
the per cent change in the initial fatigue limit caused by the pre-
stressing, where either understresses or overstresses were used as
the prestresso His results indicate that there is a rapid" increase
in damage with an increase in the number of cycles at the higher
overstresses 0 That is, damage increases at an increasing rate with
the number of overstress cycles applied 0 He concluded that a
material which has been subjected to an overstress and then to an
understress finally fails at a stress below the initial fatigue
limit, because overstressing causes a decrease in the initial fatigue
limit 0 Other observations showed that for some materials, there
appeared to be an actual increase of the fatigue limit due to some
cycling at low overstresseso Apparently, these materials were not
damaged significantly until a very large percentage of the normal
fatigue life at these overstresses had been expendedo
(6) Lea' conducted overstress and understress tests on an
annealed 0.32 per cent carbon steel having a tensile strength of
72,000 psi and a rotating beam fatigue limit of 32,000 psio The
estimated fatigue life at 40,000 psi was 12,500 cyclesc By cycling
a specimen just under the fatigue limit and by repea~edly increas-
ing the stress in small increments up to 40,000 psi, it was possible
to apply 40,000,000 cycles at the latter stress level before failure
occurred. The normal life at 40,000 psi had been increased 3,350 times.

5
Swanger and France(7) also report some interesting results similar
to these 0 This type of testing is reported in many places in the
literature and is generally known as coaxingG
(8) Gough' and ma..l1Y other investigators believe that under~
stressing tends to work-out the peak textural stresses in the virgin
material into a more homogeneous distribution and, in effect, in-
creases the fatigue limite Overstressing, on the other hand, is
believed to aggrevate the textural stress condition by more severe
plastic deformation, particularly in the partially unrestrained
material at the surfaces 0 It is here that fatigue cracks are gener-
ally believed to form 0 M~ch of the fatigue damage work reported in
the literature has been along these lines. It is not directly ap-
plicable to design problems, but it has aided greatly in a better
general understanding of fatigue damage from a phenomenological
viewpoint 0
30 CUMULATIVE DAMAGE IN FATIGUE
Most so-called cumulative fatigue damage studies have been
concerned with the effects of prestressing at one overstress on the
subsequent endurance at another overstress or t1test stressn 0 These
studies have led to methods for estimating the fatigue lives for
variable-stress-cycle loading and can be applied to certain design
problems 0 Important general conclusions can also be drawn from these
more recent investigationso For the purpose of discussing these con-
clusions, the following terminology will be used:

6
S Maximum stress of a stress cycle.
N = Number of cycles to failure applied to a specimen
at a stress, So
n = The number of cycles endured at any stage of a
fatigue test at a stress, S& n always less than ND
R = Cycle ratio, the ratio of the stress cycles applied
at a given stress level to the expected fatigue life
as estimated from the S-N curve for that stress level J
R = niNo
D = Fatigue damage done to a specimen by previous fatigue
stressing, measured as the per cent shortening or
lengthening of the fatigue life at the final or test
stress levelo
palmgren(9; 10) is reported to have suggested a method for
analyzing data for fatigue tests at several stress levelso The method
was then considered by Miner(ll)J Luthander and Wallgren(12), and
others for design purposeso Miner conducted tests on 24s-T aluminum
alloy plain sheets and riveted joints; and the method generally car-
ries his name in this country 0
In analyzing data by this method, it is assumed that'there
is a linear relationship between the prestress cycle ratio and damage
at any given overstress level, and furthermore, that during the course
of any fatigue test, the damage is equal to the summation of all of the
prestress cycle ratioso Thus, the damage, D, and the cycle ratio, Rj
would be equal to n/Nfor each block of cyclic stress applied, and this
cumulative cycle ratio would sum to unity at failureo
7
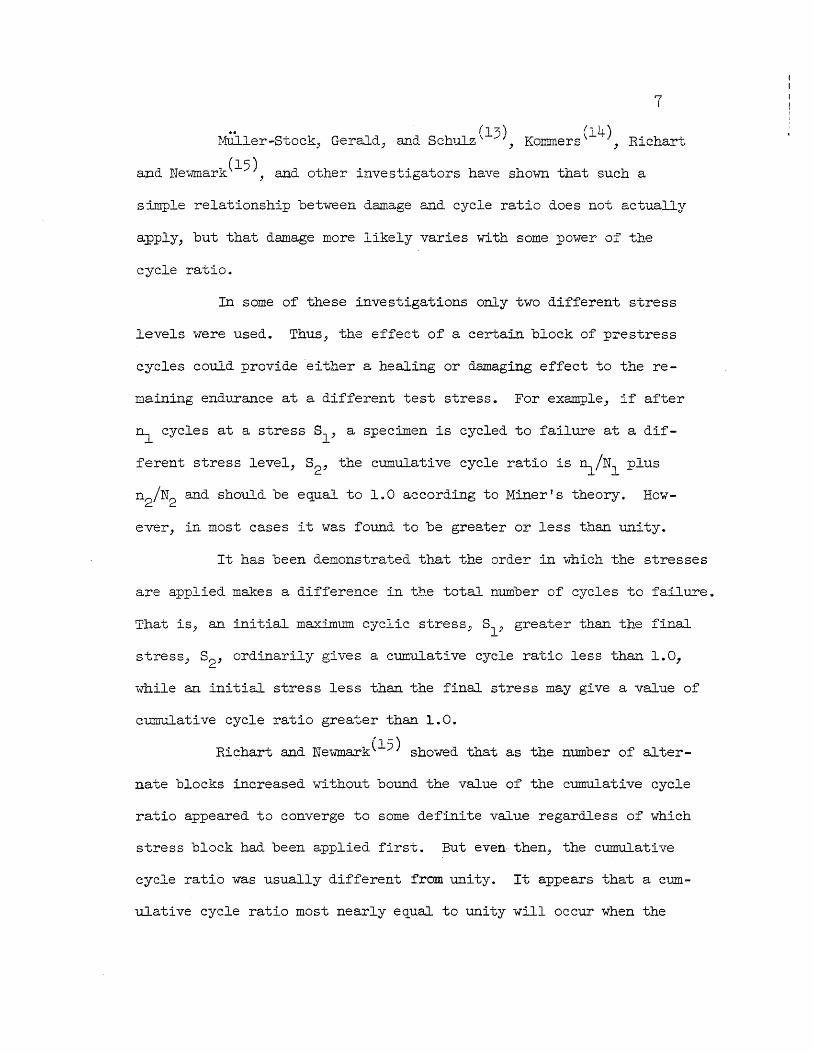
MUller-Stock, Gerald, and 8ChulZ(13), Kommers(14), Richart
and Newmark(15), and other investigators have shown that such a
simple relationship between damage and cycle ratio does not actually
apply, but that damage more likely varies with some power of the
cycle ratio.
In some of these investigations only two different stress
levels were usedq Thus, the effect of a certaLn block of prestress
cycles could provide 'either a healing or damaging effect to the re-
maining endurance at a different test stress o For example, if after
~ cycles at a stress 81 , a specimen is cycled to failure at a dif
ferent stress level, 82, the cumulative cycle ratio is n1/Nl plus
n2/N2 and should be e<lual to 100 according to Miner! s theory. How-
ever, in most cases it was found to be greater or less than unity.
It has been demonstrated tD~t the order in which the stresses
are applied makes a difference in the total number of cycles to failure.
That is, an initial maximum cyclic stress~ Sl' greater than the final
stress, 82, ordinarily gives a cureulative cycle ratio less than 1.0,
while an initial stress less than the final stress may give a value of
cumulative cycle ratio greater than 1.0.
Richart and Newmark(15) showed that as the number of alter-
nate blocks increased without bound the value of the cumulative cycle
ratio appeared to converge to some definite value regardless of which
stress block had been applied first. But even· then, the cumulative
cycle ratio was usually different from unity_ It appears that a cum-
ulative cycle ratio most nearly e<lual to unity will occur when the

8
prestress and test stress are nearly the same. This is to be ex-
pected, because the fatigue lives at the two stress levels would
be very nearly equalo
A point that stands out in nearly all of these tests is
that a specimen which is being cycled in fatigue is in a nearly con-
stant state of change, particularly if the maximum stress of the
cycle is an overstresso If a given set of specimens were all cyc~ed
at a const'ant maximum stress for an equal number of cycles, this set
of specimens would be prestressed. Then if another S-N diagram were
determined using these prestressed specimen and including the cycles
of prestress in the new plot, the new diagram would cross the S~N
diagram for the original specimens at the value of the prestresso
This would occur because continued cycling of a prestressed specimen
at the prestress value would cause failure as predicted by the original
S-N diagram. Also, it has been shown by previous test results that
prestressed specimens will give a new S-N diagramo HoweverJ the
fatigue lives are usually more scattered than for tests at a single
stress level 0
Figure 1 shows some of the results of tests made by
Kommers (14) on J:otating-beam specimenB of SAE 1020 steel o The upper
diagram in this figure shows the new S-N relationships that were
determined after prestressL~g the specimens at 36,000 psi for various
prestress cycle ratios, R. The lower diagram shows the same test data
except that the cycles of prestress are included with the test stress
cycles to failure.
9
It may also be noted that the apparent II rotation" of the
diagrams with respect to the basic S-N curve and a vertical line
through the point of rotation is approximately proportional to the
cycle ratio of the prestress. Thus, for zero cycles of prestress,
R = 0, a test point would lie on the S-N curve J and for R = 100,
the specimen would fail before any test stress cycles could be ap
plied. Therefore, the point representing zero cycles of test stress
could be plotted at any point on the vertical line through the point
of rotation.
From a study of Kommers,(14) data and tests by Bennet(16)
and others, it appears that S-N diagrams for prestressed specimens
will !!rotateT! in a clockwise fashion about the point on the original
S-N diagram corresponding to the value of the prestress. This illus
trates some of the principal findings of the earlier fatigue damage
studies--that a high overstress has a damagL~g effect on the subse
~uent remaining fatigue life at a lower stress and that a low stress
tends to show a healing effect on the endurance at a higher subsequent
stresse
A possible effect of prestressing specimens at one or more
values of prestress is further indicated in Fig. 20 In this illustra
tion it is assumed that an overstress, 81
, is applied to all of the
specimens for ~ cycles. The specimens will be sufficiently changed
by this prestressing operation that they will yield an 8-N curve
different from that of the original specimens. If this new S-N curve
10
is determined and if the cycles of prestress are included L~ its
re~resentation, a curve such as 2-2 will result 0 Two things may
be noted concerning Curve 2-2; first, it crosses the original 8-N
diagram at the value of the prestress, and secondlYJ it is rotated
in a clockwise direction witb. respect to the original diagram 0 If,
after cycling at 81 for nl cycles, the specimens were subjected to
an additional n2 cycles at 82 and another 8~N relationship were es
tablished including the cycles ~ plus n2, a curve such as 3-3 would
possibly resulto
This implies that if the applied cyclic stresses are always
within the finite life range of the basic S-N relationship, the
fatigue life can be bracketed on the original diagram between the
number of cycles required to cause failure at the upper and lower
maximum cyclic stresses. Presumably, the location of the pOint
representing the number of cycles to fail'Llre wi thin this bracket
would be a function of the general configuration of the blocks of
the applied cyclic stresses. Of course, an approximation for an
e~uivalent random variation in stress cycles could be attained only
if the pattern of blocks of stresses were repeated a sufficiently
large number of times such that the order of the application of the
stresses within the pattern or spectrum would make no discernable
difference in the total number of cycles to failure.
Damage curves can be utilized to compare this observation
,{i th test data 0 If the damage is equal to the cycle ratio as Miner
and others have surmised, then curves of constant fatigue damage are
II
the same as curves of constant prestress cycle ratio. It is possible
to construct curves of constant damage by using Miner1s theory and an
S-N diagram. For this type of plot, the basic S-N diagram is the
curve for a test stress cycle ratio and damage of 1$0. The data from I ... 4 \
Kommersl\~ ) tests as shown in Fig. 1 have been replotted in Fig. 3.
The solid curves in the upper diagram show the number of cycles to
failure after various cycle ratiosJ RJ of the prestress have been
aPFlied. The dashed-line curves are loci of constant fatigue damage
from Minerts theory due to prestressing at 36,000 psi. The remaining
fatigue life may then be obtained as the number of cycles between the
respective damage curve and the basic S-N diagram. The S-N diagram
is obtained by test stress cycles only; therefore, the prestress
cycle ratio for this cULrve is zero. The number of cycles between the
dashed-line damage curve, D = 0.2, and the S-N diagram, R = 0, corres-
ponds to 0.8 of the fatigue life at the test stress, because the total
or cumulative cycle ratio must be 1000
The lower part of Figo 3 shows the total number of cycles to
failure including the cycles of prestress at 36,000 psi. The dashed-
line curves are those predicted by Mlner's theory arld the two solid
curves, R = 0 and R = 0.8, are those determined by Kommers ' tests.
These curves clearly illustrate one serious defect in Miner's theory;
this is the assumption that no damage is entailed when cycling below
the fatigue limit. The lower diagram of Fig. 3 show's the failure may
occur at 1,000,000 cycles at a stress approximately 3,000 psi below
the fatigue limit after a cycle ratio of 0.8 had been applied at the
12
prestress. Certainly these stresses below the fatigue limit are
comparable to service stresses, and their effect on the fatigue
life cannot be discounted. If a crack begins at previously applied
high stresses and continues to propagate at stresses below the
fatigue limit, this effect is important and should be considered.
4. OBJECT AND SCOPE OF INVESTIGATION
The objectives of the preliminary research program de
scribed herein were:
1. To complete the design and construction of a
50,000 lb. variable-cycle fatigue testing machine
and prograrrrrning apparatus to test structural joint
specimens ..
2. To. review past investigations in cummulative fatigue
damage and to correlate the findings with the pre
sent study.
3. To determine the fatigue lives of double-strap butt
joint specimens and plain plate specimens when tested
in pulsating tension under a loading pattern which
approximates the statistical distribution of service
loads on present day medium span, main line railway
bridges.
4. To ascertain the important parameters in these tests
so that a more comprehensive test program can be
planned.
13
Evaluations of variable-cycle fatigue tests in previous
investigations have been based on conventional S-N relationships
for the specimens. In order to make a correlation, the stress cycle
used for both constant and variable-cycle tests must have a common
basis of comparison. The mean stress, the minimum or maximmn stresses,
or the type of stress cycle (zero to tension, etc.) must be held con
stant. But, in the actual stTIlcture, there may be no well defined
minimmn or maximmn stresses to which a member is subjected. It is
logical to believe, however, that variations in stress at the smallest
stress levels are of less significance than those due to heavy live
loads and impact. Thus, the maximum stresses and the cyclic variation
in these stresses are of principal interest in this study.
If representative samples of these maximum cyclic stresses
for a stTIlctural element are ascertained and sorted according to de
creasing magnitudes, a load-frequency spectrum can be constructed.
The research staff of the Association of American Railroads has con
ducted a nmnber of field studies(17, 18) to determine the static and
dynamic effects in plate girder bridges resulting from the passage
of trains. It is evident from a study of the reports on this work
that the maximum stress in the girders was not obtained with the
passage of each train, but rather by only a small percentage of the
trains. The nature of the frequency-distribution spectrum for the
maximum stresses obtained in the AAR tests is presented in Fig. 4.
If such a frequency spectrum is used as the' envelope of
the maximum cyclic stresses over a given number of cycles, and if
14
a fixed minimum stress is established, then the data from fatigue
tests conducted according to this stress pattern could be compared
with constant-cycle fatigue tests having the same fixed minimum
stress. The fatigue lives obtained by cycling under this spectrum-
type pattern should then be more nearly congruent with actual
fatigue lives under service conditions.
For the present study the maximum cyclic stresses are
varied as a sine wave from some major maximum stress value, SA' to
a minor maximum, S , one-half as great. It is assumed that this a
pattern approximates the frequency distribution data obtained in
the field. Under this type of pattern, part of the stress cycles
will be below the fatigue limit. From a study of the previously
mentioned investigations it was somewhat uncertain \ihat effect this
would have on the fatigue life.
According to Miner t s theory, the value of' the cumulative
cycle ratio for stresses below the fatigue limit is always zero
because the number of cycles to failure at these low stresses is
infinite. But it is known that overstressing can lower the fatigue
limit and also that understressing can coax the fatigue limit upward
for some materials.
With these questions in mind, it was necessary to study
other variable-cycle fatigue data wherein various loading spectrums
were used and where some of the stress cycles were below the fatigue
limit for the original material.
would reveal a method for approximating empirically the f'atigue lives
15
of structural joints when tested under any given loading spectrum.
Also, it was felt that a small series of tests of larger members
would indicate the general validity of the analysis.
5. ACKNOWLEroMENT
The study described herein is part of an investigation
carried on as a result of a cooperative agreement between the
Engineering Experiment Station of the University of Illinois, the
Illinois Division of Highways, the Department of Commerce--Bureau
of Public Roads, and the Research Council on Riveted and Bolted
Structural Joints. It is part of the structural research program
of the Department of Civil Engineering of which Professor N. N.
Newmark is Head. Most of the work was carried out by J. R •. Fuller,
formerly a Research Assistant in Civil Engineering working under
the supervision of W. R. Munse, Research Professor of Civil
Engineering.
All units for the variables cycle fatigue testing machine
used for this investigation were constructed in the Structural
Laboratory at the University of Illinois. All machine shop work
was carried on under the supervision of D. F. Lange, Instrument
Maker and supervisor in the Civil Engineering Shop in the Laboratory.
Initial portions of the design for this machine were completed by
W. J. Hall, Research Assistant Professor of Civil Engineering(23).
The other parts of the machine for activating both the mean-load
and range-control mechanisms, and the mechanical portions of the

16
programming unit were designed by J. R~ Fuller. V. J. McDonald,
Research Assistant Professor of Civil Engineerin&designed the elec
trical portion of the control and programming systems which was built
by R. J. Craig, Senior Electronics Technician of the Department of
Civil Engineering. K. S. Petersen, Research Assistant in Civil Engi
neering, conducted many of the variable cycle fatigue tests.
The tests described in this report were pl~~ed by the
Project VIII Committee of the Research Council on Riveted ~~d Bolted
Structural Joints. This committee is concerned with cumulative damage
in the fatigue of structural joints. The members of Project VIII
Committee are as follows:
w. H. Munse, Chairman N. M. Newmark
Raymond Archibald Eo ' J. Ruble
J. w. Carter V. M. Romine
K. H. Lenzen E .. w. 'Larson
Frank Baron
17
II. DISCUSSION OF OTHER TESTS
1. SPECTRUM TYPE FATIGUE TESTS
If a specimen is cycled under some variable load pattern
between two limiting overstresses J the greater of which is SA and
the smaller S , then failure may be expected to occur at some number a
of cycles greater than that which would cause failure by cycling at
SA alone or less than that which would cause failure by cycling at
S alone. Furthermore, if a given prestressing operation affects a
the fatigue life in a particular T.,Yay, then a repeated set of pre-
stressing operations should also produce a definite effect. Thus,
by cycling under some variable load pattern whose upper and lower
bounds are overstresses, it would seem likely that the fatigue life
would be a function of the variable load pattern and the stress
levels, and that it could be related to the basic S-N diagram.
Dol&~, Richart, and Work(19) conducted a rather extensive
series of tests on notched and unnotched rotating beam specimens
of several materials using three different variable load patterns,
which they refer to as load cycles B, A, and G, respectively. Two
of these patterns, B and A, were of the rectangular two stress level
block type, and the third, pattern G, was a sine wave. All three
had a duration of 10,000 cycles. For purposes of discussion~ only
the results of the tests on the steel specimens from the above paper
vlili be considered.
18
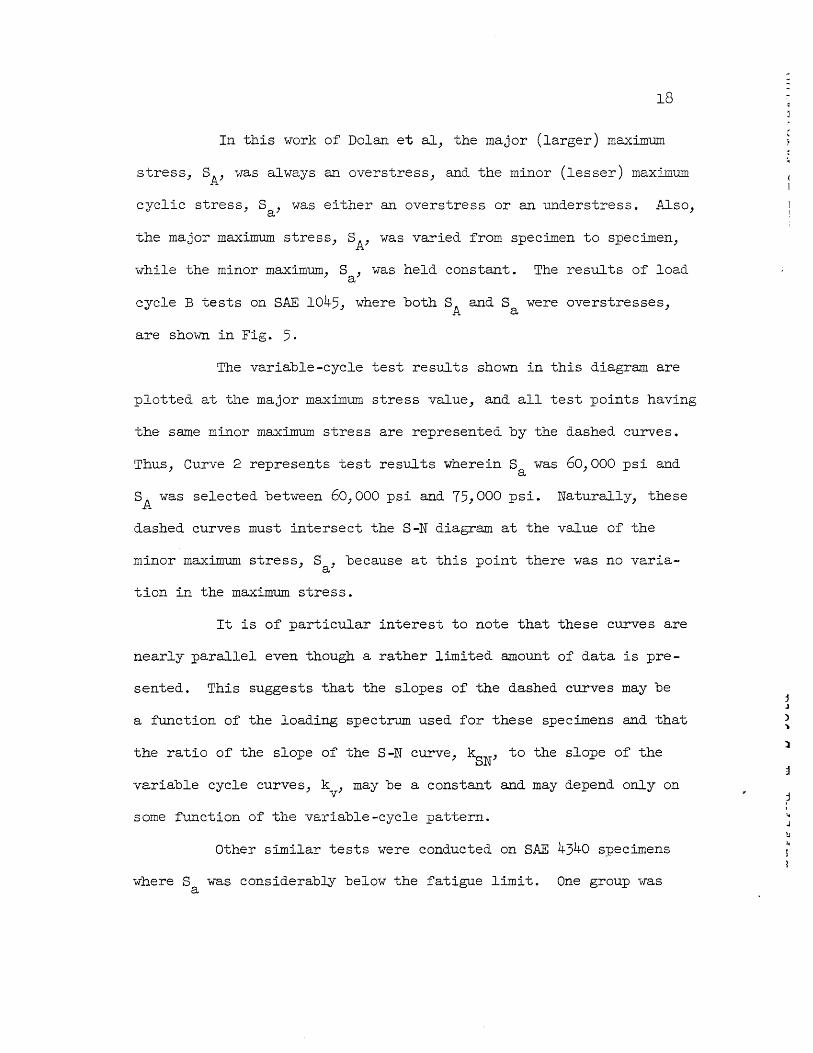
In this work of Dolan et al, the major (larger) maximum
stress, SA' was always an overstress, and the minor (lesser) maximum
cyclic stress, S , was either an overstress or an understress. Also, a
the major maximum stress, SA' was varied from specimen to specimen,
while the minor maXimum, S , was held constant. The results of load a
cycle B tests on SAE 1045, where both SA and Sa were overstresses,
are shown in Fig. 5.
The variable-cycle test results shown in this diagram are
plotted at the major maximum stress value, and all test points having
the same minor maximum stress are represented by the dashed curves.
Thus, Curve 2 represents test results wherein S was 60,000 psi and a
SA was selected between 60,000 psi and 75,000 psi. Naturally, these
dashed curves must intersect the S-N diagram at the value of the
minor maximum stress, S , because at this point there was no variaa
tion in the maximum stress.
It is of particular interest to note that these curves are
nearly parallel even though a rather limited amount of data is pre-
sented. This suggests that the slopes of the dashed curves may be
a function of the loading spectrum used for these specimens and that
the ratio of the slope of the S-N curve, kSN' to the slope of the
variable cycle curves, k , may be a constant and may depend only on v
some f~~ction of the variable-cycle pattern.
Other similar tests were conducted on SAE 4340 specimens
where S was considerably below the fatigue limit. One group was a
l
j
19
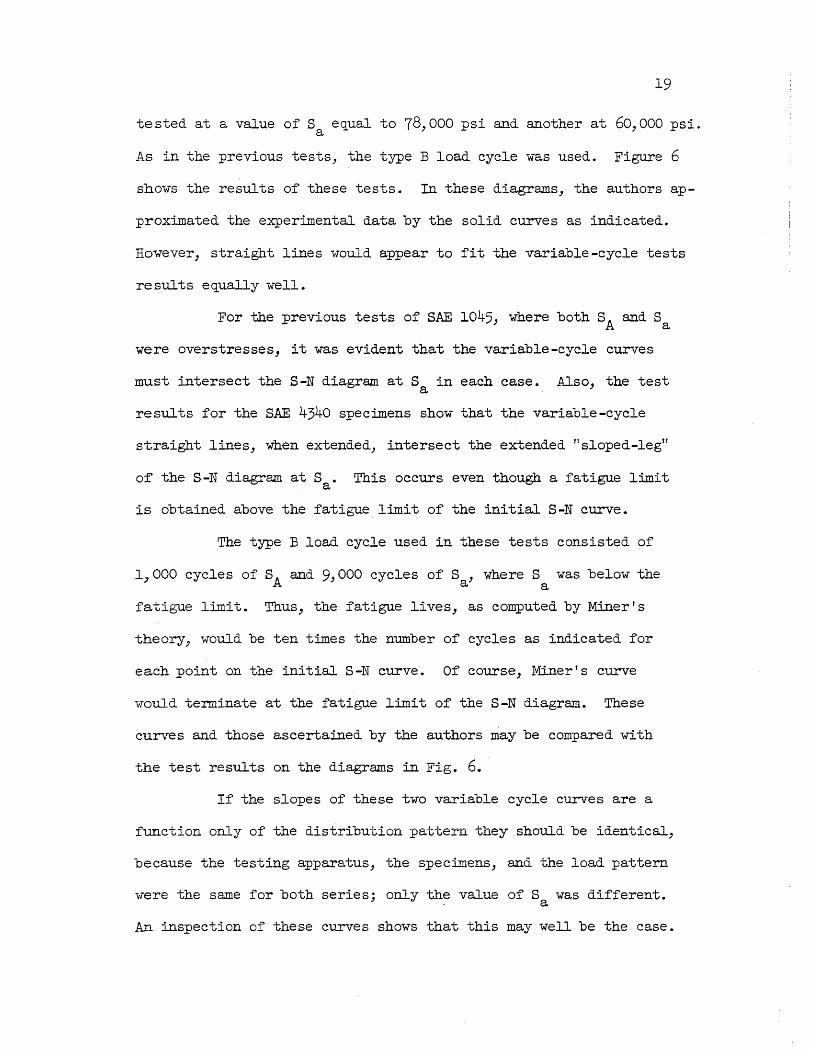
tested at a value of S equal to 78,000 psi and another at 60,000 psi. a
As in the previous tests, the type B load cycle was used. Figure 6
shows the results of these tests. In these diagrams, the authors ap-
proximated the experimental data by the solid curves as indicated.
However, straight lines would appear to fit the variable-cycle tests
re sul ts equally well.
For the previous tests of SAE 1045, where both SA and Sa
were overstresses, it was evident that the variable-cycle curves
must intersect the S-N diagram at S in each case. Also, the test a
results for the SAE 4340 specimens show that the variable-cycle
straight lines, when extended, intersect the extended n sloped-leg"
of the S-N diagram at Sa. This occurs even though a fatigue limit
is obtained above the fatigue limit of the initial S-N curve.
The type B load cycle used in these tests consisted of
1,000 cycles of SA and 9,000 cycles of S , where S was below the a a
fatigue limit. Thus, the fatigue lives, as computed by Mdner's
theory, would be ten times the number of cycles as indicated for
each point on the initial S -N curve. Of course, Miner's curve
would terminate at the fatigue limit of the S -N diagram. These
curves and those ascertained by the authors may be compared with
the test results on the diagrams in Fig. 6.
If the slopes of these two variable cycle curves are a
function only of the distribution pattern they should be identical,
because the testing apparatus, the specimens, and the load pattern
were the same for both series; only the value of Sa was different.
An inspection of these curves shows that this may well be the case.
20
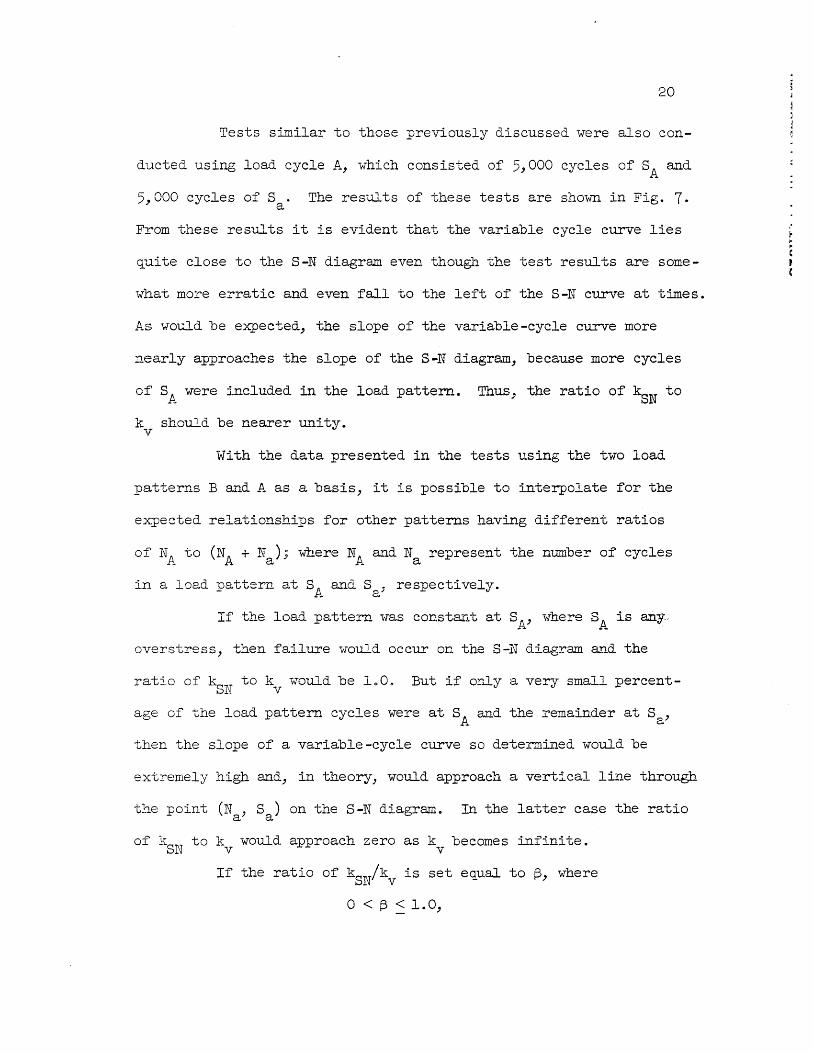
Tests similar to those previously discussed were also con-
ducted using load cycle A, which consisted of 5,000 cycles of SA and
5,000 cycles of S. The results of these tests are shown in Fig. 7. a
From these results it is evident that the variable cycle curve lies
~uite close to the S-N diagram even though the test results are some-
what more eTratic and even fall to the left of the S-N curve at times.
As would be expected, the slope of the variable-cycle curve more
nearly approaches the slope of the S-N diagram, because more cycles
of SA were included in the load pattern. Thus, the ratio of ~N to
k should be nearer unity. v
With the data presented in the tests using the two load
patterns B and A as a basis, it is possible to interpolate for the
expected relationships for other patterns having different ratios
of NA to (NA + Na ); where NA &~d Na represent the number of cycles
in a load pattern at SA and Sa' respectively.
If the load pattern was constant at SA' where SA is any,
overstress, then failure would occur on the S-N diagram ~~d the
ratio of kSN to kv would be 1000 But if only a very small percent
age of ~he load pattern cycles were at SA and the Temainder at Sa'
then the slope of a variable-cycle curve so determined would be
extremely high and, in theory', would approach a vertical line through
t~e point (N , S ) on the S-N diagram. In the latter case the ratio a a
of kSN to kv would approach zero as kv becomes infinite.
If the ratio of kSN/kv is set equal to ~, where
o < ~ :::: 1.0,
2l
then the two limit points of ~, (0, 1.0), together with the two
interior points determined from Dolants tests provide four points
on a curve,
This relationship has been plotted as a solid line in Fig. 8 and
approximated by the dashed-line curve. The equation for this
dashed-line curve is
~ =
logl (~opo :A\ at A + :) loglO 1000
In a frequency-distribution spectrum, such as that shown
in Fig. 4, the SA stress cycles preceed the Sa cycles, because the
percentage of total loadings wherein the higher stress cycles occur
is less than the percentage of total loadings at lesser stress cycles.
If we consider this same order for a l,OOO-cycle load pattern between
SA and Sa and plot it on a 3-cycle log plot, the ratio of the area
under this log-distribution pattern (from loglO 1.0 = 0 to loglO
1000 = 3.0 and from Sa to SA) to the area of the field on which it
is plotted is equal to the distribuiton coefficient, ~, as pre-
viously defined. The SA stress cycles produced a block of area equal
~OOON~ to log NA ! NA
J whereas the S stress cycles produced no area. Thus, a
~ was taken equal to the above mentioned block divided by the area of
the entire field which was 1.0 times luglO 1000 or 3.0.
22
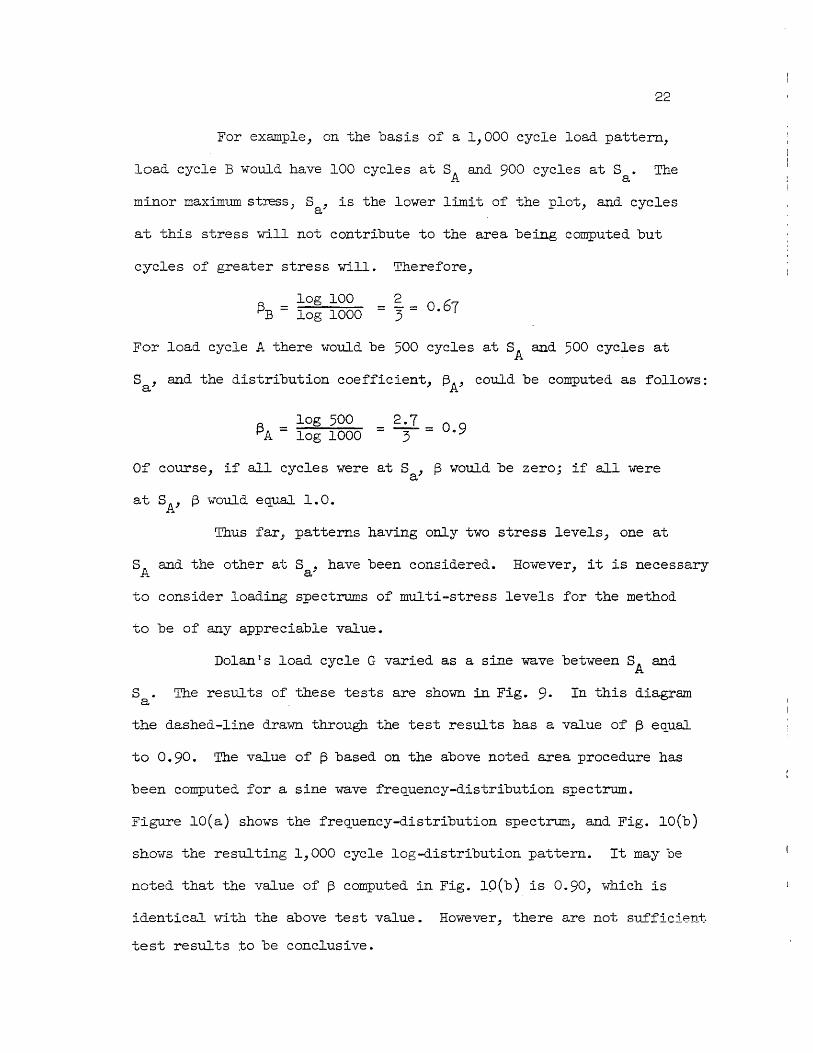
For example, on the basis of a 1,000 cycle load pattern,
load cycle B would have 100 cycles at SA and 900 cycles at Sa. The
minor maximum st~sJ S , is the lower limit of the plot, and cycles a
at this stress will not contribute to the area being computed but
cycles of greater stress will.
log 100 ~B = log 1000
Therefore,
For load cycle A there would be 500 cycles at SA and 500 cycles at
Sa' and the distribution coefficient, ~A' could be computed as follows:
log 500 2 7 f3A = log 1000 = T = 0.9
Of course, if all cycles were at S , ~ would be zero; if all were a
at SA' t3 would equal 1.0.
Thus far, patterns having only two stress levels, one at
SA and the other at Sa' have been considered. However, it is necessary
to consider loading spectrums of multi-stress levels for the method
to be of 8...lly appreciable value.
Dolan1s load cycle G varied as a sine wave between SA and
S. The results of these tests are shown in Fig. 9. In this diagram a
the dashed-line drawn through the test results has a value of f3 equal
to 0.90. The value of t3 based on the above noted area procedure has
been computed for a sine wave frequency-distribution spectrum.
Figure 10(a) shows the frequency-distribution spectrum, and Fig. 10(b)
shows the resulting 1,000 cycle log-distribution pattern. It may be
noted that the value of t3 computed in Fig. 10(b) is 0.90, which is
identical with the above test value. However, there are not su~ficient
test results to be conclusive.

23
Another point which is of interest in this discussion is
that at any given stress level the value of ~ may also be represented
as the ratio of the actual horizontal distance between the variable-
cycle diagram and a vertical line through the S-N diagram (or S-N
diagram extended) at S , to the distance from the basic S-N diagram a
to the same vertical line at the same stress level. Thus, in the
previous diagrams in Figures 6, 7, and 9, which show the results of
tests by Dolan et al, the ratio of Be to AC (or in Fig. 6 for S = a
60,000 psi and load cycle B, the ratio of B'C r to ACt) is the same
as the ratio of ~N to kv. Since ~ can be considered as the ratio
of these horizontal distances, then it might be used with S-N re-
lationships having some curvature. Ther~fore, if the S-N diagram
has curvature, a variable-cycle diagram for tests similar to the
above would have similar but lesser curvature for a constant value
of ~.
If the distribution coefficient, ~, is known, the number
of cycles to failure 'U..T'J.de:r a spectrum-type loading pattern may be
expressed as N where v
log N = log N - ~(log N - log NA) , v a a
and
It should be mentioned again in connection with the pre-
viously discussed variable-cycle tests and the foregoing analysis,
that all of the variable-cycle results were plotted at SA' the
24
major maximum cyclic stress. This would seem to be the logical way
to identify the test results. However, if a variable-cycle test
value plotted at SA were projected vertically downward onto the S-N
curve, it would indicate a constant stress cycle which would have
the same fatigue life and which could be considered as an equivalent
constant stress cycle.
A. M. Freudenthal of Columbia University has conducted
variable cycle rotating beam tests on 24s-T4 and 75S-T6 aluminum
alloys. For purposes of comparison, however, only the 75S-T6 tests
will be discussed here. (20)
Twenty specimens were tested at each of six different
stress levels for a carefUl determination of the S-N diagram.
Also, twenty specimens were tested at identical stress levels for
eaCh of nine different distribution patterns.
The nin~ distribution patterns (A, B, C) (At, BJ, C 1
),
and An, Bft, b~t) are shown in Figs. II and 12. The 3-cycle log
distributions are adjacent to each frequency 4istribution pattern.
In the log-distribution patterns, the ratio of the shaded area to
total block area yields the value of ~ in each case.
Freudenthal in these tests gives, as the average fatigue
life under any loading pattern, the anti-log of the mean log N for
identical tests. It has been demonstrated by Freudenthal, as well
as ~er-Stock, Dolan and Sinclair, and others that this procedure
gives a much truer statistical result than the simple arithmetical
average of the cycles to failure for the various specimens tested
under identical conditions.
25
The results of Freudenthal's tests on 75S-T6 are presented
in Fig. 13. As mentioned previously, all points plotted on this
diagram were obtained as the anti-log of the mean log N for twenty
separate tests. Thus, the 300 tests represented on this figure proY-ide some
o:f· t he most extensive information yet obtained in a cumulative
damage study.
The test results for the nine variable cycle load patterns
have been plotted at SA and the results based on the computed values
of ~ have been plotted above the actual test results and connected
to them by short solid lines for purposes of comparison. The results
are also presented in a tabular form in Table 1. It may be noted
that the average net error was only 1.52 per cent. Those distribu
tions which showed the greatest error are A, C, B t, and Cn, but no
reason for these larger deviations can be determined. If these four
patterns are considered alone, the absolute net error is ll.63 per cent
but the average is only 2.91 per cent.
Thus, it would appear that the previously described method
of estimatL~g the fatigue lives of specimens or parts which are sub
jected to variable load patterns need not be complicated to conform
exactly with any given set of results. The method'appears to yield
val~es that are within the accuracy of the test results themselves.
2. STATISTICAL NATURE OF FATIGUE TEST RESULTS
Obviously, the experimental scatter of fatigue test results
can be minimized by making the specimens as nearly identical as possible,

26
both metallurgically and geometrically, and by carefully controlling
the testing apparatus and procedure, but still the aggregate nature
of the metal as well as the chance distribution of minute inclusions
and other points of weakness will cause significant experimental
variations •
An ordinary S-N diagram shows the relationship between the
maximum cyclic stress for a defined stress cycle and the number of
cycles of this stress which a given type of test specimen will endure
until failure occurs. It implies that there exists a unique relation-
ship between the maximum cyclic stress and the cycles to failure and
that failure has been precisely defined.
If failure in a specimen is defined as the number of cycles
endured until the appearance of a crack, then the number of cycles to
failure depends on how closely and how often the specimen is inspected
wJring the course of the test. Visible cracks have been detected in
fatigue specimens at as little as 10 to 50 per cent of the total
cycles to complete rupture(2l). Therefore, some criterion for failure
must be established. Also, since dispersion in the data is inherent,
some method of choosing a value within this range of dispersion must
be defined before an S -N diagram can be uniquely established for a
given set of data.
A statistical interpretation of the results of a number of
measurements, such as the number of cycles to failure for identical
specimens, requires some assumption concerning the distribution of
fatigue lives for a very large or infinite number of tests. If the
27
nature of the distribution is known, it is then possible to apply
statistical methods to the results of a relatively small number of
tests to ascertain a representative mean result and to arrive at
an estimate of the dispersion or deviation from this mean value.
Several investigators have conducted a large number of
identical tests to determine the nature of the distribution of
fatigue lives(13, 22). The results of 235 tests by MUller-Stock,
Gerold, and SChulz(13) on steel specimens (German St 37) subjected
to reversed bending at approximately 45,500 psi and results ob
tained by Sinclair and Dolan(22) for 57 rotating beam tests on
75S-T aluminum alloy are shown in Fig. 14. Data from MGller-Stock1s
diagram have been replotted to a log-scale. The data given by
Sinclair and Dolan are as reported.
An examination of these results indicates that the dis-
tributions are both skewed to the left with regard to the number of
cycles to failure, N, but apI'ea:c to be approximately normal with
regard to log N. Other investigators have demonstrated results very
similar to these.
If the fatigue life distribution is normal with respect
to the logarithm of the number of cycles to failure, then the best
estimate for the mean fatigue life would be the anti-log of the
mean log N, where the mean log N for m tests is
log N = 1 m log N.
J.
28
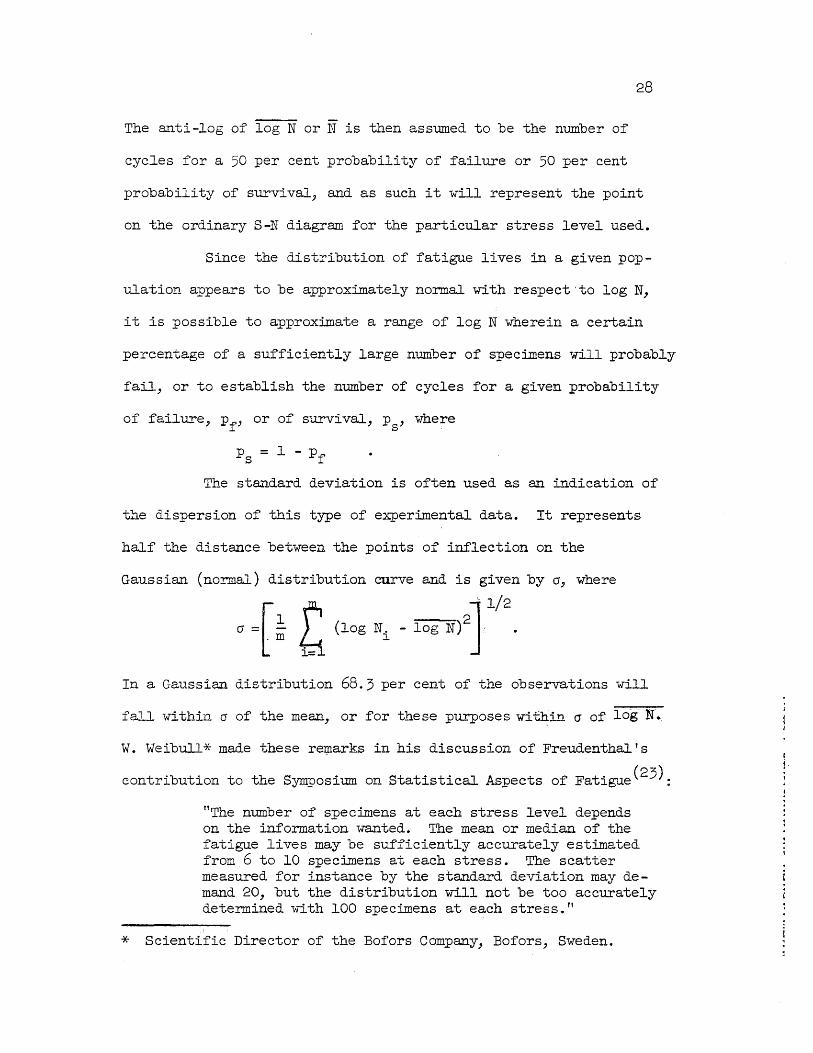
The anti-log of log N or N is then assumed to be the number of
cycles for a 50 per cent probability of failure or 50 per cent
probability of survival, and as such it will represent the point
on the ordinary S-N diagram for the particular stress level used.
Since the distribution of fatigue lives in a given pop-
ulation appears to be approximately normal with respect ,to log N,
it is possible to approximate a range of log N wherein a certain
percentage of a sufficiently large number of specimens will probably
fail, or to establish the number of cycles for a given probability
of failure, Pf , or of survival, P , where s '
p = 1 - P s f
The standard deviation is often used as an indication of
the dispersion of this type of experimental data. It represents
half the distance between the points of inflection on the
Gaussian (normal) distribution curve and is given by (J, where
" 1/2
rJ =[ ~ t (log Ni - log N)2]
In a Gaussian distribution 68.3 per cent of the observations will
fall within (J of the mean, or for the se plLrpose s wi t~in (j of log N.
w. Weibull* made these re~arks in his discussion of Freudenthal's
contribution to the Symposium on Statistical Aspects of Fatigue(23):
f1The number of specimens at each stress level depends on the information wanted. The mean or median of the fatigue lives may be sufficiently accurately estimated from 6 to 10 'specimens at each stress. The scatter measured for instance by the standard deviation may demand 20, but the distribution will not be too accurately determined with 100 specimens at each stress."
* Scientific Director of the Bofors Company, Bofors, Sweden.

29
If the distribution of fatigue test results for a given
population is log-normal, then a representation of the frequency
of failure or survival versus log N will appear as a straight line
when plotted on a log-normal probability paper. Of course, it is
necessary to have a sufficient number of tests of the same popula
tion to accurately determine such a relationshiPJ but a modification
of this type of presentation can be used for comparison purposes for
several small populations of' tests on silnilar specimens.
If a series of ill identical fatigue tests are arranged in
order of increasing fatigue life and are numbered consecutively from
1 to ill, (1 ~ n ~m), the relative frequ~ncy of failure may be taken
as n/(m + 1). The factor (m + 1) is used in the denominator instead
of m so that the m-th test will not show a frequency of failure of
1.0. Naturally, the reliability of such a value decreases with a
smaller number of' tests, such that for three or four test res~llts
in a give~ population it may be entirely misleading if it is in
teryreted alone. Therefore , it must be evaluated with similar data
for othey stress level populations for the same type of' specimen
and stress cycle. There is usual±y less dispersion in the fatigue
lives of specimens tested at high' s~resses th~~ at low stresses.
Hence, a log-normal distribution plot for a high stress level should
have a greater slope than for a lower stress level. It appears that
this method is a valuable tool for a relative analysis of fatigue
data where only a small number of test results can be obtained.

30
III. TEST EQUIPMENT
1. VARIABLE-CYCLE FATIGUE MACHINE
In order to study the fatigue lives of structural members
vlhen sub jected to various patterns of cyclic stresses, a control
unit has been developed for a fatigue machine so that the stress
cycle can be changed automatically according to prearranged patterns.
This W. M. Wilson-type machine has a max:iJnum load capacity
of 50,000 lb. and is a lever-type mechanism. The lever ratio of the
walking beam is 10 to 1, and it operates at approximately 300 cycles
per minute 0 It may be noted from the line drawing of the machine in
Fig. 15 and the schematic diagrams showing the linkage or range con-
trol mechanism in Fig. 16, that the machine has a fixed eccentric
which, in turn, drives an adjustable lirL~age arrangement(24). This
linkage allows the amplitude of the stress cycle to be changed while
the machine is in operation. One end of the linkage bar, as shown
in Fig. 16, is pinned to an adjustable quadrant at M. The quadrant
is moved about a fixed center by gears and a reversible motor.
The movement of the lower end of the linkage bar causes a
variation in the vertical component of movement of the bar, at
point C, and hence a change in the vertical movement of the walking
beam. When the pin at M is in its upper position, as shown in Fig.
16(a), a maximum vertical movement of 1.57 ina per cycle is obtained
at point C. Figure 16(b) shows the pin at M in the lowest position
where this movement is reduced to 0.33 in. per cycle. Thus, the
desired amplitude can be obtained by the proper position;ng of the
quadrant between these limits.
31
The mean or average cyclic load is varied by means of the
gear-nut (turnbuckle) arrangement shown in Fig. 15 and l7(a).
Mechanical power is supplied to this gear-nut through a train of
three spur gears in the gear-nut assembly, and it is driven by a
shaft which is mounted on the walking beam. The shaft runs parallel
to the axis of the beam to a point just above the pullheads, where
power is supplied by another motor through a gear reducer. The
shaft is equipped with two universal joints to take up the angular
displacements of the walking beam and the gear-nut. One of these
joints is at the fulcrum of the beam, and the other is opposite
the pin through which the lever force is applied at the eccentric
end of the beam.
A major problem in the development of the machine had
been in keeping the slack out of the gear-nut assembly. This assem
bly is a turnbuckle arrangement, and the load is transferred through
it by a screw and sleeve. The sleeve is rotated to effect a change
in length of the assembly and hence a change in the mean load on the
specimen. Naturally, some looseness between the screw and sleeve
are inherent 0 But even one or two thousandths of an inch looseness
ca.~ cause irregularities in the loading pattern at the lower loads.
Although the present tests have been cycled from a small tension,
1,000 psi on the net section of the joints or about 1,500 lb., to a
high tenSion, there is a change in sense of the vertical force ap
plied to the beam in this load cycle; the mechanism at the eccentric
end must actually lift the walking beams as the load is decreased to
the minimum in the cycle.

32
To eliminate the impact effect due to looseness in the
gear-nut, two large compression springs were placed under the gear
nut box. These springs maintain an internal force between the
gear-nut sleeve and screw and keep the threads in constant contact
in one direction for all portions of the load cycle. With this
addition, a smooth load-time record has been obtained. Figure l7(a)
shows the gear-nut assembly with these springs in place. Figure
17(b) shows the quadrant or range control mechanism.
When a crack forms in an axially loaded fatigue test
specimen, its overall length changes. This change in length is
utilized in the machine to detect failure. When the specimen begins
to elongate, a micro-switch which is mounted on the fulcrum column
is activated by a bracket rigidly attached to the upper pullhead,
and the machine power is cut off.
Limit switches have also been inst~led on the gear-nut
and quadrant assemblies and are shown in Figures 15 and 17. These
switches restrict the range of movement of the gear-nut screw into
the sleeve and the angular movement of the quadrant such that if
these ranges exceed that required by the program pattern the machine
is stopped.
2. ELECTRICAL CONTROL AND MEASUREMENT SYSTEM
The electrical control and measurement equipment operates
between the output signal of the load-sensing device (weighbar) on
the fatigue machine and the switches which activate the load-adjust
ing motors on the quadrant and gear-nut. The weighbar and load,.
33
adjusting motors are shown in Fig. 15. The control and measurement
e~uipment measures the actual load on the specimen and regulates the
maximum and minimum cyclic loads to a predetermined program. It
also provides a complete permanent record of the testo
The load signal is taken from the weighbar which is equipped
with a four-active-arm Wheatstone bridge made up of eight type AD-3,
SR-4 wire resistance strain gages 0 It will be noted that the weighbar
is mounted in the upper pullhead of the testing machine where it will
most accurately measure the load on the specimen 0
All components of the control system are shown in the block
diagram in Fig. 18. Disofar ·as it was possible, conrrnercial units
which were available in the laboratory were used in this system.
These were then modified as necessity dictatedo
When the machine is being turned over by hand, the electrical
signal from the weighbar, ~3shown as Block A in Fig. 18, can be measured
on a portable SR-4 strain indicator, Blbqk B, or on the dynamic load
measuring and recording equipment, Block Co This signal can also be
compared with readings taken from a calibrated bridge circuit, Block
D, which is electrically identical with the weighbar circuit and is
arranged to give outputs proportional to loads on the specimen of 0,
10, 20, 30, 40, and 50 kips. The calibration circuit can be switched
into the recording equipment circuits to establish a scale on the
dynamic records or into the portable strain indicator to establish
readings for static load determinations.
34
The dynamic load measuring device used in this system,
Block C, is a Sanborn Model 127 direct writing strain recorder.
This unit has been modified to insure long-time stability by the
substitution of a closely regulated power supply and of resistors
which have improved temperature stability.. Also, another paper
speed has been obtained by attaching an auxiliary gear unit to
the drive 0 This provides an extremely slow speed of one inch per
12 minutes (3600 machine cycles). Thus, the recorder provides a
record which is an envelope (maximum and minimum) of the load
time relationship for the specimen. The two standard paper speeds
of 1/10.in. and 1 in. per second, respectively, may be utilized to
inspect the individual cycles of loading. A sample of the record
for the slowest paper speed is shown in Figo 19. For any paper
speed, the e~uipment will record, at all times; the load on the
specimen. If a continuous record is not desired, the Faper can be
stopped but the writing needle on the galvanometer will continue
to oscillate.
The electrical output from the Sanborn unit is used to
operate the load-control e~uipment. This output is fed into two
peak-reading voltmeter circuits, one of which establishes a nearly
constant output proportional to the maximum cyclic load, while the
other performs an identical function for· the minimum cyclic load.
The zero electrical output from the Sanborn e~uipment is located
approximately midway in the smallest load cycle when the e~uipment

35
is set up for a test because it is necessary to provide a measurable
electrical signal for both the minimum and maximum cyclic loads which
are of opposite polarity.
The time constants of the peak-reading voltmeter circuits
have been set so that the decay or drop-off in their output between
machine cycles is less than the system dead-zone. These maximum and
minimum load measuring circuits are shown as Blocks E in Fig. 18.
Their outputs are fed into separate recorders (Leeds and Northrup
Micromax units) to provide another permanent record of the load-time
envelopes. These recorders are shown as BlOCks F.
The outputs of the two peak-load measuring circuits also
feed into separate peak-load indicators and control point selectors,
Blocks G. These units are Wheelco Capacitrol Controllers that have
been modified by the removal of their temperature compensation units
and by increasing their dead-zone to approximately one per cent of
their full scaleo In these units, pointer type galvonometers are
used to indicate the peak cyclic loads. The pointer in each unit
also carries a small metal flag which passes between a pair of coils
and affects their tuning when the control pOint is reached.
This tuning change in each unit is reflected into a circuit
which operates an output relay and provides the following action.
Below the control point, a low switch is closed; above the control
point a high switch closure is made; and at the control point neither
switch is closed. The programming operation is achieved by mechanically
varying the positions of the control point coils along the scale.
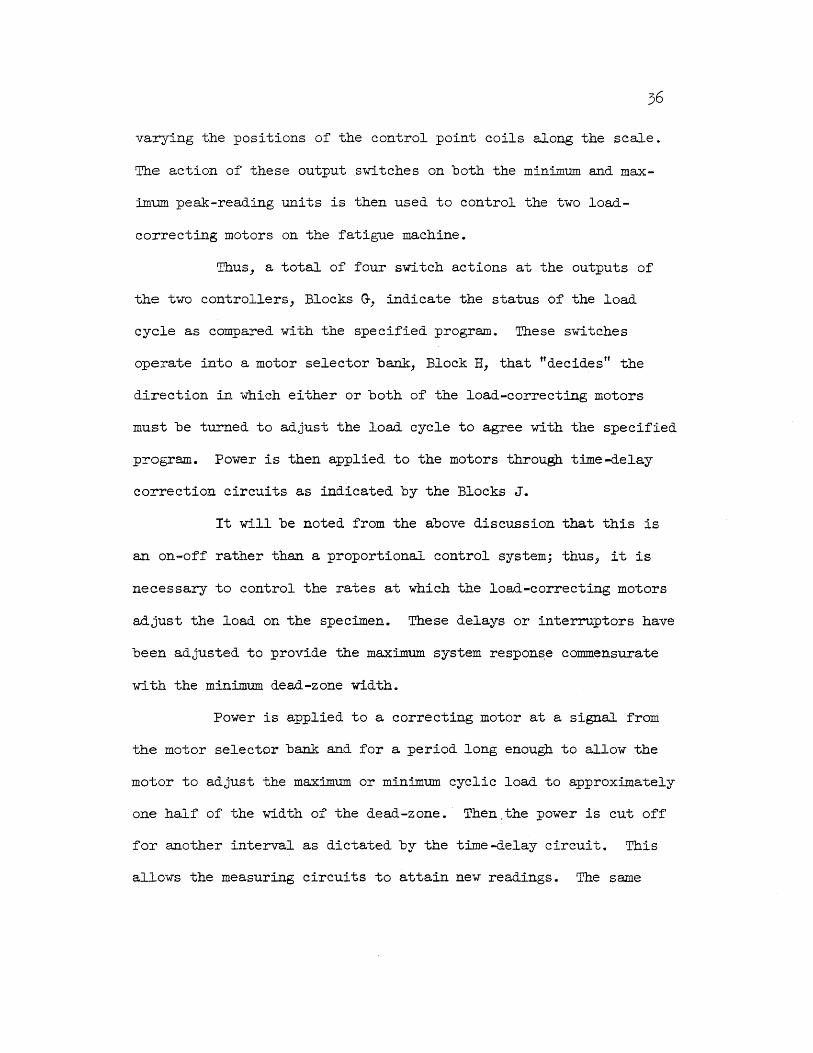
The action of these output ,switches on both the minimum and max
imum peak-reading units is then used to control the two load
correcting motors on the fatigue machine.
Thus, a total of four switch actions at the outputs of
the two controllers, Blocks G, indicate the status of the load
cycle as compared with the specified program. These switches
operate into a motor selector bank, Block H, that "decides" the
direction in which either or both of the load-correcting motors
must be turned to adjust the load cycle to agree with the specified
program. Power is then applied to the motors through time-delay
correction circuits as indicated by the Blocks J.
It will be noted from the above discussion that this is
an on-off rather than a proportional control system; thus, it is
necessary to control the rates at which the load-correcting motors
adjust the load on the specimen. These delays or interruptors have
been adjusted to provide the maximum system response commensurate
with the minimum dead-zone width.
Power is applied to a correcting motor at a signal from
the motor selector bank and for a period long enough to allow the
motor to adjust the maximum or minimum cyclic load to approximately
one half of the width of the dead-zone.' Then,the power is cut off
for another interval as dictated by the time-delay circuit. This
allows the measuring circuits to attain new readings. The same
37
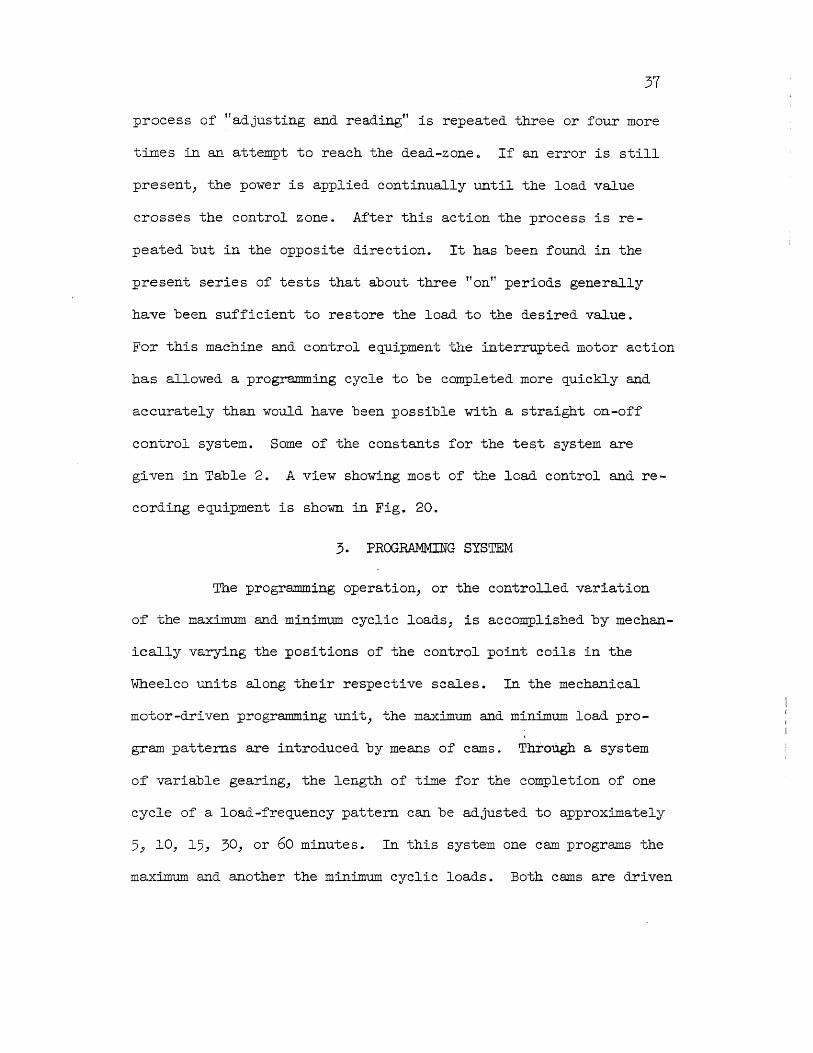
process of fl adjusting and readingf1 is repeated three or four more
times in an attempt to reach the dead-zoneo If an error is still
present, the power is applied continually until the load value
crosses the control zone. After this action the process is re
peated but in the opposite direction. It has been found in the
present series of tests that about three 'Iont! periods generally
have been sufficient to restore the load to the desired value.
FOT this machine and control equipment the interrupted motor action
has allowed a programming cycle to be completed more quickly and
accurately than would have been possible with a straight on-off
control system. Some of the constants for the te~t system are
gi ven in Table 2. A view showing most of the load control and re
cording equipment is shown in Fig. 20.
3. PROGRAMMING SYSTEM
The programming operation, or the controlled variation
of the maximum and minimum cyclic loads, is accomplished by mechan
ically varying the positions of the control point coils in the
Wheelco 1ll1i ts along their re"specti ve scales. In the mechanical
motor-driven programming unit, the maximum and minimum load pro
gram patterns are introduced by means of cams. ThroUgh a system
of variable gearing, the length of time for the completion of one
cycle of a load-frequency pattern can be adjusted to approximately
5~ 10, 15, 30, or 60 minutes. In this system one cam programs the
maximum and another the minimum cyclic loads. Both cams are driven

from the same shaft and one is placed on each face of the programmer.
For the case of a constant minimum cyclic load, as was used in the
present series of tests, only one part of the programmer was required.
One face of this programming unit is shown on the left in
Fig. 21. Both cams in this unit displace followers which travel in
horizontal slides at the same level as the cam drive shaft. Each
slide then displaces a lever which, in turn, displaces another fol
lower in a horizontal slide near the bottom of the unit. The levers
which act between these slides have adjustable fulcrums that allow
adjustments of the ampli tude s of both the maximum and minimum program
variations. Horizontal wires are fastened to the lower slides and
wound over pulleys on the positioning shaft of the control point
coils in the Wheelco units. Thus, the control point coils are dis
placed in proportion to the radii of their respective cams.
39
IV • DESCRJJ?TION OF SPECIMENS .AND RESULTS OF' TESTS
'1. SPECIMENS AND MATERIAL
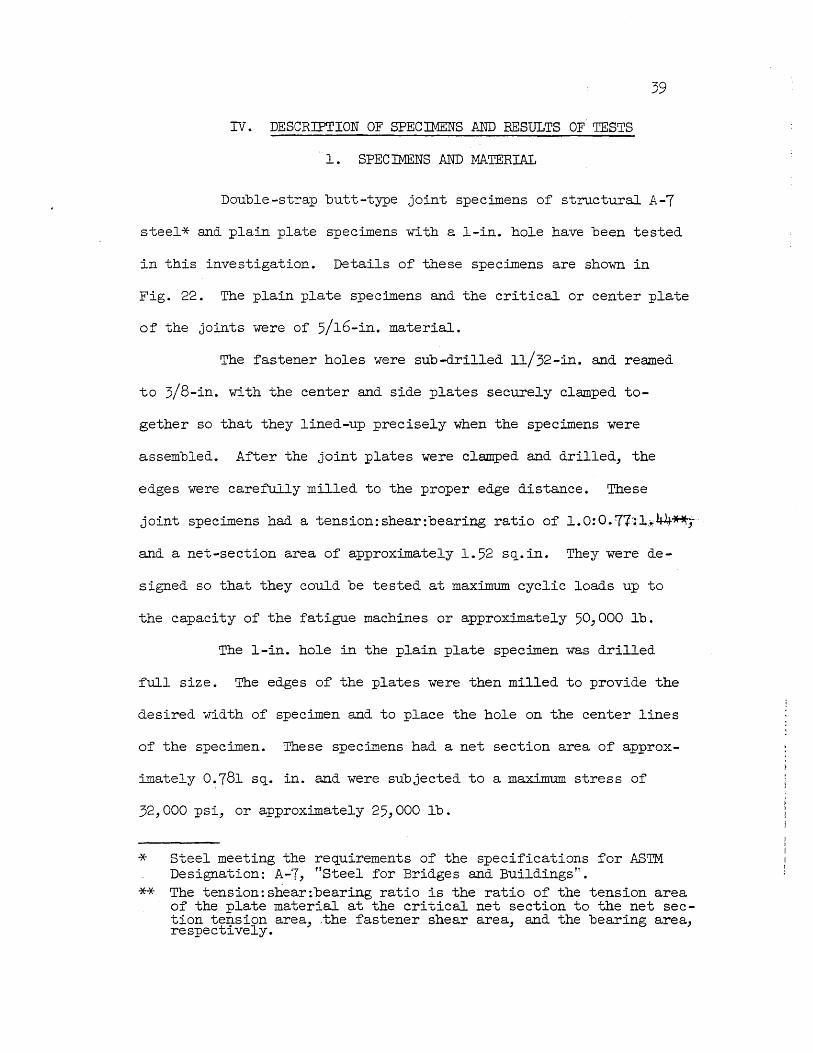
Double-strap butt-type joint specimens of structural A-7
steel* and plain plate specimens with a I-in. hole have been tested
in this investigation. Details of these specimens are shown in
Fig. 22. The plain plate specimens and the critical or center plate
of the joints were of 5/16-in. material.
The fastener holes were sub-drilled 1l/32-in. and reamed
to 3/8-in. with the center and side plates securely clamped to-
gether so that they lined-up precisely when the specimens were
assembled. After the joint plates were clamped and drilled, the
edges were carefully milled to the proper edge distance. These
joint specimens had a tension:shear:bearing ratio of 1.0:0.77'~·1.io:44~
and a net-section area of approximately 1.52 s~.in. They were de-
signed so that they could be tested at maximum cyclic loads up to
the capacity of the fatigue machines or approximately 50,000 lb.
The l-in. hole in the plain plate specimen was drilled
full size. The edges of the plates were then milled to provide the
desired width of specimen and to place the hole on the center lines
of the specimen. These specimens had a net section area of approx-
imately 0~781 s~. in. and were subjected to a maximum stress of
32,000 psi, or approximately 25,000 lb.
* Steel meeting the re~uirements of the specifications for ASTM Designation: A-7, "Steel for Bridges and BUildings".
** The tension:shear:bearing ratio is the ratio of the tension area of the plate material at the critical net section to the net section teI}.sion area, ,the fastener shear area, and the bearing area, respectl.vely.
40
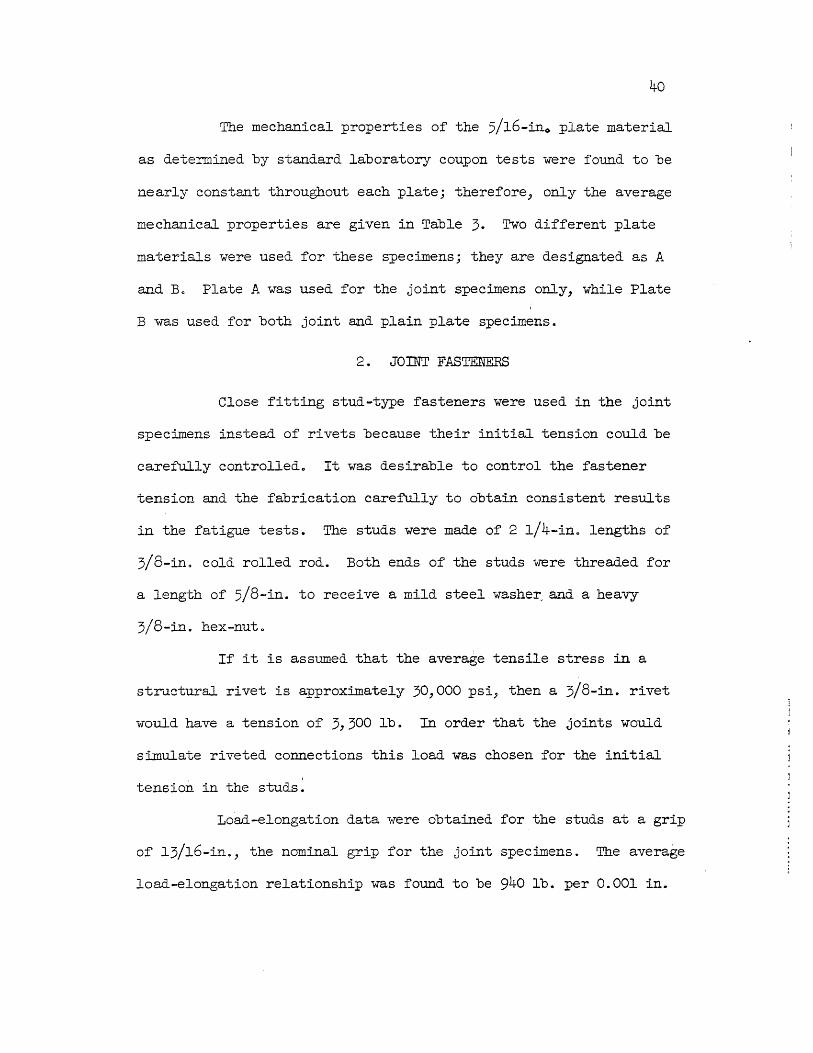
The mechanical properties of the 5/l6-ino plate material
as determined by standard laboratory coupon tests were found to be
nearly constant throughout each plate; therefore) only the average
mechanical properties are given in Table 3. Two different plate
materials were used for these specimens; they are designated as A
and Bo Plate A was used for the joint specimens only, while Plate
B was used for both joint and plain plate specimens.
2. JOINT FASTENERS
Close fitting stud-type fasteners were used in the joint
specimens instead of rivets because their initial tension could be
carefully controlledo It was desirable to control the fastener
tension and the fabrication carefully to obtain consistent results
in the fatigue tests. The studs were made of 2 1/4-ino lengths of
3/8-ino cold rolled rod. Both ends of the studs were threaded for
a length of 5/8-in. to receive a mild steel washe~ and a heavy
3/8-in. hex-nut.
If it is assumed that the average tensile stress in a
structural rivet is approximately 30,000 psi, then a 3/8-in. rivet
would have a tension of 3,300 lb. In order that the joints would
simulate riveted connections this load was chosen for the initial
tension in the studs.
Load-elongation data were obtained for the studs at a grip
of l3/l6-L"lo, the nominal grip for the joint specimens. The average
load-elongation relationship was found to be 940 lb. per 0.001 in.

41
In addition, load-tor~ue data were obtained in a bolt calibrator,
which was developed in the Structural Research Laboratory at the
University of Illinois by J. R. Fuller. These data indicated an
average load-torQue relationship of 13.7 lb. per in. lb.
Since the load-torQue relationship could be determined
eas~y and quickly in the calibrator, all of the fasteners for
each specimen were calibrated. The average tor~ue for a fastener
tension of 3,300 lb. was then determined for the nine studs of
each specimen prior to its final assemblY'.
The tor~ue required to loosen the fasteners in each of
the constant cycle fatigue s~ecimen, after testing, were averaged
for each horizontal row fastener. These torques indicated average
residual tensions in the studs which were 62, 78~ and 75 per cent
of the initial 3,300 lb. tension for the firsty second, and third
rows, respectively.*
3. CONSTANT -CYCLE FATIGUE TESTS
Originally, eight constant-cycle fatigue tests at two
different stTess levels were planned for the joint s~ecimens and
three constant-cycle fatigue tests at one stress level for the
plain plate specimens. However, it was necessary to increase the
number of tests in order to determine the entire S-N diagram with
a reasonable degree of accuracy. Thus, 18 joints and 28 plain plate
* The rt first t1 row of fasteners in a joint is defined as that row of fasteners which is located on the critical section of the joint.
42
specimens were tested using a constant stress cycle of pulsating
tension from a minimum of 1,000 psi average tension on the net
section to a maximum tension. Failure in all of these specimens
occurred at the critical net section. For the joints the critical
net section was at the first row of fasteners in the center plate.
The fatigue cracks began at the outside fastener holes and pro-
gressed transverse to the direction of loading. When a sizable
fatigue crack formed the specimen would elongate sufficiently at
the maximum cyclic load to activate a micro-switch mounted between
the upper pullhead and the fulcrum column, and this action would
stop the testo The constant cycle fatigue test data are given in
Tables 4 and 5.
To determine a relationship for the joint specimens
which would approximate a 50 per cent probability for failure,
the ~~ti-log of the mean log N or log N was computed for stress
levels of 32,000, 28,000 and 24,000 psi. It was found that these
values of log N could be very nearly plotted on a straight line
when the logarithm of the average stress on the critical net section
was taken as one axis. Therefore, the finite life portion of the
S-N diagramJ shown in Fig. 23, was drawn as a straight line on a Inc:\
log-log plato Adopting the same type of e~uation as ~sed by Wilson\~~),
this part of the diagram may be expressed by the relationship,
= 2l,000(4,000,000)k = S ~
163,500 NO.135
where 4,000,000 represents the number of cycles to failure at a

43
maximum cyclic stress of 21,000 psi, and "kl1 is the slope of the
straight line approximation for the joint specimens. The value,
N, represents the number of cycles to failure at a stress, S.
In a similar manner the S-N diagram for the plain plate
sFecimens, shown in Fig. 24, was found to be expressible by the
relationship,
S 207,700 = NO.149
Tests of specimens which were identical to these plain plates
specimens, except that all mill scale was removed by polishing,
were tested at the University of Illinois(26) some time ago. The
resulting S-N diagram for those tests is also shown in Fig. 24.
It is immediately obvious that the behavior of the members' used
in these two studies varied somewhat. The mill scale on the plate
surface seems to produce an increase in the fatigue strength.
The constant-cycle fatigue test data from the joint
sFecimens were also used to ascertain plots indicating the relative
frequency of failure versus the number of cycles to failure for
three of the stress levels used to determine the S-N diagram.. These
plots were determined by the method described previously, wherein
the relative frequency of failure at a given stress was taken as
n/(m + 1) for the n-th test of m ordered test results. The order
is taken according to increasing cycles to failure. These loga-
rithmic-normal probability diagrams are shovffi in Fig. 25.
These diagrams, which are rough approximations at best,
indicate that the dispersions in the fatigue lives were nearly the
44
same at all three stress levels and were of about 1/2 order of
magnitude. The values of N have been plotted at a frequency of
failure of 50 per cent in these diagrams. It may be noted that the
dispersion of the results indicated for a stress of 24,000 psi
appears to be less than that for 32,000 psio This is contrary to
other more extensive studies in that the dispersion at the lower
stress levels is nearly always greater than for higher stress
levels. The scatter-band, which was merely drawn-L~ to include
all of the test data in Fig. 23, also indicates less dispersion
at the lower stress levels than at the higher levels.
The S-N diagram for these constant-cycle tests indicates
an extremely long finite-life range. It has generally been found
in other fatigue investigations on structural joints that the
finite life range ends at about 2,000,000 cycles. For the
present tests, however, the range extends to approximately
4J OOO J OOO cycles, or nearly twice as long. This fact,~turally:
increased the time required for failure at the low finite-life
stresses ~~d made the approximate location of the fatigue limit a
veyY time consuming operation.
The two 50,000 lb. constant-cycle fatigQe machines used
to determine the basic S-N relationships are similar to the
variable-cycle machine shown in Fig. 12 in both size and con
struction. All three of the testing machines operate at approxi
mately 300 cycles per minute or 430,000 cycles in a 24-hour period.
45
About 10 days of continuous machine operation were required to
test a joint specimen to failure at a maximum cyclic stress of
2l,000 psi. Therefore, because of the limited time available,
only a few test results were obtained in the neighborhood of the
fatigue limit.
4. VARIABLE-CYCLE FATIGUE TESTS
Sixteen joint specimens and five plain plate speci-
mens were tested to failure in the variable-cycle study. Due
to mechanical or electrical failures in the testing equipment
some of the specimens had a portion of irregular test patterns
during the test, i.e., not all of the applied cycles followed
the desired sine-wave variation. Consequently, extra speci-
mens were run to compensate for these irregular load patterns.
However, an ~~alysis of these load patterns showed that the
maximum change in number of cycles to failure, if the specimens
had run continuously with the desired pattern, would have been
3·per cent and in the majority of cases it would be considerably
less than 3 per cent. This difference is negligible and the
specimens with irregular patterns are therefore included for the
purposes of this investigation.
All variable-cycle specimens were tested in pulsating
tension wherein the envelope of the maximum cyclic stresses was
a sine wave: For this loading spectrum" the ma.jor maximum) S" , ,H.-
was always twice the magnitude of the minor maximum, S , and the a
minimum cyclic stress was held constant at 1,000 psi as for the
46
constant-cycle tests. '.A,ll tests were begun at the minor maximum stress,
S. The results of these tests are given in Tables 6 and 7. a
In the variable-cycle test,s, the excessive elongation of the
. II ' ,
spec~en accompanying the formation of a fatigue crack was used to mark ,
the end of the test and to stop the testing machine. Failure in all of
the joint specimens occurred in the center plate at the first transverse
row of fasteners except for one specimen which failed in the grip. As
for the constant-cycle tests, the cracks began at the outside holes and
progressed transverse to the direction of loading. The plain plate
specimens also failed at the net section; the crack formed at the hole
and then progressed transverse to the direction of loading.
The computed distribution coefficient, f3 , fora sine wave load c
fre<luency spectrum is 0.90 (see Fig. 10); therefore, the computed fatigue
lives J N , for the variable-cycle tests were determined by the p:r;eviously v
c derived expression,
N v c = N (13-1)
a
,
which is based on the basic S-N diagram. The predicted results for the
variable-cycle fatigue tests are given in Table 8. The table also shows
the ratios of test values to computed values a! the number of cycles to
failure, and the ratio of test to computed values of distribution coef-
ficient f3.
Figure 26 shows the results of the variable-cycle' joint tests as
compared with the constant-cycle S-N diagram, the variable-cycle fatigue
lives predicted by the method described in this investigation, and by
Mineris theory. Figure 27 shows similar data for the plain plate specimens.
47
In computing, by Miner's theory, the fatigue lives for the
variable-cycle specimens, the number of cycles was determined for a
cumulative cycle ratio of 1.0. For purposes of computation, a 1,000
cycle sine "ro,ve loading spectrum from SA to Sa (Sa = SA/2) was divided
into 20 increments of 50 cycles each. The cycle ratio for the average
stress in each increment was then computed for each increment above
the constant-cycle fatigue limit. The sum of the cycle ratios for all
increments in the loading spectrum above the fatigue limit were then
summed to give the cumulative cycle ratio per 1,000 cycleso On this
basis, the number of cycles was ascertained,for a cumulative cycle ratio
of 100, the fatigue life predicted by Miner's theory.
The cumulative cycle ratios for the log-mean fatigue lives,
Nv ' for the variable-cycle tests are given in Table 70 The cqrres
ponding values based on the computed fatigue lives, N , are given in v c
Table 8. From these data it is readily evident that the fatigue life
of the members was not as great as predicted by Miner's theory, but in
most cases was slightly greater than predicted by the ~~alysis of this
report.
It wilJ_ be noted that the plot which shows the fatigue lives
predicted by the log-distribution method in Fig. 26 is not extended into
the region of the fatigue limit of the basic S-N diagram. This is because
the spectrum type fatigue tests of Dolan et al(19) displayed variable-cycle
fatigue limits greater than the fatigue limits for the corresponding con-
stant-cycle tests o Therefore, it is probable that if variable-cycle test
data had been obtained for the lower stress levels in the present investigation,
48
they too would have displayed a fatigue limit of SA greater than
21,0.0.0. psi whi~h was taken as the fatigue limit in the constant
cycle tests. The predicted cycles to failure for these lower levels
would then have been too conservative.
The small number of test results obtained from these
variable-cycle specimens may be considered sufficient to indicate
a general trend, but they are not sufficient to indicate good values
of log-mean fati~~e lives. Certainly, they indicate nothing as to
the dispersion which could be expected if a great deal more data
were available. Past experience has shownJ however, that variable-
cycle fatigue data exhibits more scatter tha.71 does constant-cycle
data. Therefore, the variable-cycle test results for these joint
specimens could be expected to exhibit more scatter than was shown
by the constant-cycle tests in this investigation.
The majority of the specimens tested in this series did
not rtm continuously 0 Mechanical and electronic difficulties were
quite frequentc As these problems arose and were solved, adjust-
ments were made in the equipment and breakdowns became less frequent.
However, many of the specimens were run only during normal working
hours so that the equipment could be watched closely vlhen in opera-
ti'O!:. This gave large rest periods to the specimens. FOT years
rest effects have been considered negligible(27), although recent
investigations have provided data which seem to disagree with this
earlier data.
An analysis of the running time of the joint specimens
of the present tests has been made and the results are shown in
Fig. 28. The percentage of actual running time to the total test
time (r~ing time plus resting time) is compared to the percentage
of test cycles to the predicted cycles. The curve has been sketched
in to show the general trend of the results. The specimens which
are plotted at zero time, (B-4, K-l, K-6) were run over the pre
dicted value and then rested several months before testing to
failure.
50 STATIC TESTS
Two joints, Specimens 8-1 and 8~2, which were identical
to the fatigue test specimens, were tested in static tension to
obtain the general strength characteristics of this type of specimen.
Load-slip data were obtained for both tests and are shown by the
curves plotted in Fig. 29. These curves appear to have the same
general shape as would curves for similar riveted joints.
The plate material for the static specimens and two
coupons were taken from adjacent positions in the parent plate, A.
The yield point and ultimate strength for ~hese two coupons aver
aged 44,700 and 67,100 psi, respectively.
Local yielding was noted in the testing of Specimen S-l
at a load of 70,000 lbe, and general yielding was noted at about
76,000 lb. These loads correspond to an average stress on the net
50
section of 46,000 psi and 50,000 psi, respectively_ At a load of
108,900 lb., the fasteners sheared suddenly_ After the initial
shear failure, new studs were installed, and a tension failure was
obtained at the critical net section at a load of 114,900 lb.
(75,700 psi).
For Specimen 8-2, local yielding of the center plate
was noted at a load of 75,000 lb., and the joint yielded generally
at approximately 80,000 lb. At a load of 108,650 lb., this joint
also failed suddenly in shear. Again the studs were replaced, and
a plate failure occurred through the critical net section at
115,600 lb.
The average ultimate shearing resistance of the studs for
the two specimens was 54,800 psi. This is not greatly different
from the average ultimate shearing resistance generally obtained
for structural steel rivets.
The G/d value (gage divided by hole diameter) for these
joints is 5.33; therefore, they would be expected to have an
efficiency of about 87 per cent according to the relative gage
method of computing the efficiencies of flat plate riveted jOints(28).
The ultimate loads and actual test efficiencies are given in Table 9.
The average test efficiency obtained for the shear failures is about
2 per cent below the predicted efficiency, out the tension failure
efficiency is about 3 per cent greater than the predicted efficiency.
This result is similar to that obtained in other tests, in that when
initial shear failures occur at loads closely approaching the ultimate
strength, there appears to be an increase in the strength of the plate
material on subse~uent refastening and testing.

51
v. SUMMARY OF RESULTS
1. SUMMARY OF PREVIOUS STUDIES
In general, previous fatigue damage studies can be separa
ted into the following categories:
(1) Studies in which the changes that occur in the fatigue
limit due to prestressing at overstresses and understresses were in
vestigatedo
(2) Those wherein the effects of prestressing are studied
in terms of the change in the number of cycles to failure at a dif
ferent stress level.
(3) Investigations designed to study fatigue service life
by subjecting test specimens to load patterns which are repeated a
relatively large number of times before failure occurs.
The findings of studies in the first two categories indi
cate, in general, that cycling at an overstress for a portion of the
fatigue life damages the specimen by causing the fatigue limit after
prestressing to be lower than the fatigue limit displayed by the
basic S-N diagram. However, there are indications that some cycling
at very low overstresses can raise the fatigue limit perceptibly for
some materials.
Understressing just below the basic fatigue limit can raise
subsequently determined fatigue limits for some materials. In some
studies successive increases in the stress level from an initial high
52
understress has led to extremely long lives at final stresses con
siderably above the initial fatigue limit. This tYJ?e of manipulation
is known as coaxing.
Generally, it has been observed that overstressing tends
to reduce the ordinary fatigue life at a subsequently lower over
stress, and that it tends to increase the fatigue life at a sub
sequently higher overstress~
Cumulative damage studies have been directed toward the
expression of fatigue damage as a funqti-on.of the prestress cycle
ratios. Mlner and other investigators assumed the fatigue damage
was equal to the summation of the cycle ratios, but others have
shown that fatigue damage varies in a more complex manner with the
total or .cumulative cycle ratio. Richart and Newmark proposed that
damage might ~ry with a power of the prestress cycle ratio for a
given prestress and test stress. They also emphasized that the
order of application of a small number of blocks of different cyclic
stresses had a very definite effect on the fatigue life, but that
as the number of applications of the pattern of blocks increased
the order became less significant.
2. SUMMARY OF PRESENT STUDY
In the present investigation of cumulative damage in the
fatigue of structural jOints, extensive use has been made of 'test
data from previous fatigue damage studies. In most of these in
vestigations tests were conducted at two or more stress levels on

53
small rotating beam specimens. Rotating beam tests are relatively
easy to conduct, and the cycling rate is usually high; therefore,
many investigators have used this type of test to obtain a large
number of results in a reasonable period of time.
In this report an attempt has been made to derive a use-
ful empirical method for estimating the fatigue lives of structural
joints when tested under a spectrum type loading pattern. The
method proposed in this study has been derived from the extensive
rotating beam test data obtained by other investigators. Data
from two studies, in particular, have proved very useful for the
present investigation. These data were obtained by Kommers(14)
and Dolan, Richart and work(19).
Kommers obtained new S-N relationships after separate
series of identical specimens had been subjected to various cycle
ratios of a single high overstress. Thus, the effects of this
overstress were demonstrated for other .stress levels. In the
present study these data were used to demonstrate the changes that
are likely to occur in S-N relationships which show the total
cycles to failure including the cycles of the initial overstress.
This was accomplished by merely "adding-inU the cycles of the
initial overstress or prestress to show the total cycles to failure.
This "adding-inn of the prestress cycles causes curves
for prestressed specimens to Il rotatef1 in a clockwise direction about
the value of the prestress on the basic S -N diagram. The limiting
54
rotation appears to be a vertical line through the point of rotation
on the basic S-N curve. This vertical line represents the limit as
the prestress cycle ratio approaches unity. Furthermore, a study of
this type of plot indicated that the rotation between the basic S-N
diagram and the vertical line was apprOximately proportional to the
prestress cycle ratio. Other test data are needed, however, to
further evaluate ~~is rotation effect.
Qualitatively, the rotation effect illustrates two of the
important findings of previous fatigue damage studies. It indicates
that an overstress has a damaging effect on the fatigue life at a
subse~uently lower overstress, and that it has a healing effect on
the fatigue life at a subse~uently higher overstress. Quantitatively,
it indicates a range of cycles wherein failures should occur for
variable-cycle tests if the maximum cyclic stresses are all over-
stresses ..
If all of the maximum cyclic stresses for a given loading
pattern are overstresses) then cycling at the major or greatest
maximum stress alone would cause failure at N A cycles as determined
from the basic S-N diagram. By cycling at the least or minor max-
imum cyclic stress alone, failure would occur at N cycles. Thus, a
the interval for any pattern of maximum cyclic stresses can be de-
fined by vertical lines through the major and minor stress levels on
the basic S-N diagram. The present study proposes that the number
of cycles to failure within this interval is a fu.~ction of the pattern
of maximum cyclic stresses.
A review of the variable-cycle test data obtained by
Dolan et al, provided information for an eValuation of ~ in the
relationship,
N = v N~
A N (~-l)
a
In this e~uation N is the fatigue life for a variable-cycle v
55
pattern of loading. The distribution coefficient, ~, relates the
cycles to failure for the variable-cycle loading to the endpoints
of the interval, NA and Na •
It was also observed from some of Dolan's test data,
where the minor maximum cyclic stress was below the initial fatigue
limit, that the life interval could be established by extending
the basic straight-line S-N diagram to the value of the least or
minor maximum cyclic stress. Therefore, to predict the variable-
cycle fatigue life by the present method it is only necessary to
define the interval of possible failure from an accurately deter-
mined S-N relationship and to evaluate the distribution coefficient,
~, for the loading pattern at hand.
The distribution coefficient, ~, as it is presently evalu-
ated, may be computed as a simple ratio of areas. For simplicity
and convenience, a 1,000 cycle envelope of maximum cyclic stresses
is plotted on a semi-log basis from 1 cycle to 1,000 cycles. This
is done by plotting the difference between the major and minor
maximum stresses, SA and Sa' in order of decreasing magnitude from
1 cycle to 1,000 cycles. Then the ratio of the actual area under
this plot to the area of the field on which it is plotted, is ~he
value~. With this information, the variable-cycle fatigue life,
N , may then be computed. v
The method presented herein has been applied to tests
conducted by A. M. Freudenthal. This extensive program of tests
with various loading patterns shows good agreement with the method.
Sixteen variable-cycle pulsating tension fatigue tests
of the joint specimens and five of the plain plate specimens were
conducted for this investigation. For each test the major maximum
cyclic stress, SA' was twice the magnitude of the minor maximum
cyclic stress, S. A sine wave loading pattern was used in all a
cases for the variation in the maximum cyclic stresses. The
minimum cyclic stress was held constant at 1,000 psio For purposes
of comparing the predicted variable-cycle fatigue lives of the
specimens with the lives determined by tests, the representative
(log-mean) fatigue life for all duplicate specimens was considered
as the anti-log of the average of the logarithms of the cycles to
failure for each test. Also, the variable cycle fatigue lives were
computed in accordance with Mlner's theory_
Cumulative cycle ratios were determined from the log-mean
fatigue lives for each of the stress levels and compared with the
values computed by the method presented herein. Of course, the cum-
ulative cycle ratio by M±ner ' s theory is 1.0 in every case.

57
VI. CONCLUSIONS
The results of this study of the data of previous fatigue
damage investigations and of the present variable-cycle tests indi
cate that it is possible to estimate, with reasonable accuracy, the
fatigue lives of structural joints subjected to variable-cycle pat
terns of loading. In order to estimate the variable-cycle fatigue
life of a joint by the method outlined herein it is necessary to
know the basic constant-cycle S-N relationship and the pattern of
maximum cyclic stress variation.
The range of stresses in the variable cycle load pattern
establishes an interval of cycles to failure on the constant-cycle
S-N diagram. The number of cycles to failure within this i~terval
is established by the use of a distribution coefficient which
accounts for the distribution of stresses within the load=pattern.
If it is assumed that the fatigue lives of actual struc
tural joints, which are subjected to more or less random variations
of stresses, can be approximated by the repeated application of
patterns of loading, wherein the cyclic stresses occur with the
same frequency as the service stresses, then it may be possible to
apply this method of fatigue life analysis to actual structures.
Because of the small number of tests conducted for this
series, it is not possible, at the present time, to make an accurate
evaluation of the proposed method for estimating the variable-cycle
fatigue lives of structural joints. However, the test results in
dicate the existence of a relatively good correlation between the
predicted fatigue lives and those obtained by tests.
Another manner of interpreting the data of this variable
cycle study would be the use of an e~uivalent fatigue strength~-the
constant-cycle fatigue stress which provides the same fatigue life
as the variable-cycle loading. The theory presented herein pro
vides a fatigue life at a given major maximum stress (sine wave
pattern and minimum stress of 1, 000 psi) which is equal to the
fatigue life for an e~uivalent constant-cycle stress approximately
2,000 psi below the major maximum stress. On the basis of Miner's
theory, the equivalent constant-cycle stress would be approximately
4)000 to 5,000 psi below the major maximum stress. Thus, the varia
tion in maximum cyclic stress obtained in many bridges may be ex
pected to provide a marked increase in life; an increase in life
equivalent to a decrease of approximately 2-3,000 psi in the max
imum stress in constant cycl~ loading.
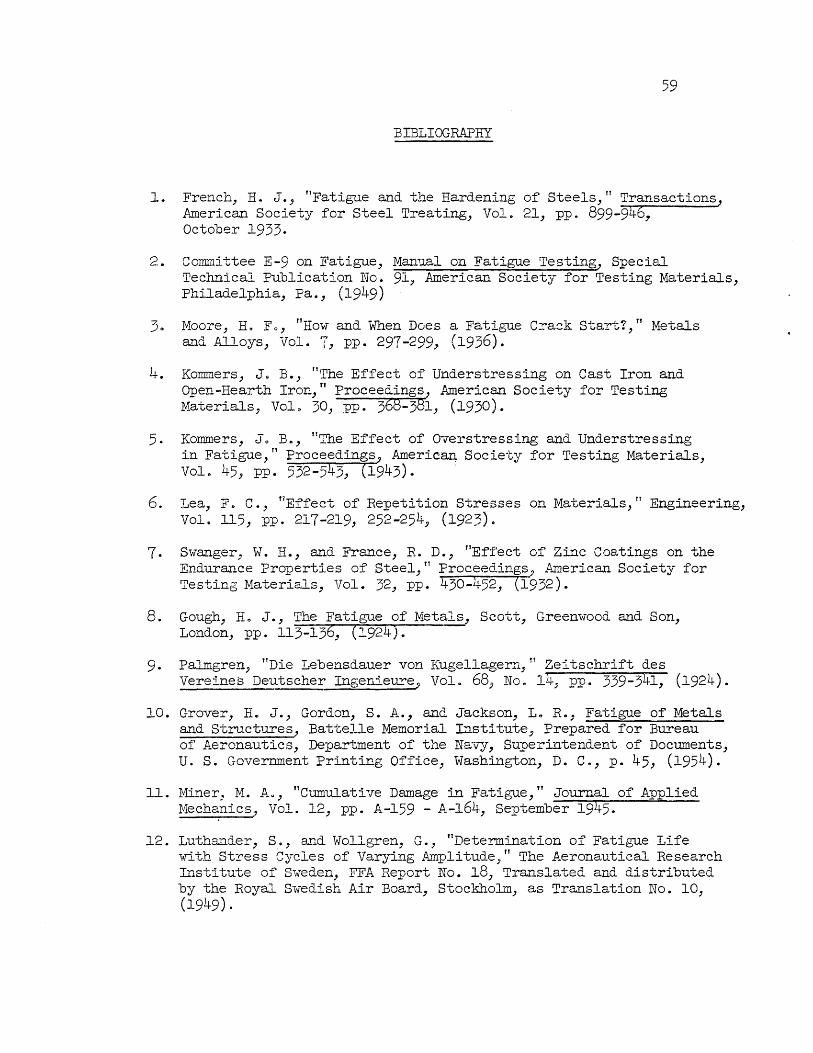
59
BIBLIOORAPHY
l. French, H. J., flFatigue and the Hardening of Steels,tl Transactions, American Society for Steel Treating, Vol. 21, pp. 899-946, October 1933.
2. Committee E-9 on Fatigue, Manual on Fatigue Testing, Special Technical Publication No. 91, American Society for Testing Materials, Philadelphia, Fa., (1949)
30 Moore, Eo Fo, "How and When Does a Fatigue CTa~k Sta~G?,n Metals &~d Alloys, Vole 7, pp. 297-299, (1936).
4. Kommers, Jo B., tiThe Effect of Understressing on Cast Iron and Open-Hearth Iron,tt Proceedings, American Society for Testing Materials, Vol 0 30, pp. 368-381, (1930).
5. Kommers, JoB., tiThe Effect of (Fverstressing and Understressing in Fatigue,T1 Proceedings, American Society for Testing Materials, Vol .. 45, pp. 532-543, (1943).
6. Lea, Fe C., f1Effect of Repetition Stresses on Materials,Tf Engineering, Vol. 115, pp. 217-219, 252-254, (1923)e
7. Swanger, W. H., and France, R. D., "Effect of Zinc Coatings on the Endurance Properties of Steel,tl Proceedings, Am.erican Society for Testing Materials, Vol. 32, pp. 430-452, (1932).
8. Gough, He J., The Fatigue of Metals, Scott, Greenwood and Son, London, pp. 113-136, (~924).
9. Palmgren, TtDie Lebens.dauer von Kugellagern,!! Zeitschrift des Vereines Deutscher Ingenieure, Vol~ 68, No. l4, pp. 339-341, (1924).
lO. Grover, He J., Gordon, S. A., and Jackson, Lo Re, Fatigue of Metals and structures, Battelle Memorial Institute, Prepared for Bureau of Aeronautics, Department of the Navy, Su:perintendent of Documents, U. S. Government Printing Office, Washington, D. Co, p. 45, (1954).
11. Miner., M. A .. , "Cumulative Damage in Fatigue, rt Journal of Applied Mechanics, Vol. 12, pp. A-159 - A-164, September 1945.
12. Luthander, S., and Wallgren, G., rtDetermination of Fatigue Life with Stz-ess Cycles of Varying Amplitude," The Aeronautical Research Institute of Sweden, FFA Report No. 18, Translated and distributed by the Royal S·wedish Air Board, Stockholm" as Translation No. 10, (l949) .

60
13. J>1Uller-Stock, H., Gerold, E ~, and Schulz, E. H., "Der Einfluss einer Wechse1 vorbeanspruchung auf Biegezei t und Biege\'Jechselfestigkei t von Stahl StQ 37, tT Archiv fur das Eisenhuttenwesen, Vol 0 12, pp. 1-148(1939)
14. Kommers, J. B., T'Effect of Overstress in Fatigue on the Endurance Life of Steel,tl Proceedings, American Society for Testing Materials, Vol. 45, pp. 532-541, (1945).
15. Richart, F. E., Jr. J a.1J.d :Newmark, N. M., tlA..1J. Hypothesis for the 'Determination of Cumulative Damage in Fatigue, fT Proceedings, American Society for Testing Materials, Vol. 48, pp. 767-800~, (1948).
16. Bennett, J. A., "A Study of the Damaging Effect of Fatigue Stressing of X4130 Steel," Proceedings, American SOCiety for Testing Materials, Volu 46, pp. 693-711, (1946).
17. Advance Report of COImnittee 30 - Impact and Bridge Stresses, nTests of Steel Girder Spans on the Chicago and North Western Railway, 11
Bulletin ~.88, American Railway Engineering AssOCiation, pp. 1-92, (1950) •
18. Advance Report of COImnittee 30 - Impact and Bridge Stresses, "Tests of Steel Girder Spans on the Illinois Central Railroad," Bulletin 496, American Railway Engineering Association, pp. 147-284, (1951).
19. Dolan, T. Jo, Richart, F. E., Jr., and Work, C. Eo, "The Influence of Fluctuations in Stress Amplitude on the Fatigue of Metals,f1 Proceedings, American Society for Testing Materials, Vol. 49, pp. 646-679, (1949).
20. Freudenthal, A. M., tTCumulative Fatigue Damage of Aircraft Structural Materials, Part I, 2024 and 7075 Aluminum Alloy, n Wright Air Development Center Tech. Note 55-273, (Columbia University under Contract No. AF 33(616)-2274)0
21. Head, A. K., liThe Growth of Fatigue Cracks, II published by permission of the Commonwealth of Australia, Department of Supply, May 20, 1953. Also see, Philosophical Magazine, Vol. 44, No. 356,pp. 925-938, September, 1953.
22. Sinclair, G. M., and Dolan, T. Jo, ItEffect of Stress Amplitude on the Statistical Variability in the Fatigue Life of 75S-T6 Aluminum Alloy, II Transactions, American Society of Mechanical Engineers, Vol. 75, No.5, pp. 867-872, July 1953&
23. Committee E-9 on Fatigue, HSymposium on Statistical Aspects of Fatigue,Tl Special Technical PUblication'No. 121, P.rnerican Society for Testing Materials, Philadelphia, Pa., 64 pp., (1941).
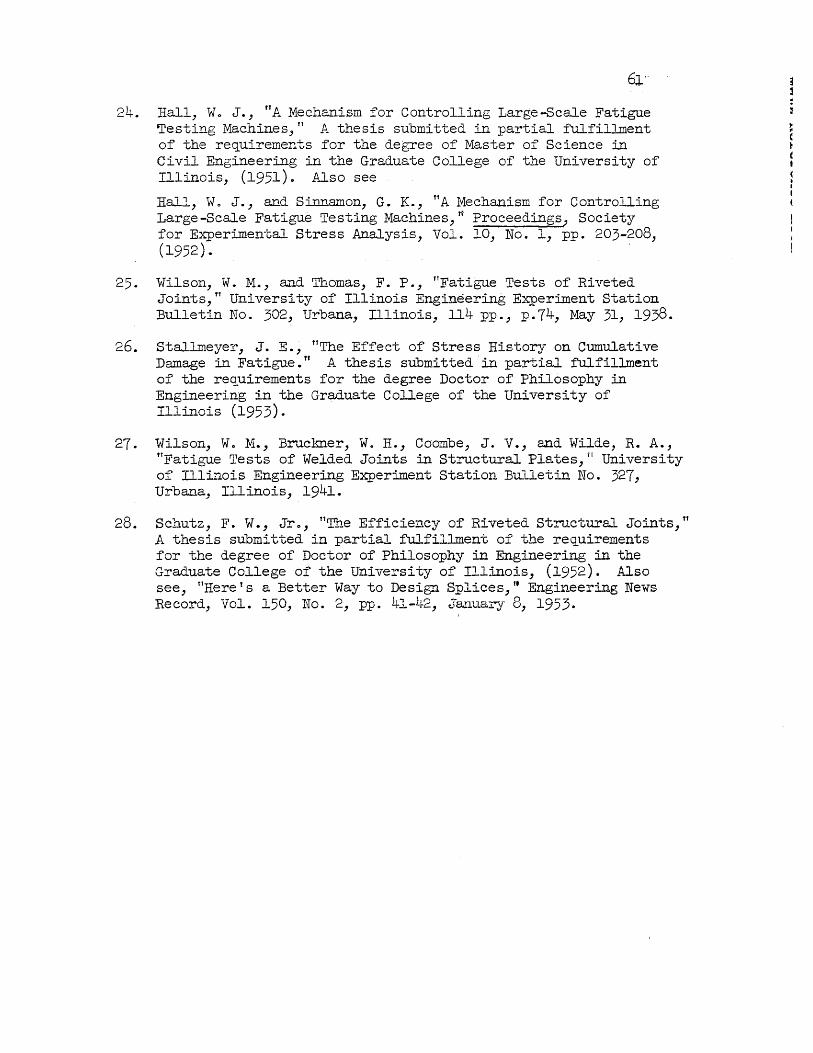
24. Rall, Wo J., ffA Mechanism for Controlling Large-8cale Fatigue Testing Machines, II A thesis submitted in partial fulfillment of the re~uirements for the degree of Master of Science in Civil Engineering in the Graduate College of the University of Illinois, (1951)., Also see
Rall., Wo J., and Sinnamon, G. K., f1A Mechanism for Controlling Large-Scale Fatigue Testing Machines,n Proceedings, Society for Experimental Stress Analysis, Vol. lO, No.1, pp. 203-208, (1952). '
25. Wilson, W. M., and Thomas, F. P., nFatigue Tests of Riveted JOints,n University of lllinois Engineering Experiment Station Eulletin No. 302, Urbana, Illinois, 114 pp., po74, May 31, 1938.
26. Stallmeyer, J. E., "The Effect of Stress Ristor:y- on Cumulative Damage in Fatigue. ff A thesis submitted in partial fulfillment of the re~uirements for the degree Doctor of Philosophy in Engineering in the Graduate College of the University of Illinois (1953).
27. Wilson, W., M., Bruckner, W. H., Coombe, J. V., and Wilde, R. A., ffFatigue Tests of Welded Joints in Structural Plates, fi University of Illinois Engineering Experiment Station BQlletin No. 327, Urbana, Illinois, 1941.
28. Schutz, F. W., Jro, ttThe Efficiency of Riveted structural Joints, ff A thesis submitted in partial fulfillment of the requirements for the degree of Doctor of Philosophy in Engineering in the Graduate College of the University of illinois, (1952). Also see, t1Here' s a Better Way to Design. Splices, t1 Engineering News Record, Vol. 150, No.2, pp. 4l-42, J~~uary 8, 1953.

Distribution Pattern
A
B
C
AI
B'
C'
A"
BIl
cll
TABLE 1
COMPARISON OF FREUDENTHALtS TEST RESULTS ON
75S-T6 ALUMTIWM ALLOY WITH COMPUTED RESULTS
Value of f3 Difference Test Computed f3T - f3C
0.723 0.673 +0.050
0.766 0.,755 +0.01l
0.582 0.660 -0.078
0.531 0.554 -0.023
0.642 0.580 +0.062
0.508 0.509 -0.001
0.794 00776 +0.018
0.812 0.822 -0.010
0.677 00777 -0.100
Total Net Error, percent
Average Net Error, percent
62
Percent Error
+6.91
+1.44
-13.40
-4.33
+9.65
-0.20
+2.27
-1.23
-14.79
-13.68
-1.52
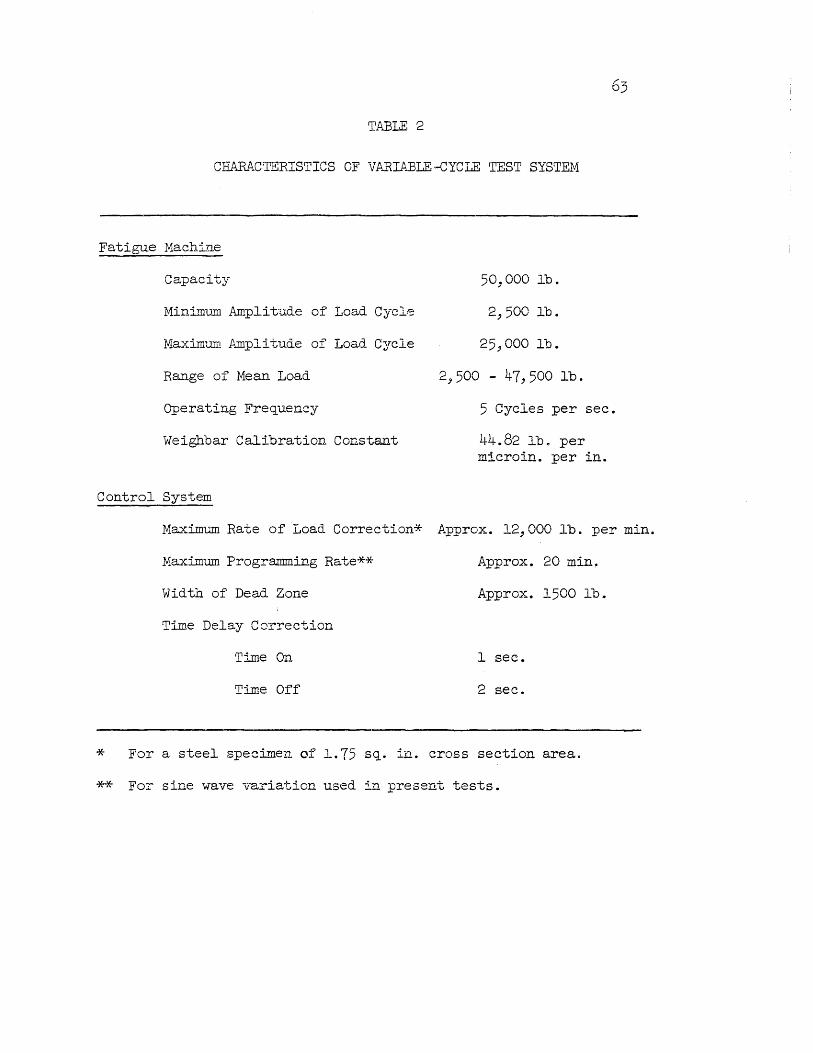
TABLE 2
CHARACTERISTICS OF VARIABLE -CYCLE TEST SYSTEM
Fatigue Mach:Lne
Capacity
Minimu.m Amplitude of Load Cyclr=
Maximum Amplitude of Load Cycle
Range of Mean Load
Operating Frequency
Weighbar Calibration Constant
Control System
50, 000 lb.
2,500 lb.
25;1 000 lb.
2,500 - 47,500 lb.
5 Cycles per sec.
44.82 Ib 0 per microin. per in.
Maximum Rate of Load Correction* Approx. 12,000 lb. per min.
Maximum Programming Rate** Approx. 20 min.
Width of Dead Zone Approx. 1500 lb.
Time Delay Correction
Time On 1 sec.
Time Off 2 sec.
* For a steel specimen of 1.75 sq. ill. cross section area.
** FaT sine wave variation used in present tests.
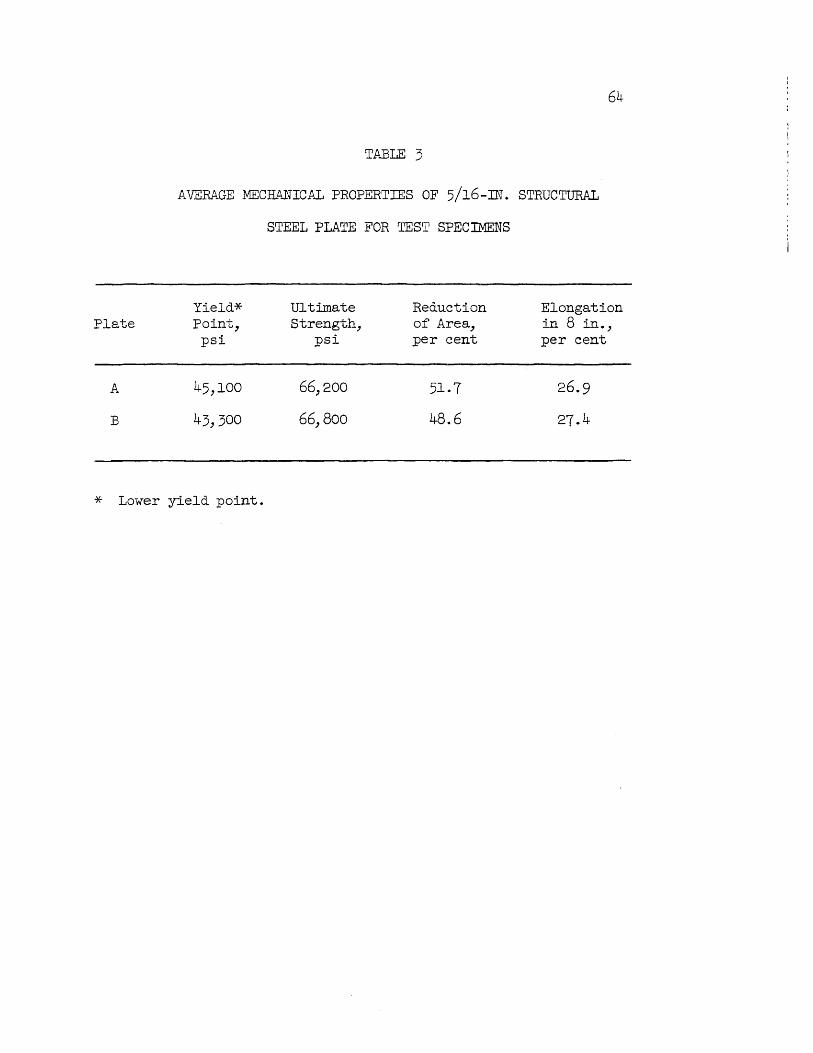
64
TABLE 3
AVERAGE MECHANICAL PROPERTIES OF 5/l6-IN. STRUCTURAL
STEEL PLATE FOR TEST SPECIMENS
Yield* Ultimate Reduction Elongation Plate Point, Strength, of Area, in 8 in.,
psi psi per cent per cent
A 45,100 66,200 51.7 26.9
B 43,300 66,800 48.6 27.4
* Lower yield point.
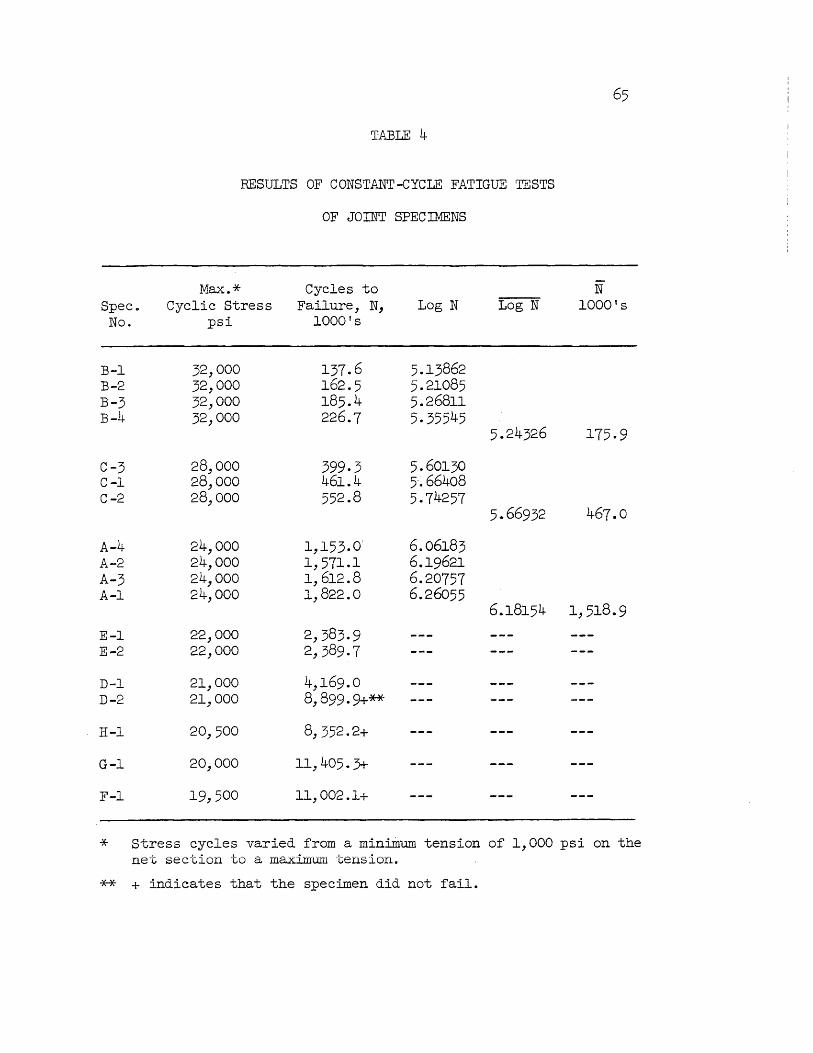
TABLE 4
RESULTS OF CONSTANT-CYCLE FATIGUE TESTS
OF JOINT SPECIMENS
Max. * Cycles to N Spec 0 Cyclic Stress Failure, N, Log N Log N 1000 ' s
No. psi 1000's
B-1 32,000 137.6 5.13862 B-2 32,000 162.5 5.21085 B-3 32,000 185.4 5.26811 B-4 32,000 226.7 5.35545
5.24326 175·9
C-3 28,000 399.3 5.60130 C-l 28,000 461.4 5'.66408 C-2 28,000 552.8 5.74257
5.66932 467.0
A-4 24,000 1,153.0' 6.06183 A-2 24,000 1,571.1 6.19621 A-3 24.000 1.612.8 6.20757 A-I 24:000 1:822.0 6.26055
6.18154 1,518.9
E-l 22,000 2,383.9 E-2 22,000 2,389.7
D-l 21,000 4,169. 0 D-2 21,000 8,899.9+**
H-l 20,500 8,352 . 2+
G-l 20,000 11,405.3+
F-l 19,500 11,002.1+
* Stress cycles varied from a minimum tension of 1,000 psi on the net section to a maximum tension.
** + indicates that the specimen did not fail.
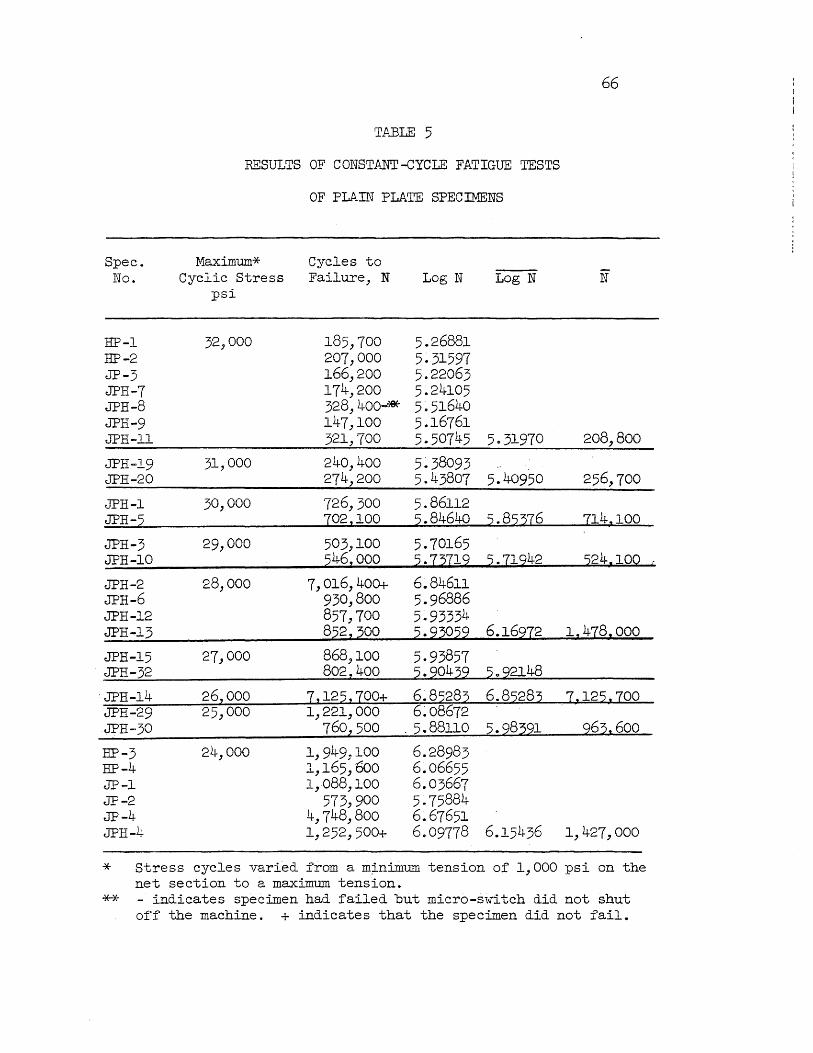
66
TP.BLE 5
RESULTS OF CONST.ANT-CYCLE FATIGUE TESTS
OF PLAIN PLATE SPECIMENS
Spec. Maximum* Cycles to No. Cyclic Stress Failure, N Log N Log N N
psi
liP-I 32,000 185,700 5.26881 liP-2 207,000 5.31597 JP-3 166,200 5.22063 JPH-7 174,200 5.24105 JPH-8 328,400-* 5~51640 JPH-9 147,100 5.16761 JPH-l1 321,700 5.50745 5.31970 208,800
JPH-19 31,000 240,400 5.38093 JPH-20 274,200 5 -43807 5.40950 256,700
JPH-l 30,000 726,300 '5.86112 JPH-~ 102 z1OO ~.84640 2. 82216 114,100
JPH-3 29,000 503,100 5.70165 JPH-10 :246z000 ~ .1211 2 2-11242 ~24.10Q r
JPH-2 28,000 7,016,400+ 6.84611 JPH-6 930,800 5.96886 JPH-12 857,700 5.93334 JPH-13 822z2°O :2- 22Q22 6.16212 1:4181 000
JPH-15 27,000 868,100 5.93857 . JPH-32 802%400 2-20422 ~o22l48
'JPH-14 26 2000 12 1222100+ 6_ 8228;2 6.8228:2 7, 122s100 JPH-29 25,000 1,221,000 6~08672 JPH-30 760z500 _ 5.88110 2-28221 262,600
HP-3 24,000 1,949,100 6.28983 HP-4 1,165,600 6.06655 JP-1 1,088,100 6.03667 JP-2 573,900 5.75884 JP-4 4,748,800 6~67651 JPH-4 1,252,500+ 6.09778 6.15436 1, 427,000
* Stress cycles varied from a m~nimum tension of 1,000 psi on the net section to a maximum tension.
** - indicates specimen had failed but micro-switch did not shut off the machine. + indicates that the specimen did not fail.

TABLE 6
REsmTS OF VARIABLE ··CYCLE _ FATIGUE 1~STS OF JOINT SPECIMENS
SA*' S * a ' Test, Test,
Spec. Major Maximwn Minor Maximwn Test Cycles Distribution Cwnulative No. Cyclic Stress, Cyclic Stress, To Fa.ilure, Log N Log N N Coefficient, ~ * Cycle Ratio
psi psi N v v v T
Il,r
K-4 24,000 12,000 5,919,000** 6.77225 L-3 24,000 12,000 1,925:,400 6.28443 L-6 24,000 12,000 3, 91 ~~I, 000** 6.59251
6.54973 3,546,000 0.8309 0.614
K-5 28,000 14,000 746,400 5.87297 L-2 28,000 14,000 516,400 5.71299 L-4 28,000 14,000 1,150,300 6.06070
5.88222 762,500 0.9078 0.465
B-3*** 30,000 15,000 55~;;, 200 E-2 30,000 15,000 7 5 ~~i , 600** 5.87829 E~3 30,000 15,000 567,'100** 5.75412 G-3 30,000 15,000 83~-, 300** 5.92132
5.85124 710,000 0.8222 0.733
B-4 32,000 16,000 73~), 000** 5.86510 E-l 32,000 16,000 30~:~, 700 5.48101 K-l 32,000 16,000 799,100** 5.90260 K-3 32,000 16,000 49';;' 900 ,), 5.69364 K-6 32,000 16,000 61 1
:, 300** 5.78909 .- , X-2 32,,000 16,000 279,600 5.44654
5.69633 497,000 0.7986 0.840
* Maximum cyclic stresses varied as a sine wave between s8nand S. Pattern was repeated every 9,000 cycles. Tests were begun at S ~ The minimum cyclic stress was held c stantaat 1,000 psi.
** Portions of tes~' pattern irregular. Maximmn change in number of cycles 3%. *** Failed in upper pull head.
0\ --J
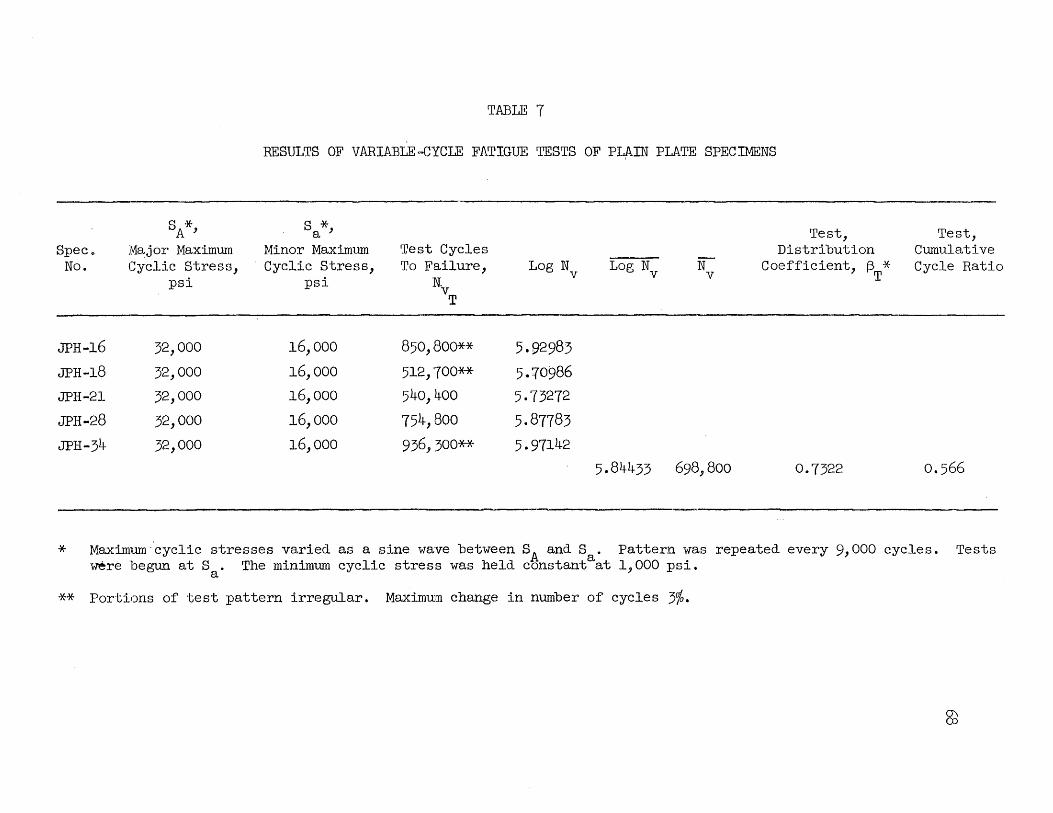
TABLE 7
I
RESULTS OF VARIABLE ...cYCLE FATIGUE TESTS OF PLAIN PLATE SPEC !MENS
SA*' S *, a Test, Test, Speco Najor Maximum Minor Maximum Test Cycles Distribution Cumulative
No. Cyclic Stress, Cyclic Stress, To Failure, Log N Log N N Coefficient, ~ * Cycle Ratio psi psi
TiI"T v v v T
JPH-16 32,000 16,000 850,BOO** 5.92983
JPH-18 32,000 16,000 512,700** 5.10986 JPH-21 32,000 16,000 540,400 5. 73272
JPH-28 32,000 16,000 754, Boo 5.87783
JPH-34 32,000 16,000 936,300** 5.97142 5.84433 698,800 0.7322 0.566
* Maximum-cyclic stresses varied as a sine wave between SA and S. Pattern was repeated every 9,000 cycles. Tests were begun at S. The minimum cyclic stress was held constantaat 1,000 psi.
a
** Portions of test pattern irregular. Maximum change in number of cycles 3%.
@
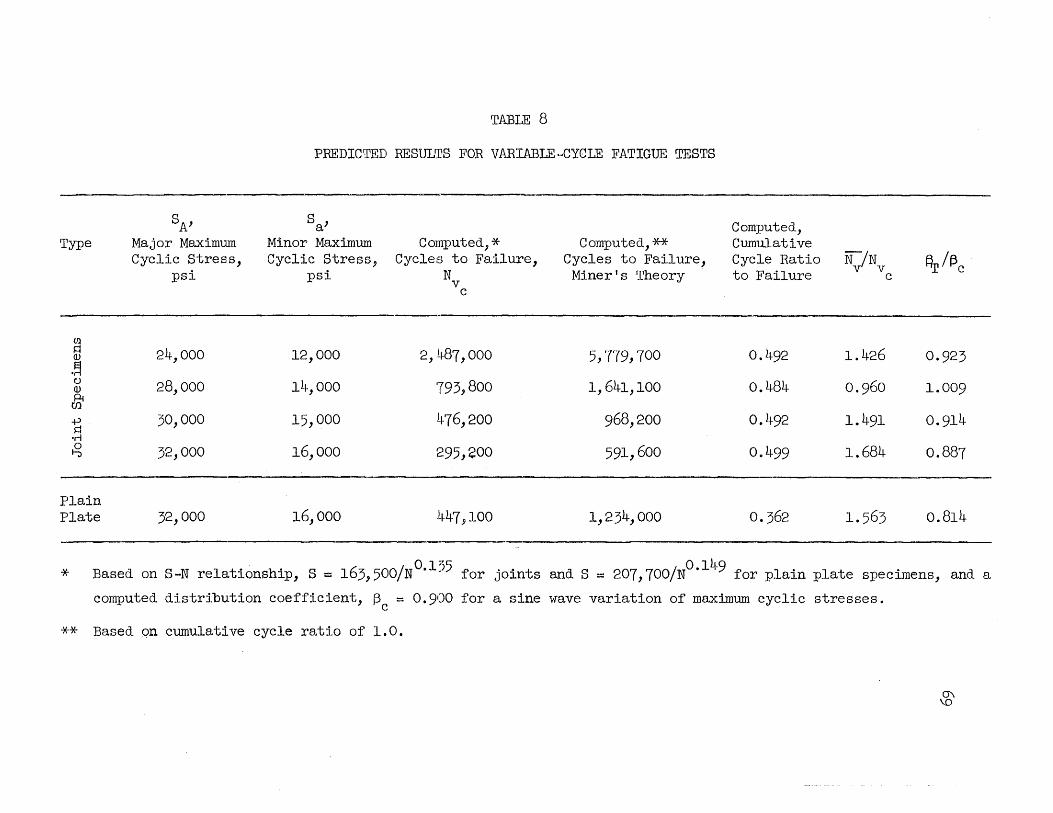
Type
Ul ~ OJ
.~ t.l OJ
~ ~ 'r-!
~
Plain Plate
SA' Major Maximum Cyclic stress,
psi
24,000
28,000
30,000
32,000
32,000
TABLE 8
PREDICTED RESUUrS FOR VARIABLE~CYCLE FATIGUE TESTS
S , a
Minor Maximum Cyclic Stress,
psi
12,000
14,000
15,000
16,000
16,000
Computed, * Cyclers to Failure,
N v
c
2, .l~87, 000
793,800
.l~76, 200
:~~95, 200
1~47, 100
Computed,** Cycles to Failure, Miner's Theory
5,779,700
1,641,100
968,200
591,600
1,234,000
Computed, Cumulative Cycle Ratio to Failure
0.492
0.484
0.492
00499
0.362
W/N v v c
1.426
0.960
1.491
1.684
1.563
~/f3c
0.923
1.009
0.914
0.887
0.814
* Based on S-N rela.tionship, S = 163, 500/NO.l,~)5 for joints and S = 207,700/NO.149 for plain plate specimens, and a
computed distribution coefficient, f3c: = 0.900 for a sine wave variation of maximum cyclic stresses.
** Based qn cumulative cycle ratio of 1.0.
0\ \0
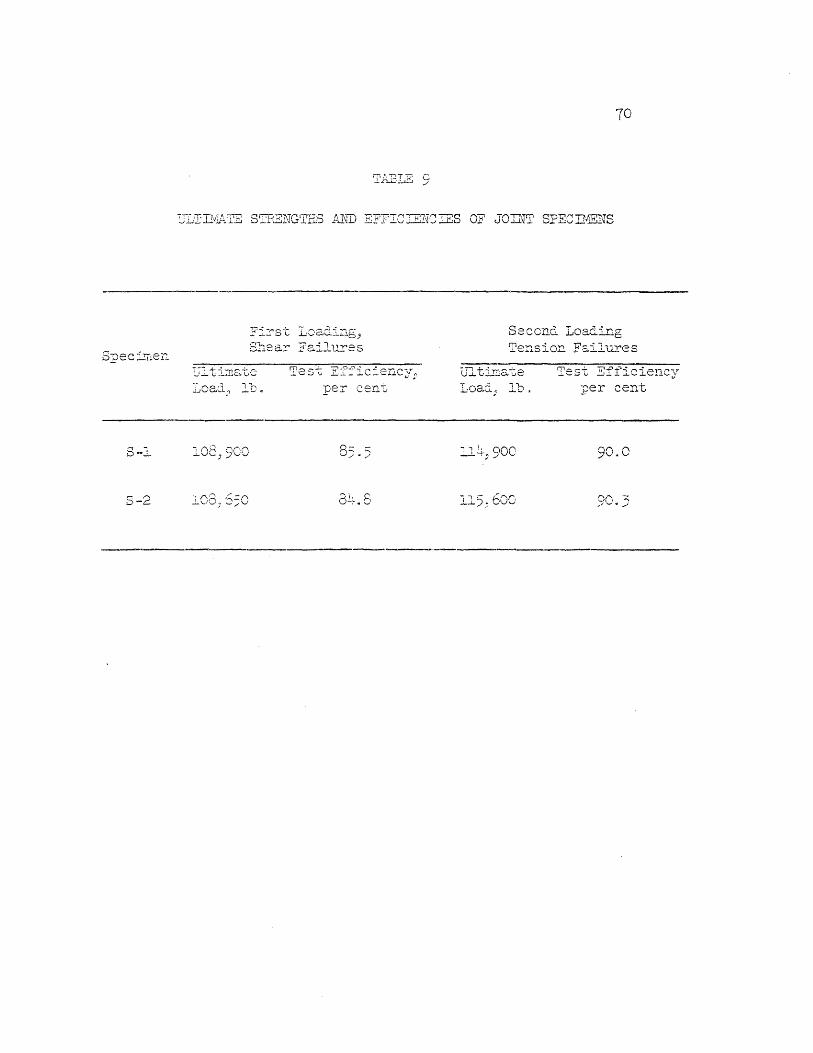
S··l 108)900
5-2
-------.------------~------
Fi2.~s~t L<)adi:1g~:~
Sbeay ffailllres
Test Efficiency; per cent
8l;-.3
70
Seccnd. LoaCLirlg Te~sion F&illlreS
"ijl tillat,e Load.;
'l h ooe' --- '~ ./
115.~ 60G
Test Efficiency :per cent
9000
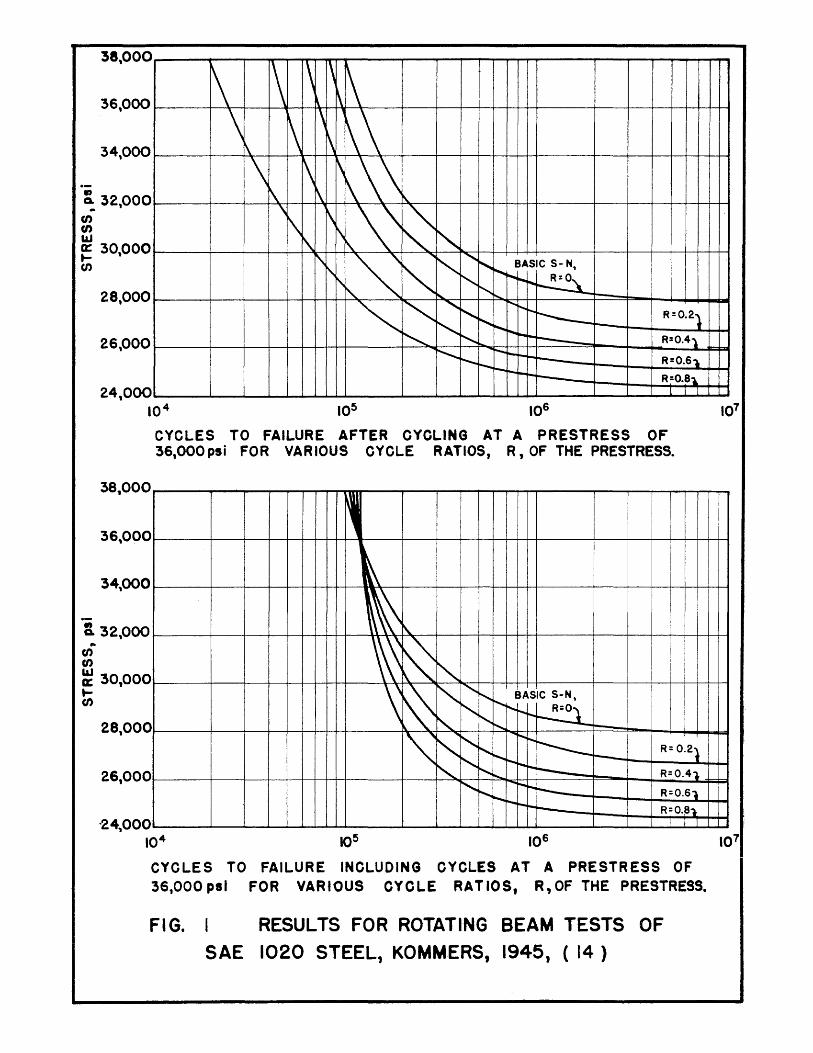
38,000
36,000
34,000
., 0:, 32,000 U) U) &U e: 30,000 (J)
28,000
26,000
24,000 10 4
\ \
\ \ \ ~
\ \ ~ \
\ ~ i\ \
" i\ \ i\ \~
\~ \\ \,\ \~ \ ,\\ ~ " ,~~
"'" ~ " BASIC S- N,
~ i"-
" ........ ~""'"~~~ ~ " ~ '" " "-
1"0 .... r--i-----_ R=O.2 •
"'-....... r....
"- ......... ~ .... ~~ R:O.4) ....
............. I""'--r---~I----.......... R=O.6'lr
---r---1--~---- R=O.81.
l
CYCLES TO FAILURE AFTER CYCLING AT A PRESTRESS OF 36,000 psi FOR VARIOUS CYCLE RATIOS, R, OF THE PRESTRESS.
38,000
~ 36,000
34,000 ~
B. 32,000 ~\ ~ ~
.. (J) U) &U a: 30,000
'\ " ~ " "-~ (J)
28,000
26,000
'24,000 104
" .......
" " "
" "'-""-.......
"- .......
"- ........
BASIC S-N,
:~""~ .... r--r--. r-.... --------r--- R= O.2l
r-. ~~ 100.. R=O.41
--!"'-o~
~ --- R=O.61 r--.- .... to--- R=O.8'l
I I I
CYCLES TO FAILURE INCLUDING CYCLES AT A PRESTRESS OF 36,000 psi FOR VARIOUS CYCLE RATIOS, R, OF THE PRESTRESS.
FIG. 1 RESULTS FOR ROTATING BEAM TESTS OF
SAE 1020 STEEL, KOMMERS, 1945, ( 14 )
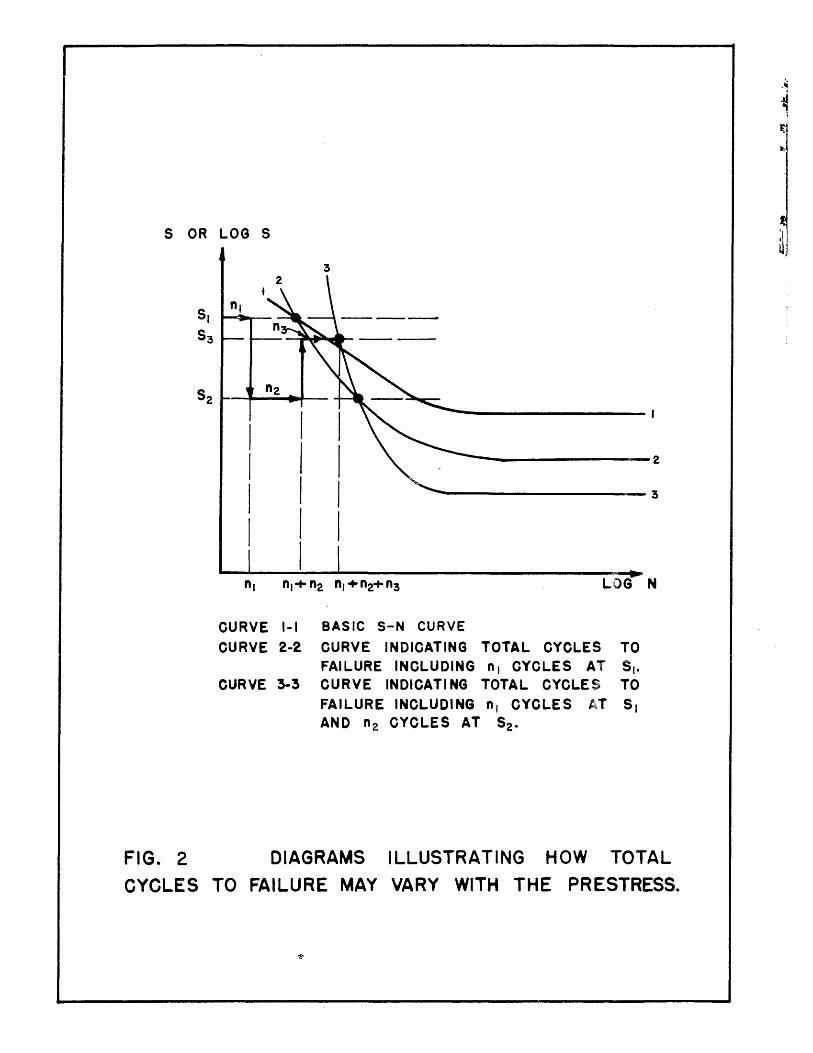
S OR LOG S
3
----------------2 ~-----------------3
LOG N
CURVE I-I BASIC S-N CURVE
CURVE 2-2 CURVE INDICATING TOTAL CYCLES TO FAILURE INCLUDING nl CYCLES AT SI_
CURVE 3-3 CURVE INDICATING TOTAL CYCLES TO
FAILURE INCLUDING n, CYCLES AT SI AND n2 CYCLES AT S2-
FIG. 2 DIAGRAMS ILLUSTRATING HOW TOTAL
CYCLES TO FAILURE MAY VARY WITH THE PRESTRESS.
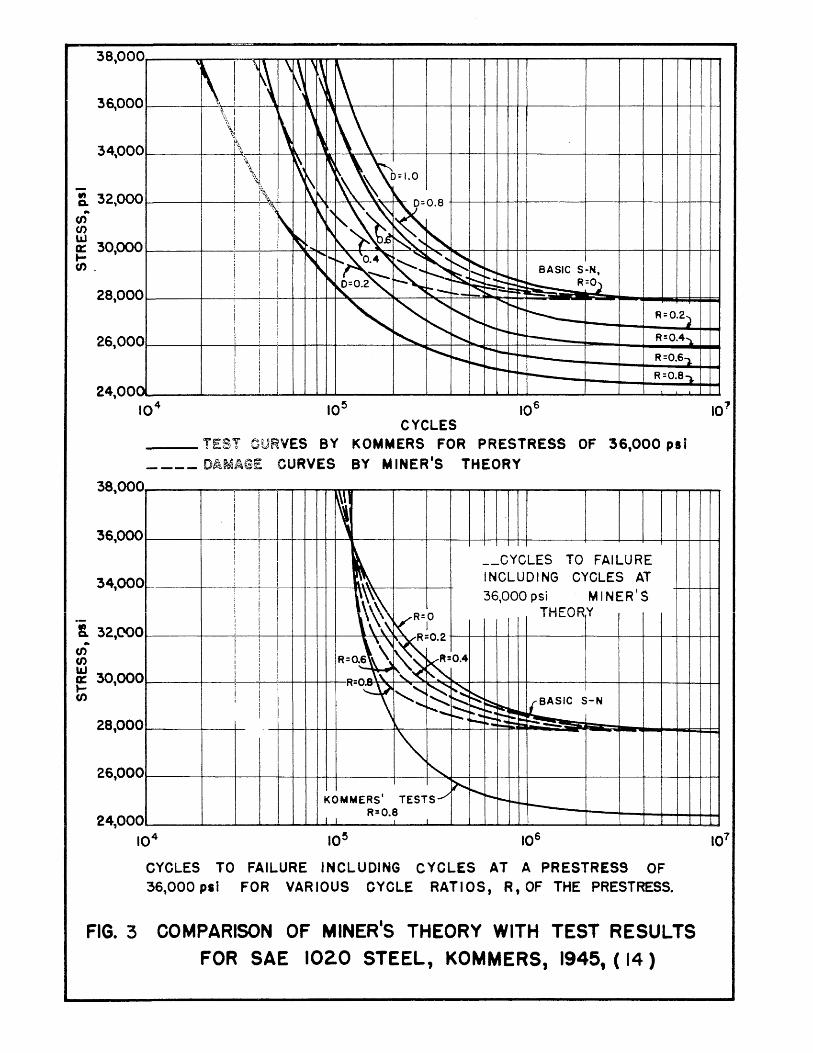
38,000
36,00 0
0
~ 32,000 .. fJ) fJ) Ul a:: 30,000 ... CJ).
28,00 0
26,00 0
24,00 n
.~ \\ \,\ \: \'., I \~ I
~ \1, i~ ~
\\ ~ '\
"\ i\
! I ~ I I
I I
I
!
i
I
'~~ ~~ I~ ~ , '~\ , '~\ \{I.O ~~
~ .:\ ~~O.8 -', '\
~\ ').~~~,t--. \r" '~~
~
~ ~ ~ ~ ~ '" BASIC S-N, r-...: ~ ::::r-. '~=0.2'" ~ ~- .... ~ R:OJ t- '!"or---- ..... I!!o.
~ '" " ........
r-.~
~ ......... ....... ------ R=0.2;
"-t" r--I-~ ........ --- R=0.4~
j'-... 1"""-0 to-I-~ ........ R =0.6"). ........ ...... ~ I"-~I-o - R=0.8.
104
38,000
36,000
34,000
& 32,COO .. fJ) C/)
"" a:: 30,000 ... C/)
28,000
26,000
CYCLES ___ TEST tHJRVES BY KOMMERS FOR PRESTRESS OF 36,000 psi ____ D~MAGE CURVES BY MINER1S THEORY
~I ~
\ I
__ CYCLES TO FAILURE I i
~ i INCLUDING CYCLES AT
!
I \\\~ 36,000 psi MINER'S I j TUC'f'\OV
<R=O I r"lL-vn, I
I I \\~:\ Rlo.2
~ ~KO.4 R=0.6 \,
R'O~ I ',~,~ i
, ..... ,~~~~ {BASIC S-N i'....:~ ~ .... ~ ......
"""'" ""'-'0.;;
"" "-TESTS/
~ r.... KOMMERS' r--. r--~~ ~ 24,000
104
I I R:0.8
I I
CYCLES TO FAILURE INCLUDING CYCLES AT A PRESTRESS OF 36,000 pli FOR VARIOUS CYCLE RATIOS, R, OF THE PRESTRESS.
FIG. 3 COMPARISON OF MINER'S THEORY WITH TEST RESULTS
FOR SAE 102.0 STEEL, KOMMERS, 1945, ( 14 )
i-

100
2 :;)
----~ ~o ~
2 -X ~ 2 80
"-0
~ ~ G) ()
~ ()
~ >1. ... Z UJ 0
60 a::: UJ
0, ~
~ -ld.
t)
a.. "
z , > ~ -----(/) en UJ a::: ... en "-0
UJ 0 :;) ... z C!)
c :I
40
20
o o
V SINUSOIDAL VARIATION IN J MAXIMUM CYCLIC STRESS
USED IN THESE TESTS.
20 40 60 80
PERCENTAGE OF TOTAL LOADINGS
DATA FROM ED 40' GIRDER
• 60' GIRDER
o 70' GIRDER
rJ 7S' GIRDER
t> 7S'-10· GIRDER
FIG. 4 FREQUENCY DISTRIBUTION OF MAXIMUM STRESSES OBTAINED FROM AAR TESTS.
----
100
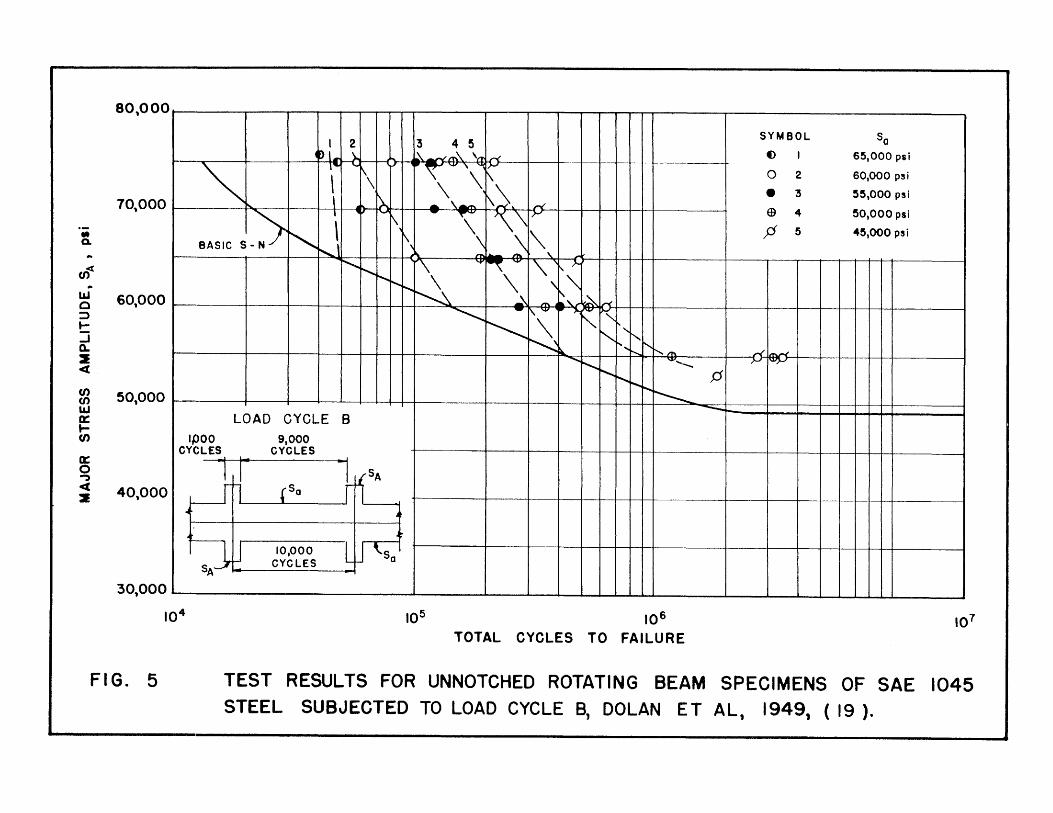
• Q.
CJ)< .. LLI o ::> t-:J a. 2 ct
f/) en UJ a: lf/)
a: o '"')
ct 2
80'000r-~~~~'--'--rl-rlllf------r-·--r--r~-rll-rITT------~--~~~--~~~~--~ SYMBOL So () 65,000 psi
IJ ,2,! I I I I 13 4 5 "l.~
0 2 60,000 psi
70,000 • :3 55,000 psi
e 4 50,000 psi
P 5 45,000 psi
60,000 l--'--II-H-t-H~~~~-~-aJ~~ ~~--T-+-~++~--~
~~~HTm+~~~~~~ 50,000 ~=-~~~~~~U--l-jf--i-+-i-t+-Hii::::::""--:bd==ht-UlJl--LOAD CYCLE 8
IPOO 9,000 CYCLES CYCLES
1 r-40,000
f 1 ~ 10,000 L CYCLES
30,000~. ________________________ ~ ______ ~ ____ ~ __ ~~~~~~ ______ ~ ____ ~~~~~~~~ ______ ~
104 105 106 107
TOTAL CYCLES TO FAILURE
FIG. 5 TEST RESULTS FOR UNNOTCHED ROTATING BEAM SPECIMENS OF SAE 1045 STEEL SUBJECTED TO LOAD CYCLE B, DOLAN ET AL, 1949, (19).
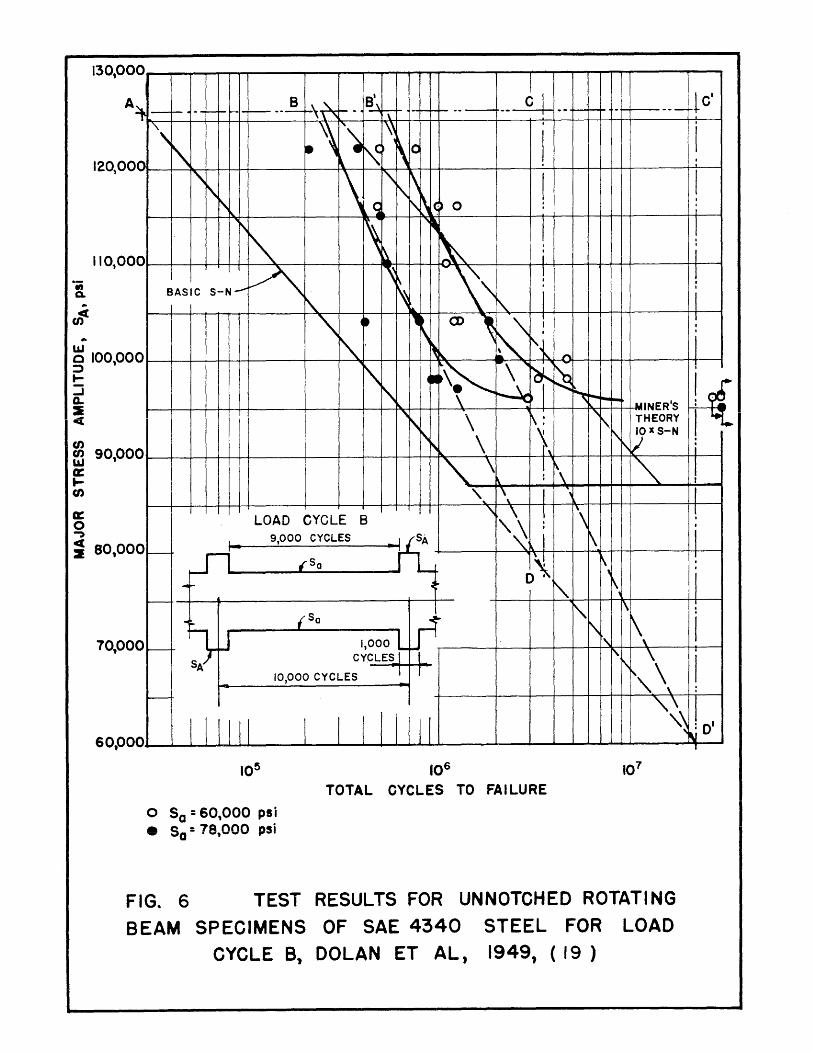
130,000
A '\t. 8 ~,~ 8'
1'" .. ----f- .-- _. ~ T - . ~ f-~ •• -. \\ \ \' \
\ ~ , 10
10 \
'\ ~ \ 1\
~ ~ ~~ <i ~~ l~·) 0
120,00
'", ~ ~~
~ 0 ~ ~
110,00
BASIC S-N--~ ~ \" ...
L\.I o 100,00 ::::> to-
0
:J a. :E Ci
Cf) f3 90,000 a: tCf)
a: o .., ; 80,000
70,000
60,000
~
I---
-
~
~ ....
'\ • l~ CD , \ ",. ~~
~
" 4_ ;~
~ 'r\ \
\~ \ ,\\
'\ '\
LOAD CYCLE B
1-9,000 CYCLES • ~ SA
,Sa
""' ... 1i
~- (sa .,p-
J-J -1,000 "'-~
CYCLES
10,000 CYCLES
l IIII1 1 I I 1IIII 10!> 106
-- J 1 I .
I I .
! I , !
" I
~ : I
~~ ~\ "" ~
~ 1
\:
'\ 1\
! \
"\ ! ,
~ I \k 0'
TOTAL CYCLES TO FAILURE
o Sa = 60,000 psi • Sa = 78,000 psi
! -- ~ 1--... ---
n
~ ~ r-.,. ...... -po.
UINER'S '\
"1\ THEORY 10 xS-N
\/ f\, ~
"
1'\ ~
~,
" ~,
~ ~
" \ r, \. \ 1\
1\" \ " ~\ ",
FIG. 6 TEST RESULTS FOR UNNOTCHED ROTATING
BEAM SPECIMENS OF SAE 4340 STEEL FOR LOAD CYCLE B, DOLAN ET AL, 1949, (19 )
~CI
· I · I · ;
! I t I
I I , I
I I
t\ i
! I ~
i !
i : I I :
! I '0 ~
I
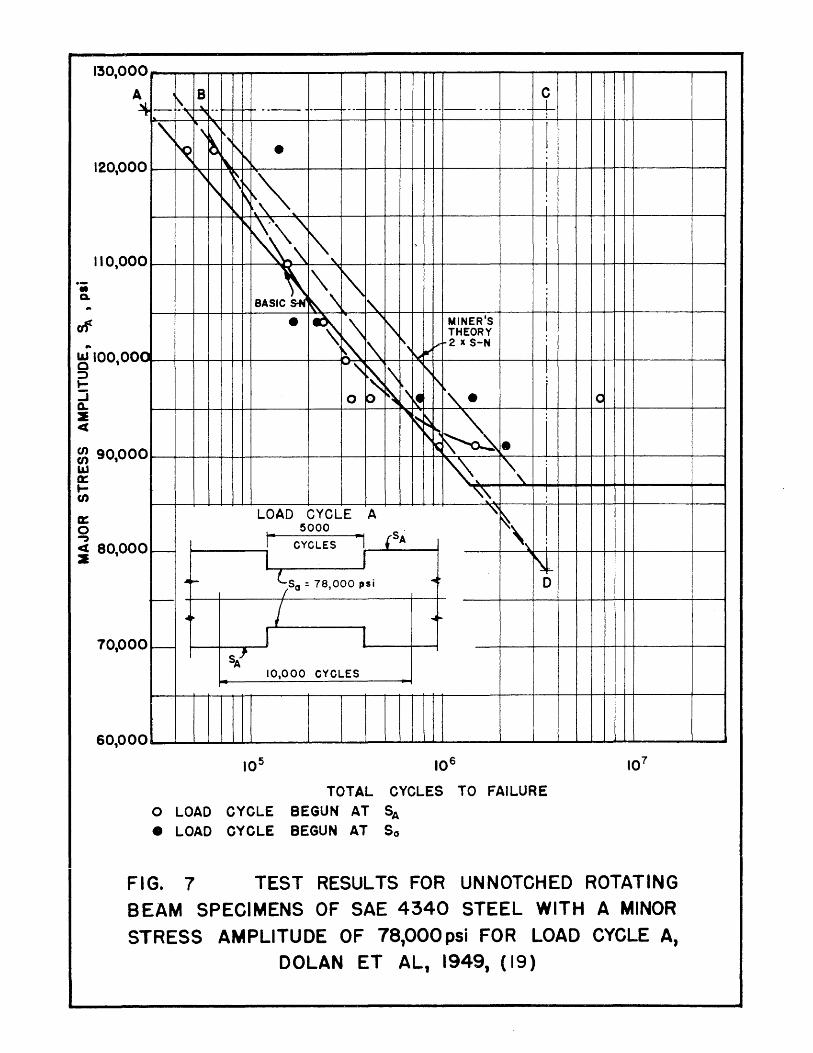
-. a.
..
130,000
A ~
120,00 0
110,00 0
I" ~ 100,00 ::J ~
::i Cl. 2 4
~ 90,00 0 LIJ a: ... fn
a: o ""')
; 80,00 0
70,000
60,000
\ B C
- ~ --"",""" f-I-r--- --f---- f-- I- - ,-I--1------~---W,-\ " 1', I ~ ~ \ • ~ r\ i
'\ ~ ~ ~,~ !
\ " " "' ...
I
\ \~\ '\ !
"'~\ "- i
BASI1 \ " I ~\
"
i • ~ ~\
~ MINER'S I i\ THEORY
~ r" ~, ~v 2 x S-N , ~
~'\
~ 1\ ~~ ! 0 p ~ \~ ~, . I
" f\ ~~ ~ I '~ • ~~ ", i ~
I
LOAD CYCLE A ~
~\ I 5000 {SA I CYCLES "1 '\. ;
~
1 \l ...... SSa = 78,000 psi .. D ~
/ ..... ....'"'
~ J
S/ 10,000 CYCLES
106
TOTAL CYCLES TO FAILURE
o LOAD CYCLE BEGUN AT SA • LOAD CYCLE BEGUN AT So
c
FIG. 7 TEST RESULTS FOR UNNOTCHED ROTATING BEAM SPECIMENS OF SAE 4340 STEEL WITH A MINOR
STRESS AMPLITUDE OF 78,000 psi FOR LOAD CYCLE A, DOLAN ET AL, 1949, (19)
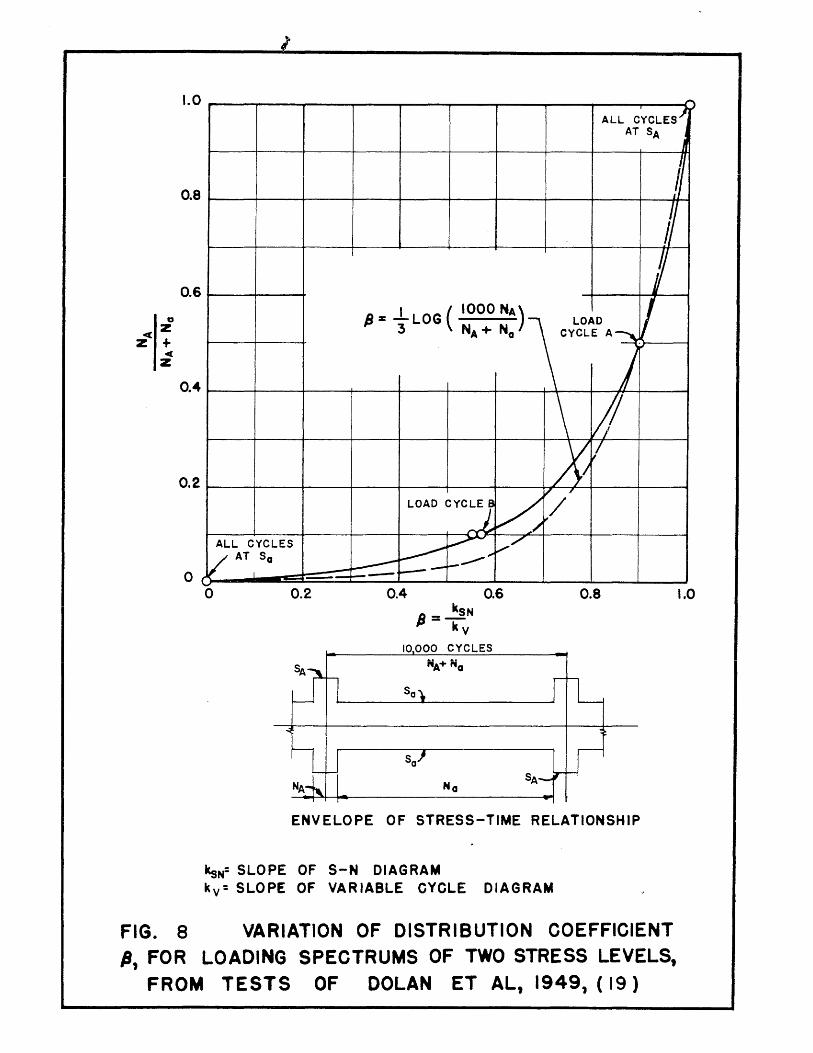
a ~Z
Z + 4(
Z
1.0
0.8
0.6
0.4
0.2
o
FIG. 8
I
:> ALL CYCLESJ
AT SA
J
h ,7 h
j fJ 1 LOG ( 1000 NA) V ~"3 NA+ Na \ Cy~O~D Aj
\ II X /
~ V /
LOAD CYC1 ,,/ ALL CYCLES ~ V"""'" V ATI Sa ----~~~ - ~-I--
<.,.. ----o 0.2 0.4 k
~=~N kV
0.6
10000 CYCLES
Na
0.8
ENVELOPE OF STRESS-TIME RELATIONSHIP
ksN= SLOPE OF S-N DIAGRAM kv= SLOPE OF VARIABLE CYCLE DIAGRAM
VARIATION OF DISTRIBUTION COEFFICIENT
1.0
fJ, FOR LOADING SPECTRUMS OF TWO STRESS LEVELS, FROM TESTS OF DOLAN ET AL, 1949, ( 19 )
I
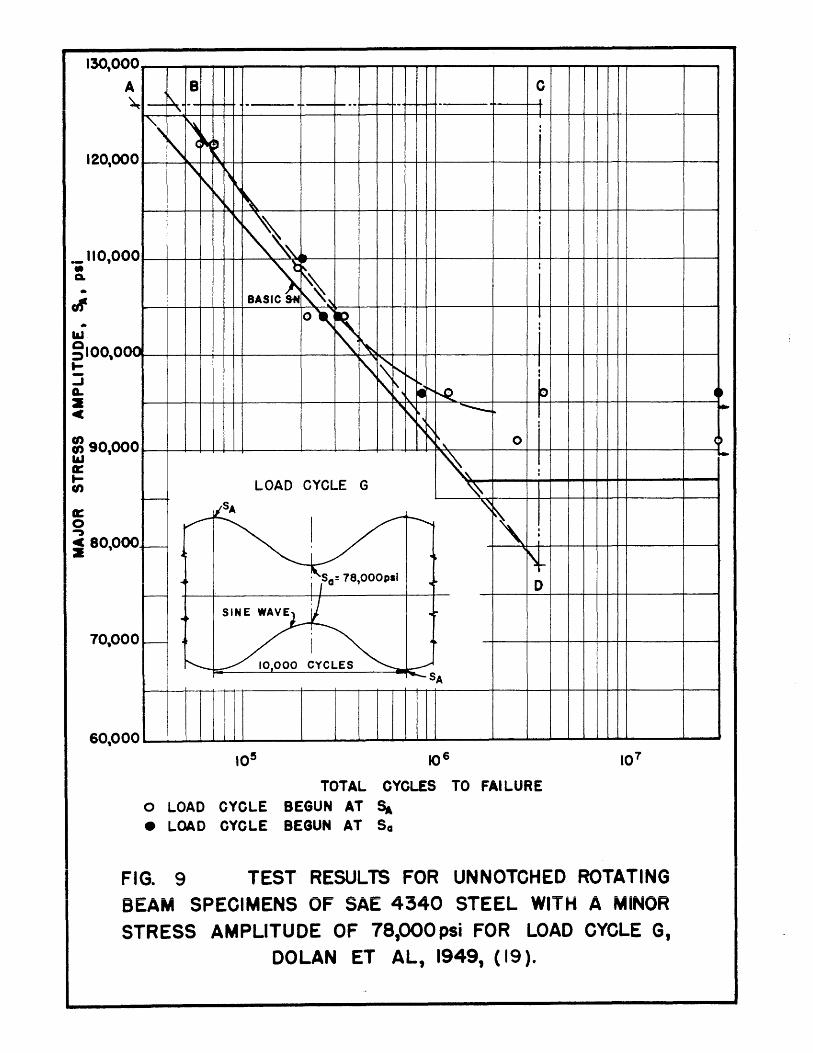
130,000
A B C ~ - ~- - .-~ !--1-- 1--+-~. I
J
", " .~ i 1\ ( , 0 \.
" ~ ~ i i\~ \~
'~ . I 00 ~,\, ..
BASI~ ~\ I I
1\. ~~ O~
~ i nn ~ i'\ ~ ~ I
r--.. : 1\ ~, ~~ ~ p
~r\ ~ '--~~
~ 90,00 1&.1 a:: ~ U)
0 , \ 0 i
" I
a:: o ..,
I----LOAD CYCLE G
I I
~ ~
I
; 80,000 ~ I ~ !\ .
~ ~
4 • N-
70,00 0
60,00 °
... i ra= 78,OOOpsi .~ D f---
~ ... SINE WAVE ......
>--- •
10,000 ~YCLES ~ L...---" i -SA
10~
TOTAL CYCLES TO FAILURE o LOAD CYCLE BEGUN AT S. • LOAD CYCLE BEGUN AT Sa
FIG. 9 TEST RESULTS FOR UNNOTCHED ROTATING BEAM SPECIMENS OF SAE 4340 STEEL WITH A MINOR
STRESS AMPLITUDE OF 78,000 psi FOR LOAD CYCLE G, DOLAN ET AL, 1949, (19).
.. .. 0 -

C/) C/)
LLJ a:: ..... C/)
SA~~----------------~----------------__
S -I +COI( 70~)
(a) FREQUENCY-DISTRIBUTION SPECTRUM
Sa~------------------~--------------~--o 50 100 PERCENT OF TOTAL LOADINGS
~r-----------~--======~~r-----------I A B
("IOP) S= 1+ COl Tc5'OO
D _ A, REA AECD tJ OR,
AREA ABCD
'. (3 [("IOP)] _ IS: 6.10 I + COl 1000 dp = 0.899 ==0.90
(b) 1000 CYCLE LOG-DISTRIBUTION PATTERN Sa~D ____________ ~ __________ ~~ __________ ~ p:O 1.0 2.0 3.0
lOP: Nt FOR A IPOO CYCLE LOADING PATTERN
FIG. 10 FREQUENCY DISTRIBUTION AND LOG-DISTRIBUTION
DIAGRAMS FOR A SINE WAVE LOADING SPECTRUM
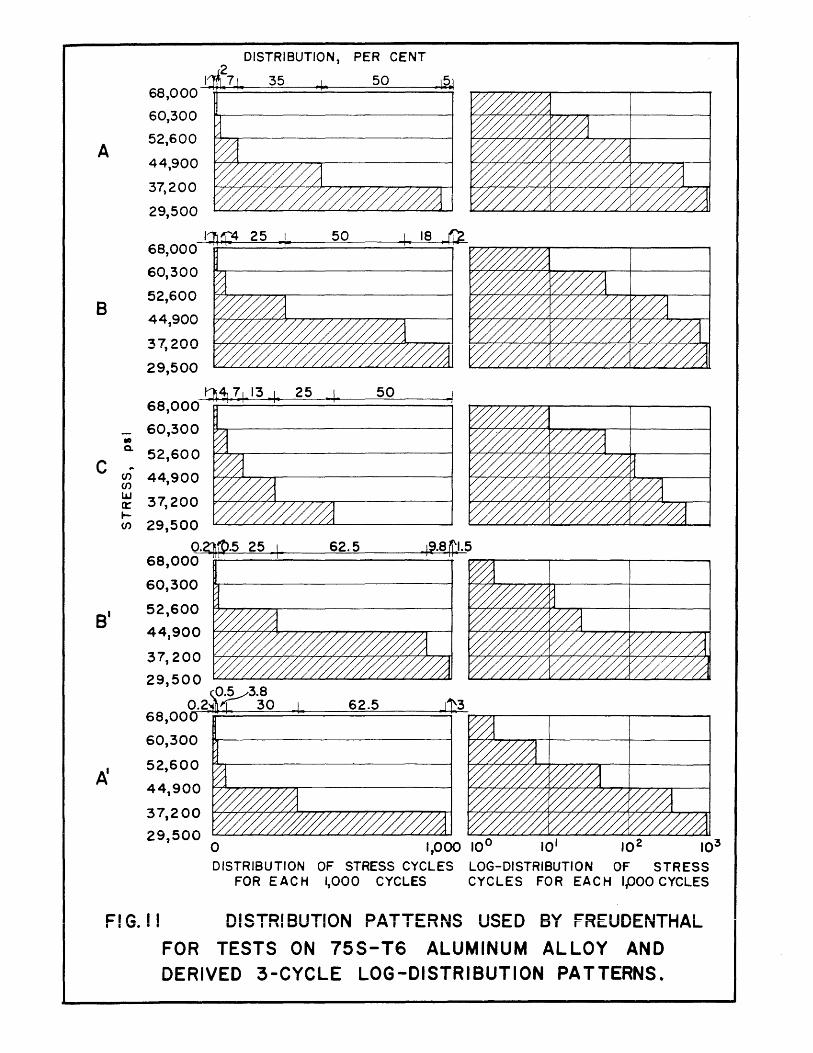
A
B
DISTRIBUTION, PER CENT
I 35 50 68,0001~~======:t~=========~
60,300
52,600
44,900
37,200
29,500
1~"""4 25 I 68 000 -11+ .-1-, 60,300
52,600
44,900
37,200
29,500
50 ~. 18 r~
25 50
._ 60,300 • 0.
C .. CJ)
81
CJ)
LU Il: toCJ)
52,600
44,900
37,200
29,500
0.~+O.5 25 I 68,000
60,300
52,600
44,900
37,200
29,500 1>~3.8
68 00~·2~ I... 30 , 60,300
52,600
44,900
37,200
29,500 o
62.5 ~~--~------~-------
62.5
1000 10° 10' , DISTRIBUTION OF STRESS CYCLES LOG-DISTRIBUTION OF STRESS
FOR EACH 1,000 CYCLES CYCLES FOR EACH IpOO CYCLES
F! G. I ! DISTRIBUTION PATTERNS USED BY FREUDENTHAL
FOR TESTS ON 75S-T6 ALUMINUM ALLOY AND DERIVED 3-CYCLE LOG-DISTRIBUTION PATTERNS.
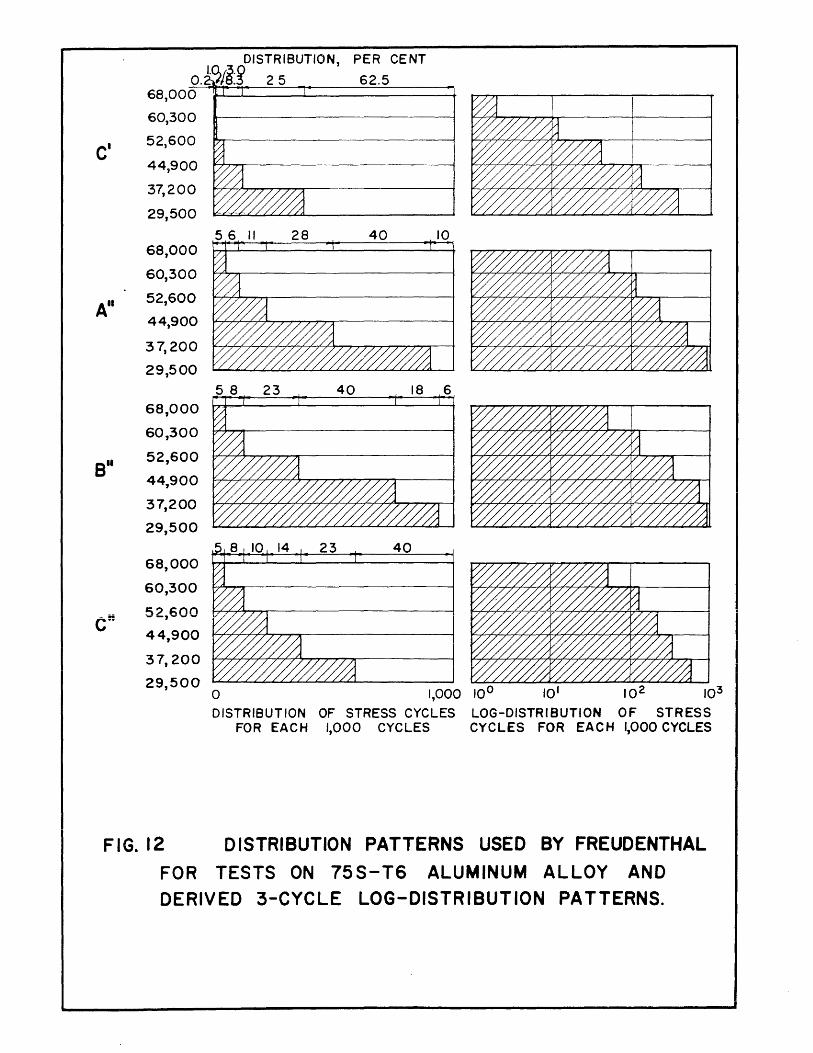
c·
All
Bit
en
60,300
52,600
44,900
37,200
29,500
68,000
60,300
52,600
44,900
37,200
29,500
68,000
60,300
52,600
44,900
37,200
29,500
68,000
60,300
52,600
44,900
37,200
29,500
PER CENT
62.5
~:~: 14 I" 23 I'
40
a 1,000 10° 10' 102 103
DISTRIBUTION OF STRESS CYCLES LOG-DISTRIBUTION OF STRESS FOR EACH 1,000 CYCLES CYCLES FOR EACH 1,000 CYCLES
FIG. 12 DISTRIBUTION PATTERNS USED BY FREUDENTHAL
FOR TESTS ON 75S-T6 ALUMINUM ALLOY AND
DERIVED 3-CYCLE LOG-DISTRIBUTION PATTERNS.
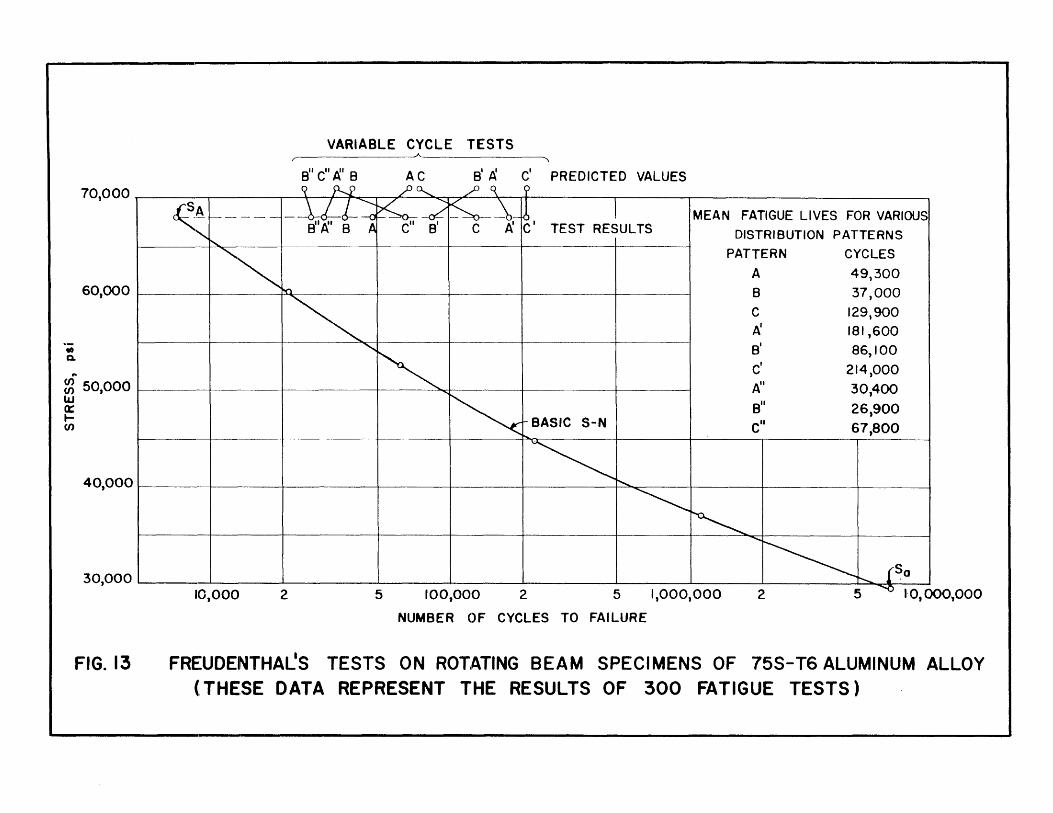
-Do
..
70,000
60,000
~ 50,000 LLJ 0: t-en
40,000
30,000
FIG. 13
VARIABLE CYCLE 'TESTS
el/cl/ AI e AC el A CI
PREDICTED VALUES
~~----- ~,{'-i~~i ts-~~._ ~, I MEAN FATIGUE LIVES FOR VARIOUS C AI TEST RESULTS DISTRIBUTION PATTERNS
~ PATTERN CYCLES
~ A 49,300 1-0 e 37,000
~ C 129,900 AI 181,600
.......... 81
86,100
~ Cl
214,000 A" 30,400
~~ e" 26,900 I
~ BASIC S-N c" 67,800
~ I
I'--.. I
~ ~ I
I
......... r------r--.... {~a I
J 10,000 2 5 100,000 2 5 1,000,000 2 5 .0,000,000
NUMBER OF CYCLES TO FAILURE
FREUDENTHAL'S TESTS ON ROTjATING BEAM SPECIMENS OF 75S-T6 ALUMINUM ALLOY (THE',SE DATA REPRESENT THE RESULTS OF 300 FATIGUE TESTS)
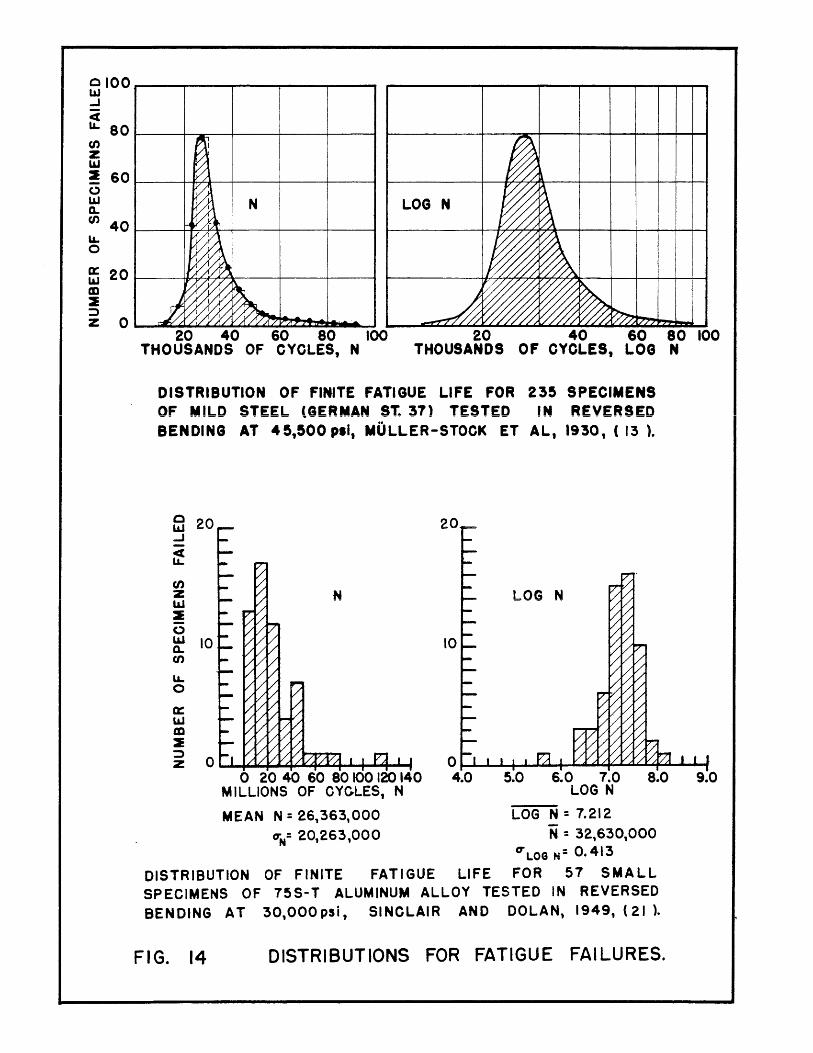
0100 __ --__ --__ --__ ----__ --_ ~--------r_--~--~--~~~~~ IJJ ..J
~ en z LU
BO~--~~_+--~----+_--~ ~--------r_~~--_+--~4_~+_~
2 60~--~+r_+--~----+_--~ ~--------r_~~~_+--~4_~+_~ o LU 0.. N LOG N
en 40~--~~~--~----+_--~ ~--------r4~~~_+--+_4_4_+_~ L&. o
ffi 20~--~AHYT--~----+_--4 ~--------~~~~~--+_~4_+_~ m 2 ::l z OL-~~~~~~~~~~ L __ ~~~~~~~~~~~~~
20 40 60 BO 100 20 40 60 80 100 THOUSANDS OF CYCLES, N THOUSANDS OF CYOLES, LOG N
DISTRIBUTION OF FINITE FATIGUE LIFE FOR 23~ SPECIMENS OF MILD STEEL (GERMAN S1: 37) TESTED IN REVERSED BENDING AT 4~,500 pII, MULLER-STOCK ET AL, 1930, ( 13 l.
til 20 ...J
~ en z LIJ :E (,)
LIJ 10 0.. en u.. o £t: LIJ m 2
20
LOG N
10
i 0 O~~~~~~~~~~~~ o 20 40 60 BO 100 120 140 4.0 5.0 6.0 7.0 B.O 9.0
MILLIONS OF CYCLES, N LOG N
MEAN N = 26,363,000 LOG N = 7.212
O"N= 20,263,000 N = 32,630,000 CT LOG N = 0.413
DISTRIBUTION OF FINITE FATIGUE LIFE FOR 57 SMALL SPECIMENS OF 755-T ALUMINUM ALLOY TESTED IN REVERSED BENDING AT 30,000 psi, SINCLAIR AND DOLAN. 1949, (21 ).
FIG. 14 DISTRIBUTIONS FOR FATIGUE FAILURES.
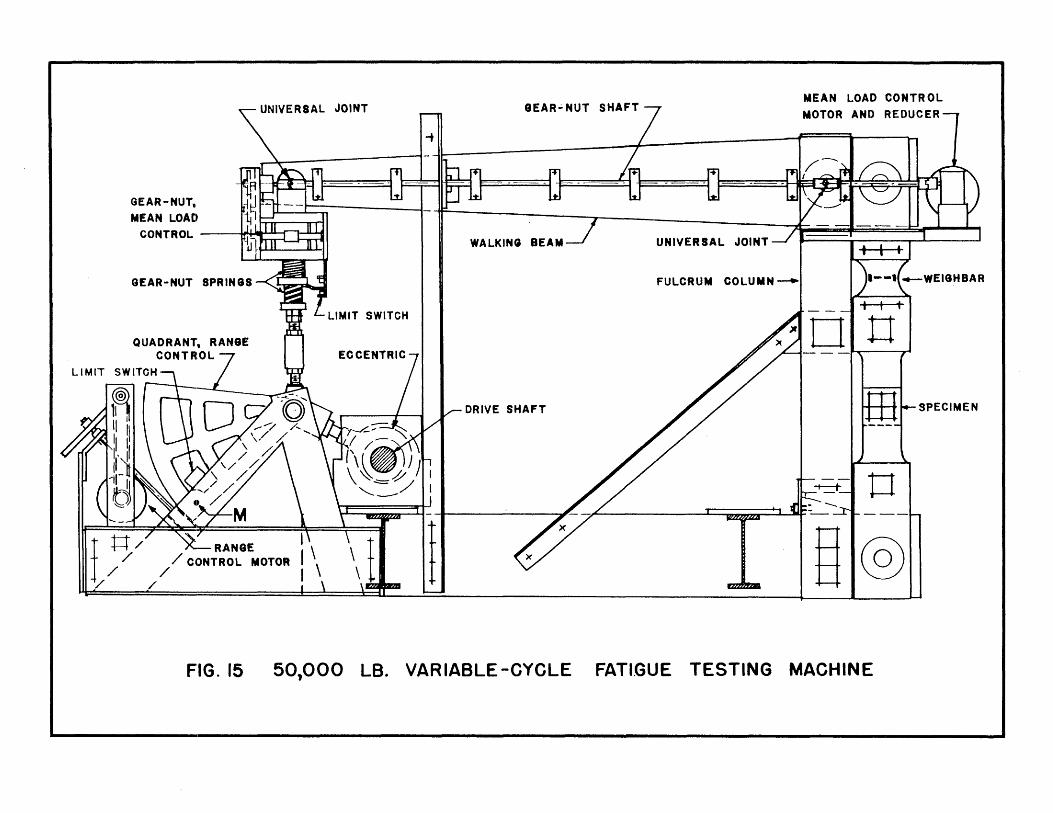
UNIVERSAL JOINT
GEAR-NUT.
MEAN LOACt CONTROL l~i.UlllI ~
GEAR-NUT SPRINas
RANGE / CONTROL MOTOR
/
LIMIT SWITCH
ECCENTRIC
aEAR.;.NUT SHAFT
WALKING BEAM UNIVERSAL JOINT
DRIVE SHAFT
MEAN LOAD CONTROL
MOTOR AND REDUCER
SPECIMEN
o
ElI@
FIG. 15 50,000 LB. VARIABLE -CYCLE FATI.GUE TESTING MACHINE

1.~71 _______ _
"............ r CIRCULAR PATH OF QUADRANT
'-.(.----
ECCENTRIC, III FIXED
(Q) POSITION OF LINKAGE ARM • a" FOR MAXIMUM RANGE
O.33I1l_
tb) POS!TION OF LINKAGE ARM "a" FOR MINIMUM RANGE
FIG.16 SCHEMATIC DIAGRAMS OF LINKAGE MECHANISM
FOR RANGE CONTROL
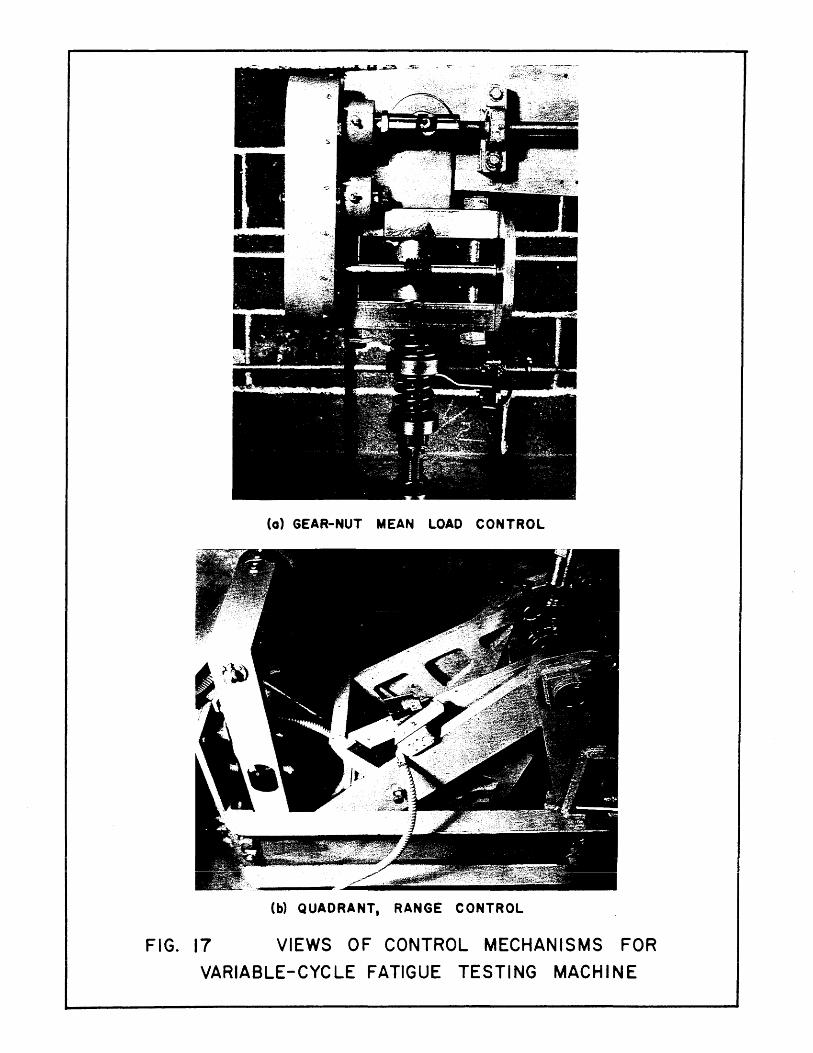
(a) GEAR-NUT MEAN LOAD CONTROL
(~ QUADRAN~ RANGE CONTROL
FIG. 17 VIEWS OF CONTROL MECHANISMS FOR
VARIABLE-CYCLE FATIGUE TESTING MACHINE
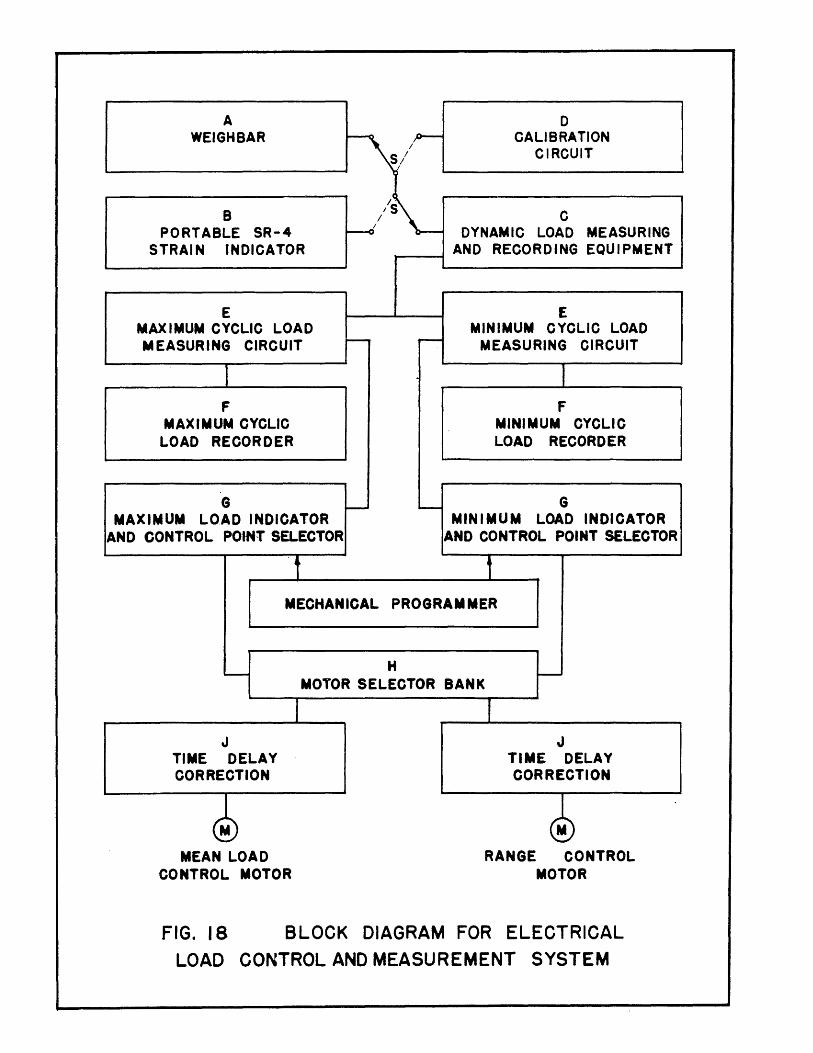
A D WEIGHBAR /,1>-- CALIBRATION
S/ CIRCUIT
/.
B IS C
PORTABLE SR-4 ~/ DYNAMIC LOAD MEASURING STRAIN INDICATOR AND RECORDING EQUIPMENT
E E MAXIMUM CYCLIC LOAD MINIMUM CYCLIC LOAD MEASURING CIRCUIT --- - MEASURING CIRCUIT
I I F F
MAXIMUM CYCLIC MINIMUM CYCLIC LOAD RECORDER LOAD RECORDER
G --- - G MAXIMUM LO.AD INDICATOR MINIMUM LOAD INDICATOR
AND CONTROL POINT SELECTOR AND CONTROL POINT SELECTOR
·t t MECHANICAL PROGRAMMER
H - I--MOTOR SELECTOR BANK
J TIME DELAY CORRECTION
~ MEAN LOAD
CONTROL MOTOR
J I J
TIME DELAY CORRECTION
~ RANGE CONTROL
MOTOR
FIG. 18 BLOCK DIAGRAM FOR ELECTRICAL
LOAD CONTROL AND MEASUREMENT SYSTEM
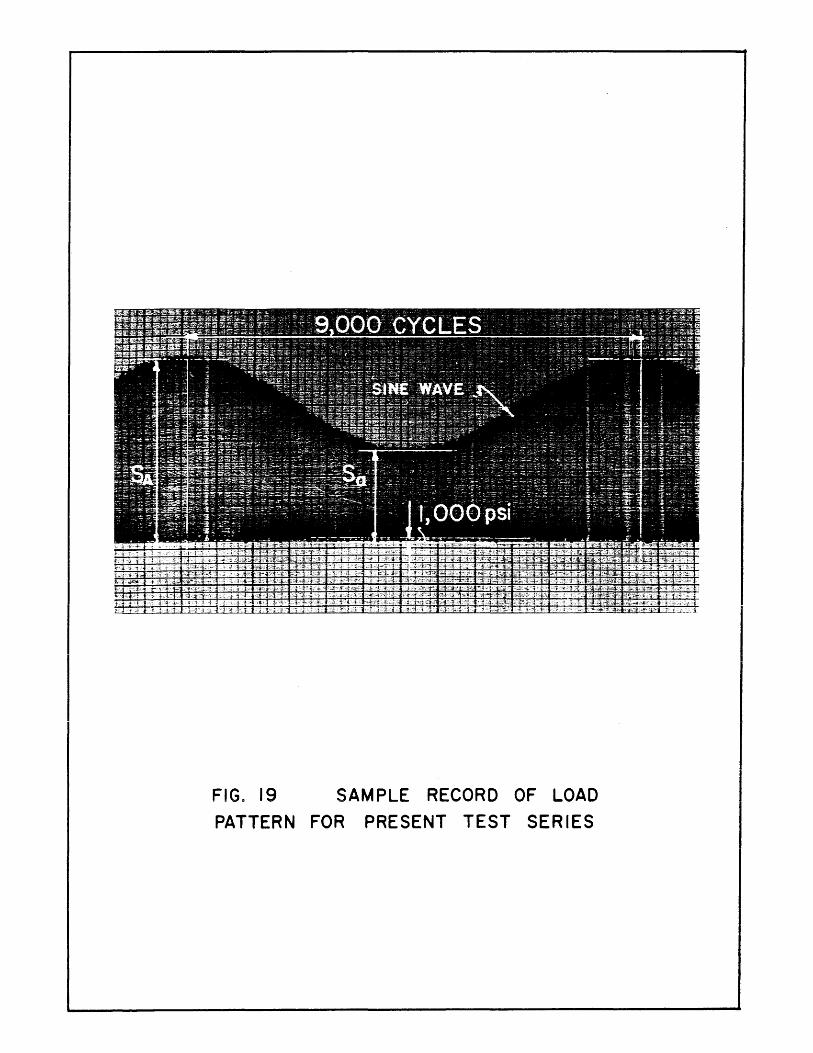
FIG~ 19 SAMPLE RECORD OF LOAD
PATTERN FOR PRESENT TEST SERIES
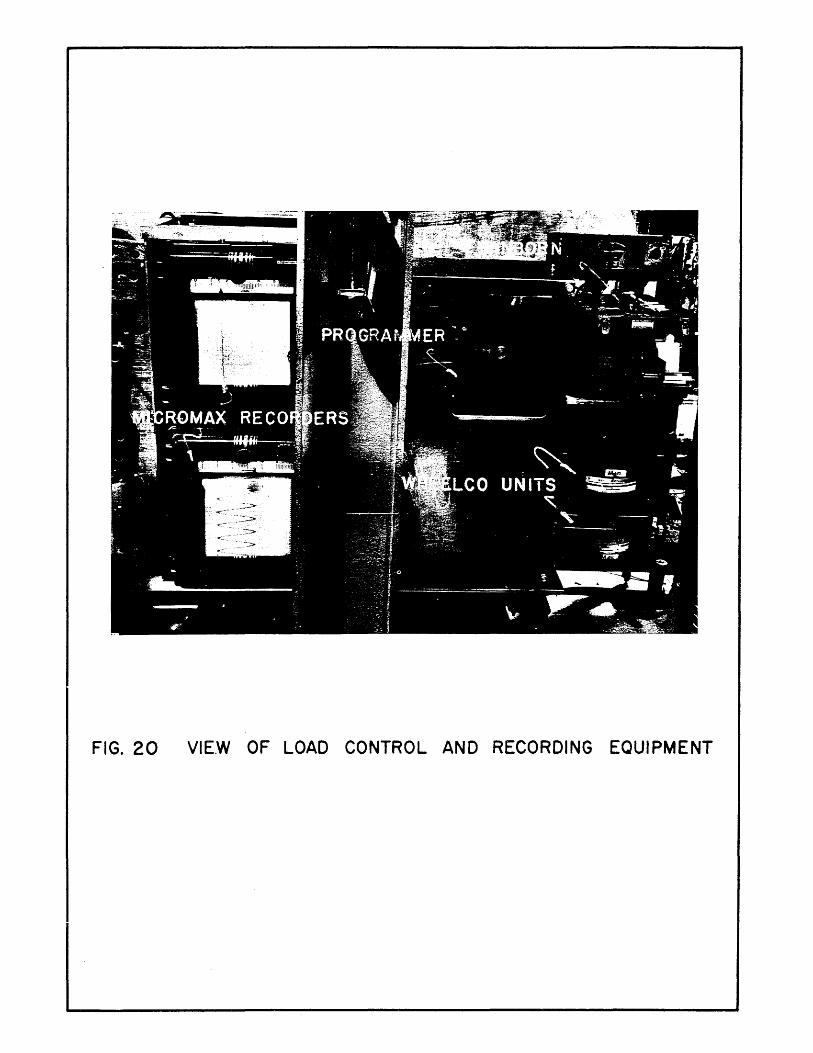
FIG. 20 VIE.W OF LOAD CONTROL AND RECORDING EQUIPMENT
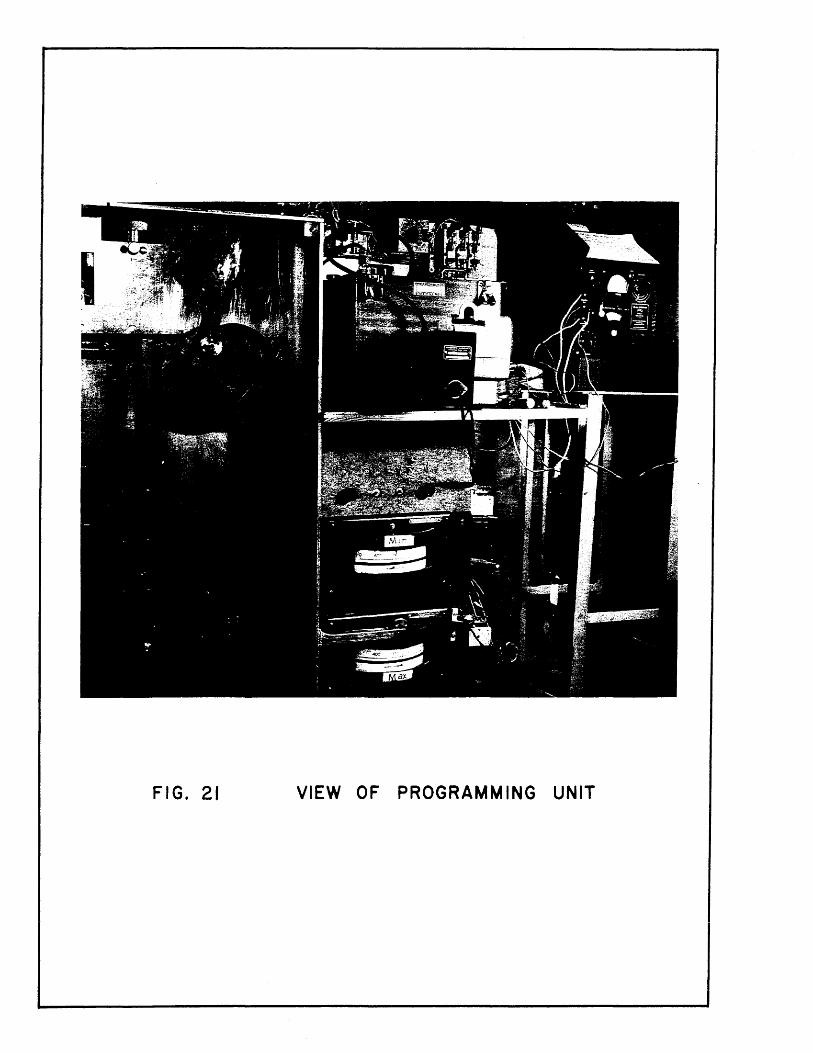
FIG. 21 VIEW OF PROGRAMMING UNIT

" Radius I (-6 Drilled holes
311
" 14 3
I ,"~ '11_-' L _I __
l is Urillea notes
1" 24
FI G. 22
* ill ~Drilled holes with close fitting fasteners of threaded cold -rolled rod,
-,. N
II:
C\J
7"
JOINT SPECIMENS
-k _', -II
Radius 4
I" Drilled hOle! 9" 9
11 ,- t! 311
24 3 14
PLAIN PLATE SPECIMENS
DETAILS OF SPECIMENS
--1(\1 C\J
r0 co
= C\J
= = r<) r-
C\J
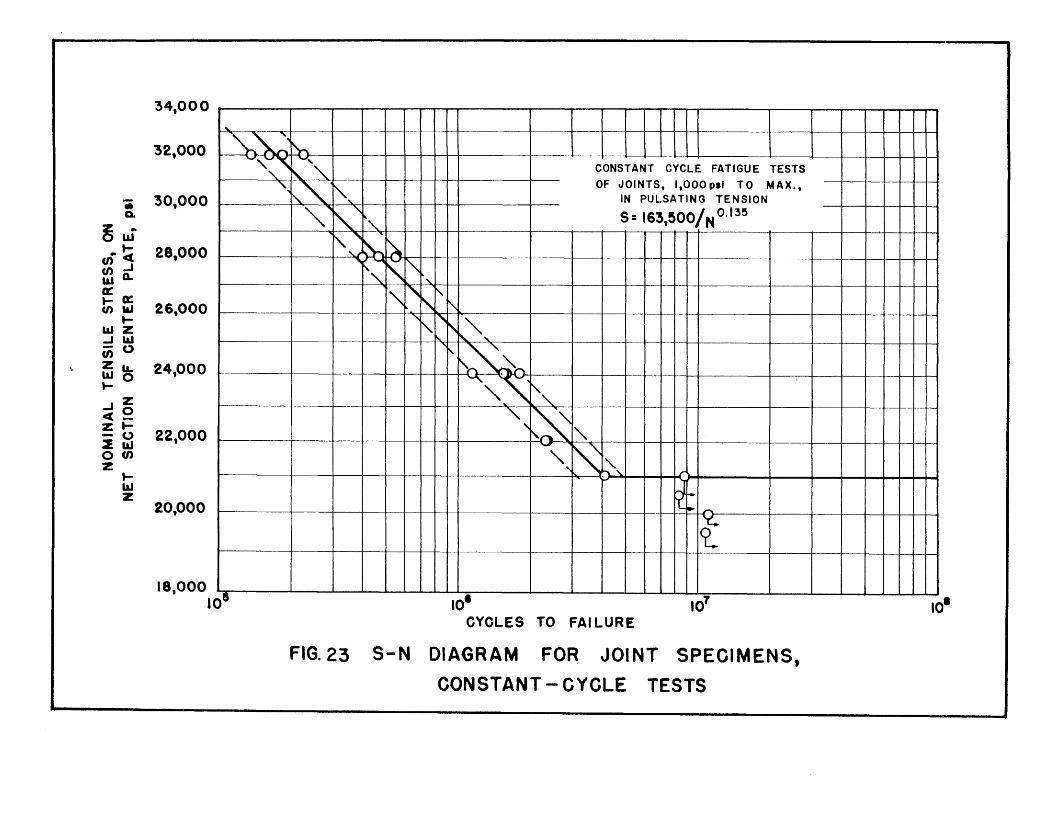
.. Q.
~w .. to-
(f)c:t (f)...J
""n. a: t-a: (f)1iJ
t-WZ ..J&IJ Ciio
... Zu.. Wo ... ..Jz c(2 zl--0 2w Of/) Z ...
W z
34,000 ...
32,000 ~ ~, " ~, CONSTANT CYCLE FATIGUE TESTS
30,000
28,000
26,000
24,000
22,000
20,000
18,000 10 •
'-,
~" ~, OF JOINTS, I,OOOPII TO MAX.,
IN PULSATING TENSION
" ~ " 1', s= 163,500/NO.13~ ~' '"
~ ,~~ f', " , 1'\ '" ~ ~ f' "' I' 1',", " l~ -, ~" "'~ "'-, ~ " - l'\ ", ~, r
~
~ f-~ <L
-10 10 CYCLES TO FAI LURE
FIG.23 S-N DIAGRAM FOR JOINT SPECIMENS,
CONSTANT - CYCLE TESTS
10'
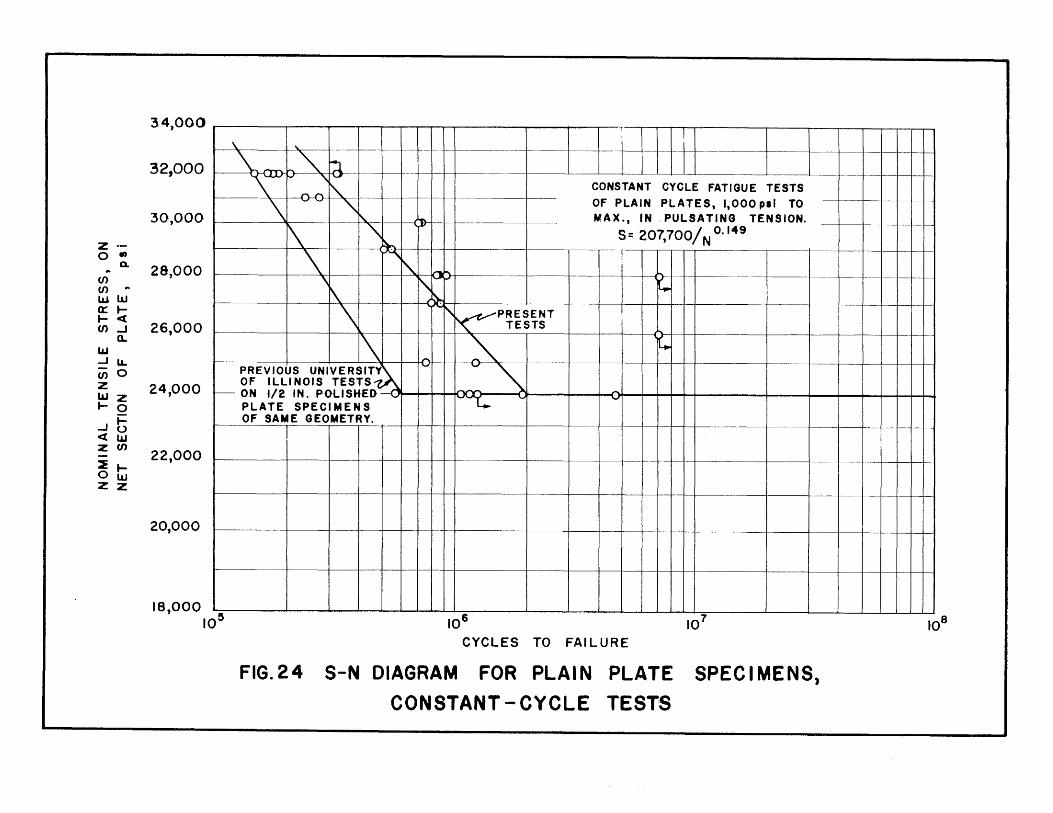
z .-o ., Q. ..
(/) (/)
UJW ll:~ t-C:( (/)...1
a.. LaJ ...I~
00 0 z LaJZ t- 0
...It; c:(LaJ zen 2~ Ow ZZ
34,000 ~------~~--~--~--'-~~-.-r~--------r----4r--'r--I--~~~~---------r----~--~--.-~.-.-~
32,000
30,000
28,000
26,000
24,000
22,000
20,000
18,000 10~
----~-I----+---t---t--+-+-
.-----+--+----iCX} I I I I I
CONSTANT CYCLE FATIGUE TESTS
OF PLAIN PLATES, 1,000 pal TO MAX., IN -PULSATING TENSION.
S= 207,700/ N 0.149
~---t-t------ ------t t-----j--- t-r--t-
PRESENT TESTS
~ PREVIOUS UNIVERSITY OF I LLI NOI S TESTS ON 1/2 IN. POLISHED --.
v PLATE SPECIMENS OF SAME GEOMETRY.
106 107
CYCLES TO FAr LURE
FIG.24 S-N DIAGRAM FOR PLAIN PLATE SPECIMENS,
CONSTANT - CYCLE TESTS
108
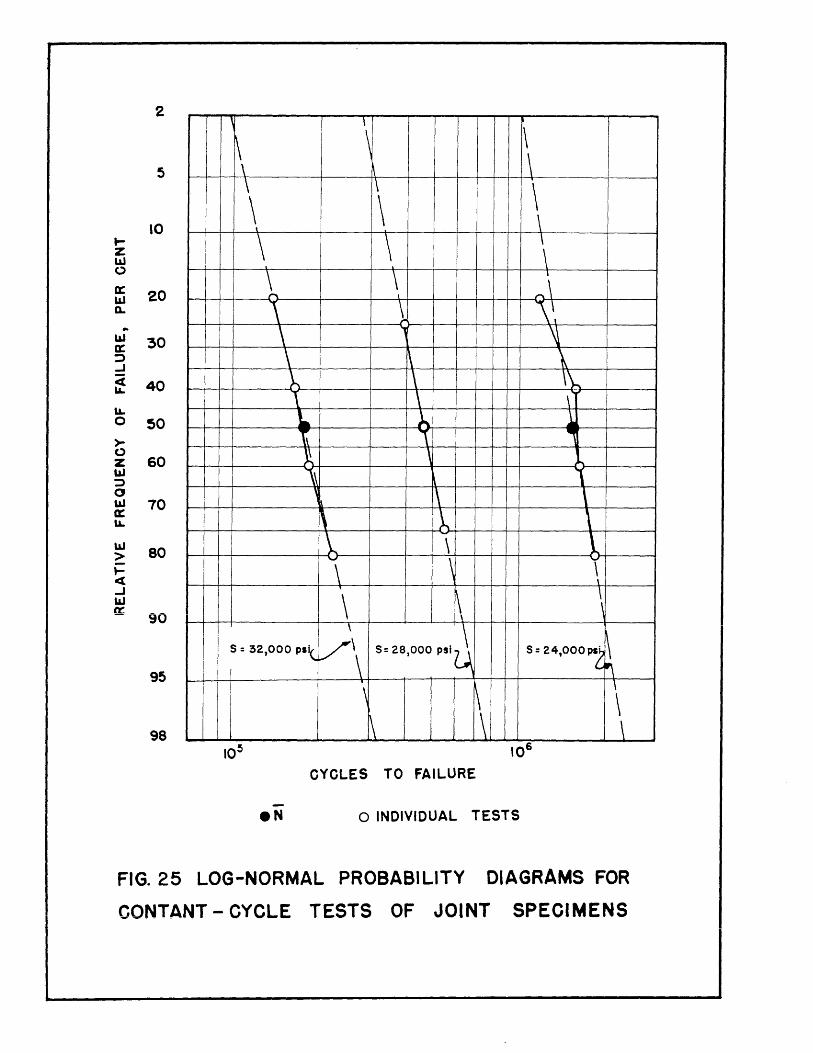
2 \
\ ~\ \ \
\ \ \ \ \ \ t
\ \ \ . \ \ "'\ ,
\ \\
5
10 .... Z LLI 0
a: 20 LLI Q.
\ .,
~ \ ~ \ ~ \ \\ 1 \ \ ). ~ .l \\ '\ .,
.. LLI 30 a: :J -l <i 40 ~
~ 0 50 >-
~ 0 z 60
\\ 1 LLI :J ,
\ \ ~ ~ , a
LLI 70 a: ~
~ ~
t \
\ \ \ \
LLI 80 > .... 4 ,
\ \ \
\
5= 28,000 P'I~ S = 32,000 P.~ V\ 5= 24,000P2~ \ \ \
\
\ \ \
-l "-I tr:
90
95
98
CYCLES TO FAILURE
-• N 0 INDIVIDUAL TESTS
FIG. 25 LOG-NORMAL PROBABILITY DIAGRAMS FOR
CONTANT - CYCLE TESTS OF JOINT SPECIMENS
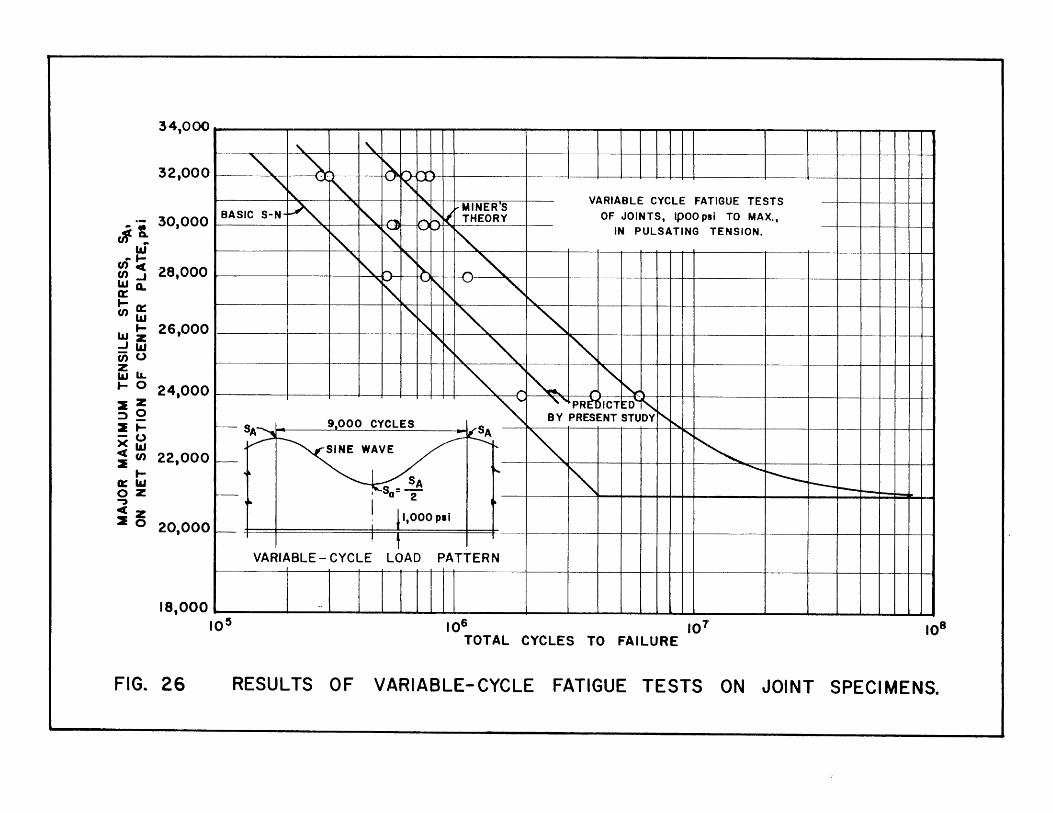
34,000
'" " 32,000
... 30,000 ~'!.
iLl .. I-~ ~ 28,000 iLIa. ct: I-a: (/)iLI
iLl f- 26,000 -'~ c;;0
" ~~'" ~ R ~ " l\. VARIABLE CYCLE FATIGUE TESTS
~ "'I
"-"'I
~ ~ .... MINER S BASIC S-N
~ ~ THEORY OF JOINTS, IpOO psi TO MAX.,
I--"'I
~ I--'
'" IN PULSATING TENSION.
"" "-fb ~k> '" z: I--
S ~ , ", "-
" "" '" -
" "" "" r\. Z iLlLL .... 0 24000 • :l Z ::>2 :It--0 X iLl ; (/) 22,000
I-0:1.&.1 OZ .., C z 20 20,000
~; ~ r~~ r-- S 9,000 CYCLES /S ~ "" PRtblCTED '",
" BY PRESENT STUDY f'..
~ ~ A
"'" I'" 1',
r-- ~~: ~
........... I'---SA
r- I 50 =2 ~ I
. 1,000 pil I ---J
VARIABLE - CYCLE LOAD PATTERN
18,000 IO~
..
106 101 TOTAL CYCLES TO FAILURE
t----r--
108
FIG. 26 RESULTS OF VARIABLE-CYCLE FATIGUE TESTS ON JOINT SPECIMENS.
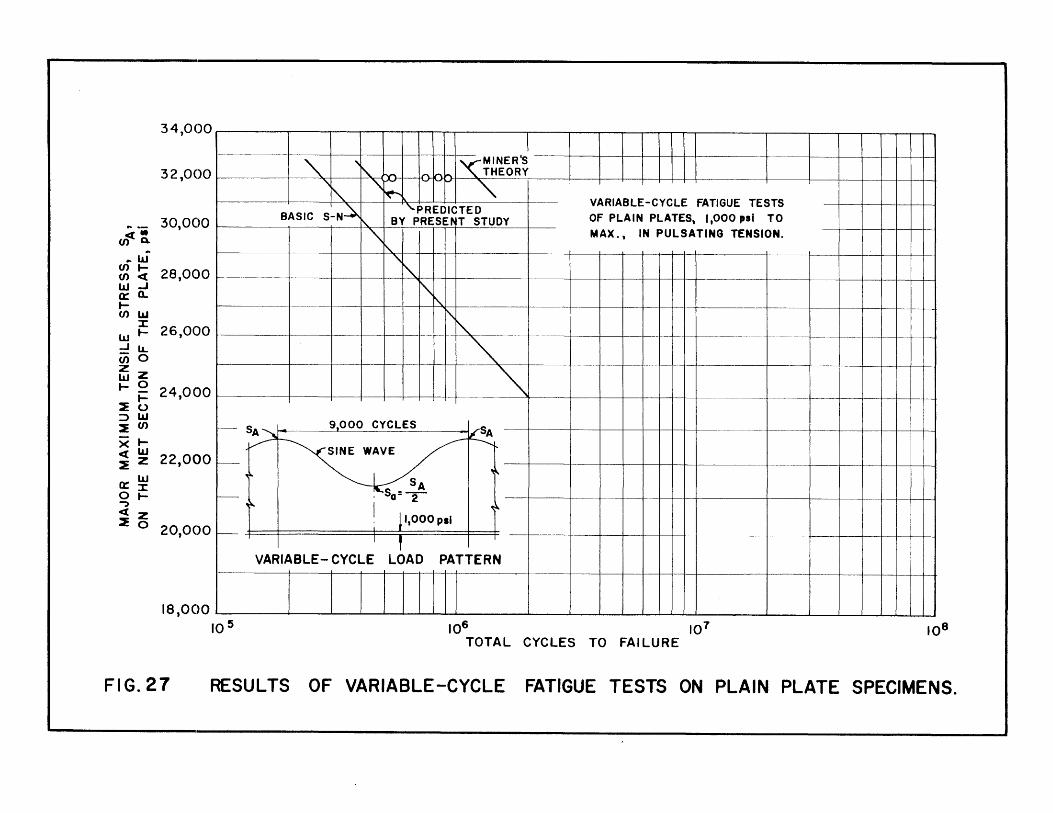
34,000 I
32,000
en;: ~ 30,000
'" ... ~MINER'S "- "" ,..... lO-n. THEORY
'\~ "\ ~ -
~ " ~ VARIABLE-CYCLE FATIGUE TESTS
BASIC S-N~'\. 'PREDICTED BY PRESENT STUDY OF PLAIN PLATES, 1,000,11 TO
"\ MAX., 'N PULSATING TENSION.
~ ... W " en .... 28,000 en« ~
w.J 0:0... .... enlJJ
:I: 26,000 w ....
.JlL. 000
~z .... ~ 24 000 .... ' ~o
1\ ~ 1--
1\ --- -- - G····· 1------ -- 1--------
t-----
"" ::>1.&.1 ~en
x .... «l&J ~ z 22,000
o:~ 0 .... -, « z ~ 0 20000 ,
- ~ 9,000 CYCLES ~ SA
~-~~ ~ ~~
SA f- ' Sa=~
~ I ~, , i ',000 pal t--
I , VARIABLE- CYCLE LOAD PATTERN
I I I I I I I I I
18,000 10 5 106 107
TOTAL CYCLES TO FAILURE
I
r-------- - 1----t----
108
FIG.27 RESULTS OF VARIABLE-CYCLE FATIGUE TESTS ON PLAIN PLATE SPECIMENS.
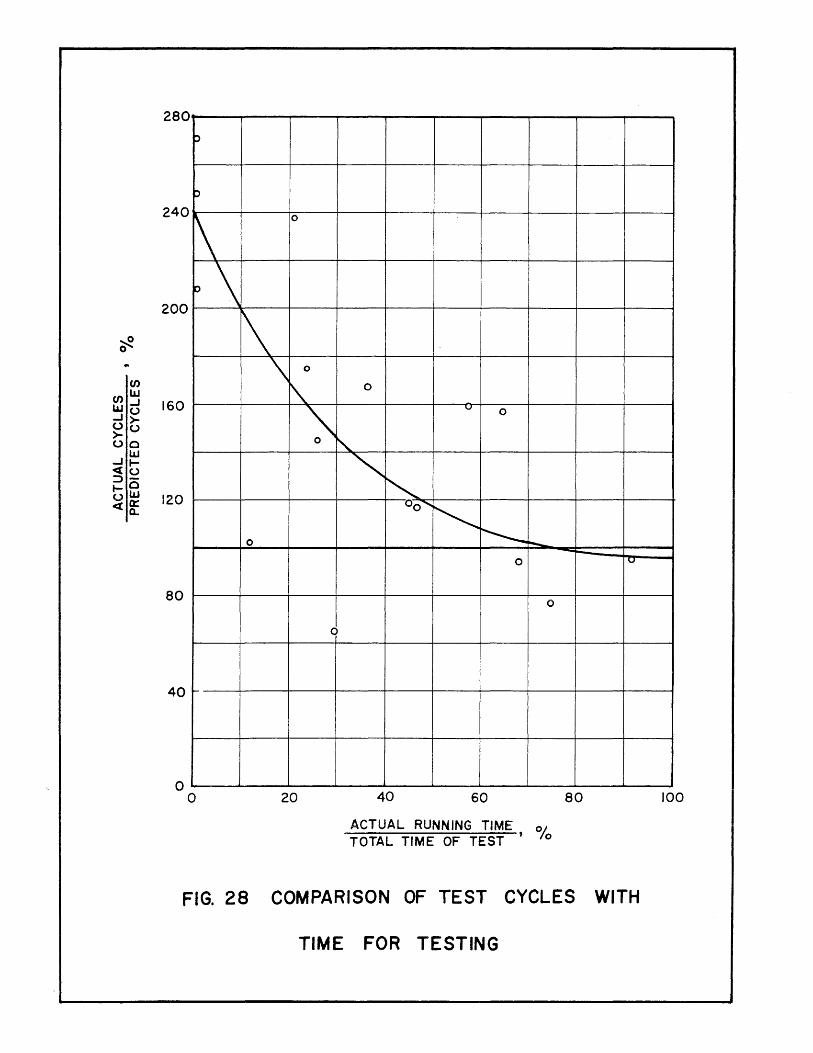
~ 0
en en UJ
.J LIJ u .J >-U U >-U 0
...J UJ .....
<t U :::>
0 ..... 0 LLJ -let: <a..
280 p
::>
240
~ p
200
160
'~I"\ ''"v
80
40 .....
o o
\ 0
~ '\ 0
\.
\
0
(
20
0
v 0
"-
'" " °0 .......
~ ~ ~ --0 v
0
40 60 80
ACTUAL RUNNING TIME 010
TOTAL TIME OF TEST ' Ie
FIG. 28 COMPARISON OF TEST CYCLES WITH
TIME FOR TESTING
100

al ..J
120,000
80,000
.. 60,000 o 4 o ..J
40,000
20,000
o
-SPECIMEN S - I ~ ::::& -- ..--
FAILED IN SHEAR ::; ~ - -AT I08,90~
. ,...., '/'"' ~
~ r l SPECIMEN S - 2 ,.
~t ~
FAILED IN SHEAR
AT 108,650 LB.
~
~ . 0.02 In --.
f f f
u
g SLIP, IN.
FIG. 29 AVERAGE LOAD-SLIP CURVES FOR SLIP AT
FIRST ROW FASTENERS, STATIC TESTS


![A · Web viewwhich normalized hysteretic energy is used as a relative cumulative damage index to modify structural ductility for a prescribed damage level [6]. On the other hand,](https://img.pdfslide.net/doc/110x75/60e3b6d9a8e9b6731514d985/a-web-view-which-normalized-hysteretic-energy-is-used-as-a-relative-cumulative-damage.jpg)