Embed Size (px)
Citation preview

Cunningham, J. A., Rahman, I. A., Lautenschlager, S., Rayfield, E. J., &Donoghue, P. C. J. (2014). A virtual world of paleontology. Trends inEcology and Evolution, 29(6), 347-357.https://doi.org/10.1016/j.tree.2014.04.004
Publisher's PDF, also known as Version of record
Link to published version (if available):10.1016/j.tree.2014.04.004
Link to publication record in Explore Bristol ResearchPDF-document
University of Bristol - Explore Bristol ResearchGeneral rights
This document is made available in accordance with publisher policies. Please cite only the publishedversion using the reference above. Full terms of use are available: http://www.bristol.ac.uk/pure/user-guides/explore-bristol-research/ebr-terms/

A virtual world of paleontologyJohn A. Cunningham, Imran A. Rahman, Stephan Lautenschlager, Emily J. Rayfield,and Philip C.J. Donoghue
School of Earth Sciences, University of Bristol, Wills Memorial Building, Queen’s Road, Bristol BS8 1RJ, UK
Review
Computer-aided visualization and analysis of fossils hasrevolutionized the study of extinct organisms. Noveltechniques allow fossils to be characterized in threedimensions and in unprecedented detail. This has en-abled paleontologists to gain important insights intotheir anatomy, development, and preservation. Newprotocols allow more objective reconstructions of fossilorganisms, including soft tissues, from incompleteremains. The resulting digital reconstructions can beused in functional analyses, rigorously testing long-standing hypotheses regarding the paleobiology of ex-tinct organisms. These approaches are transforming ourunderstanding of long-studied fossil groups, and of thenarratives of organismal and ecological evolution thathave been built upon them.
A digital revolution in paleontologyPaleontology has a reputation as a dry and dusty disci-pline, stymied by privileged access to fossil specimens thatare interpreted with an eye of faith and used to evidencejust-so stories of adaptive evolution. However, in recentyears the discipline has been revolutionized by the emer-gence of powerful methods for the digital visualization andanalysis of fossil material. This has included improve-ments in both computer technology and its availability,and in tomographic techniques, which have made it possi-ble to image a series of 2D sections or slices through a fossiland to use these to make a 3D reconstruction of thespecimen. As a consequence of applying these techniques,paleontological studies are often at the forefront of ana-tomical research. In fact, some fossil species are now bettercharacterized in terms of their anatomy and developmentthan their living counterparts; for example, the fossilsarcopterygian fish, Eusthenopteron foordi, is among thebest known of all fishes living and dead as a consequence ofthe detailed tomographic studies undertaken by Jarvik[1,2]. Moreover, the functional morphology of fossil organ-isms can now be objectively evaluated through quantita-tive functional analyses that enable definitive tests ofhitherto untestable hypotheses in (paleo)biology. A suffi-cient number of fossil species have now been digitallycharacterized to make it feasible to carry out comparativefunctional analyses and reveal trends in functional
0169-5347/
� 2014 The Authors. Published by Elsevier Ltd. This is an open access article under
the CC BY license (http://creativecommons.org/licenses/by/3.0/). http://dx.doi.org/
10.1016/j.tree.2014.04.004
Corresponding authors: Rayfield, E.J. ([email protected]); Donoghue, P.C.J.([email protected]).Keywords: paleontology; digital visualization; computed tomography; functionalanalysis; computer modeling.
evolution. Furthermore, this proliferation of digital data-sets means that widespread sharing and dissemination of3D data is now possible, providing a potential solution toproblems of access to rare fossil material. Computer-aidedvisualization and analysis is therefore transforming theway that fossils are studied and, in consequence, revealingever-greater insights into the paleobiology of extinctgroups and the evolutionary theories that are based uponthem. Here, we review the methodological advances thathave made this revolution possible and discuss the types ofpaleontological research questions that can now beaddressed through computational approaches.
Extracting fossil data from rocksA major problem that has hampered paleontologists sincethe beginning of the science has been how to extract fossilsfrom their host rock. The conventional approach is tophysically remove the rock from the fossil using either amechanical method, stripping away the enclosing matrixusing tools ranging from needles to dentist’s drills [3], or byexploiting the chemical differences between fossils andtheir host rock, for example, using weak acetic acid toremove limestone (CaCO3) from phosphatic fossils [4].Alternatively, fossil morphology can be recovered by dis-solving the fossil to leave a void in the rock from which acast can be made [5]. There are, however, a number ofpitfalls associated with the isolation of fossils by thesetechniques. For instance, they can damage delicate struc-tures, and the targeted extraction of particular features isnot straightforward. In some instances, exceptionally pre-served soft tissues have been prepared away unwittingly toexpose the bone or shell – yet, in retrospect, the soft tissueswere the most significant fossil remains. Furthermore,these techniques do not allow the study of internal anato-my. A solution to these problems is to take a tomographicapproach, creating a 3D model of the fossil from a series of2D slices. This powerful methodology enables the anatomyof fossils to be characterized in unprecedented detail,unlocking their potential for enhancing our understandingof the history of life.
Characterizing fossils in 3DTomography is not a recent innovation in paleontology. Itsroots can be traced to the early twentieth century, whenthe geological polymath William Sollas began the oneroustask of manually grinding away fossils embedded in rock,stopping at regular intervals to photograph or trace byhand the exposed surfaces (Figure 1A, D; [6]). This processof serial grinding tomography produces 2D slices that are
Trends in Ecology & Evolution, June 2014, Vol. 29, No. 6 347

(E) (F)
(G) (H)
(J)(I)
(A) (C)(B)
(D)
TRENDS in Ecology & Evolution
(See figure legend on the bottom of the next page.)
Review Trends in Ecology & Evolution June 2014, Vol. 29, No. 6
348

Box 1. The Herefordshire Lagersta tte
Serial grinding techniques have been used to great effect in the study
of the fossils from an important Silurian site of exceptional
preservation known as the Herefordshire Lagerstatte [73–75]. The
fossils from this locality are preserved in calcite and can be visually
distinguished from the nodules containing them (Figure IA), but
have a very similar chemical composition to the host rock which
means that they cannot be successfully extracted using physical or
chemical preparation methods. Furthermore, X-ray techniques
(described in the main text) – which rely on internal density
differences – have so far failed to differentiate the fossils from the
matrix. Therefore, serial grinding tomography is currently the only
way the specimens from this important site can be studied in three
dimensions (Figure IB, C). This has provided key insights into the
paleobiology and evolution of a range of extinct invertebrate
taxa that are unique to this site. Although this type of serial
grinding approach works well for most three-dimensionally pre-
served fossils, the fact that it results in the complete destruction of
the specimen means that today it should be seen as a last resort for
studying material, such as the fossils from the Herefordshire
Lagerstatte, that is not amenable to other techniques.
(A) (B) (C)
TRENDS in Ecology & Evolution
Figure I. Fossils from the Herefordshire Lagerstatte. (A, B) The mollusc Kulindroplax
(specimen length 38 mm; [74]); (A) photograph of a ground surface of the fossil; (B)
digital reconstruction produced from serial grinding images. (C) Digital
reconstruction of the fossil horseshoe crab Dibasterium (specimen length 23.2 mm
excluding appendages; [75]).
Review Trends in Ecology & Evolution June 2014, Vol. 29, No. 6
used to create physical models of specimens out of wax,cardboard, or polystyrene, thereby visualizing their struc-ture in 3D (Figure 1B, E, F) [6,7]. This process is extremelytime-consuming. For example, it infamously took theSwedish paleontologist Erik Jarvik some 25 years to pro-duce a 3D wax model of the Devonian fish Eusthenopteronbased on over 500 detailed drawings [2], after which timethe original specimen had been destroyed entirely. Thus,although the serial grinding approach has been appliedwith considerable success [1,2,6–10], the degree of timeand effort required to image a fossil, as well as, critically,the destructive nature of the method, have limited itswidespread adoption. Variants on the approach, for exam-ple, using serial sawing to expose sections [11], acetatepeels to record the exposed surfaces [12,13], or tungstenmicrotomy to produce very thin sections that can be con-served on glass plates [14], enable the retention of someoriginal material, but the process remains incredibly labo-rious. Despite these drawbacks, serial grinding tomogra-phy is still in use today and has been vastly improved bythe integration of digital photography and computer re-construction, allowing the fossil to be studied and dissectedvirtually (Box 1).
Several techniques exist for nondestructively charac-terizing fossils in 3D (summarized in Table 1), but thosethat employ X-rays are by far the most common(Figure 1C, G–J). Indeed, the use of X-rays to study fossilshas an even longer history than serial grinding; withinmonths of their discovery in 1895, paleontologists hadbegun exploiting them to examine difficult-to-preparematerial, such as the pyritized fossils of the Hunsru ckSlate (Figure 1C) [15]. However, it was not until the latetwentieth century that a tomographic approach was
Figure 1. Three-dimensional reconstruction of fossils. (A) The grinding machine used
reconstruction of the early vertebrate Palaeospondylus (specimen length 19 mm). (C) X
diameter 83 mm). (D) Drawings of successive grinding surfaces from the jawless v
reconstruction of Cephalaspis in dorsal (E) and lateral (F) views. (G) Photograph of the
based X-ray slice through Shuyu. (I) Screen capture of Shuyu being digitally reconstru
braincase of Shuyu in dorsal (left) and ventral (right) aspect [101].
combined with X-ray techniques, enabling the use ofX-ray computed tomography (CT) in paleontology (e.g.,[16,17]). This method works by obtaining a series of radio-graphs (projections) of a specimen at multiple angles asthe specimen is penetrated by an X-ray beam. The result-ing projections are then used to computationally generatea series of parallel slices perpendicular to the axis ofrotation, which map X-ray attenuation through the speci-men. The resulting dataset can be visualized and analyzedusing a variety of software packages (summarized inTable 2). X-ray CT provides a nondestructive means ofimaging 3D fossils, which is vital when studying rare orunique material.
Early X-ray tomography studies mainly focused ondigitally characterizing macroscopic fossils that had al-ready been extracted from the host rock [16] (although see[17]). This was largely because distinguishing fossilremains from their host rock was problematic for theCT systems available at the time, which had originallybeen designed for noninvasive medical imaging and thusused low-energy polychromatic X-rays and short exposuretimes to minimize patient radiation dosage. Thus, theycould not readily penetrate dense materials such as rocks.Furthermore, these medical CT scanners were restrictedto relatively low-resolution imaging and thus could notvisualize the fine anatomical details that were preservedin many important fossils, especially microscopic samples.In recent years, however, the utility of X-ray tomographyfor studying fossils has dramatically improved, withpaleontologists taking advantage of the development ofthe high-energy and high-resolution variants micro-CT[18–20] and, less frequently, nano-CT [21] to study a widerange of taxonomic groups and preservation types. These
by Sollas in the first paleontological tomographic studies. (B) Sollas’ wax model
-Ray image of the asteroid Palaeostella solida from the Hunsruck Slate (specimen
ertebrate Cephalaspis by Stensio [7] (specimen length 13 mm). (E, F) Stensio’s
jawless galeaspid vertebrate Shuyu (specimen width 10 mm). (H) A synchrotron-
cted using the software Amira. (J) Digital reconstructions of the right side of the
349

Table 1. Comparison of some common techniques used for 3D characterization in paleontologya
Technique Data collected Destructive? Size of featureb Resolutionc Cost to buy/used Portable?
Serial grinding, slicing and sawing Optical images of exposed
surfaces
Y >1 mm 10 mm ££/£ Y
FIB tomography SEM images, chemical data Y 1 mm to 1 mm 50 nm ££££/£ N
Micro-CT Maps of X-ray attenuation N 1 mm to 250 mm 1 mm ££££/£ N
Nano-CT Maps of X-ray attenuation N 1 mm to 60 mm 200 nm ££££/£ N
Synchrotron-based tomography Maps of X-ray attenuation N 50 mm to 600 mm 200 nm X N
Synchrotron-based
phase contrast tomography
Maps of X-ray phase variations N 50 mm to 600 mm 200 nm X N
Neutron tomography Maps of neutron attenuation N 2 mm to 300 mm 30 mm X N
Magnetic resonance
imaging (MRI)
Distribution of light elements N <1 m 10 mm ££££/£ N
Laser scanning Surface color and morphology N >10 mm 50 mm ££/£ Y
Photogrammetry Surface color and morphology N Anye N/Ae £/£ Y
Serial focus light microscopy Optical images at successive
planes
N 100 mm to 10 mm 200 nm ££/£ Y
Confocal laser scanning
microscopy
Optical/fluorescence images at
successive planes
N 10 mm to 250 mm 800 nm £££/£ N
aFor a comprehensive comparison of available techniques, see [76].
bThe size range of the features that can be imaged with a technique; note, however, that for some techniques it may not be practical to obtain the highest resolution for the
largest specimens.
cThe maximum resolution achievable on commonly used equipment; for techniques, such as serial grinding, the distance between slices is given, although the resolution
within a single slice will be higher.
dCost of buying or manufacturing equipment/the cost per specimen of using third party equipment: £ = 10 s to 100 s of GB pounds; ££ = 100 s to 1000 s of GB pounds;
£££ = 1000 s to 10 000 s of GB pounds; ££££ = 10 000 s to 100 000 s of GB pounds; X = time awarded competitively at no cost to the user.
eAlthough there is no theoretical limit to the object size scaling in photogrammetry, for practical reasons the minimum size is in the millimeter range.
Review Trends in Ecology & Evolution June 2014, Vol. 29, No. 6
methods have made it possible to remove fossil specimensfrom their host rock entirely digitally (Box 2) and also toexamine internal anatomy in great detail. Micro-CT hasseen particularly broad usage because the technology iscapable of achieving resolutions of a few microns or lessand is applicable to a range of sizes and compositions;
Table 2. Common software packages used in digital analyses of f
Software package
CT data processing/image segmentation
Amira (www.amira.com)
Avizo (www.vsg3d.com)
Drishti (http://anusf.anu.edu.au/Vizlab/drishti)
Mimics (www.materialise.com/mimics)
SPIERS (www.spiers-software.org)
VG Studio Max (www.volumegraphics.com)
Visualization and animation
Autodesk Maya (http://usa.autodesk.com/maya)
Blender (www.blender.org)
3D meshing/conversion of formats
GeoMagic Studio (www.geomagic.com)
Altair Hypermesh (www.altairhyperworks.com)
MeshLab (meshlab.sourceforge.net)
ScanFE (http://www.simpleware.co.uk/)
Finite element analysis
Abaqus FEA (www.simulia.com)
ANSYS (www.ansys.com)
COMSOL Multiphysics (http://www.uk.comsol.com/)
Strand7 (www.strand7.com)
Computational fluid dynamics
ANSYS (www.ansys.com)
COMSOL Multiphysics (http://www.uk.comsol.com/)
SC/Tetra (http://www.cradle-cfd.com/)
SPHYSICS (https://wiki.manchester.ac.uk/sphysics/)
350
consequently, it is rapidly becoming a standard item oflaboratory equipment at research institutions worldwide[22]. Nevertheless, the techniques typically have difficultyimaging chemically homogeneous samples that do notshow substantial X-ray attenuation contrast, such ascalcite fossils preserved in calcareous sediments (Box 1).
ossils
Source Example
Commercial Donoghue et al. [23]
Commercial Lautenschlager [77]
Freely available Jones et al. [78]
Commercial Domınguez Alonso et al. [39]
Freely available Sutton et al. [66]
Commercial Butler et al. [79]
Commercial Molnar et al. [80]
Freely available Stein [81]
Commercial Arbour and Currie [82]
Commercial Lautenschlager et al. [83]
Freely available White et al. [84]
Commercial Young et al. [85]
Commercial Lautenschlager et al. [83]
Commercial Witzel and Preuschoft [86]
Commercial Snively and Cox [87]
Commercial Walmsley et al. [88]
Commercial Rigby and Tabor [53]
Commercial Caromel et al. [89]
Commercial Shiino et al. [54]
Freely available Rahman and Falkingham [52]

Review Trends in Ecology & Evolution June 2014, Vol. 29, No. 6
Perhaps the most powerful of all X-ray tomographicmethods is synchrotron-radiation tomography, where acyclic particle accelerator is used to generate extremelybright X-rays. Synchrotron-radiation tomography hasbecome increasingly popular in paleontology in recentyears [23,24], partly because it is capable of rapidlyscanning specimens at exceptionally high resolutions –surpassing those of micro-CT – but also due to theadvantages provided by the monochromatic source. Cur-rent laboratory-based systems, including micro-CT, in-variably employ polychromatic X-ray sources that emit abroad spectrum of X-ray energies, which can lead toscanning artifacts that can complicate the interpretationof fossil structures. By contrast, synchrotron sources emitonly X-rays of a single energy (i.e., they are monochro-matic), which enables better quality imaging with highercontrast and fewer artifacts compared to polychromaticsources. Furthermore, synchrotron-based phase-contrastimaging can improve the sensitivity with which mineralsof similar densities can be resolved. This methodologyexploits X-ray refraction at material boundaries, ratherthan conventional X-ray attenuation, in order to enhancethe contrast between materials. In this way, difficultspecimens that would not normally be amenable to X-ray tomography (i.e., those with low attenuation con-trast) can be studied nondestructively in 3D at highresolution [25,26]. At present, the availability of thesecutting-edge techniques is limited by the small number ofthese international facilities. However, this seems set tochange in the near future as the technology now exists forlaboratory-based monochromatic sources [27] and phase-contrast imaging [28,29]. Ultimately, these develop-ments should mean that imaging only previously possibleat synchrotron facilities will become routine in paleon-tology laboratories.
For some fossils, the resolutions that can be attainedusing X-ray tomography, even with a synchrotron, areinsufficient to fully resolve the preserved details. In suchcases, an alternative method can be applied: focused ionbeam (FIB) tomography, which is capable of the highestresolution of any modern tomographic technique. FIBtomography entails in situ sequential milling and imagingof very small regions of interest; to date, it has been usedonly rarely in paleontology to characterize microscopicsurfaces of very small fossils in 3D [30]. The method worksin a similar way to traditional serial grinding, with succes-sive faces physically exposed by a highly focused ion beam.The exposed faces are then imaged, frequently using ascanning electron microscope (SEM) coupled to the FIBinstrument, and the resulting slice images are digitallyaligned and reconstructed to produce a 3D model. Theresolution that can be achieved is astonishing; the use ofcontrolled ion milling means that slices can be less than50 nm apart, and the spatial resolution within a singleSEM slice provides nano-scale morphological information[30,31]. Thus, although destructive and time-consuming,FIB tomography has enormous potential for the study oftiny microfossils and very fine features (e.g., microstruc-ture and histology) of larger fossils, resolving anatomicaldetails that could not be studied with any other 3D imagingmethod.
A handful of other tomographic methods have seenoccasional use in paleontology. Neutron tomography issimilar to X-ray CT, but relies on the differential absorp-tion of neutrons (instead of X-rays) to image the interior ofa specimen. Because neutrons are strongly attenuated bycertain light elements (e.g., hydrogen) and readily pene-trate many heavy elements (e.g., lead), this technique issuitable for large fossils in dense, metal-rich rocks andorganically preserved specimens; however, the resolutionsachieved are inferior to X-ray CT and, moreover, neutronbombardment can induce potentially hazardous levels ofradioactivity in samples [32]. Magnetic resonance imaging(MRI) uses a strong magnetic field to map the distributionof certain elements (usually hydrogen) in a sample. It cantherefore be used to image fossils with high hydrogencontent (i.e., those with residual water, such as mummifiedspecimens), but typically requires long scan times andgenerates relatively low-resolution images; it is bettersuited to imaging soft tissues in biological specimens[33]. Finally, optical tomography works by illuminatinga light-transmitting sample in order to obtain images ofsuccessive planes through it. This can be achieved throughserial focusing, where a conventional light microscope or aconfocal laser-scanning microscope is used for imaging[34]. The approach is amenable to small specimens in atranslucent matrix (e.g., fossils in chert or amber), but isnot effective for opaque samples. All three of these methodsare nondestructive, but are restricted to specific preserva-tion types and/or require access to specialist equipment/facilities. These restrictions will most probably limit theiruptake in paleontology.
In many cases, access to the interior of the fossil is not arequirement to paleontological study, for example, if onlyexternal surface features are of interest. Here, alternativenondestructive 3D imaging approaches can be employedsuch as surface scanning techniques that collect spatialand geometric data from a 3D surface at distance. Theseapproaches have the advantage that the equipment is oftencheap, portable, and easy to use (Table 1), which makessurface scanning suitable for characterizing fossils in fieldconditions (e.g., trace fossils; [35]), as well as for analyzinglarge museum specimens that cannot be moved (e.g., com-plete articulated vertebrate skeletons; [36,37]) and thusare not suitable for study with any tomographic technique.Laser scanning is the most common surface-based methodcurrently employed in paleontology and uses laser light toactively image the surface of interest. Photogrammetrypassively reconstructs the geometric properties of an objectfrom a series of overlapping photographs (or SEM images)taken at different orientations, providing informationabout the shape and color of the sample. Given thatphotogrammetry can, in principle, even be performed usinga smartphone at resolutions comparable to standard laserscanning, this highly accessible technique has the poten-tial for widespread adoption [37].
Digitally reconstructing paleobiologyAlmost all the traditional problems associated with recov-ering fossil data from rocks can be overcome with modern3D imaging. By making use of the full range of 3D imagingtechniques now available to paleontologists, it is possible to
351

Box 2. Digital restoration and reconstruction
Fossils, by their very nature, are typically incomplete and/or distorted
as a result of taphonomic processes, excavation, subsequent
preparation, and handling. This can present a serious problem for
the computational analysis of fossils, as many morphological and
functional analyses require or rely on the original form, which might
not be preserved. Thus, the outcome of such studies is closely
correlated with the true-to-life correctness of the models used, and
distorted or fragmentary specimens would inevitably yield incorrect
results and lead to possibly erroneous conclusions [90]. Conse-
quently, it is essential that the original pre-fossilization morphology is
restored, before the shape or function can be rigorously analyzed. The
restoration of fossil material, particularly of hominid crania, is
standing practice in archeology and paleoanthropology. However, it
is only recently that computational methods and digital models have
replaced physical restoration techniques using photographs, draw-
ings, and plaster models [91,92]. Moreover, 3D restorations have only
rarely been performed in paleontology [85,93–95].
Digital reconstruction and restoration techniques offer a variety of
approaches to restore fossil morphology, ranging from the compar-
ably simple removal of small breaks [96] and the replacement of
missing elements or regions [80,97], to the realignment of disarticu-
lated components [92] and the retrodeformation of whole fossils
[82,98,99]. By employing a combination of these reconstructive steps,
Lautenschlager [77] used CT scans of the original specimen (Figure IA,
B) to restore the cranial skeleton of the Cretaceous therizinosaur
dinosaur Erlikosaurus andrewsi (Figure IC). The restored digital model
was then subsequently used as a basis to reconstruct relevant soft
tissue structures, such as the jaw adductor musculature (Figure ID)
and a keratinous rhamphotheca covering the beak-like jaws. This
combined reconstruction of hard and soft tissue ultimately permitted
the investigation of feeding function in this herbivorous theropod
dinosaur using FEA [77] (Figure IE, Figure 2).
Digital reconstruction and restoration techniques provide powerful
tools for the removal of taphonomic and preservational artifacts and
hold an unprecedented potential to restore the antemortem state of a
fossil. However, it is important to keep in mind that each reconstruction
step increases the degree of interpretation introduced into the restored
fossil, in particular if performed (often out of necessity) manually.
Attempts to avoid this have been made by applying mathematically
defined and repeatable techniques, in particular geometric
morphometrics, and by automating the reconstruction methods. This
makes it possible to create a distribution of reconstructions, for which the
statistical significance, and thus the reliability, of a single reconstruction
can be subjected to evaluation and discussion [91,92,100].
(A)
(B)
(C)
(D)
(E)
TRENDS in Ecology & Evolution
Figure I. Individual steps in the digital restoration and reconstruction process
exemplified by a model of the skull of Erlikosaurus andrewsi. (A) Original fossil
(lower jaws omitted due to disarticulation). (B) Digital representation of the
fossil. (C) Restored cranial anatomy. (D) Restored skull with reconstructed jaw
adductor muscles. (E) Final finite element model based on (C) and (D). Skull
length is 260 mm.
Review Trends in Ecology & Evolution June 2014, Vol. 29, No. 6
obtain astonishingly high-resolution characterizations offossils that can even exceed the limits of preservation. As aresult, a broad range of previously intractable paleobiolog-ical questions can now be addressed. Tomographic techni-ques can be used to characterize the internal anatomy ofthree-dimensionally preserved fossils at nanometer andmicrometer scale resolutions [22,23,30], allowing the studyof structures that would previously have been impossible tovisualize and providing additional characters for compar-isons with modern species and phylogenetic analyses [38].In some cases, characterizing fossils in 3D enables infer-ences about their behavior to be made. For example,virtual endocasts of vertebrate braincases have been usedto infer sensory and locomotory capabilities in extinct taxa[39–42].
These approaches can also be used to study the devel-opment of fossil organisms. In many taxa, from protiststo problematic invertebrates and even vertebrates, thepattern of development is routinely preserved by thegrowth lines within the mineralized skeleton of the adult.CT can, therefore, be used to reconstruct the develop-ment of these organisms, by extracting the juvenilemorphologies preserved within the skeletons of theiradult selves [43–45].
352
Furthermore, 3D data are invaluable for understandingthe processes of fossilization. Paleontologists attempting tointerpret exceptionally preserved organisms are perpetuallyconfounded by the fact that such fossils have invariably beensubjected to decay and are often overprinted by later phases ofgeological mineralization unrelated to the biology of theorganism. Thus, it can be devilishly difficult to discriminatebiology from geology, misleading researchers to overinterpretthe extent of the biology preserved [46]. Fortunately, 3Dimaging can help to tease out the original biological structurefrom these geological artifacts [31,47]. Tomographicapproaches can even be used to better understand the proba-ble impact of decay on modern organisms [48], as well as toestablish chemical or textural criteria that can distinguishbetween these phases of mineralization [47,49].
Finally, 3D imaging of fossils can provide the basis fordigitally reconstructing fossil organisms with greater ob-jectivity than was previously possible from the incompletedata that paleontologists are usually obliged to work with.Digital reconstruction, which involves digital restorationand retrodeformation of skeletal data and more objectivereconstruction of soft tissue anatomy, has overhauledand revitalized studies of comparative musculoskeletalanatomy (Box 2).

Review Trends in Ecology & Evolution June 2014, Vol. 29, No. 6
Functional analysis of fossil organismsPaleontologists have always had a fascination with howancient organisms fed and moved, and what particularaspects of their anatomy were used for. Until recently,however, it was often difficult to study the function ofextinct organisms in a way that allowed specific hypothe-ses to be tested. As a result, endeavors in this field havefrequently been renounced as unscientific just-so storiesthat are no more rigorous than Kipling’s explanation forhow the elephant acquired its trunk. However, tomograph-ic approaches have provided a basis for formulating andexacting hitherto intractable tests, enhancing scientificrigor in the functional analysis of fossil organisms [50].
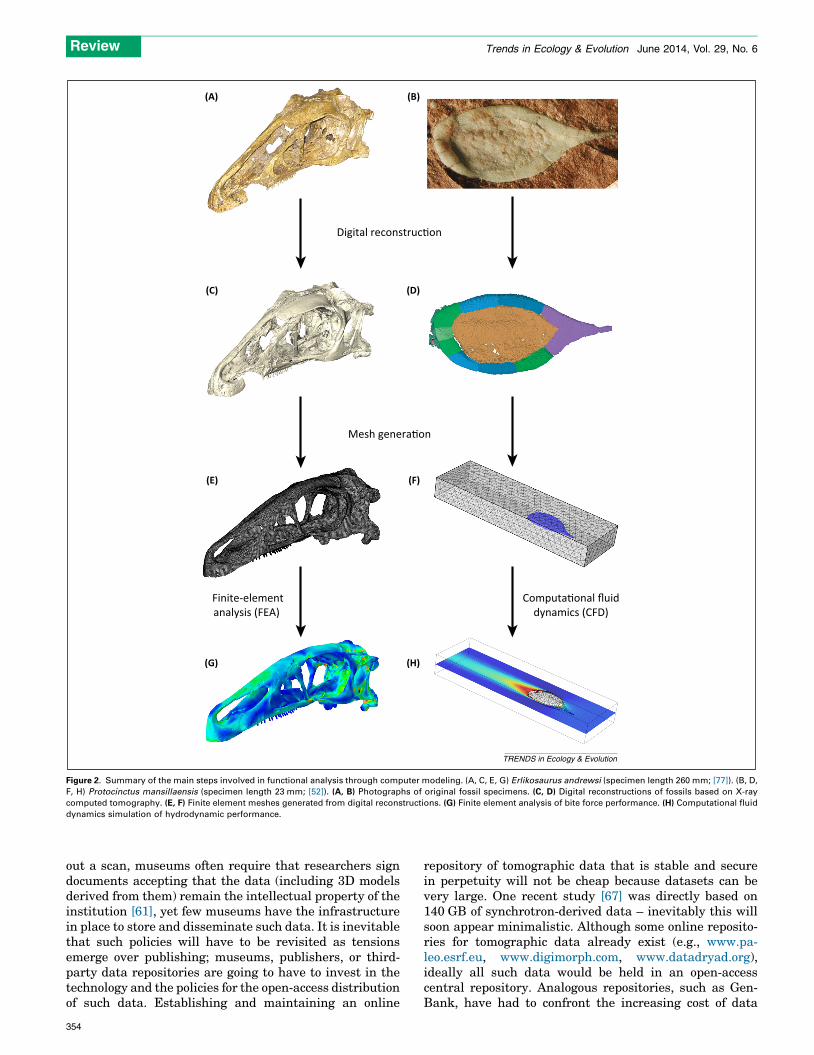
Functional analysis through computer modeling hasdeveloped in-hand with tomographic methods, not leastbecause these analytical techniques depend on the avail-ability of accurate 3D digital reconstructions. One suchmethod is finite element analysis (FEA), an engineeringapproach that has been used in paleontology to help un-derstand feeding and locomotion in fossil taxa. This ap-proach can reconstruct stress, strain, and deformation indigital structures, including models of fossils [51]. This isachieved by converting the digital model into a finiteelement mesh, which divides the geometry of the objectinto numerous simple and discrete elements that areassigned life-like physical properties. When the virtualmodel is constrained and stressed in a manner compatiblewith known or hypothetical biomechanical performance,implied stress and strain can be computationally calculat-ed, and validated using data not included in the model (e.g.,detailed histology, microwear, in vivo or ex vivo experimen-tally recorded strain) ([51]; Figure 2). Computational fluiddynamics (CFD) is a technique adopted from engineeringthat can be used to test various hypotheses relating to theperformance of extinct organisms in aerial or aquaticenvironments [52–54] (Figure 2). The quantification ofmorphology also enables the quantification of the motionthat extinct organisms would have been capable of; forexample, by studying the range of motion in joints [55], orby using multibody dynamics analysis (MDA), which mod-els the motion and dynamic behavior of interconnectedbodies such as muscles and bones [56,57].
It is vital that the models used in all types of functionalanalyses are validated to assess their match to empiricaldata. This allows researchers to quantify how far estimat-ed values may deviate from measured data before themodel is applied to extinct organisms [58]. The data usedto validate the model are usually derived from measure-ments taken from related living taxa [59]. However, an-other possible approach is to create a physical model of thespecimen, which can now be easily produced from thedigital dataset using 3D printing technology. The physicalmodel can be loaded (for validating computational stress/strain analyses) or placed in a flume tank or wind tunnel(for validating models of fluid flow [53]), and the resultscompared to those of the digital analysis. Experimentalloading of printed models has been applied to both real andhypothetical morphologies [60], and in the future it willprobably be possible to print models with more life-likematerial properties. Sensitivity analysis is also importantto determine the relation between the results and the input
parameters, and to identify which of the parameters havethe greatest influence on the output (and are thereforemost important to quantify precisely) [58]. This is typicallyachieved by varying one input parameter at a time andevaluating the change in output. This type of careful use oftechniques such as FEA, CFD, and MDA has enabled thereplacement of studies rooted in anecdote, analogy, orscenarios, leading to scientific approaches where the rela-tive ease of manipulation of digital data permits functionalanalysis within a hypothesis testing framework.
A virtual futureDigital datasets have been touted as a panacea for theproblems of limited access to fossil specimens. In principle,they can be shared online to make them available to theentire community, providing paleontology with the open-ness enjoyed by other biological sciences. In reality, how-ever, such global dissemination has rarely been realized[61,62]. One reason for this is the unwillingness of someresearchers to share their datasets until they have com-pleted additional analyses. There would presumably beunanimous agreement that researchers must shareenough data that other workers can verify the findingsof a paper [63]. In the case of a paper describing newanatomical features based on tomographic data, this couldbe achieved by providing a down-sampled movie thatshows each slice of a CT dataset in succession. There isless consensus regarding whether the data required toreproduce the study, including full-resolution slice dataand segmentation files, should be released and, if so, howand when this should be done. Although some have arguedfor an embargo period to allow researchers to exploit thefull potential of their data before sharing it [64], it is ourcontention (along with others [65]) that making theseavailable at the time of publication should be mandatory.This should include both the primary tomographic data (toallow validation of the model) and any digital models (toenable repeatability of other analyses), presented in awidely used format [66]. However, the plethora of different(and often proprietary) file formats makes this more diffi-cult to achieve in practice, and a standard file format hasnot yet been agreed upon. This will probably be dictated bythe requirement for broad usage. A format such as STL(stereolithography), which describes a triangulated surfacewithin a 3D Cartesian coordinate system and can beimported into a number of packages, including those asso-ciated with 3D printing, seems appropriate. Indeed, withthe dramatic fall in the cost of 3D printers, such as theMakerBot models (New York, NY, USA), we now commonlyreceive requests from educators for the STL files associatedwith our published digital models so that they can printthem for use in teaching. Although sharing the final digitalmodels provides a considerable degree of transparency, forfull traceability and reproducibility, further data, such assegmented labels and model parameters, should be includ-ed.
However, even when researchers are keen to share theirdata online, this is not always possible, forcing researchers(ourselves included) to make data available only by re-quest. Firstly, there are legal issues regarding the owner-ship of the scan data. Before granting permission to carry
353
Digital reconstruc�on
Mesh genera�on
Finite-elementanalysis (FEA)
Computa�onal fluiddynamics (CFD)
(A) (B)
(C) (D)
(E) (F)
(G) (H)
TRENDS in Ecology & Evolution
Figure 2. Summary of the main steps involved in functional analysis through computer modeling. (A, C, E, G) Erlikosaurus andrewsi (specimen length 260 mm; [77]). (B, D,
F, H) Protocinctus mansillaensis (specimen length 23 mm; [52]). (A, B) Photographs of original fossil specimens. (C, D) Digital reconstructions of fossils based on X-ray
computed tomography. (E, F) Finite element meshes generated from digital reconstructions. (G) Finite element analysis of bite force performance. (H) Computational fluid
dynamics simulation of hydrodynamic performance.
Review Trends in Ecology & Evolution June 2014, Vol. 29, No. 6
out a scan, museums often require that researchers signdocuments accepting that the data (including 3D modelsderived from them) remain the intellectual property of theinstitution [61], yet few museums have the infrastructurein place to store and disseminate such data. It is inevitablethat such policies will have to be revisited as tensionsemerge over publishing; museums, publishers, or third-party data repositories are going to have to invest in thetechnology and the policies for the open-access distributionof such data. Establishing and maintaining an online
354
repository of tomographic data that is stable and securein perpetuity will not be cheap because datasets can bevery large. One recent study [67] was directly based on140 GB of synchrotron-derived data – inevitably this willsoon appear minimalistic. Although some online reposito-ries for tomographic data already exist (e.g., www.pa-leo.esrf.eu, www.digimorph.com, www.datadryad.org),ideally all such data would be held in an open-accesscentral repository. Analogous repositories, such as Gen-Bank, have had to confront the increasing cost of data

Review Trends in Ecology & Evolution June 2014, Vol. 29, No. 6
storage, both in terms of hardware and maintenance; it nolonger accepts sequencing trace archives because it is nowcheaper to resequence than store the data. It is verypossible that, as CT hardware becomes more common-place, this might be a preferred solution. Although weadvocate the establishment of a central data repository,we suggest that it could make use of much cheaper, morestable, and greener technology in the form of automatedtape archives. After all, it is our experience that individualhigh-resolution digital datasets are rarely reused. Thismay change with the potential discovery of instances ofscientific fraud in the translation of tomographic datasetsto virtual models, but it is unlikely that a single dataset isgoing to be required recurrently by concurrent users.Hence, demand for real-time access that can only be facili-tated by disk or chip storage, which is both expensive topurchase and maintain, should be low. It is vital that thesechallenges are met if the promise of global sharing ofdigital fossil specimens among paleontologists is to berealized. There would also be wider benefits as digitalmodels are a valuable tool in public engagement withscience and teaching [68] because they allow rare fossils,including the very small and the very large and even thosestill embedded in rock [69], to be viewed in a dynamic andinteractive way as well as to be printed out as physicalmodels.
Most of the techniques we have discussed are currentlybeing used to assess anatomy and functional morphology inindividual taxa or in simplified digital datasets. However,as scanning becomes more commonplace, and as access todata improves and digital data-sharing grows, larger-scalemulti-taxon studies will become increasingly feasible[70,71]. The potential for assembling large quantities ofcomparative data means that the opportunity to assessbroad-scale hypotheses pertaining to character evolutionand the evolution of function and performance is nowwithin reach. Future work, therefore, hinges on the assem-bly and maintenance of comparative databases.
In the future, the falling costs and increasing availabilityof CT scanners will mean that more paleontologists willhave access to these techniques so that they can be used toaddress a wider range of questions for a variety of taxonomicgroups. Future analyses are likely to become increasinglysophisticated, for example, allowing simultaneous physical,chemical, and textural analyses, allowing all these featuresto be studied and compared in three dimensions. Improve-ments in scanning and data processing techniques are likelyto make it possible to obtain 3D characterizations of flat-tened fossils, such as those from the Hunsru ck Slate, whichwere the subject of the first X-ray studies in paleontology[15]. The resolution that can be achieved is continuing toimprove [72] and the time required for scanning is expectedto keep decreasing. These advances will allow much more ofevolutionary history to be read from the fossil record, andwith ever-greater fidelity.
As a result of such ongoing advances, the characteriza-tion and analysis of fossil remains is now much moreobjective and reproducible than ever before. Some mayargue that, given what came before, such advance wasinevitable. However, the foremost limitations on readingthe fossil record now lie principally, and somewhat
ironically, with the poor state of knowledge of the anatomyof the living biota.
AcknowledgmentsWe thank Mark Sutton (Imperial College London) for providing theimages in Box 1, Gai Zhi-kun (IVPP, Beijing) and Eliza Howlett and DaraLohnes (both Oxford University Museum of Natural History) forproviding access to and photographing the specimens in Figure 1A, B.Three anonymous reviewers are thanked for constructive comments onthe manuscript. J.A.C. was funded by a Natural Environment ResearchCouncil (NERC) fellowship (NE/J018325/1). I.A.R. was funded by an 1851Royal Commission Research Fellowship. E.J.R and S.L. acknowledgeNERC support via NE/K01496X/1 and P.C.J.D. via NE/J012610/1.
References1 Jarvik, E. (1944) On the Dermal Bones. Sensory Canals and Pitlines of
the Skull in Eusthenopteron foordi Whiteaves, with some Remarks onE. sa ve-soderberghi Jarvik, Almqvist and Wiksell
2 Jarvik, E. (1954) On the Visceral Skeleton in Eusthenopteron with aDiscussion of the Parasphenoid and Palatoquadrate in Fishes,Almqvist and Wiksell
3 Leiggi, P. and May, P. (1994) In Vertebrate PalaeontologicalTechniques (Vol. 1), Cambridge University Press
4 Jeppsson, L. et al. (1999) The optimal acetate buffered acetic acidtechnique for extracting phosphatic fossils. J. Paleontol. 73, 964–972
5 Long, J.A. et al. (2009) Devonian arthrodire embryos and the origin ofinternal fertilization in vertebrates. Nature 457, 1124–1127
6 Sollas, W.J. (1904) A method for the investigation of fossils by serialsections. Philos. Trans. R. Soc. Lond. B: Biol. Sci. 196, 257–263
7 Stensio, E.A. (1927) The Downtonian and Devonian vertebrates ofSpitsbergen. Part I. Family Cephalaspidae. Skrifter SvalbardNordishavet 12, 1–391
8 Muir-Wood, H.M. (1934) On the internal structure of some MesozoicBrachiopoda. Philos. Trans. R. Soc. Lond. B: Biol. Sci. 223, 511–567
9 Jefferies, R.P.S. and Lewis, D.N. (1978) English Silurian fossilPlacocystites forbesianus and ancestry of vertebrates. Philos. Trans.R. Soc. Lond. B: Biol. Sci. 282, 205–323
10 Janvier, P. (1995) The brachial articulation and pectoral fin inantiarchs (Placodermi). Bull. Mus. Natl. d’Hist. Nat. 4e Ser. 17,143–162
11 Kermack, D.M. (1970) True serial-sectioning of fossil material. Biol. J.Linn. Soc. 2, 47–53
12 Walton, J. (1928) A method of preparing sections of fossil plantscontained in coal balls or in other types of petrifaction. Nature 122,571
13 Galtier, J. and Phillips, T. (1999) The acetate peel technique. In FossilPlants and Spores (Jones, T.P. and Rowe, N.P., eds), pp. 67–70, TheGeological Society
14 Poplin, C. and de Ricqles, A. (1970) Technique for serial sectioning forthe study of undecalcified fossils. Curator 13, 7–20
15 Branco, W. (1906) Die Anwendung der Rontgenstrahlen in derPala ontologie. Abhandlungen der Koniglich Preussischen Akademieder Wissenschaften, Verlag der Koniglichen Akademie derWissenschaften
16 Wind, J. (1984) Computerized X-ray tomography of fossil hominidskulls. Am. J. Phys. Anthropol. 63, 265–282
17 Conroy, G.C. and Vannier, M.W. (1984) Noninvasive three-dimensional computer imaging of matrix-filled fossil skulls by high-resolution computed-tomography. Science 226, 456–458
18 Rowe, T. (1996) Coevolution of the mammalian middle ear andneocortex. Science 273, 651–654
19 Zamora, S. et al. (2012) Plated Cambrian bilaterians reveal theearliest stages of echinoderm evolution. PLoS ONE 7, e38296
20 Hagadorn, J.W. et al. (2006) Cellular and subcellular structure ofNeoproterozoic animal embryos. Science 314, 291–294
21 Collinson, M.E. et al. (2010) Did a single species of Eocene Azollaspread from the Arctic Basin to the southern North Sea? Rev.Palaeobot. Palynol. 159, 152–165
22 Abel, R.L. et al. (2012) A palaeobiologist’s guide to ‘virtual’ micro-CTpreparation. Palaeontol. Electron. 15, 6T
23 Donoghue, P.C.J. et al. (2006) Synchrotron X-ray tomographicmicroscopy of fossil embryos. Nature 442, 680–683
355

Review Trends in Ecology & Evolution June 2014, Vol. 29, No. 6
24 Tafforeau, P. et al. (2006) Applications of X-ray synchrotronmicrotomography for non-destructive 3D studies of paleontologicalspecimens. Appl. Phys. A 83, 195–202
25 Friis, E.M. et al. (2007) Phase-contrast X-ray microtomographylinks Cretaceous seeds with Gnetales and Bennettitales. Nature450, 549–552
26 Tafforeau, P. and Smith, T.A. (2008) Nondestructive imaging ofhominoid dental microstructure using phase contrast X-raysynchrotron microtomography. J. Hum. Evol. 54, 272–278
27 Achterhold, K. et al. (2013) Monochromatic computed tomographywith a compact laser-driven X-ray source. Sci. Rep. 3, 1313
28 Muehleman, C. et al. (2010) In-laboratory diffraction-enhanced X-rayimaging for articular cartilage. Clin. Anat. 23, 530–538
29 Wilkins, S.W. et al. (1996) Phase-contrast imaging usingpolychromatic hard X-rays. Nature 384, 335–338
30 Schiffbauer, J.D. and Xiao, S. (2011) Paleobiological applications offocused ion beam electron microscopy (FIB-EM): an ultrastructuralapproach to the (micro)fossil record. In Quantifying the Evolution ofEarly Life: Numerical Approaches to the Evaluation of Fossils andAncient Ecosystems (Laflamme, M. et al., eds), pp. 321–354,Springer
31 Wacey, D. et al. (2012) Taphonomy of very ancient microfossils fromthe �3400 Ma Strelley Pool Formation and �1900 Ma GunflintFormation: new insights using a focused ion beam. Precamb. Res.220, 234–250
32 Winkler, B. (2006) Applications of neutron radiography and neutrontomography. Rev. Miner. Geochem. 63, 459–471
33 Ziegler, A. et al. (2011) Application of magnetic resonance imaging inzoology. Zoomorphology 130, 227–254
34 Schopf, J.W. and Kudryavtsev, A.B. (2011) Confocal laser scanningmicroscopy and Raman (and fluorescence) spectroscopic imagery ofpermineralized Cambrian and Neoproterozoic fossils. In Quantifyingthe Evolution of Early Life: Numerical Approaches to the Evaluation ofFossils and Ancient Ecosystems (Laflamme, M. et al., eds), pp. 241–270, Springer
35 Bates, K.T. et al. (2008) Three-dimensional modelling and analysis ofdinosaur trackways. Palaeontology 51, 999–1010
36 Bates, K.T. et al. (2009) Estimating mass properties of dinosaursusing laser imaging and 3D computer modelling. PLoS ONE 4, e4532
37 Falkingham, P.L. (2012) Acquisition of high resolution three-dimensional models using free, open-source, photogrammetricsoftware. Palaeontol. Electron. 15, 1T
38 Gauthier, J.A. et al. (2012) Assembling the squamate tree of life:perspectives from the phenotype and the fossil record. Bull. PeabodyMus. Nat. Hist. 53, 3–308
39 Domınguez Alonso, P. et al. (2004) The avian nature of the brain andinner ear of Archaeopteryx. Nature 430, 666–669
40 Lautenschlager, S. et al. (2012) The endocranial anatomy ofTherizinosauria and its implications for sensory and cognitivefunction. PLoS ONE 7, e52289
41 Witmer, L.M. et al. (2003) Neuroanatomy of flying reptiles andimplications for flight, posture and behaviour. Nature 425, 950–953
42 Zelenitsky, D.K. et al. (2009) Olfactory acuity in theropods:palaeobiological and evolutionary implications. Proc. R. Soc. Lond.B: Biol. Sci. 276, 667–673
43 Ru cklin, M. et al. (2012) Development of teeth and jaws in the earliestjawed vertebrates. Nature 491, 748–751
44 Murdock, D.J.E. et al. (2012) Ontogeny and microstructure of theenigmatic Cambrian tommotiid Sunnaginia Missarzhevsky, 1969.Palaeontology 55, 661–676
45 Schmidt, D.N. et al. (2012) Linking evolution and development:synchrotron radiation X-ray tomographic microscopy of plankticforaminifers. Palaeontology 56, 741–749
46 Donoghue, P.C.J. and Purnell, M.A. (2009) Distinguishing heat fromlight in debate over controversial fossils. Bioessays 31, 178–189
47 Cunningham, J.A. et al. (2012) Distinguishing geology from biology inthe Ediacaran Doushantuo biota relaxes constraints on the timingof the origins of bilaterians. Proc. R. Soc. Lond. B: Biol. Sci. 1737,2369–2376
48 Smith, S.Y. et al. (2009) Virtual taphonomy using synchrotrontomographic microscopy reveals cryptic features and internalstructure of modern and fossil plants. Proc. Natl. Acad. Sci. U.S.A.106, 12013–12018
356
49 Bengtson, S. et al. (2012) A merciful death for the ‘‘earliest bilaterian,’’Vernanimalcula. Evol. Dev. 14, 421–427
50 Hautier, L. et al. (2010) Skeletal development in sloths and theevolution of mammalian vertebral patterning. Proc. Natl. Acad.Sci. U.S.A. 107, 18903–18908
51 Rayfield, E.J. (2007) Finite element analysis and understanding thebiomechanics and evolution of living and fossil organisms. Annu. Rev.Earth Plant. Sci. 35, 541–576
52 Rahman, I. and Falkingham, P. (2012) Computational fluid dynamics:a powerful tool for elucidating function in fossil taxa. Geol. Soc. Am.Progr. Abstr. 44, 372
53 Rigby, S. and Tabor, G. (2006) The use of computational fluiddynamics in reconstructing the hydrodynamic properties ofgraptolites. GFF 128, 189–194
54 Shiino, Y. et al. (2012) Swimming capability of the remopleurididtrilobite Hypodicranotus striatus: hydrodynamic functions of theexoskeleton and the long, forked hypostome. J. Theor. Biol. 300, 29–38
55 Pierce, S.E. et al. (2012) Three-dimensional limb joint mobility in theearly tetrapod Ichthyostega. Nature 486, 523–526
56 O’Higgins, P. et al. (2011) Combining geometric morphometrics andfunctional simulation: an emerging toolkit for virtual functionalanalyses. J. Anat. 218, 3–15
57 Bates, K.T. and Falkingham, P.L. (2012) Estimating maximum biteperformance in Tyrannosaurus rex using multi-body dynamics. Biol.Lett. 8, 660–664
58 Hutchinson, J.R. (2012) On the inference of function from structureusing biomechanical modelling and simulation of extinct organisms.Biol. Lett. 8, 115–118
59 Bright, J.A. and Rayfield, E.J. (2011) Sensitivity and ex vivovalidation of finite element models of the domestic pig cranium. J.Anat. 219, 456–471
60 Crofts, S.B. and Summers, A.P. (2014) How to best smash a snail: theeffect of tooth shape on crushing load. J. R. Soc. Interface 11, 20131053
61 Hublin, J.J. (2013) Free digital scans of human fossils. Nature 497, 18362 Rowe, T. and Frank, L.R. (2011) The disappearing third dimension.
Science 331, 712–71463 Hanson, B. et al. (2011) Making data maximally available. Science
331, 64964 Portugal, S. and Pierce, S. (2014) Who’s looking at your data? Sci.
Careers http://dx.doi.org/10.1126/science.caredit.a140005265 Ziegler, A. et al. (2010) Opportunities and challenges for digital
morphology. Biol. Direct 5, 4566 Sutton, M.D. et al. (2012) SPIERS and VAXML; a software toolkit for
tomographic visualisation and a format for virtual specimeninterchange. Palaeontol. Electron. 15, 5T
67 Huldtgren, T. et al. (2011) Fossilized nuclei and germinationstructures identify Ediacaran ‘animal embryos’ as encystingprotists. Science 334, 1696–1699
68 Rahman, I.A. et al. (2012) Virtual fossils: a new resource for sciencecommunication in paleontology. Evol. Educ. Outreach 5, 635–641
69 Schilling, R. et al. (2014) Reviving the dinosaur: virtual reconstruction andthree-dimensional printingof adinosaurvertebra.Radiology270,864–871
70 Allen, V. et al. (2013) Linking the evolution of body shape andlocomotor biomechanics in bird-line archosaurs. Nature 497, 104–107
71 Balanoff, A.M. et al. (2013) Evolutionary origins of the avian brain.Nature 501, 93–96
72 Dierolf, M. et al. (2010) Ptychographic X-ray computed tomography atthe nanoscale. Nature 467, 436–439
73 Sutton, M.D. et al. (2001) Methodologies for the visualization andreconstruction of three-dimensional fossils from the SilurianHerefordshire Lagerstatte. Palaeontol. Electron. 4, art. 1
74 Sutton, M.D. et al. (2012) A Silurian armoured aplacophoran andimplications for molluscan phylogeny. Nature 490, 94–97
75 Briggs, D.E.G. et al. (2012) Silurian horseshoe crab illuminates theevolution of arthropod limbs. Proc. Natl. Acad. Sci. U.S.A. 109, 15702–15705
76 Sutton, M.D. et al. (2014) Techniques for Virtual Palaeontology, Wiley77 Lautenschlager, S. (2013) Cranial myology and bite force performance
of Erlikosaurus andrewsi: a novel approach for digital musclereconstructions. J. Anat. 222, 260–272
78 Jones, M.E.H. et al. (2011) Hard tissue anatomy of the cranial joints inSphenodon (Rhynchocephalia): sutures, kinesis, and skull mechanics.Palaeontol. Electron. 14, 17A

Review Trends in Ecology & Evolution June 2014, Vol. 29, No. 6
79 Butler, R.J. et al. (2012) Reassessment of the evidence for postcranialskeletal pneumaticity in Triassic archosaurs, and the early evolutionof the avian respiratory system. PLoS ONE 7, e34094
80 Molnar, J.L. et al. (2012) Idealized landmark-based geometricreconstructions of poorly preserved fossil material: a case study ofan early tetrapod vertebra. Palaeontol. Electron. 15, 1–18
81 Stein, M. (2010) A new arthropod from the Early Cambrian of NorthGreenland, with a ‘great appendage’-like antennula. Zool. J. Linn.Soc. 158, 477–500
82 Arbour, V.M. and Currie, P.J. (2012) Analyzing taphonomicdeformation of ankylosaur skulls using retrodeformation and finiteelement analysis. PLoS ONE 7, e39323
83 Lautenschlager, S. et al. (2013) Edentulism, beaks and biomechanicalinnovations in the evolution of theropod dinosaurs. Proc. Natl. Acad.Sci. U.S.A. 110, 20657–20662
84 White, M. et al. (2013) Morphological comparisons of metacarpal I forAustralovenator wintonensis and Rapator ornitholestoides:implications for their taxonomic relationships. Alcheringa 37, 1–7
85 Young, M.T. et al. (2012) Cranial biomechanics of Diplodocus(Dinosauria, Sauropoda): testing hypotheses of feeding behaviourin an extinct megaherbivore. Naturwissenschaften 99, 637–643
86 Witzel, U. and Preuschoft, H. (2005) Finite-element modelconstruction for the virtual synthesis of the skulls in vertebrates:case study of Diplodocus. Anat. Rec. A 283A, 391–401
87 Snively, E. and Cox, A. (2008) Structural mechanics ofpachycephalosaur crania permitted head-butting behavior.Palaeontol. Electron. 11, 3a
88 Walmsley, C.W. et al. (2013) Why the long face? The mechanics ofmandibular symphysis proportions in crocodiles. PLoS ONE 8, e53873
89 Caromel, A.G.M. et al. (2014) Hydrodynamic constraints on theevolution and ecology of planktic foraminifera. Mar. Micropaleontol.106, 69–78
90 Foth, C. and Rauhut, O.W.M. (2013) The good, the bad, and the ugly:the influence of skull reconstructions and intraspecific variability instudies of cranial morphometrics in theropods and basal saurischians.PLoS ONE 8, e72007
91 Zollikofer, C.P.E. and Ponce de Leon, M.S. (2005) VirtualReconstruction: A Primer in Computer-assisted Paleontology andBiomedicine, Wiley-Interscience
92 Gunz, P. et al. (2009) Principles for the virtual reconstruction ofhominin crania. J. Hum. Evol. 57, 48–62
93 Sampson, S.D. and Witmer, L.M. (2007) Craniofacial anatomy ofMajungasaurus crenatissimus (Theropoda: Abelisauridae) from theLate Cretaceous of Madagascar. J. Vertebr. Paleontol. 27, 32–33
94 Sereno, P.C. et al. (2007) Structural extremes in a Cretaceousdinosaur. PLoS ONE 2, e1230
95 Degrange, F.J. et al. (2010) Mechanical analysis of feeding behavior inthe extinct ‘‘terror bird’’ Andalgalornis steulleti (Gruiformes:Phorusrhacidae). PLoS ONE 5, e11856
96 Lautenschlager, S. (2012) Paleontology 2.0 – A comprehensiveprotocol for the reconstruction of hard- and soft tissue structures infossils. Geol. Soc. Am. Progr. Abstr. 44, 372
97 Grine, F.E. et al. (2010) Reconstruction of the late Pleistocene humanskull from Hofmeyr, South Africa. J. Hum. Evol. 59, 1–15
98 Ogihara, N. et al. (2006) Computerized restoration ofnonhomogeneous deformation of a fossil cranium based on bilateralsymmetry. Am. J. Phys. Anthropol. 130, 1–9
99 Boyd, A.A. and Motani, R. (2008) Three-dimensional re-evaluation ofthe deformation removal technique based on ‘‘jigsaw puzzling’’.Palaeontol. Electron. 11, 7A
100 Zollikofer, C. (2002) A computational approach to paleoanthropology.Evol. Anthropol. S1, 64–67
101 Gai, Z.K. et al. (2011) Fossil jawless fish from China foreshadows earlyjawed vertebrate anatomy. Nature 476, 324–327
357