Embed Size (px)
Citation preview

BOFIT Discussion Papers 10 • 2017
Daniela Marconi
Currency co-movements in Asia-Pacific: The regional role of the Renminbi
BOFIT Discussion Papers Editor-in-Chief Zuzana Fungáčová BOFIT Discussion Papers 10/2017 12.6.2017 Daniela Marconi: Currency co-movements in Asia-Pacific: The regional role of the Renminbi ISBN 978-952-323-167-2, online ISSN 1456-5889, online This paper can be downloaded without charge from http://www.bofit.fi/en. Suomen Pankki Helsinki 2017

BOFIT- Institute for Economies in Transition Bank of Finland
BOFIT Discussion Papers 10/ 2017
3
Contents
Abstract ....................................................................................................................................... 4
1 Introduction ......................................................................................................................... 5
2 Literature review ................................................................................................................. 6
3 Estimation strategy .............................................................................................................. 8
4 Empirical results ................................................................................................................ 10
4.1 Robustness checks ...................................................................................................... 17
5 Conclusions ....................................................................................................................... 19
References ................................................................................................................................ 20
Appendix A .............................................................................................................................. 22

Daniela Marconi Currency co-movements in Asia-Pacific: The regional role of the Renminbi
4
Daniela Marconi
Currency co-movements in Asia-Pacific: The regional role of the Renminbi
Abstract The internationalization of China’s currency, the renminbi (RMB) bolsters the growing economic
and political influence of China in the Asia-Pacific region. This paper assesses the evolution of
RMB exchange rate co-movements against the US dollar (USD) within the region. While the RMB’s
influence is growing, it is also found to be asymmetric and varying over time depending on the
global movement of the USD. The trend is strong when the USD depreciates, but fades when the
USD appreciates.
JEL classification: F31, F33.
Keywords: Exchange rates, Asia-Pacific, renminbi, China.
Daniela Marconi, orcid.org/0000-0002-9353-441X. Bank of Italy, Directorate General for Economics, Statistics and Research. E-mail: [email protected].
The views expressed in this paper are solely those of the author. I wish to thank the editors Yin-Wong Cheung and Iikka Korhonen for useful comments, as well as the insightful discussion provided by the participants at the 2016 Conference on China’s financial markets and the global economy, sponsored by the Bank of Finland’s Institute for Economies in Transition (BOFIT).

BOFIT- Institute for Economies in Transition Bank of Finland
BOFIT Discussion Papers 10/ 2017
5
1 Introduction Since the Asian financial crisis of 1997–1998, the array of exchange rates within the Asia-Pacific
(AP) region has changed considerably. Many currencies that were once strictly anchored to the US
dollar have become progressively more flexible. According to the latest IMF assessment (IMF,
2016), a large share of exchange rate arrangements in the AP region are currently of a floating
nature, with just a handful of countries (including China, Malaysia, Singapore and Hong Kong)
maintaining more tightly managed arrangements.
China’s exchange rate regime has been reformed repeatedly over the last decade, moving
towards greater flexibility. In the summer of 2005, China abandoned its strict peg to the US dollar
(USD), allowing a limited fluctuation around a central parity fixed on a daily basis. Since then, the
exchange rate flexibility of the renminbi (RMB) has gradually increased.
Regional trade integration has grown dramatically over the last two decades. For many AP
countries, intra-regional trade now accounts for over 60 % of their total external trade. Thanks to its
central position in the region’s production network, China has exerted a pivotal role in this process
(IDE-JETRO and WTO, 2011; Baldwin, 2011). Since 2002, the share of trade with China has nearly
doubled in almost all these countries, mainly at the expense of Japan.
In July 2009, China’s State Council introduced a pilot scheme for RMB trade settlement.
The Chinese authorities have since proactively encouraged the internationalization of the RMB with
the aim of reducing its reliance on the USD as a medium of exchange and store of value. The range
of transactions that can be settled in RMB has been progressively expanded to include all current
account transactions and certain financial account transactions.1
The use of the RMB as a trade settlement currency has also grown significantly. The share
of Chinese transactions settled in RMB peaked at 30 % in the first half of 2015 (up from zero at the
beginning of 2010). By 2014, the AP region accounted for over half of China’s total trade in goods
and about 80 % of cross-border RMB payments (PBC, 2015). To promote the use of the RMB, the
People’s Bank of China (PBC) has signed bilateral currency swap agreements with many central
banks in the region (Australia, New Zealand, South Korea, Hong Kong, Malaysia, Indonesia, Sin-
gapore and Thailand), as well as allowed for the creation of offshore centers for RMB trading in
Hong Kong, Singapore, Seoul, Sidney, Kuala Lumpur, Bangkok, Taipei and Macau. Intra-region
financial integration, even if it lags trade integration, is progressing.
1 For an overview of the RMB internationalization process, see Eichengreen and Kawai (2015) and Marconi et al. (2016).

Daniela Marconi Currency co-movements in Asia-Pacific: The regional role of the Renminbi
6
This paper investigates whether the growing economic influence of China in the AP region
is reflected in currency co-movements against the USD. The growing use of the RMB to settle trade
transactions within the region in association with higher exchange rate flexibility may have in-
creased the sensitivity of AP exchange rates to RMB movements against the USD. This greater
sensitivity may be policy-driven, with policymakers seeking to stabilize relative competitiveness
and reduce currency risks, or market-driven, with international traders increasingly taking RMB
movements into account when trading other AP currencies.
This study contributes to the existing literature by proposing an identification strategy that
helps distinguish among the global, regional and RMB factors that drive AP daily exchange rate
returns.
When the main global and regional factors are considered, regional currencies have shown
co-movement with the RMB against the USD since China’s 2005 exchange rate reform. These co-
movements, however, are asymmetric depending on the global USD trend. Specifically, when the
USD depreciates globally, daily exchange rate returns within the region tend to be more positively
correlated among themselves and with the RMB and less correlated to other major global currencies.
When the USD appreciates globally, AP exchange rates tend to follow the global depreciation trend
against the USD more closely. Here, the RMB plays little or no role. This asymmetry suggests that
AP currencies move as if driven by the aim of stabilizing the effective exchange rate and avoiding
excessive appreciation. Similar interpretations have been offered by Ho et al. (2005) and Rajan
(2012).
The paper is organized as follows. Section 2 reviews the relevant literature on the topic of
RMB co-movements with other Asian currencies. Section 3 describes the data and the empirical
strategy used. Section 4 presents the results of the analysis. Section 5 concludes.
2 Literature review A growing body of literature has started to look at the role of the RMB in the exchange rate config-
uration of the AP region. Most research focuses on determining whether the RMB has begun to
appear in the implied currency baskets against which markets, policymakers or both tend to stabilize
the currencies of other Asian economies, e.g. Henning (2012), Subramanian and Kessler (2013),
Fratzscher and Mehl (2014), Kawai and Pontines (2016) and Eichengreen and Lombardi (2017). A
common feature of the empirical strategy is to estimate a Frenkel-Wei equation (Frenkel and Wei,
1994) of the following type:

BOFIT- Institute for Economies in Transition Bank of Finland
BOFIT Discussion Papers 10/ 2017
7
∆ log � 𝐸𝐸𝑖𝑖𝑖𝑖𝐶𝐶𝐶𝐶𝐶𝐶𝑖𝑖
� = 𝛼𝛼𝑖𝑖 + 𝛽𝛽1∆ log �𝑈𝑈𝑈𝑈𝑈𝑈𝑖𝑖𝐶𝐶𝐶𝐶𝐶𝐶𝑖𝑖
� + 𝛽𝛽2∆ log �𝐸𝐸𝑈𝑈𝐸𝐸𝑖𝑖𝐶𝐶𝐶𝐶𝐶𝐶𝑖𝑖
� + 𝛽𝛽3∆ log �𝐽𝐽𝐽𝐽𝐽𝐽𝑖𝑖𝐶𝐶𝐶𝐶𝐶𝐶𝑖𝑖
� +
𝛽𝛽4∆ log �𝐺𝐺𝐺𝐺𝐽𝐽𝑖𝑖𝐶𝐶𝐶𝐶𝐶𝐶𝑖𝑖
�+𝛽𝛽4∆ log �𝐸𝐸𝑅𝑅𝐺𝐺𝑖𝑖𝐶𝐶𝐶𝐶𝐶𝐶𝑖𝑖
� + 𝜖𝜖𝑖𝑖𝑖𝑖 , (1)
where ∆ log � 𝐸𝐸𝑖𝑖𝐶𝐶𝐶𝐶𝐶𝐶
� is the change of the log of the exchange rate (E) of country 𝑖𝑖, vis-à-vis the Swiss
franc (CHF); USD, EUR, JPY and GBP denote the US dollar, the euro, the Japanese yen and the
pound sterling. All exchange rates are expressed vis-à-vis the Swiss franc, but other currencies may
be selected as numéraire: for instance, Fratzscher and Mehl (2014) choose the SDR, while Kawai
and Pontines (2016) prefer the New Zealand dollar.
The evidence based on this approach is mixed. Henning (2012), Subramanian and Kessler
(2013) and Eichengreen and Lombardi (2017) conclude that an RMB bloc has emerged in East Asia.
In contrast, Fratzscher and Mehl (2014) and Kawai and Pontines (2016) find a more limited effect.
This ambiguity essentially arises from two main problems. First, much of the difficulty in assessing
the degree of co-movements with the RMB arises as a result of the choice of the numéraire. The
USD is both the dominant currency in the international monetary system and the main reference
currency in the RMB basket. Whenever a currency other than the USD is chosen as the numéraire,
and both the USD and the RMB are included on the right-hand side, multicollinearity problems arise
(Ito, 2008). A second problem is due to omitted variables, i.e. exchange rate changes may be driven
by common factors at both the global and regional level. Not accounting for these factors may cause
the RMB to take on a too small or a too large role also depending on the sample period.
Fratzscher and Mehl (2014) suggest overcoming the collinearity problems using orthogo-
nal explanatory variables. Taking the USD/SDR exchange rate as the exogenous variable, they con-
trol for omitted variable problems by introducing a set of global variables that includes oil prices, a
proxy for global liquidity conditions and a proxy for risk aversion.2 Kawai and Pontines (2016) use
a two-step estimation approach. They conclude that the importance of the RMB in the currency
basket of many East Asian economies has grown in recent years, but USD still remains the most
important anchor currency in the region. Fratzscher and Mehl (2014) reach a similar conclusion.
Another approach is to choose the USD itself as the numéraire. This choice focuses on the
degree of exchange rate co-movements against the USD. Using this approach, Shu et al. (2015) find
significant, but differentiated, co-movements of AP currencies with the RMB.
2 Fratzscher and Mehl (2014) propose numerous specifications for testing the hypothesis of Chinese dominance. The reference here is to the specification reported in their Table 4 (p. 1361).

Daniela Marconi Currency co-movements in Asia-Pacific: The regional role of the Renminbi
8
Finally, Chow (2014) estimates country-specific VAR models using bilateral exchange rates
against the USD. She finds evidence that after the global financial crisis the RMB started exerting
a role in Asian exchange rate determination, and the RMB impact has since become at least as
large as the USD.
To summarize, the existing evidence points to (i) an increasing role of the RMB in explaining
exchange rate movements in Asia, (ii) an even larger role since the global financial crisis, and (iii)
a variation in magnitude across studies, depending on the specification.
3 Estimation strategy We propose an estimation approach that overcomes the above-mentioned multicollinearity prob-
lems and omitted variable bias by combining several strategies. As in Shu et al. (2015), the USD is
chosen as the numéraire, thereby overcoming a possible source of collinearity. We focus on the
response of daily exchange rate returns against the USD in a panel of eleven AP currencies to de-
velopments of the RMB/USD daily exchange rate. We select the currencies of the largest and most
interconnected economies in the region, including the Australian dollar (AUD), Hong Kong dollar
(HKD), Indian rupiah (INR), Indonesian rupee (IDR), Korean won (KRW), Malaysian ringgit
(MYR), New Zealand dollar (NZD), Philippines peso (PHP), Singaporean dollar (SGD), Thailand
dollar (THD) and Taiwan dollar (TWD). Along with the RMB/USD exchange rate, explanatory
variables include global and regional factors to control for omitted variables.
Our basic specification is the following:
∆ log � 𝐸𝐸𝑖𝑖𝑖𝑖
𝑈𝑈𝑈𝑈𝑈𝑈𝑖𝑖� = 𝛼𝛼𝑖𝑖 + 𝛽𝛽𝐺𝐺𝑈𝑈∆ log(𝐺𝐺𝐺𝐺𝑖𝑖) + 𝛽𝛽𝐸𝐸𝐸𝐸𝐺𝐺∆ log(𝑅𝑅𝑅𝑅𝐺𝐺𝑖𝑖𝑖𝑖) +𝛽𝛽𝐸𝐸𝑅𝑅𝐺𝐺∆ log �𝐸𝐸𝑅𝑅𝐺𝐺𝑖𝑖
𝑈𝑈𝑈𝑈𝑈𝑈𝑖𝑖� + 𝛾𝛾1∆log (𝐺𝐺𝐺𝐺𝐺𝐺𝐺𝐺𝑖𝑖) +
𝛾𝛾2∆𝐺𝐺𝑆𝑆𝑆𝑆𝑆𝑆𝑖𝑖 + 𝛾𝛾3∆log (𝑆𝑆𝐺𝐺𝑆𝑆𝑖𝑖) + 𝛿𝛿1∆𝑅𝑅𝑅𝑅𝑅𝑅𝑆𝑆𝑖𝑖 + 𝜖𝜖𝑖𝑖𝑖𝑖 . (2)
The dependent variable is the two-day (non-overlapping) return for the nominal (spot) exchange
rate expressed in units of the i-th national currency per USD. i indicates the i-th AP currency. Var-
iables on the right-hand side include the two-day log change of an outside-region global dollar index
(GD), the two-day return of a regional dollar index (REG) and the two-day return of the RMB/USD
exchange rate.3 The two variables GD and REG take inspiration from the work of Verdelhan (2015),
who shows that the dollar factor accounts for a large share of exchange rate variation against the
3 It is standard in the literature to use two-day non-overlapping exchange rate returns to account for possible non-overlapping trading zones affecting global variables and avoid spurious correlations if the two-day returns overlap.

BOFIT- Institute for Economies in Transition Bank of Finland
BOFIT Discussion Papers 10/ 2017
9
USD. In Verdelhan (2015), the global dollar factor corresponds to the average change in the ex-
change rate between the USD and all other currencies, excluding currency i itself. In his case, the
global dollar factor is country-specific. Here, we split Verdelhan’s global dollar factor into two
parts: an outside-region part, common across the currencies considered (GD), and a regional part,
which is country-specific (REG).4
The GD index is the trade-weighted exchange value of the USD versus six major free float-
ing currencies.5 The GD index is invariant across the countries included in the sample. An increase
of GD indicates an average appreciation of the USD with respect to the major international curren-
cies. The variable REG corresponds to a trade-weighted average index of the bilateral AP exchange
rates against the USD, excluding currency i itself:
𝑅𝑅𝑅𝑅𝐺𝐺𝑖𝑖𝑖𝑖 = ∑ 𝐸𝐸𝑠𝑠𝑖𝑖
𝑈𝑈𝑈𝑈𝑈𝑈𝑖𝑖∗ 𝑤𝑤𝑠𝑠𝑖𝑖𝑠𝑠≠𝑖𝑖 ; 𝑖𝑖 ∈ 𝐴𝐴𝑅𝑅; 𝑠𝑠 ∈ 𝐴𝐴𝑅𝑅 ; ∑ 𝑤𝑤𝑠𝑠𝑖𝑖𝑠𝑠≠𝑖𝑖 = 1 , (3)
where 𝑤𝑤𝑠𝑠𝑖𝑖 indicates the trade weight (for country i) assigned to the currency of trading partner s. An
increase in REG indicates an appreciation of the USD against the regional currencies. A more de-
tailed description of the variables and the list of the currencies included is reported in Table A1 in
the appendix.
Other global variables included are a commodity price index (GSCI), the emerging market
sovereign spread index (SOVX) to capture the degree of stress on global financial markets, and the
Chicago Board Options Exchange Volatility Index (VIX) to capture global risk aversion. To account
for any additional effect stemming from liquidity conditions in China, we also include the Chinese
1-week interbank repo rate (REPO). 𝛽𝛽𝐸𝐸𝑅𝑅𝐺𝐺 is the parameter of interest, it measures the degree of
response of daily returns to the RMB/USD exchange rate.
Figure 1 reports the GD index, as well as a simple average of the eleven country-specific
REG indexes and the USD broad nominal effective exchange rate index (NEER). GD and REG
have been on diverging paths since 2003, with a sharper increase in the distance between the two
variables after the 2008–2009 global financial crisis. Thereafter, the gap has tended to increase in
periods of sustained USD depreciation and to narrow in periods of USD appreciation. This is our
4 Fratzscher and Mehl (2014) consider a regional currency factor similar to ours. However, their specification of regional factor for Asia includes the RMB, so the RMB effect is not distinguished from the regional effect. Similarly, when they single out the RMB effect, they exclude the regional factor. 5 The index, computed by the Board of Governors of the Federal Reserve System (US), includes the Canadian dollar, euro, Japanese yen, Swiss franc, UK pound and Swedish krona.

Daniela Marconi Currency co-movements in Asia-Pacific: The regional role of the Renminbi
10
first indication of an asymmetric movement of AP exchange rates. Appreciation is likely to be con-
tained, while depreciation is observed as less contained. We explore this issue in greater detail later
on. In any case, the correlation between the GD and REG is relatively low, around 0.3.
Figure 1 Global dollar, Regional dollar and USD nominal effective exchange rate.
Source: Thomson Reuters Datastream and author’s calculations.
Note: An increase indicates a dollar effective appreciation against the group of currencies considered. A_REG is the average of country-specific 𝑅𝑅𝑅𝑅𝐺𝐺𝑖𝑖𝑖𝑖 computed in (3); GD is the USD index against 6 major currencies; USDNEER is the daily USD effective exchange rate index.
4 Empirical results We use daily data running from 5 September 2005 to 31 January 2017. This time span provides a
sufficient perspective to assess the evolution of exchange rate co-movements in the AP region, since
it encompasses both periods in which the RMB experienced a tighter peg to the US dollar (when
𝛽𝛽𝐸𝐸𝑅𝑅𝐺𝐺 is expected to take a low or zero value), as well as periods of higher RMB flexibility. Indeed,
China’s exchange rate regime underwent several changes during our sample period. Thus, it is im-
portant to check whether its regional influence changes over time. Looking at the RMB/USD ex-
change rate, it is possible to identify six sub-periods (Table 1).
50
60
70
80
90
100
110
120
130
140
2002 2003 2004 2005 2006 2007 2008 2009 2010 2011 2012 2013 2014 2015 2016 2017
A_REG USDNEER GD

BOFIT- Institute for Economies in Transition Bank of Finland
BOFIT Discussion Papers 10/ 2017
11
Table 1 RMB exchange rate reforms
Period Label Description
Period 1: 05/09/2005 – 01/08/2008
Early reform Introduction of the crawling-peg re-gime with a maximum daily trading band against the US dollar of ±0.5%
Period 2: 02/08/2008 – 18/06/2010
Post-GFC stabilization Restoration of a stricter peg to the dollar
Period 3: 21/06/2010 – 13/04/2012
Return to 0.5% band Return to flexibility within a daily trading band of ±0.5%
Period 4: 16/04/2012 – 14/03/2014
1% band Daily trading band widens to ±1%
Period 5: 15/03/2014 – 10/08/2015
2% band Daily trading band widens to ±2.0%
Period 6: from 11/08/2015
Post-fixing reform New mechanism for determination of daily central parity 6
Table 2 reports panel estimates for equation (2) on the full sample period using various estimators:
pooled OLS estimator (column 1), fixed-effect estimator (FE, column 2) and panel-corrected stand-
ard error estimator (PCSE, column 3). The estimators give quite similar results in terms of both
magnitude and significance of estimated parameters. The panel-specific autocorrelations estimated
with the PCSE model also appear to be quite low (the largest is 0.2). Given the similarities, we go
with the fixed-effect estimator.
Turning to the coefficients, we first examine their relative magnitude. The largest impact
comes from the GD factor, followed by RMB and REG. All three variables are highly statistically
significant.7
6 The latest exchange rate reform has sensibly changed the dynamics of China’s central parity. For a comprehensive analysis of this regime shift, see Cheung et al. (2016). 7 While we do not posit a true causal effect running from RMB to AP exchange rates against the USD, the Hausman-Taylor estimator rules out the endogeneity of both RMB and REG (results available on request).

Daniela Marconi Currency co-movements in Asia-Pacific: The regional role of the Renminbi
12
Table 2 Basic panel regressions comparing different estimators
OLS (1)
FE (2)
PCSE (3)
GD 0.280*** 0.280** 0.281*** [0.011] [0.078] [0.011]
REG 0.198*** 0.198*** 0.201*** [0.019] [0.034] [0.011]
RMB 0.254*** 0.254** 0.255*** [0.031] [0.057] [0.037]
SOVX 0.007*** 0.007** 0.008*** [0.001] [0.002] [0.001]
GSCI -0.022*** -0.022 -0.020*** [0.004] [0.011] [0.004]
VIX 0.010*** 0.010** 0.009*** [0.001] [0.003] [0.001]
REPO -0.001 -0.001 0.003 [0.009] [0.008] [0.013]
N 16390 16390 16390
Adj. R^2 0.252 0.252 0.263
Note: *p<0.05; ** p<0.01; *** p<0.001. FE = fixed-effect estimator with cluster-robust standard errors; PCSE = panel-corrected standard error model, controlling for cross-panel correlation and autocorrelation. Robust standard er-rors are reported in parentheses. Sample period runs from 5 September 2005 to 31 January 2017. Table 3 reports the relative contribution of GD, REG and RMB to the model’s goodness of fit. All
these variables improve the model’s goodness of fit. The introduction of GD explains a slightly
larger portion of variance compared to a specification, which considers only the EUR/USD,
GBP/USD and YEN/USD exchange rates. The introduction of the RMB brings an additional slight
improvement (the adjusted R-squared increases from 0.220 to 0.227). Finally, the inclusion of the
REG variable brings about the largest improvement to the overall fit of the model. Here, it is worth
noting that the inclusion of REG reduces the coefficient on RMB, �̂�𝛽𝐸𝐸𝑅𝑅𝐺𝐺 from 0.35 (column 3) to
0.25 (column 5), suggesting that relative competitiveness within the region is an important driver of
AP exchange rate movements. Not controlling for this effect would cause the value of �̂�𝛽𝐸𝐸𝑅𝑅𝐺𝐺 to be
excessively large.

BOFIT- Institute for Economies in Transition Bank of Finland
BOFIT Discussion Papers 10/ 2017
13
Table 3 Marginal contributions of GD, REG and RMB
EUR&GBP&YEN (1)
GD (2)
GD&RMB (3)
GD® (4)
GD®&RMB (5)
EUR 0.170** [0.037] GBP 0.104** [0.024]
YEN 0.033 [0.019] GD 0.334** 0.316** 0.291** 0.280** [0.078] [0.079] [0.077] [0.078]
REG 0.209*** 0.198*** [0.035] [0.034]
RMB 0.349*** 0.254** [0.061] [0.057]
SOVX 0.009*** 0.010*** 0.010*** 0.007** 0.007** [0.002] [0.002] [0.002] [0.002] [0.002]
GSCI -0.034* -0.028* -0.025* -0.024 -0.022 [0.013] [0.011] [0.011] [0.011] [0.011]
VIX 0.012** 0.011** 0.011** 0.010** 0.010** [0.003] [0.003] [0.003] [0.003] [0.003]
REPO -0.001 0.000 -0.004 0.002 -0.001 [0.007] [0.008] [0.007] [0.008] [0.008] N 16390 16390 16390 16390 16390 Adj. R^2 0.215 0.220 0.227 0.248 0.252
Note: *p<0.05; ** p<0.01; *** p<0.001. Fixed-effect estimator; cluster-robust standard errors reported in parentheses. Sample period runs from 5 September 2005 to 31 January 2017. To appreciate the marginal contribution of the RMB across the seven sub-periods, we run regression
2, first excluding the RMB from the right-hand side and then including it. The marginal effect can
be appreciated through the changes of the adjusted R-squared, and we also compute the F-test from
the Residual Sum of Squares (RSS) of the two regressions. Table 4 reports the results for the re-
stricted regression (RMB excluded), while Table 5 reports the results for the unrestricted regression
(RMB included). The inclusion of the RMB is statistically significant in Period 1, Period 3, Period
4 and Period 6, corresponding to the periods of higher volatility of the RMB (Fig. 2).
Focusing on the results reported in Table 5, we find that �̂�𝛽𝐸𝐸𝑅𝑅𝐺𝐺 varies considerably across
the six sub-periods. �̂�𝛽𝐸𝐸𝑅𝑅𝐺𝐺 is not significantly different from zero in two occasions. First, �̂�𝛽𝐸𝐸𝑅𝑅𝐺𝐺 is
not significant during the post-GFC stabilization period (Period 2), as one would expect. Less intu-
itive is the lack of significance over the 2%-band period (Period 5). A possible explanation is that,
despite the widening of the band over this time span, the RMB displays very low volatility as the

Daniela Marconi Currency co-movements in Asia-Pacific: The regional role of the Renminbi
14
USD tended to appreciate globally, and global and regional volatility increased. �̂�𝛽𝐸𝐸𝑅𝑅𝐺𝐺 is higher
between June 2010 and March 2014 (Period 3 and Period 4), a phase of rapid increase in the use of
the currency within the region and in the post-fixing reform period (Period 6), when the volatility
of the Chinese currency increased considerably and the RMB tended to depreciate against the USD.
In contrast, �̂�𝛽𝐺𝐺𝑈𝑈 and �̂�𝛽𝐸𝐸𝐸𝐸𝐺𝐺 remained highly significant and fairly stable in magnitude across the
various sample periods.
Table 4 Co-movements with GD and REG
All sample
P1-P6
Early reform
P1
Post-GFC stabilization
P2
0.5% band
P3
1% band
P4
2% band
P5
Post-fixing reform
P6
GD 0.291** 0.279** 0.313** 0.259** 0.286** 0.257** 0.335**
[0.077] [0.087] [0.08] [0.064] [0.065] [0.080] [0.090]
REG 0.209*** 0.225*** 0.148*** 0.232* 0.212** 0.202*** 0.267**
[0.035] [0.036] [0.031] [0.074] [0.052] [0.037] [0.070]
SOVX 0.007** 0.014** 0.004* 0.006** 0.014*** 0.005 0.013** [0.002] [0.004] [0.002] [0.002] [0.003] [0.003] [0.003]
GSCI -0.024 0.005 -0.031 -0.051* -0.018* -0.016 -0.01
[0.011] [0.006] [0.018] [0.017] [0.006] [0.010] [0.005]
VIX 0.010** 0.004 0.021* 0.010* 0.002 0.004** 0.012** [0.003] [0.003] [0.008] [0.004] [0.002] [0.001] [0.003]
REPO 0.002 -0.02 -0.045 -0.022* 0.073*** 0.024 0.113 [0.008] [0.015] [0.099] [0.008] [0.015] [0.020] [0.118]
N 16390 4180 2695 2607 2750 2013 2134
Adj. R^2 0.249 0.152 0.270 0.350 0.197 0.188 0.368
RSS 0.7730 0.1617 0.2953 0.0913 0.0810 0.0515 0.0773
Note: * p<0.05; ** p<0.01; *** p<0.001. Fixed-effect estimator; cluster-robust standard errors reported in parentheses. As mentioned, the instability of �̂�𝛽𝐸𝐸𝑅𝑅𝐺𝐺 may reflect an asymmetric degree of flexibility of Asian cur-
rencies depending on the type of pressure they face. Indeed, a number of works in recent years have
found evidence indicating asymmetric behavior of many East Asian currencies, whereby deprecia-
tion is largely permitted, while there is a tendency to counter appreciation with exchange-rate inter-
ventions (Ho et al., 2005; Pontines and Siregar, 2012; Rajan, 2012).
To clarify the degree of co-movements of AP currencies with the RMB during different
phases of USD global movements, we divide the sample period according to appreciation and de-
preciation phases of the USD against other major international currencies (Table 6). Phases are
BOFIT- Institute for Economies in Transition Bank of Finland
BOFIT Discussion Papers 10/ 2017
15
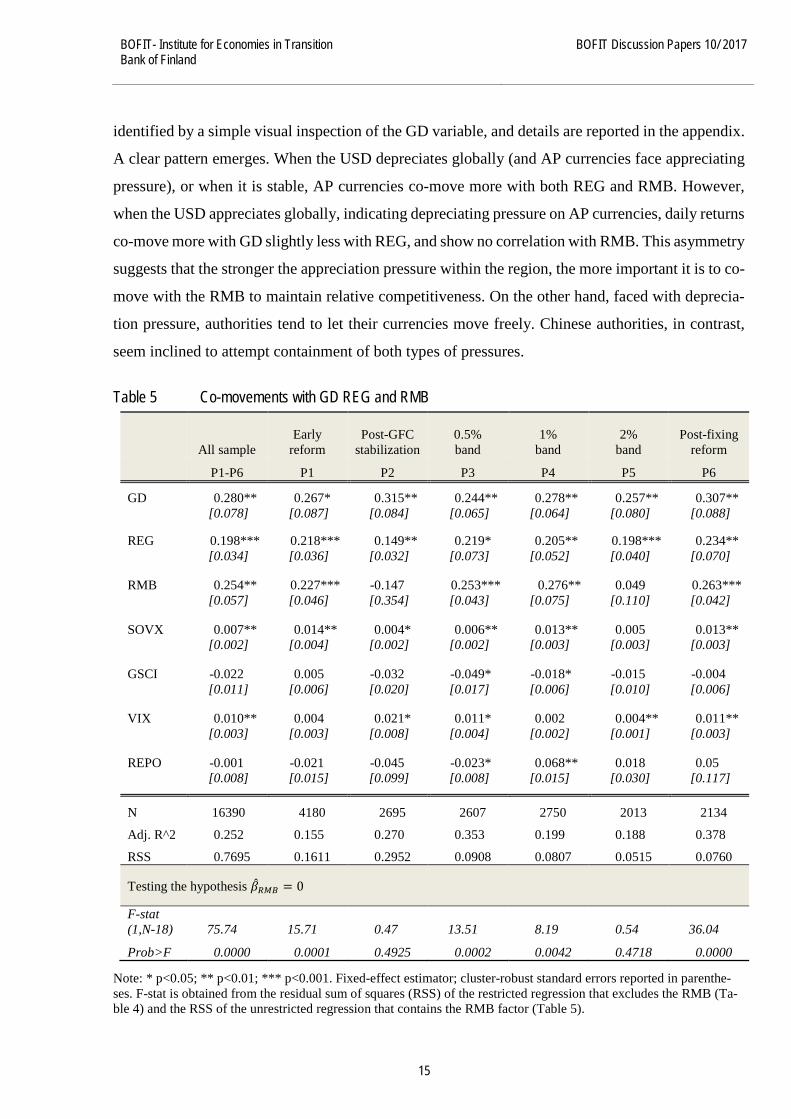
identified by a simple visual inspection of the GD variable, and details are reported in the appendix.
A clear pattern emerges. When the USD depreciates globally (and AP currencies face appreciating
pressure), or when it is stable, AP currencies co-move more with both REG and RMB. However,
when the USD appreciates globally, indicating depreciating pressure on AP currencies, daily returns
co-move more with GD slightly less with REG, and show no correlation with RMB. This asymmetry
suggests that the stronger the appreciation pressure within the region, the more important it is to co-
move with the RMB to maintain relative competitiveness. On the other hand, faced with deprecia-
tion pressure, authorities tend to let their currencies move freely. Chinese authorities, in contrast,
seem inclined to attempt containment of both types of pressures.
Table 5 Co-movements with GD REG and RMB
All sample Early
reform Post-GFC
stabilization 0.5% band
1% band
2% band
Post-fixing reform
P1-P6 P1 P2 P3 P4 P5 P6
GD 0.280** 0.267* 0.315** 0.244** 0.278** 0.257** 0.307** [0.078] [0.087] [0.084] [0.065] [0.064] [0.080] [0.088]
REG 0.198*** 0.218*** 0.149** 0.219* 0.205** 0.198*** 0.234**
[0.034] [0.036] [0.032] [0.073] [0.052] [0.040] [0.070]
RMB 0.254** 0.227*** -0.147 0.253*** 0.276** 0.049 0.263***
[0.057] [0.046] [0.354] [0.043] [0.075] [0.110] [0.042]
SOVX 0.007** 0.014** 0.004* 0.006** 0.013** 0.005 0.013**
[0.002] [0.004] [0.002] [0.002] [0.003] [0.003] [0.003]
GSCI -0.022 0.005 -0.032 -0.049* -0.018* -0.015 -0.004
[0.011] [0.006] [0.020] [0.017] [0.006] [0.010] [0.006]
VIX 0.010** 0.004 0.021* 0.011* 0.002 0.004** 0.011**
[0.003] [0.003] [0.008] [0.004] [0.002] [0.001] [0.003]
REPO -0.001 -0.021 -0.045 -0.023* 0.068** 0.018 0.05
[0.008] [0.015] [0.099] [0.008] [0.015] [0.030] [0.117]
N 16390 4180 2695 2607 2750 2013 2134
Adj. R^2 0.252 0.155 0.270 0.353 0.199 0.188 0.378
RSS 0.7695 0.1611 0.2952 0.0908 0.0807 0.0515 0.0760
Testing the hypothesis �̂�𝛽𝐸𝐸𝑅𝑅𝐺𝐺 = 0
F-stat (1,N-18) 75.74 15.71 0.47 13.51 8.19 0.54 36.04
Prob>F 0.0000 0.0001 0.4925 0.0002 0.0042 0.4718 0.0000
Note: * p<0.05; ** p<0.01; *** p<0.001. Fixed-effect estimator; cluster-robust standard errors reported in parenthe-ses. F-stat is obtained from the residual sum of squares (RSS) of the restricted regression that excludes the RMB (Ta-ble 4) and the RSS of the unrestricted regression that contains the RMB factor (Table 5).

Daniela Marconi Currency co-movements in Asia-Pacific: The regional role of the Renminbi
16
Figure 2 RMB/US$: coefficient of variation across reform periods.
Source: Thomson Reuters Datastream and author’s calculations. Table 6 Fixed-effects panel regressions based on USD phases of appreciation/depreciation
USD USD USD depreciation appreciation stability (1) (2) (3)
GD 0.290** 0.306** 0.256** [0.088] [0.073] [0.072]
REG 0.186*** 0.184* 0.235*** [0.026] [0.058] [0.039]
RMB 0.279*** 0.115 0.331*** [0.060] [0.097] [0.056]
SOVX 0.009** 0.003 0.009** [0.003] [0.002] [0.002]
GSCI -0.014 -0.04 -0.009 [0.009] [0.018] [0.007]
VIX 0.008 0.012** 0.008** [0.004] [0.004] [0.002]
REPO -0.001 0.021 -0.031 [0.007] [0.041] [0.015] N 7271 4411 4675 Adj. R^2 0.240 0.242 0.290
Note: * p<0.05; ** p<0.01; *** p<0.001. Cluster-robust standard errors reported in parentheses. USD depreciation, appreciation and stability periods are reported in Table A2.
0,00
0,01
0,02
0,03
0,04
0,05
0,06
Early reform Post-GFCstabilization
0.5% band 1% band 2% band Post-fixingreform

BOFIT- Institute for Economies in Transition Bank of Finland
BOFIT Discussion Papers 10/ 2017
17
4.1 Robustness checks This section provides additional checks. A first check is to evaluate the degree of endogeneity of
the RMB factor by regressing RMB/USD on GD and REG,8 including all the controls considered
in equation (2). We run the regression on the full sample period, as well as on the sample period
starting from the return to flexibility after the GFC (Periods 3–6). The results reported in Table 7
show that both GD and REG exerted a mild effect on RMB/USD daily returns over the full sample
period. After 21 June 2010, however, REG exerts a stronger impact. The very low levels of the
adjusted R-squared indicate that the model has low explanatory power for the RMB/USD exchange
rate.
Running a Granger-causality test, we cannot reject the null hypothesis that regional ex-
change rates (summarized by REG) do not Granger-cause RMB, but we do find evidence that RMB
Granger-causes REG. Both RMB and REG are found to be endogenous to GD as expected (results
available on request).
Table 7 OLS regressions for RMB/USD exchange rate
∆ log �𝐸𝐸𝑅𝑅𝐺𝐺𝑈𝑈𝑈𝑈𝑈𝑈𝑖𝑖
� = 𝛽𝛽𝐺𝐺𝑈𝑈∆ log(𝐺𝐺𝐺𝐺𝑖𝑖) + 𝛽𝛽𝐸𝐸𝐸𝐸𝐺𝐺∆ log(𝑅𝑅𝑅𝑅𝐺𝐺𝐸𝐸𝑅𝑅𝐺𝐺𝑖𝑖) +𝛾𝛾1∆log (𝐺𝐺𝐺𝐺𝐺𝐺𝐺𝐺𝑖𝑖) + 𝛾𝛾2∆𝐺𝐺𝑆𝑆𝑆𝑆𝑆𝑆𝑖𝑖 +𝛾𝛾3∆log(𝑆𝑆𝐺𝐺𝑆𝑆𝑖𝑖) + 𝛿𝛿1∆𝑅𝑅𝑅𝑅𝑅𝑅𝑆𝑆𝑖𝑖 + 𝜖𝜖𝑖𝑖𝑖𝑖
Full sample period Post-GFC
stabilization period 05/09/2005-31/01/2017 21/06/2010-31/01/2017
GD 0.040*** 0.036 [0.011] [0.019]
REG 0.044*** 0.108*** [0.011] [0.026]
SOVX 0.00 -0.001
[0.000] [0.001]
GSCI -0.007* -0.012*
[0.003] [0.005]
VIX 0.000 0.000
[0.001] [0.001]
REPO 0.012 0.016
[0.011] [0.016]
N 1490 864 Adj. R^2 0.075 0.126
* p<0.05; ** p<0.01; *** p<0.001. Heteroskedasticity robust standard errors are reported in parentheses.
8 In the RMB regressions, REG is a trade-weighted average of all eleven AP currencies.

Daniela Marconi Currency co-movements in Asia-Pacific: The regional role of the Renminbi
18
Our second check consists in estimating equation (2) using monthly, instead of bi-daily, data. It is
widely accepted that Asian currencies remain heavily managed, both against the USD and against a
basket of currencies (Rajan, 2012). The reaction function of policymakers can have lags that may
be difficult to capture at high frequencies, so lower frequency data may better reflect the influence
stemming from our three factors: GD, REG and RMB.
Table 8 Fixed-effect panel regressions on monthly data
Full sample
(1)
Post-GFC stabilization
period (2)
Full sample period excluding HKD, AUD and
NZD (3)
Post-GFC stabilization
period excluding HKD, AUD and
NZD (4)
USD appreciation
(5) GD 0.335** 0.272** 0.294** 0.227** 0.348** [0.077] [0.071] [0.068] [0.060] [0.089]
REG 0.240*** 0.249* 0.213*** 0.196* 0.263*** [0.040] [0.084] [0.024] [0.077] [0.041]
RMB 0.191* 0.234* 0.266* 0.330** 0.081 [0.073] [0.075] [0.082] [0.076] [0.108]
SOVX 0.010** 0.019*** 0.011* 0.021*** 0.008* [0.003] [0.004] [0.004] [0.004] [0.003]
GSCI 0.004 0.023 0.021 0.034* 0.001 [0.013] [0.013] [0.010] [0.014] [0.016]
VIX 0.007* 0.005 0.005 0.002 0.004 [0.003] [0.003] [0.003] [0.003] [0.006]
REPO 0.005 0.079 0.035 0.135* 0.116 [0.048] [0.049] [0.059] [0.055] [0.123] N 1507 869 1096 632 495 Adj. R^2 0.416 0.419 0.411 0.405 0.452
* p<0.05; ** p<0.01; *** p<0.001. Cluster-robust standard error. All regressions include a constant term. The full sample period is 09/2005–01/2017. The Post-GFC stabilization pe-riod is 07/2010–01/2017. USD appreciation periods are reported in Table A2.
Results reported in Table 8 show the estimated coefficients based on monthly data. The first regres-
sion is based on the full sample starting on September 2005. The second regression is based on
observations from June 2010 to January 2017 (return to flexibility after the GFC). The third and
fourth regressions consider the two sample periods excluding the free-floating AUD and NZD, as
well as the HKD, which is tightly pegged to the USD. The fifth regression restricts the sample period
to the appreciation phases of the USD. The results are quite similar to those based on daily data. In
particular, the influence of the RMB grows larger as the RMB becomes more flexible, this tendency

BOFIT- Institute for Economies in Transition Bank of Finland
BOFIT Discussion Papers 10/ 2017
19
is reinforced if we exclude AUD, NZD and HKD. We confirm an asymmetric correlation of Asian
currencies with the RMB: the correlation is stronger when the currencies face appreciation pressure
(USD depreciation), and vanish when Asian currencies face depreciation pressure (USD apprecia-
tion; column 5).
Finally, using monthly data to regress RMB/USD on GD and REG (including all the other
controls) does not deliver any meaningful result, indicating that the feedback influence at lower
frequencies is not yet visible from global currencies or AP currencies on RMB changes against the
USD (unreported results available on request).
5 Conclusions By considering the evolution of exchange rate co-movements, this study looked at whether the RMB
exchange rate against the USD has come to exert an influence on Asia-Pacific currencies. Consid-
ering global and regional factors, regional currencies were found to be increasingly co-moving with
the RMB against the USD on average since the 2005 exchange rate reform in China, even if global
and regional factors other than the RMB exchange rate were still predominant. The intensity of the
co-movements of regional currencies with the RMB are asymmetric, becoming stronger when cur-
rencies face appreciation pressure against the USD and fading during depreciation phases. This sug-
gests that the stronger the appreciation pressure within the region, the more important policymakers
see the need for their currency to co-move with the RMB to maintain relative competitiveness. On
the other hand, faced with depreciation pressure, AP currencies tend to move more freely. This
contrasts with the Chinese approach, where the authorities are inclined to attempt containment of
both appreciating and depreciating pressures.
The economic and political influence of China in the Asia-Pacific region has grown con-
siderably in recent years, particularly since the 2008–2009 global financial crisis. Our evidence
suggests that the internationalization of the Chinese currency has the potential to further increase
the regional influence of the RMB to make it the dominant currency, especially if the RMB pro-
gresses along the path to becoming a fully market-determined exchange rate.

Daniela Marconi Currency co-movements in Asia-Pacific: The regional role of the Renminbi
20
References Baldwin, R. (2011). “Trade and Industrialization after Globalization’s 2nd Unbundling: How
Building and Joining a Supply Chain are Different and Why It Matters.” NBER Working Paper No. 17716.
Cheung, Y.W., C.H. Hui and A. Tsang (2016). “The Renminbi Central Parity: An Empirical In-vestigation.” HKIMR Working Paper No. 10/2016. Available at SSRN: https://ssrn.com/abstract=2797968
Chow, H.K. (2014). “Is the Renminbi East Asia’s Dominant Reference Currency? A Reconsider-ation.” China Economic Policy Review, 3(1), 1450002 (20 pages).
Eichengreen, B. and D. Lombardi (2017). “RMBI or RMBR? Is the Renminbi Destined to Become a Global or Regional Currency?” Asian Economic Papers, 16(1): 35–59.
Eichengreen, B. and M. Kawai (eds.) (2015). Renminbi Internationalization. Achievements, Pro-spects, and Challenges. Asian Development Bank Institute, Tokyo and Brookings Insti-tution Press, Washington D.C.
Fratzscher, M. and A. Mehl (2014). “China’s Dominance Hypothesis and the Emergence of a Tri-polar Global Currency System.” Economic Journal, 124 (December): 1343–1370.
Frankel, J.A and S.J. Wei (1994). “Yen Bloc or Dollar Bloc? Exchange Rate Policies of the East Asian Economies.” In Macroeconomic Linkage: Savings, Exchange Rates, and Capital Flows, NBER-EASE Volume 3, edited by T. Ito and A. Krueger. University of Chicago Press, pp. 295–333.
Henning, C.R. (2012). “Choice and Coercion in East Asian Exchange Rate Regimes.” Peterson Institute for International Economics Working Paper Series, WP 12–15.
Ho, C., G. Ma and R.N. McCauley (2005). “Trading Asian Currencies.” BIS Quarterly Review (March): 49–58.
IDE-JETRO and WTO (2011). Trade Patterns and Global Value Chains in East Asia. IDE-JETRO and WTO Publications Managers.
IMF (2016). Annual report on exchange rate arrangements and exchange restrictions. IMF, Wash-ington D.C.
Ito, T. (2008). “Influence of the Renminbi on Exchange Rate Policies of Other Asian Currencies.” In Debating China’s Exchange Rate Policy, edited by M. Goldstein and N.R. Lardy. Washington, D.C.: Peterson Institute for International Economics, pp. 239–258.
Lane, P. R. (2013). “Cross-Border Financial Integration in Asia and the Macro-Financial Policy Framework”. IIIS Discussion Paper No. 423. April.
Kawai, M. and V. Pontines (2016). “Is There Really a Renminbi Bloc in Asia? A Modified Frankel-Wei Approach.” Journal of International Money and Finance, 62: 72–97.
Marconi, D., L. Bencivelli, A. Marra, A. Schiavone and R. Tartaglia-Polcini (2016). “Offshore RMB Markets in Europe: Prospects for Greater Financial Integration between Europe and China.” Bank of Italy Occasional Paper Series No. 334.
PBC (2015). 2015 RMB Internationalization Report. The People’s Bank of China.

BOFIT- Institute for Economies in Transition Bank of Finland
BOFIT Discussion Papers 10/ 2017
21
Pontines V. and R.Y. Siregar (2012). “Fear of Appreciation in East and Southeast Asia: The Role of the Chinese Renminbi.” Journal of Asian Economics, 23(4): 324–334.
Rajan, R.S. (2012). “Management of Exchange Rate Regimes in Emerging Asia.” Review of De-velopment Finance, 2: 53–68.
Shu, C., D. He and X. Cheng (2015). “One Currency, Two Markets: The Renminbi’s Growing Influence in Asia-Pacific.” China Economic Review, 33:163–178.
Subramanian, A. and M. Kessler (2013). “The Renminbi Bloc is here: Asia Down, Rest of the World to Go?” Peterson Institute for International Economics Working Paper Series; WP 12–19.
Verdelhan, A. (2015). “The Share of Systematic Variation in Bilateral Exchange Rates.” Journal of Finance (forthcoming). Available at SSRN: https://ssrn.com/abstract=1930516

Daniela Marconi Currency co-movements in Asia-Pacific: The regional role of the Renminbi
22
Appendix A Table A1 Description of variables
Variable Description Additional information
𝑬𝑬𝒊𝒊𝒊𝒊𝑼𝑼𝑼𝑼𝑼𝑼𝒊𝒊
i-th currency to US dollar exchange rate i = Australian dollar, Hong Kong dollar,
Indian rupiah, Indonesian rupee, Korean won, Malaysian ringgit, New Zealand dollar, Philippines peso, Singaporean dollar, Thailand dollar and Taiwan dollar
𝑹𝑹𝑹𝑹𝑹𝑹𝒊𝒊
𝑼𝑼𝑼𝑼𝑼𝑼𝒊𝒊=𝑪𝑪𝑪𝑪𝑪𝑪𝒊𝒊𝑼𝑼𝑼𝑼𝑼𝑼𝒊𝒊
onshore Chinese RMB to US dollar exchange rate
GSCIt S&P GSCI Commodity Total Return
SOVXt JPM EMBI GLOBAL composite – stripped spread
REPOt CHINA REPO 1 WEEK middle rate
VIX Volatility index Chicago Board Options Exchange Volatility Index
REGit Trade-weighted dollar exchange rate index against a basket of AP currencies
𝑅𝑅𝑅𝑅𝐺𝐺𝑖𝑖𝑖𝑖 = ∑ 𝑒𝑒𝑠𝑠𝑖𝑖 ∗ 𝑤𝑤𝑠𝑠𝑖𝑖𝑠𝑠≠𝑖𝑖 ; 𝑖𝑖 ∈ 𝐴𝐴𝑅𝑅; 𝑠𝑠 ∈𝐴𝐴𝑅𝑅 ∑ 𝑤𝑤𝑠𝑠𝑖𝑖 = 1𝑠𝑠≠𝑖𝑖 . An increase indicates a dollar appreciation with respect to the basket of AP cur-rencies considered (excluding JPY and RMB).
GDt Trade-weighted US dollar exchange rate index against a basket of six major global currencies (provided by the Board of Governors of the Federal Reserve System).
Trade-weighted US dollar exchange rate with re-spect to the Canadian dollar, euro, Japanese yen, Swedish krona, Swiss franc and UK pound. An increase indicates a dollar appreciation against the basket of six major currencies.
Note: All data are retrieved from Thomson Reuters Datastream at daily frequencies. Table A2 Dollar appreciation and depreciation phases
Phase Dates
Appreciation 17/07/08-21/11/08; 18/12/08-03/03/09; 26/11/09-04/06/10; 27/08/11-24/07/12; 26/06/14-17/03/15; 30/09/16-31/01/2017
Depreciation 10/03/06-18/04/08; 22/11/08-17/12/08; 04/03/09-25/11/09; 05/06/10-29/04/11; 25/07/12-19/09/12;
Stability 05/09/05-09/03/06; 19/04/08-16/07/08; 30/04/11-26/08/11; 20/09/12-25/06/2014; 18/03/15-29/09/16
Note: The phases are detected from daily movements of the trade-weighted USD index against six currencies.

BOFIT Discussion Papers A series devoted to academic studies by BOFIT economists and guest researchers. The focus is on works relevant for economic policy and economic developments in transition / emerging economies.
BOFIT Discussion Papers http://www.bofit.fi/en • email: [email protected]
ISSN 1456-4564 (print) // ISSN 1456-5889 (online)
2016 No 1 Guonan Ma and Wang Yao: Can the Chinese bond market facilitate a globalizing renminbi? No 2 Iikka Korhonen and Riikka Nuutilainen: A monetary policy rule for Russia, or is it rules? No 3 Hüseyin Şen and Ayşe Kaya: Are the twin or triple deficits hypotheses applicable to post-communist countries? No 4 Alexey Ponomarenko: A note on money creation in emerging market economies No 5 Bing Xu, Honglin Wang and Adrian van Rixtel: Do banks extract informational rents through collateral? No 6 Zuzana Fungáčová, Anastasiya Shamshur and Laurent Weill: Does bank competition reduce cost of credit? Cross-country evidence from Europe No 7 Zuzana Fungáčová, Iftekhar Hasan and Laurent Weill: Trust in banks No 8 Diana Ayala, Milan Nedeljkovic and Christian Saborowski: What slice of the pie? The corporate bond market boom in emerging economies No 9 Timothy Frye and Ekaterina Borisova: Elections, protest and trust in government: A natural experiment from Russia No 10 Sanna Kurronen: Natural resources and capital structure No 11 Hongyi Chen, Michael Funke and Andrew Tsang: The diffusion and dynamics of producer prices, deflationary pressure across Asian countries, and the role of China No 12 Ivan Lyubimov: Corrupt bureaucrats, bad managers, and the slow race between education and technology No 13 Tri Vi Dang and Qing He: Bureaucrats as successor CEOs No 14 Oleksandr Faryna: Exchange rate pass-through and cross-country spillovers: Some evidence from Ukraine and Russia No 15 Paul D. McNelis: Optimal policy rules at home, crisis and quantitative easing abroad No 16 Mariarosaria Comunale and Heli Simola: The pass-through to consumer prices in CIS economies: The role of exchange rates, commodities and other common factors No 17 Paul Castañeda Dower and William Pyle: Land rights, rental markets and the post-socialist cityscape No 18 Zuzana Fungáčová, Ilari Määttä and Laurent Weill: What shapes social attitudes toward corruption in China? Micro-level evidence No 19 Qing He, Jiyuan Huang, Dongxu Li and Liping Lu: Banks as corporate monitors: Evidence from CEO turnovers in China No 20 Vladimir Sokolov and Laura Solanko: Political influence, firm performance and survival
2017 No 1 Koen Schoors, Maria Semenova and Andrey Zubanov: Depositor discipline in Russian regions: Flight to familiarity or trust in local authorities? No 2 Edward J. Balistreri, Zoryana Olekseyuk and David G. Tarr: Privatization and the unusual case of Belarusian accession to the WTO No 3 Hongyi Chen, Michael Funke, Ivan Lozev and Andrew Tsang: To guide or not to guide? Quantitative monetary policy tools and macroeconomic dynamics in China No 4 Soyoung Kim and Aaron Mehrotra: Effects of monetary and macroprudential policies – evidence from inflation targeting economies in the Asia-Pacific region and potential implications for China No 5 Denis Davydov, Zuzana Fungáčová and Laurent Weill: Cyclicality of bank liquidity creation No 6 Ravi Kanbur, Yue Wang and Xiaobo Zhang: The great Chinese inequality turnaround No 7 Yin-Wong Cheung, Cho-Hoi Hui and Andrew Tsang: The Renminbi central parity: An empirical investigation No 8 Chunyang Wang: Crony banking and local growth in China No 9 Zuzana Fungáčová and Laurent Weill: Trusting banks in China No 10 Daniela Marconi: Currency co-movements in Asia-Pacific: The regional role of the Renminbi