Embed Size (px)
Citation preview

Table 1. Number, percent distribution, and rate per 100,000 population of current hospice care patients by age, according to sex, race, andregion: United States, 2000
Age1
Sex Race Geographic region
Bothsexes Male Female White
Black andother2 Black Unknown Northeast Midwest South West
Number
Total . . . . . . . . . . . . . . . . . . . . . 105,500 44,900 60,600 87,300 13,000 11,200 5,200 23,200 20,500 39,800 22,000Under 65 years . . . . . . . . . . . . . . 19,600 9,200 10,500 13,500 5,300 4,800 * *2,800 3,600 10,200 3,000
Under 45 years . . . . . . . . . . . . . 4,800 3,000 *1,800 *2,900 *1,300 * * * * 2,400 *45–64 years . . . . . . . . . . . . . . . 14,800 6,200 8,700 10,500 *4,000 *3,600 * *2,400 2,300 7,800 2,400
65 years and over . . . . . . . . . . . . . 85,900 35,700 50,100 73,900 5,300 6,300 4,400 20,400 16,900 29,600 18,90065–69 years . . . . . . . . . . . . . . . 7,700 4,700 3,000 6,300 * * * * *1,300 4,100 *1,40070–74 years . . . . . . . . . . . . . . . 10,500 5,900 4,500 9,500 * * * *2,800 1,800 2,900 3,00075–79 years . . . . . . . . . . . . . . . 22,100 9,800 12,300 19,200 *2,200 *1,900 * *7,200 3,800 7,000 4,20080–84 years . . . . . . . . . . . . . . . 16,900 6,400 10,600 12,800 *2,400 *2,200 * *3,400 4,300 5,900 3,40085 years and over . . . . . . . . . . . 28,700 9,000 19,700 26,000 *1,600 *1,100 * 6,300 5,700 9,700 7,100
Percent distribution
Total . . . . . . . . . . . . . . . . . . . . . 100.0 100.0 100.0 100.0 100.0 100.0 100.0 100.0 100.0 100.0 100.0Under 65 years . . . . . . . . . . . . . . 18.6 20.4 17.2 15.4 41.1 43.3 * *11.9 17.5 25.6 13.8
Under 45 years . . . . . . . . . . . . . 4.5 6.7 *3.0 *3.3 *10.2 * * * * 6.1 *45–64 years . . . . . . . . . . . . . . . 14.1 13.7 14.3 12.1 *30.9 *32.5 * *10.5 11.1 19.5 10.7
65 years and over . . . . . . . . . . . . . 81.4 79.6 82.8 84.6 58.9 56.7 84.1 88.1 82.5 74.4 86.265–69 years . . . . . . . . . . . . . . . 7.3 10.4 4.9 7.3 * * * * *6.5 10.4 *6.270–74 years . . . . . . . . . . . . . . . 9.9 13.2 7.5 10.9 *5.9 * * *12.0 8.6 7.4 13.675–79 years . . . . . . . . . . . . . . . 20.9 21.7 20.3 22.0 *16.9 *17.1 * *30.9 18.4 17.5 19.080–84 years . . . . . . . . . . . . . . . 16.1 14.1 17.5 14.7 *18.7 *20.1 * *14.5 21.2 14.7 15.385 years and over . . . . . . . . . . . 27.2 20.1 32.6 29.7 *12.5 *10.0 * 27.1 27.9 24.3 32.1
Rate per 100,000 population3
Total . . . . . . . . . . . . . . . . . . . . . 37.9 33.0 42.6 38.4 20.1 30.6 . . . 44.2 32.1 40.3 34.9Under 65 years . . . . . . . . . . . . . . 8.0 7.5 8.6 6.8 9.0 14.4 . . . *6.1 6.4 11.8 5.4
Under 45 years . . . . . . . . . . . . . 2.6 3.2 *2.0 2.0 *2.8 * . . . * * 3.8 1.645–64 years . . . . . . . . . . . . . . . 24.3 20.9 27.6 20.4 *33.7 *55.2 . . . *20.7 16.2 35.5 17.8
65 years and over . . . . . . . . . . . . . 249.1 248.4 249.6 241.5 109.1 218.7 . . . 281.4 208.2 243.8 272.465–69 years . . . . . . . . . . . . . . . 67.3 89.0 48.7 64.7 * * . . . * *62.3 121.4 *71.470–74 years . . . . . . . . . . . . . . . 121.0 154.2 94.4 124.1 *59.6 * . . . *155.1 87.8 94.5 170.875–79 years . . . . . . . . . . . . . . . 300.3 315.9 289.1 291.2 *230.8 *342.3 . . . *455.9 219.6 272.3 277.980–84 years . . . . . . . . . . . . . . . 348.2 342.0 352.0 290.9 *434.3 *666.4 . . . *318.7 365.0 357.5 343.985 years and over . . . . . . . . . . . 673.3 698.7 662.3 673.3 *319.4 *351.9 . . . 662.8 532.1 682.6 852.6
* Figure does not meet standard of reliability or precision because the sample size is less than 30 if shown without an estimate. If shown with an estimate, the sample size is between 30 and 59, or thesample size is greater than 59 but has a relative standard error of 30 percent or more.
. . . Category not applicable.1Age is the patient’s age at the time of survey.2Other race includes Asian, Native Hawaiian or other Pacific Islander, American Indian or Alaska Native, and multiple races. All race categories include persons of Hispanic and not-Hispanic origin.Persons of Hispanic origin may be of any race. Starting with data year 1999, race-specific estimates have been tabulated according to 1997 Standards for Federal Data on Race and Ethnicity and arenot strictly comparable with estimates for earlier years. However, only a small number of records had multiple races indicated.3Population estimates used to compute rates are for the civilian population of the United States, including institutionalized persons; are postcensal estimates, as of July 1, 2000; are based on the 1990census; and are from unpublished tabulations provided by the U.S. Census Bureau. Population estimates have been adjusted for net underenumeration using the 1990 National Population AdjustmentMatrix.
NOTES: Numbers may not add to totals because of rounding. Percentages and rates are based on the unrounded numbers.
Current Hospice Care Patients [ February 2004 [ Page 1

Table 2. Number and percent distribution of current hospice care patients and mean and median length of service in days, by selectedagency characteristics: United States, 2000
Agency characteristic NumberPercent
distributionMean length ofservice in days
Median length ofservice in days
Total . . . . . . . . . . . . . . . . . . . . . . . . . . . . . . . 105,500 100 129 58
OwnershipProprietary . . . . . . . . . . . . . . . . . . . . . . . . . . . 23,600 22.4 144 71Voluntary nonprofit . . . . . . . . . . . . . . . . . . . . . . 77,200 73.2 115 54Government and other. . . . . . . . . . . . . . . . . . . . *4,700 *4.5 *268 *59
Geographic region
Northeast . . . . . . . . . . . . . . . . . . . . . . . . . . . . 23,200 22.0 75 47Midwest. . . . . . . . . . . . . . . . . . . . . . . . . . . . . 20,500 19.5 143 62South . . . . . . . . . . . . . . . . . . . . . . . . . . . . . . 39,800 37.7 146 *76West. . . . . . . . . . . . . . . . . . . . . . . . . . . . . . . 22,000 20.8 140 *76
Certification
Certified1 . . . . . . . . . . . . . . . . . . . . . . . . . . . . 104,424 99.0 128 58Not certified . . . . . . . . . . . . . . . . . . . . . . . . . . 1,100 1.0 183 *85
Location of agency
Metropolitan statistical area. . . . . . . . . . . . . . . . . 77,400 73.4 116 51Nonmetropolitan statistical area . . . . . . . . . . . . . . 28,100 26.6 163 *88
Affiliation
Affiliated2 . . . . . . . . . . . . . . . . . . . . . . . . . . . . 62,800 59.6 145 65Not affiliated . . . . . . . . . . . . . . . . . . . . . . . . . . 42,700 40.4 104 50
* Figure does not meet standard of reliability or precision because the sample size is less than 30 if shown without an estimate. If shown with an estimate, the sample size is between 30 and 59, or thesample size is greater than 59 but has a relative standard error of 30 percent or more.1Includes agencies certified by Medicare and/or Medicaid.2Includes agencies that are part of a chain, operated by a hospital, operated by a nursing home, or operated by a health maintenance organization.
NOTES: Numbers may not add to totals because of rounding. Percentages and lengths of service are based on the unrounded numbers.
Current Hospice Care Patients [ February 2004 [ Page 2

Table 3. Number and percent of current hospice care patients and mean and median length of service in days, by agency certificationstatus and affiliation: United States, 2000
Agency characteristic Number PercentMean length ofservice in days
Median length ofservice in days
Total . . . . . . . . . . . . . . . . . . . . . . . . . . . . . . . 105,500 . . . 129 58
Certification
Certified by Medicare1 . . . . . . . . . . . . . . . . . . . . 104,100 98.7 128 58As a home health agency . . . . . . . . . . . . . . . . 63,100 59.8 127 *50As a hospice . . . . . . . . . . . . . . . . . . . . . . . . 93,700 88.8 115 52
Certified by Medicaid1 . . . . . . . . . . . . . . . . . . . . 101,000 95.7 128 57As a home health agency . . . . . . . . . . . . . . . . 62,500 59.3 127 *50As a hospice . . . . . . . . . . . . . . . . . . . . . . . . 89,800 85.2 115 51
Not certified . . . . . . . . . . . . . . . . . . . . . . . . . . 1,100 1.0 183 *85
Affiliation
Affiliated1 . . . . . . . . . . . . . . . . . . . . . . . . . . . . 62,800 59.6 145 65Part of group or chain. . . . . . . . . . . . . . . . . . . 46,200 43.8 153 *69Operated by a hospital . . . . . . . . . . . . . . . . . . 26,200 24.8 128 48Operated by a nursing home . . . . . . . . . . . . . . * * * *Operated by a health maintenance organization . . *3,800 *3.6 *74 *16
. . . Category not applicable.
* Figure does not meet standard of reliability or precision because the sample size is less than 30 if shown without an estimate. If shown with an estimate, the sample size is between 30 and 59, or thesample size is greater than 59 but has a relative standard error of 30 percent or more.1Numbers will not add to totals because a patient may be included in more than one category.
NOTES: Numbers may not add to totals because of rounding. Percentages and lengths of service are based on the unrounded numbers.
Current Hospice Care Patients [ February 2004 [ Page 3

Table 4. Number and percent distribution of current hospice care patients and mean and median length of service in days, by selectedcharacteristics: United States, 2000
Patient characteristic NumberPercent
distributionMean length ofservice in days
Median length ofservice in days
Total . . . . . . . . . . . . . . . . . . . . . . . . . . . . . . . 105,500 100.0 129 58
Age1
Under 65 years . . . . . . . . . . . . . . . . . . . . . . . . 19,600 18.6 163 89Under 45 years. . . . . . . . . . . . . . . . . . . . . . . 4,800 4.5 *269 *10745–64 years. . . . . . . . . . . . . . . . . . . . . . . . . 14,800 14.1 129 *87
65 years and over . . . . . . . . . . . . . . . . . . . . . . 85,900 81.4 121 5265–69 years. . . . . . . . . . . . . . . . . . . . . . . . . 7,700 7.3 *125 *4870–74 years. . . . . . . . . . . . . . . . . . . . . . . . . 10,500 9.9 159 *4975–79 years. . . . . . . . . . . . . . . . . . . . . . . . . 22,100 20.9 107 5180–84 years. . . . . . . . . . . . . . . . . . . . . . . . . 16,900 16.1 104 5285 years and over . . . . . . . . . . . . . . . . . . . . . 28,700 27.3 127 61
Sex
Male . . . . . . . . . . . . . . . . . . . . . . . . . . . . . . . 44,900 42.6 118 53Female . . . . . . . . . . . . . . . . . . . . . . . . . . . . . 60,600 57.4 136 59
Hispanic or Latino origin
Hispanic . . . . . . . . . . . . . . . . . . . . . . . . . . . . *5,400 *5.1 *211 *156Not-Hispanic . . . . . . . . . . . . . . . . . . . . . . . . . . 83,400 79.1 128 58Unknown . . . . . . . . . . . . . . . . . . . . . . . . . . . . 16,700 15.8 108 47
Race
White . . . . . . . . . . . . . . . . . . . . . . . . . . . . . . 87,300 82.8 132 59Black and other2 . . . . . . . . . . . . . . . . . . . . . . . 13,000 12.3 121 50
Black . . . . . . . . . . . . . . . . . . . . . . . . . . . . 11,200 10.6 122 *49Unknown . . . . . . . . . . . . . . . . . . . . . . . . . . . . 5,200 5.0 99 *47
Marital status
Married . . . . . . . . . . . . . . . . . . . . . . . . . . . . . 45,000 42.7 129 52Widowed . . . . . . . . . . . . . . . . . . . . . . . . . . . . 38,800 36.7 117 58Divorced or separated . . . . . . . . . . . . . . . . . . . . 6,700 6.3 128 *72Single or never married . . . . . . . . . . . . . . . . . . . 9,700 9.2 *182 *43Unknown . . . . . . . . . . . . . . . . . . . . . . . . . . . . 5,300 5.0 116 *74
Primary expected source of payment
Private insurance, own income, or family support . . . 9,300 8.8 97 *40Medicare . . . . . . . . . . . . . . . . . . . . . . . . . . . . 84,700 80.3 125 59Medicaid . . . . . . . . . . . . . . . . . . . . . . . . . . . . 7,000 6.6 *201 *42All other sources3. . . . . . . . . . . . . . . . . . . . . . . 4,500 4.3 149 106
* Figure does not meet standard of reliability or precision because the sample size is less than 30 if shown without an estimate. If shown with an estimate, the sample size is between 30 and 59, or thesample size is greater than 59 but has a relative standard error of 30 percent or more.1Age is the patient’s age at the time of survey.2Other race includes Asian, Native Hawaiian or other Pacific Islander, American Indian or Alaska Native, and multiple races. All race categories include persons of Hispanic and not-Hispanic origin.Persons of Hispanic origin may be of any race. Starting with data year 1999, race-specific estimates have been tabulated according to 1997 Standards for Federal Data on Race and Ethnicity and arenot strictly comparable with estimates for earlier years. However, only a small number of records had multiple races indicated.3Includes unknown, no charge for care, and payment source not yet determined.
NOTES: Numbers may not add to totals because of rounding. Percentages and lengths of service are based on the unrounded numbers.
Current Hospice Care Patients [ February 2004 [ Page 4

Table 5. Number and percent distribution of current hospice care patients and mean and median length of service in days, by residence,living arrangements, and caregiver status: United States, 2000
Patient characteristic NumberPercent
distributionMean length ofservice in days
Median length ofservice in days
Total . . . . . . . . . . . . . . . . . . . . . . . . . . . . . . . 105,500 100.0 129 58
Residence
Private or semiprivate residence . . . . . . . . . . . . . 81,300 77.1 131 58Board and care or residential care facility . . . . . . . . 4,300 4.1 96 46Health facility1 . . . . . . . . . . . . . . . . . . . . . . . . . 18,500 17.6 131 65Other or unknown . . . . . . . . . . . . . . . . . . . . . . * * * *
Living arrangements2
Living alone . . . . . . . . . . . . . . . . . . . . . . . . . . 10,300 12.7 111 *66Living with family members . . . . . . . . . . . . . . . . . 67,300 82.8 136 57Living only with nonfamily members . . . . . . . . . . . 3,000 3.7 105 *72Living arrangement unknown. . . . . . . . . . . . . . . . * * * *
Caregiver status
Has primary caregiver . . . . . . . . . . . . . . . . . . . .Yes . . . . . . . . . . . . . . . . . . . . . . . . . . . . . . 97,300 92.2 127 58No. . . . . . . . . . . . . . . . . . . . . . . . . . . . . . . 6,200 5.9 11 41Unknown . . . . . . . . . . . . . . . . . . . . . . . . . . * * * *
Lives with primary caregiver3. . . . . . . . . . . . . . . .Yes . . . . . . . . . . . . . . . . . . . . . . . . . . . . . . 72,000 74.0 131 62No. . . . . . . . . . . . . . . . . . . . . . . . . . . . . . . 21,500 22.0 120 *44Unknown . . . . . . . . . . . . . . . . . . . . . . . . . . *3,800 *3.9 *100 *113
Relationship to primary caregiver3 . . . . . . . . . . . .Spouse. . . . . . . . . . . . . . . . . . . . . . . . . . . . 36,300 37.4 124 51Child/child-in-law . . . . . . . . . . . . . . . . . . . . . . 37,000 38.1 113 51Other relative or parent . . . . . . . . . . . . . . . . . . 5,200 5.3 297 106Paid help4 . . . . . . . . . . . . . . . . . . . . . . . . . . 14,800 15.2 116 *71Neighbor, friend, other, and unknown . . . . . . . . . 4,000 4.1 113 *42
* Figure does not meet standard of reliability or precision because the sample size is less than 30 if shown without an estimate. If shown with an estimate, the sample size is between 30 and 59, or thesample size is greater than 59 but has a relative standard error of 30 percent or more.1Includes nursing home, hospital, or other inpatient health facility (including mental health facility).2Includes patients living in private or semiprivate residences only.3Includes patients with a primary caregiver only.4Includes staff of facility where patient resides.
NOTES: Numbers may not add to totals because of rounding. Percentages and lengths of service are based on the unrounded numbers.
Current Hospice Care Patients [ February 2004 [ Page 5

Table 6. Number of current hospice care patients by services received, by sex and race: United States, 2000
Selected services1 Number
Sex Race
Male Female WhiteBlack and
other2 Black Unknown
All patients3 . . . . . . . . . . . . . . . . . . . . . . . . . . 105,500 44,900 60,600 87,300 13,000 11,200 5,200
Medical and/or skilled nursing
Total medical and/or skilled nursing. . . . . . . . . . . . 95,100 41,200 53,900 80,200 10,500 8,800 4,400
Physician . . . . . . . . . . . . . . . . . . . . . . . . . . . 27,200 10,700 16,600 21,500 4,900 3,800 *Skilled nursing . . . . . . . . . . . . . . . . . . . . . . . . 92,700 40,500 52,200 78,300 10,100 8,700 4,300
Equipment and/or medication
Total equipment and/or medication . . . . . . . . . . . . 63,200 26,200 37,000 52,400 7,900 6,400 2,900
Durable medical equipment and supplies . . . . . . . . 46,600 18,500 28,100 39,000 5,800 4,700 *1,900Medications . . . . . . . . . . . . . . . . . . . . . . . . . . 58,000 24,800 33,200 48,000 7,400 6,000 2,700
Personal care
Total personal care . . . . . . . . . . . . . . . . . . . . . . 80,400 32,600 47,800 67,200 10,000 8,500 3,200
Continuous home care . . . . . . . . . . . . . . . . . . . *2,200 * *1,600 *1,700 * * *Companion or volunteer . . . . . . . . . . . . . . . . . . 39,900 18,300 21,600 33,100 5,600 4,800 *1,100Homemaker-household4. . . . . . . . . . . . . . . . . . . 71,600 28,500 43,000 60,200 8,200 6,900 3,200Respite care . . . . . . . . . . . . . . . . . . . . . . . . . . 6,900 *3,300 3,600 4,700 * * *
Therapeutic
Total therapeutic . . . . . . . . . . . . . . . . . . . . . . . 33,700 13,200 20,500 28,300 4,900 *4,000 *
Occupational, physical, and speech therapy . . . . . . 9,000 *3,200 *5,800 8,400 * * *High tech care5 . . . . . . . . . . . . . . . . . . . . . . . . 16,100 6,700 9,400 12,400 *3,500 *2,700 *Other6. . . . . . . . . . . . . . . . . . . . . . . . . . . . . . 14,200 5,600 8,700 11,800 *2,100 *1,700 *
Psychosocial
Total psychosocial . . . . . . . . . . . . . . . . . . . . . . 84,200 36,900 47,300 70,700 10,000 8,400 *3,600
Counseling or psychological . . . . . . . . . . . . . . . . 34,200 14,200 20,000 27,500 5,300 *4,500 *1,400Pastoral and/or spiritual care . . . . . . . . . . . . . . . . 52,900 20,300 32,700 44,500 7,100 6,100 *1,300Referral and/or social . . . . . . . . . . . . . . . . . . . . 67,300 30,400 36,900 55,800 8,300 6,800 3,300
Other services7 . . . . . . . . . . . . . . . . . . . . . . . . 8,700 *2,500 *6,200 *7,200 *1,400 * *
* Figure does not meet standard of reliability or precision because the sample size is less than 30 if shown without an estimate. If shown with an estimate, the sample size is between 30 and 59, or thesample size is greater than 59 but has a relative standard error of 30 percent or more.1Numbers will not add to totals because a patient may be included in more than one category.2Other race includes Asian, Native Hawaiian or other Pacific Islander, American Indian or Alaska Native, and multiple races. All race categories include persons of Hispanic and not-Hispanic origin.Persons of Hispanic origin may be of any race. Starting with data year 1999, race-specific estimates have been tabulated according to 1997 Standards for Federal Data on Race and Ethnicity and arenot strictly comparable with estimates for earlier years. However, only a small number of records had multiple races indicated.3Total number of hospice care patients.4Includes personal care services and Meals on Wheels.5Includes enterostomal therapy, intravenous therapy, respiratory therapy, and other high tech care such as such as enteral nutrition or dialysis.6Includes dietary/nutritional services and vocational therapy.7Includes dental, transportation, and other services.
Current Hospice Care Patients [ February 2004 [ Page 6

Table 7. Number of current hospice care patients by services received, by age: United States, 2000
Selected services2 Number
Age1
Under 65years
65 yearsand over
65–74years
75–84years
85 yearsand over
All patients3 . . . . . . . . . . . . . . . . . . . . . . . . . . 105,500 19,600 85,900 18,100 39,000 28,700
Medical and/or skilled nursing
Total medical and/or skilled nursing. . . . . . . . . . . . 95,100 17,500 77,600 17,200 35,500 24,900
Physician . . . . . . . . . . . . . . . . . . . . . . . . . . . 27,200 3,800 23,500 5,000 11,400 7,000Skilled nursing . . . . . . . . . . . . . . . . . . . . . . . . 92,700 17,200 75,500 16,700 34,700 24,200
Equipment and/or medication
Total equipment and/or medication . . . . . . . . . . . . 63,200 9,600 53,700 12,800 22,900 17,900
Durable medical equipment and supplies . . . . . . . . 46,600 7,000 39,600 8,500 17,400 13,600Medications . . . . . . . . . . . . . . . . . . . . . . . . . . 58,000 8,500 49,500 11,400 21,500 16,700
Personal care
Total personal care . . . . . . . . . . . . . . . . . . . . . . 80,400 12,200 68,200 13,800 29,600 24,700
Continuous home care . . . . . . . . . . . . . . . . . . . *2,200 * *1,600 * * *Companion or volunteer. . . . . . . . . . . . . . . . . . . 39,900 7,100 32,800 8,000 14,500 10,300Homemaker-household4. . . . . . . . . . . . . . . . . . . 71,600 9,500 62,100 12,000 27,200 22,800Respite care . . . . . . . . . . . . . . . . . . . . . . . . . . 6,900 *2,100 4,800 *1,800 *2,700 *
Therapeutic
Total therapeutic . . . . . . . . . . . . . . . . . . . . . . . 33,700 6,400 27,400 5,500 13,700 8,100
Occupational, physical, and speech therapy . . . . . . 9,000 * *7,700 * *3,800 *High tech care5 . . . . . . . . . . . . . . . . . . . . . . . . 16,100 4,500 11,700 2,900 5,600 *3,200Other6. . . . . . . . . . . . . . . . . . . . . . . . . . . . . . 14,200 *2,200 12,000 *2,700 5,600 3,700
Psychosocial
Total psychosocial . . . . . . . . . . . . . . . . . . . . . . 84,200 14,500 69,700 16,300 30,300 23,100
Counseling or psychological . . . . . . . . . . . . . . . . 34,200 7,500 26,700 6,500 14,000 6,200Pastoral and/or spiritual care . . . . . . . . . . . . . . . . 52,900 8,200 44,700 8,900 19,200 16,500Referral and/or social . . . . . . . . . . . . . . . . . . . . 67,300 10,100 57,100 13,600 25,800 17,800
Other services7 . . . . . . . . . . . . . . . . . . . . . . . . 8,700 *1,900 6,800 *1,500 *3,600 *1,700
* Figure does not meet standard of reliability or precision because the sample size is less than 30 if shown without an estimate. If shown with an estimate, the sample size is between 30 and 59, or thesample size is greater than 59 but has a relative standard error of 30 percent or more.1Age is patient’s age at time of survey.2Numbers will not add to totals because a patient may be included in more than one category.3Total number of hospice care patients.4Includes personal care services and Meals on Wheels.5Includes enterostomal therapy, intravenous therapy, respiratory therapy, and other high tech care such as enteral nutrition and dialysis.6Includes dietary and/or nutritional services and vocational therapy.7Includes dental, transportation, and other services.
Current Hospice Care Patients [ February 2004 [ Page 7
Current Hospice Care Patients [ February 2004 [ Page 8
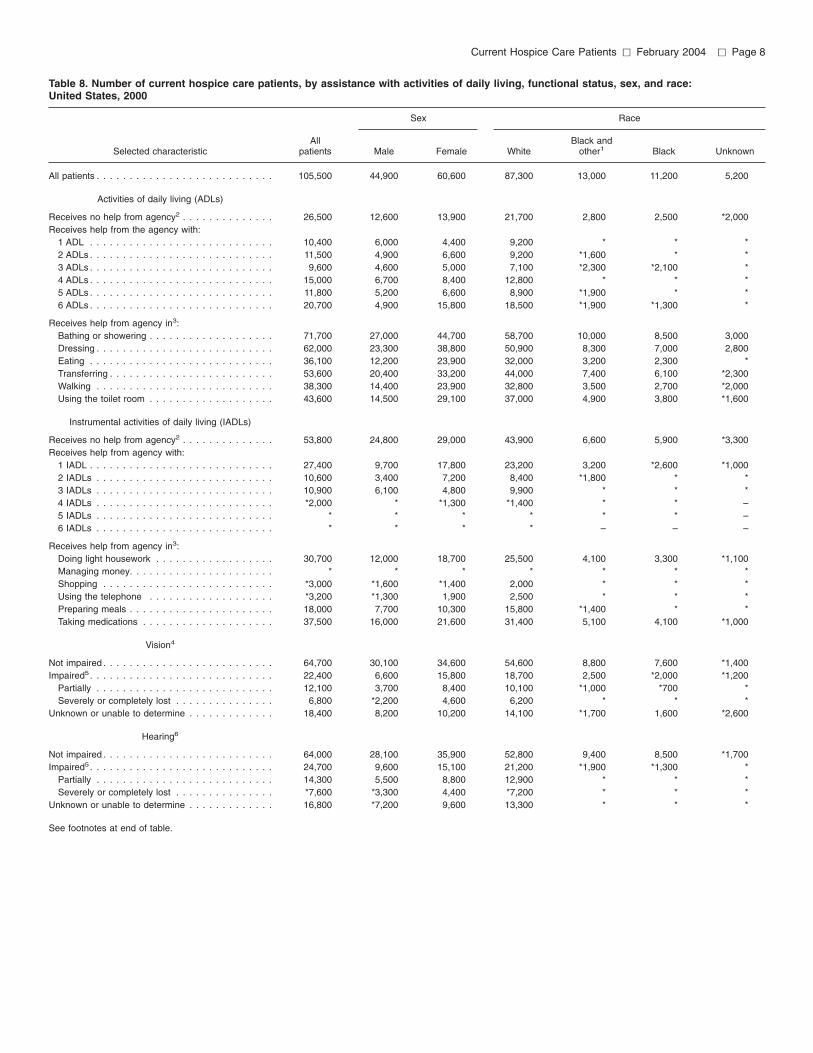
Table 8. Number of current hospice care patients, by assistance with activities of daily living, functional status, sex, and race: United States, 2000
Sex Race
All Black and Selected characteristic patients Male Female White other1 Black Unknown
All patients . . . . . . . . . . . . . . . . . . . . . . . . . . . 105,500 44,900 60,600 87,300 13,000 11,200 5,200
Activities of daily living (ADLs)
Receives no help from agency2 . . . . . . . . . . . . . . 26,500 12,600 13,900 21,700 2,800 2,500 *2,000 Receives help from the agency with:
1 ADL . . . . . . . . . . . . . . . . . . . . . . . . . . . . 10,400 6,000 4,400 9,200 * * * 2 ADLs . . . . . . . . . . . . . . . . . . . . . . . . . . . . 11,500 4,900 6,600 9,200 *1,600 * * 3 ADLs . . . . . . . . . . . . . . . . . . . . . . . . . . . . 9,600 4,600 5,000 7,100 *2,300 *2,100 * 4 ADLs . . . . . . . . . . . . . . . . . . . . . . . . . . . . 15,000 6,700 8,400 12,800 * * * 5 ADLs . . . . . . . . . . . . . . . . . . . . . . . . . . . . 11,800 5,200 6,600 8,900 *1,900 * * 6 ADLs . . . . . . . . . . . . . . . . . . . . . . . . . . . . 20,700 4,900 15,800 18,500 *1,900 *1,300 *
Receives help from agency in3: Bathing or showering . . . . . . . . . . . . . . . . . . . 71,700 27,000 44,700 58,700 10,000 8,500 3,000 Dressing . . . . . . . . . . . . . . . . . . . . . . . . . . . 62,000 23,300 38,800 50,900 8,300 7,000 2,800 Eating . . . . . . . . . . . . . . . . . . . . . . . . . . . . 36,100 12,200 23,900 32,000 3,200 2,300 * Transferring . . . . . . . . . . . . . . . . . . . . . . . . . 53,600 20,400 33,200 44,000 7,400 6,100 *2,300 Walking . . . . . . . . . . . . . . . . . . . . . . . . . . . 38,300 14,400 23,900 32,800 3,500 2,700 *2,000 Using the toilet room . . . . . . . . . . . . . . . . . . . 43,600 14,500 29,100 37,000 4,900 3,800 *1,600
Instrumental activities of daily living (IADLs)
Receives no help from agency2 . . . . . . . . . . . . . . 53,800 24,800 29,000 43,900 6,600 5,900 *3,300 Receives help from agency with:
1 IADL . . . . . . . . . . . . . . . . . . . . . . . . . . . . 27,400 9,700 17,800 23,200 3,200 *2,600 *1,000 2 IADLs . . . . . . . . . . . . . . . . . . . . . . . . . . . 10,600 3,400 7,200 8,400 *1,800 * * 3 IADLs . . . . . . . . . . . . . . . . . . . . . . . . . . . 10,900 6,100 4,800 9,900 * * * 4 IADLs . . . . . . . . . . . . . . . . . . . . . . . . . . . *2,000 * *1,300 *1,400 * * – 5 IADLs . . . . . . . . . . . . . . . . . . . . . . . . . . . * * * * * * – 6 IADLs . . . . . . . . . . . . . . . . . . . . . . . . . . . * * * * – – –
Receives help from agency in3: Doing light housework . . . . . . . . . . . . . . . . . . 30,700 12,000 18,700 25,500 4,100 3,300 *1,100 Managing money. . . . . . . . . . . . . . . . . . . . . . * * * * * * * Shopping . . . . . . . . . . . . . . . . . . . . . . . . . . *3,000 *1,600 *1,400 2,000 * * * Using the telephone . . . . . . . . . . . . . . . . . . . *3,200 *1,300 1,900 2,500 * * * Preparing meals . . . . . . . . . . . . . . . . . . . . . . 18,000 7,700 10,300 15,800 *1,400 * * Taking medications . . . . . . . . . . . . . . . . . . . . 37,500 16,000 21,600 31,400 5,100 4,100 *1,000
Vision4
Not impaired . . . . . . . . . . . . . . . . . . . . . . . . . . 64,700 30,100 34,600 54,600 8,800 7,600 *1,400 Impaired5 . . . . . . . . . . . . . . . . . . . . . . . . . . . . 22,400 6,600 15,800 18,700 2,500 *2,000 *1,200
Partially . . . . . . . . . . . . . . . . . . . . . . . . . . . 12,100 3,700 8,400 10,100 *1,000 *700 * Severely or completely lost . . . . . . . . . . . . . . . 6,800 *2,200 4,600 6,200 * * *
Unknown or unable to determine . . . . . . . . . . . . . 18,400 8,200 10,200 14,100 *1,700 1,600 *2,600
Hearing6
Not impaired . . . . . . . . . . . . . . . . . . . . . . . . . . 64,000 28,100 35,900 52,800 9,400 8,500 *1,700 Impaired5 . . . . . . . . . . . . . . . . . . . . . . . . . . . . 24,700 9,600 15,100 21,200 *1,900 *1,300 *
Partially . . . . . . . . . . . . . . . . . . . . . . . . . . . 14,300 5,500 8,800 12,900 * * * Severely or completely lost . . . . . . . . . . . . . . . *7,600 *3,300 4,400 *7,200 * * *
Unknown or unable to determine . . . . . . . . . . . . . 16,800 *7,200 9,600 13,300 * * *
See footnotes at end of table.

Current Hospice Care Patients [ February 2004 [ Page 9
Table 8. Number of current hospice care patients, by assistance with activities of daily living, functional status, sex, and race: United States, 2000—Con.
Sex Race
All Black and Selected characteristic patients Male Female White other1 Black Unknown
Continence
No difficulty . . . . . . . . . . . . . . . . . . . . . . . . . . 61,400 30,000 31,400 51,100 7,500 6,100 2,800 Has difficulty controlling:
Bladder7 . . . . . . . . . . . . . . . . . . . . . . . . . . . 11,200 4,700 6,500 9,200 * * * Bowels8 . . . . . . . . . . . . . . . . . . . . . . . . . . . 10,600 2,900 7,700 8,800 *1,300 *1,200 * Bladder and bowels7,8 . . . . . . . . . . . . . . . . . . 22,300 7,300 15,100 18,100 *3,500 *3,200 *
Has indwelling urinary catheter or urostomy . . . . . . 22,000 8,600 13,400 18,300 3,000 *2,600 * Receives help from agency in caring for this device 20,200 7,700 12,500 17,100 *2,400 *2,000 *
* Figure does not meet standard of reliability or precision because the sample size is less than 30 if shown without an estimate. If shown with an estimate, the sample size is between 30 and 59, or the sample size is greater than 59 but has a relative standard error of 30 percent or more.
– Quantity zero. 1Other race includes Asian, Native Hawaiian or other Pacific Islander, American Indian or Alaska Native, and multiple races. All race categories include persons of Hispanic and not-Hispanic origin. Persons of Hispanic origin may be of any race. Starting with data year 1999, race-specific estimates have been tabulated according to 1997 Standards for Federal Data on Race and Ethnicity and are not strictly comparable with estimates for earlier years. However, only a small number of records had multiple races indicated. 2Includes an unknown number of patients who were bedbound or received help only from nonagency persons. 3Numbers will not add to totals because a patient may be included in more than one category. 4Status when using eyeglasses or contact lenses if applicable. 5Total number of impaired includes patients for whom the level of impairment is unknown. 6Status when using a hearing aid if applicable. 7Excludes patients with an indwelling urinary catheter or urostomy. 8Excludes patients with an ileostomy or colostomy.
NOTE: Numbers may not add to totals because of rounding.

Current Hospice Care Patients [ February 2004 [ Page 10
Table 9. Number of current hospice care patients, by assistance with activities of daily living, functional status, and age: United States, 2000
Age1
Under 65 65 years 65–74 75–84 85 years Selected characteristic Number years and over years years and over
All patients . . . . . . . . . . . . . . . . . . . . . . . . . . . 105,500 19,600 85,900 18,100 39,000 28,700
Activities of daily living (ADLs)
Receives no help from agency2 . . . . . . . . . . . . . . 26,500 8,400 18,200 5,100 8,600 4,500 Receives help from the agency with:
1 ADL . . . . . . . . . . . . . . . . . . . . . . . . . . . . 10,400 * 7,500 *600 *4,200 * 2 ADLs . . . . . . . . . . . . . . . . . . . . . . . . . . . . 11,500 *2,200 9,300 *3,000 4,200 2,100 3 ADLs . . . . . . . . . . . . . . . . . . . . . . . . . . . . 9,600 *2,700 6,900 *900 2,600 3,400 4 ADLs . . . . . . . . . . . . . . . . . . . . . . . . . . . . 15,000 *800 14,200 *3,100 6,800 4,200 5 ADLs . . . . . . . . . . . . . . . . . . . . . . . . . . . . 11,800 *1,100 10,700 2,200 5,100 3,400 6 ADLs . . . . . . . . . . . . . . . . . . . . . . . . . . . . 20,700 *1,600 19,100 3,200 7,400 8,500
Receives help from agency in3: Bathing or showering . . . . . . . . . . . . . . . . . . . 71,700 9,900 61,800 12,300 27,100 22,400 Dressing . . . . . . . . . . . . . . . . . . . . . . . . . . . 62,000 7,300 54,700 10,600 23,400 20,700 Eating . . . . . . . . . . . . . . . . . . . . . . . . . . . . 36,100 2,800 33,300 4,800 14,400 14,200 Transferring . . . . . . . . . . . . . . . . . . . . . . . . . 53,600 6,300 47,300 10,300 19,700 17,400 Walking . . . . . . . . . . . . . . . . . . . . . . . . . . . 38,300 3,600 34,700 7,200 15,400 12,100 Using the toilet room . . . . . . . . . . . . . . . . . . . 43,600 3,700 39,900 7,100 17,700 15,100
Instrumental activities of daily living (IADLs)
Receives no help from agency2 . . . . . . . . . . . . . . 53,800 10,700 43,100 8,600 22,400 12,100 Receives help from agency with:
1 IADL . . . . . . . . . . . . . . . . . . . . . . . . . . . . 27,400 6,300 21,100 5,000 9,100 7,100 2 IADLs . . . . . . . . . . . . . . . . . . . . . . . . . . . 10,600 *1,400 9,200 *1,000 *3,600 *4,600 3 IADLs . . . . . . . . . . . . . . . . . . . . . . . . . . . 10,900 * 10,200 *2,400 *3,300 *4,500 4 IADLs . . . . . . . . . . . . . . . . . . . . . . . . . . . *2,000 * *1,700 * * * 5 IADLs . . . . . . . . . . . . . . . . . . . . . . . . . . . * * * * * * 6 IADLs . . . . . . . . . . . . . . . . . . . . . . . . . . . * * * * * *
Receives help from agency in3: Doing light housework . . . . . . . . . . . . . . . . . . 30,700 5,400 25,300 6,000 8,400 10,800 Managing money. . . . . . . . . . . . . . . . . . . . . . * * * * * * Shopping . . . . . . . . . . . . . . . . . . . . . . . . . . *3,000 * 2,500 * * * Using the telephone . . . . . . . . . . . . . . . . . . . *3,200 * 2,600 * * * Preparing meals . . . . . . . . . . . . . . . . . . . . . . 18,000 *1,200 16,800 3,800 5,000 8,000 Taking medications . . . . . . . . . . . . . . . . . . . . 37,500 5,300 32,300 7,400 13,200 11,700
Vision4
Not impaired . . . . . . . . . . . . . . . . . . . . . . . . . . 64,700 15,200 49,500 13,800 23,000 12,700 Impaired5 . . . . . . . . . . . . . . . . . . . . . . . . . . . . 22,400 1,900 20,500 2,500 8,800 9,200
Partially . . . . . . . . . . . . . . . . . . . . . . . . . . . 12,100 *1,200 10,900 1,800 5,000 4,100 Severely or completely lost . . . . . . . . . . . . . . . *4,100 * 3,900 * * *2,100
Unknown or unable to determine . . . . . . . . . . . . . 18,400 *2,500 15,800 1,800 7,200 6,800
Hearing6
Not impaired . . . . . . . . . . . . . . . . . . . . . . . . . . 64,000 15,900 48,100 13,300 23,300 11,500 Impaired5 . . . . . . . . . . . . . . . . . . . . . . . . . . . . 24,700 * 23,800 2,800 9,800 11,300
Partially . . . . . . . . . . . . . . . . . . . . . . . . . . . 14,300 * 13,600 2,200 6,100 5,400 Severely or completely lost . . . . . . . . . . . . . . . 7,200 * 7,200 * *1,600 5,100
Unknown or unable to determine . . . . . . . . . . . . . 16,800 *2,800 14,000 2,100 5,900 6,000
See footnotes at end of table.

Current Hospice Care Patients [ February 2004 [ Page 11
Table 9. Number of current hospice care patients, by assistance with activities of daily living, functional status, and age: United States, 2000—Con.
Age1
Under 65 65 years 65–74 75–84 85 years Selected characteristic Number years and over years years and over
Continence
No difficulty . . . . . . . . . . . . . . . . . . . . . . . . . . 61,400 15,500 46,000 12,000 23,100 10,900 Has difficulty controlling:
Bladder7 . . . . . . . . . . . . . . . . . . . . . . . . . . . 11,200 *1,100 10,100 *2,900 4,400 *2,800 Bowels8 . . . . . . . . . . . . . . . . . . . . . . . . . . . 10,600 *1,200 9,300 *1,300 2,700 5,300 Bladder and bowels7,8 . . . . . . . . . . . . . . . . . . 22,300 *1,900 20,500 1,800 8,800 9,800
Has indwelling urinary catheter or urostomy . . . . . . 22,000 3,000 19,000 3,600 5,400 10,000 Receives help from agency in caring for this device 20,200 *2,800 17,400 3,100 4,800 9,500
* Figure does not meet standard of reliability or precision because the sample size is less than 30 if shown without an estimate. If shown with an estimate, the sample size is between 30 and 59, or the sample size is greater than 59 but has a relative standard error of 30 percent or more. 1Age is the patient’s age at the time of survey. 2Includes an unknown number of patients who were bedbound or received help only from nonagency persons. 3Numbers will not add to totals because a patient may be included in more than one category. 4Status when using eyeglasses or contact lenses if applicable. 5Total number of impaired includes patients for whom the level of impairment is unknown. 6Status when using a hearing aid if applicable. 7Excludes patients with an indwelling urinary catheter or urostomy. 8Excludes patients with an ileostomy or colostomy.
NOTE: Numbers may not add to totals because of rounding.

Table 10. Number of current hospice care patients, by type of aids used, devices used, sex, and race: United States, 2000
Selected aids and devices1 Number
Sex Race
Male Female WhiteBlack and
other2 Black Unknown
All patients3 . . . . . . . . . . . . . . . . . . . . . . . . . . 105,500 44,900 60,600 87,300 13,000 11,200 5,200
Sensory and/or dental
Total with sensory and/or dental aids . . . . . . . . . . . 39,400 15,900 23,500 34,000 *4,000 *3,100 *1,400
Eyeglasses or contact lenses . . . . . . . . . . . . . . . 32,800 14,300 18,500 27,500 *3,900 *3,100 *Hearing aid . . . . . . . . . . . . . . . . . . . . . . . . . . 6,700 *2,100 4,700 6,600 * * *Dentures (full or partial) . . . . . . . . . . . . . . . . . . . 14,400 4,300 10,000 13,500 * * *
Mobility
Total with mobility aids. . . . . . . . . . . . . . . . . . . . 61,400 27,900 33,500 50,900 7,000 5,600 3,500
Cane or crutches . . . . . . . . . . . . . . . . . . . . . . . 8,500 4,900 3,600 6,900 *1,100 * *Transfer equipment. . . . . . . . . . . . . . . . . . . . . . 9,100 3,500 5,600 7,900 *1,000 * *Walker . . . . . . . . . . . . . . . . . . . . . . . . . . . . . 31,000 14,800 16,200 24,600 *4,700 *3,800 *1,700Wheelchair4 . . . . . . . . . . . . . . . . . . . . . . . . . . 43,100 18,700 24,400 37,300 *3,400 *2,900 *2,300
Self-care
Total with self-care devices . . . . . . . . . . . . . . . . . 105,000 44,500 60,500 87,100 12,900 11,100 4,900
Bedside commode . . . . . . . . . . . . . . . . . . . . . . 36,900 15,200 21,700 31,700 *4,200 *3,400 *1,000Elevated or raised toilet seat . . . . . . . . . . . . . . . . 3,500 *1,100 2,400 3,100 * * *Chairs5 . . . . . . . . . . . . . . . . . . . . . . . . . . . . . 6,800 2,300 4,600 5,600 * * *Grab bars . . . . . . . . . . . . . . . . . . . . . . . . . . . 5,700 2,600 3,100 4,700 * * *Hospital bed . . . . . . . . . . . . . . . . . . . . . . . . . . 59,700 24,600 35,100 50,600 7,100 6,000 *2,000Mattress, special . . . . . . . . . . . . . . . . . . . . . . . 32,600 12,100 20,500 28,000 *4,000 *3,300 *Overbed table . . . . . . . . . . . . . . . . . . . . . . . . 23,000 7,500 15,500 19,700 *2,300 *1,700 *1,000Shower chair or bath bench . . . . . . . . . . . . . . . . 16,500 6,800 9,700 13,800 *1,900 *1,500 *
Medical
Total with medical devices . . . . . . . . . . . . . . . . . 45,000 19,400 25,600 36,600 7,100 5,900 *1,300
Blood glucose monitor . . . . . . . . . . . . . . . . . . . . 2,500 *1,100 1,400 1,700 * * *Enteral feeding . . . . . . . . . . . . . . . . . . . . . . . . 6,100 2,600 3,600 3,200 * * *Intravenous therapy . . . . . . . . . . . . . . . . . . . . . 1,800 *800 *1,000 1,200 * * *Oxygen6 . . . . . . . . . . . . . . . . . . . . . . . . . . . . 37,300 15,900 21,400 31,800 *4,700 *3,700 *Other respiratory therapy . . . . . . . . . . . . . . . . . . 8,900 4,100 4,800 7,400 * * *
Other aids . . . . . . . . . . . . . . . . . . . . . . . . . . . 8,600 4,600 4,000 6,900 * * *
* Figure does not meet standard of reliability or precision because the sample size is less than 30 if shown without an estimate. If shown with an estimate, the sample size is between 30 and 59, or thesample size is greater than 59 but has a relative standard error of 30 percent or more.1Numbers will not add to totals since a patient may be included in more than one category.2Other race includes Asian, Native Hawaiian or other Pacific Islander, American Indian or Alaska Native, and multiple races. All race categories include persons of Hispanic and not-Hispanic origin.Persons of Hispanic origin may be of any race. Starting with data year 1999, race-specific estimates have been tabulated according to 1997 Standards for Federal Data on Race and Ethnicity and arenot strictly comparable with estimates for earlier years. However, only a small number of records had multiple races indicated.3Total number of hospice care patients.4Includes manual and motorized wheelchairs.5Includes geri-chairs, lift chairs, and other specialized chairs.6Includes oxygen concentrator.
Current Hospice Care Patients [ February 2004 [ Page 12

Table 11. Number of current hospice care patients, by type of aids used, devices used, and age: United States, 2000
Selected aids and devices2 Number
Age1
Under 65years
65 yearsand over
65–74years
75–84years
85 yearsand over
All patients3 . . . . . . . . . . . . . . . . . . . . . . . . . . 105,500 19,600 85,900 18,100 39,000 33,500
Sensory and/or dental
Total with sensory and/or dental aids . . . . . . . . . . . 39,400 *6,100 33,300 6,000 17,900 9,400
Eyeglasses or contact lenses . . . . . . . . . . . . . . . 32,800 6,000 26,700 5,200 14,100 7,700Hearing aid . . . . . . . . . . . . . . . . . . . . . . . . . . 6,700 * 6,600 * *3,700 *1,800Dentures (full or partial) . . . . . . . . . . . . . . . . . . . 14,400 * 13,800 2,600 7,500 3,800
Mobility
Total with mobility aids. . . . . . . . . . . . . . . . . . . . 61,400 8,100 53,300 13,200 23,800 16,300
Cane or crutches . . . . . . . . . . . . . . . . . . . . . . . 8,500 1,600 6,900 1,600 3,500 2,100Transfer equipment. . . . . . . . . . . . . . . . . . . . . . 9,100 *1,500 7,600 *1,900 *2,000 4,400Walker . . . . . . . . . . . . . . . . . . . . . . . . . . . . . 31,000 3,800 27,200 6,100 13,100 8,100Wheelchair4 . . . . . . . . . . . . . . . . . . . . . . . . . . 43,100 4,600 38,400 10,600 17,000 10,800
Self-care
Total with self-care devices . . . . . . . . . . . . . . . . . 105,000 19,600 85,400 17,800 38,900 28,700
Bedside commode . . . . . . . . . . . . . . . . . . . . . . 36,900 4,600 32,400 7,500 13,900 11,600Elevated or raised toilet seat . . . . . . . . . . . . . . . . 3,500 * 3,100 *800 *1,300 *1,200Chairs5 . . . . . . . . . . . . . . . . . . . . . . . . . . . . . 6,800 *800 6,100 *1,700 2,600 2,000Grab bars . . . . . . . . . . . . . . . . . . . . . . . . . . . 5,700 *800 4,900 *1,300 1,700 2,100Hospital bed . . . . . . . . . . . . . . . . . . . . . . . . . . 59,700 9,300 50,400 11,100 20,800 19,900Mattress, special . . . . . . . . . . . . . . . . . . . . . . . 32,600 5,300 27,300 5,600 12,100 10,300Overbed table . . . . . . . . . . . . . . . . . . . . . . . . 16,500 3,000 13,400 3,800 5,100 4,900Shower chair or bath bench . . . . . . . . . . . . . . . . 23,000 3,000 20,000 3,300 7,400 10,400
Medical
Total with medical devices . . . . . . . . . . . . . . . . . 45,000 8,600 36,400 8,600 17,800 10,000
Blood glucose monitor . . . . . . . . . . . . . . . . . . . . 2,500 * 2,200 * *1,200 *Enteral feeding . . . . . . . . . . . . . . . . . . . . . . . . 6,100 2,400 3,700 * *1,600 *2,700Intravenous therapy . . . . . . . . . . . . . . . . . . . . . 1,800 *700 *1,100 * * *Oxygen6 . . . . . . . . . . . . . . . . . . . . . . . . . . . . 37,300 6,700 30,600 7,600 15,000 8,000Other respiratory therapy . . . . . . . . . . . . . . . . . . 8,900 1,800 7,100 2,300 3,700 *1,600
Other aids . . . . . . . . . . . . . . . . . . . . . . . . . . . 8,600 *1,400 7,200 2,500 3,200 *1,700
* Figure does not meet standard of reliability or precision because the sample size is less than 30 if shown without an estimate. If shown with an estimate, the sample size is between 30 and 59, or thesample size is greater than 59 but has a relative standard error of 30 percent or more.1Age is a patient’s age at time of survey.2Numbers will not add to totals because a patient may be included in more than one category.3Includes manual and motorized wheelchairs.4Total number of hospice care patients.5Includes geri-chairs, lift chairs, and other specialized chairs.6Includes oxygen concentrator.
Current Hospice Care Patients [ February 2004 [ Page 13

Table 12. Number and percentage of primary and all-listed diagnoses of current hospice care patients, by type of diagnosis at admission:United States, 2000
Diagnosis and ICD–9–CM codes1
Primary diagnosis2 All-listed diagnoses3
Number ofpatients Percent
Number ofdiagnoses Percent
Total . . . . . . . . . . . . . . . . . . . . . . . . . . . . . . . . . . . . . . . . . . . . . . . . . . . . . . . . 105,500 100.0 238,400 100.0
Infectious and parasitic diseases . . . . . . . . . . . . . . . . . . . . . . . . . . . . . . . . . 001–139 *1,000 *1.0 *2,700 *1.1Human immunodeficiency virus (HIV) disease . . . . . . . . . . . . . . . . . . . . . . . . . . 042 *700 *0.6 *700 *0.3
Neoplasms . . . . . . . . . . . . . . . . . . . . . . . . . . . . . . . . . . . . . . . . . . . . . . 140–239 55,500 52.6 82,900 34.8Malignant neoplasms . . . . . . . . . . . . . . . . . . . . . . . . . . . . . . . . 140–208, 230–234 54,900 52.0 81,900 34.3
Malignant neoplasms of large intestine and rectum . . . . . . . . . . . . . . . 153–154,197.5 5,200 4.9 6,300 2.6Malignant neoplasm of trachea, bronchus and lung . . . . . . . . . . . . . 162, 197.0, 197.3 13,000 12.3 15,400 6.5Malignant neoplasm of bone, connective tissue and skin . . . . . . 170–173, 198.2, 198.5 *1,400 *1.3 6,600 2.8Malignant neoplasm of breast . . . . . . . . . . . . . . . . . . . . . . . . . . . 174–175, 198.81 5,100 4.8 5,400 2.3Malignant neoplasm of female genital organs . . . . . . . . . . . . . . . . . . 179–184, 198.6 *1,700 *1.6 *1,900 *0.8Malignant neoplasm of prostate . . . . . . . . . . . . . . . . . . . . . . . . . . . . . . . . . 185 8,100 7.7 9,100 3.8Malignant neoplasm of urinary organs . . . . . . . . . . . . . . . . . . . 188–189, 198.0–198.1 *3,000 *2.8 *3,500 *1.5Malignant neoplasm of hematopoietic tissue . . . . . . . . . . . . . . . . . . . . 196, 200–208 *4,100 *3.9 *5,700 *2.4Malignant neoplasm of other and unspecified sites . . . 150–152, 155–161, 163–165, 176,
186, 187, 190–196, 197.1–197.2, 197.4, 197.6–197.8, 198.3–198.4, 198.7, 198.82–199,230–234 13,300 12.6 27,700 11.6
Endocrine, nutritional, and metabolic diseases and immunity disorders . . . . . . . . . 240–279 * * 12,600 5.3Diabete mellitus . . . . . . . . . . . . . . . . . . . . . . . . . . . . . . . . . . . . . . . . . . . . . 250 * * 10,100 4.3
Mental disorders . . . . . . . . . . . . . . . . . . . . . . . . . . . . . . . . . . . . . . . . . . . 290–319 *2,900 *2.8 9,200 3.9Diseases of the nervous system and sense organs . . . . . . . . . . . . . . . . . . . . . 320–389 11,100 10.6 16,200 6.8
Alzheimer’s disease . . . . . . . . . . . . . . . . . . . . . . . . . . . . . . . . . . . . . . . . . 331.0 7,900 7.5 9,900 4.2Diseases of the circulatory system . . . . . . . . . . . . . . . . . . . . . . . . . . . . . . . 390–459 16,500 15.6 48,400 20.3
Heart disease . . . . . . . . . 391–392.0, 393–398, 402, 404, 415–416, 420–427, 428.1–429 13,500 12.8 32,400 13.6Ischemic heart disease . . . . . . . . . . . . . . . . . . . . . . . . . . . . . . . . . . . . 410–414 * * 5,300 2.2Congestive heart failure . . . . . . . . . . . . . . . . . . . . . . . . . . . . . . . . . . . . . 428.0 8,400 8.0 13,600 5.7
Cerebrovascular disease . . . . . . . . . . . . . . . . . . . . . . . . . . . . . . . . . . . . 430–438 *4,500 *4.3 *13,500 *5.7Other diseases of the circulatory system . . . . . . . . . 390, 392.9, 403, 405, 417, 440–459 2,500 2.4 5,300 2.2
Diseases of the respiratory system . . . . . . . . . . . . . . . . . . . . . . . . . . . . . . . 460–519 6,900 6.5 19,400 8.1Chronic obstructive pulmonary disease and allied conditions . . . . . . . . . . . . . . 490–496 4,500 4.3 13,100 5.5
Diseases of the digestive system . . . . . . . . . . . . . . . . . . . . . . . . . . . . . . . . 520–579 *1,800 *1.7 6,500 2.7Diseases of the genitourinary system . . . . . . . . . . . . . . . . . . . . . . . . . . . . . . 580–629 *1,600 *1.5 5,500 2.3Diseases of the muscuskeletal system and connective tissue . . . . . . . . . . . . . . . 710–739 * * *7,800 *3.3Symptoms, signs and ill-defined conditions . . . . . . . . . . . . . . . . . . . . . . . . . . 780–799 5,400 5.1 13,900 5.8Supplementary classification . . . . . . . . . . . . . . . . . . . . . . . . . . . . . . . . . . . V01–V82 * * *5,300 *2.2
Posthospital aftercare . . . . . . . . . . . . . . . . . . . V42–V46, V52, V53.3–V53.7, V54–V58 * * *2,800 *1.2Unknown or no diagnosis . . . . . . . . . . . . . . . . . . . . . . . . . . . . . . . . . . . . . . . . . . . * * . . . . . .
* Figure does not meet standard of reliability or precision because the sample size is less than 30 if shown without an estimate. If shown with an estimate, the sample size is between 30 and 59, or thesample size is greater than 59 but has a relative standard error of 30 percent or more.
. . . Category not applicable.1Based on the International Classification of Diseases, 9th Revision, Clinical Modification.2Primary diagnosis is the diagnosis that is chiefly responsible for the patient’s admission to hospice care.3Up to six diagnoses are recorded for each patient at admission.
NOTES: Numbers may not add to totals because of rounding. Percentages are based on the unrounded numbers.
Current Hospice Care Patients [ February 2004 [ Page 14

Table 13. Number and percentage of current hospice care patients, and mean and median length of service in days, by primary diagnosis atadmission: United States, 2000
Diagnosis and ICD–9–CM codes1 Number
Meanlength ofservicein days
Medianlength ofservicein days
All patients . . . . . . . . . . . . . . . . . . . . . . . . . . . . . . . . . . . . . . . . . . . . . . . . . . . . 105,500 129 58Infectious and parasitic diseases . . . . . . . . . . . . . . . . . . . . . . . . . . . . . . . . . 001–139 *1,000 *106 *15
Human immunodeficiency virus (HIV) disease . . . . . . . . . . . . . . . . . . . . . . . . . . 042 *700 *159 *53Neoplasms . . . . . . . . . . . . . . . . . . . . . . . . . . . . . . . . . . . . . . . . . . . . . . 140–239 55,500 114 50
Malignant neoplasms . . . . . . . . . . . . . . . . . . . . . . . . . . . . . . . . 140–208, 230–234 54,900 113 49Malignant neoplasms of large intestine and rectum . . . . . . . . . . . . . . . 153–154,197.5 5,200 80 48Malignant neoplasm of trachea, bronchus and lung . . . . . . . . . . . . . 162, 197.0, 197.3 13,000 67 32Malignant neoplasm of bone, connective tissue and skin . . . . . . 170–173, 198.2, 198.5 *1,400 *152 57Malignant neoplasm of breast . . . . . . . . . . . . . . . . . . . . . . . . . . . 174–175, 198.81 5,100 218 89Malignant neoplasm of female genital organs . . . . . . . . . . . . . . . . . . 179–184, 198.6 *1,700 *157 *151Malignant neoplasm of prostate . . . . . . . . . . . . . . . . . . . . . . . . . . . . . . . . . 185 8,100 173 71Malignant neoplasm of urinary organs . . . . . . . . . . . . . . . . . . . 188–189, 198.0–198.1 *3,000 *58 *62Malignant neoplasm of hematopoietic tissue . . . . . . . . . . . . . . . . . . . . 196, 200–208 4,100 130 16Malignant neoplasm of other and unspecified sites . . . 150–152, 155–161, 163–165, 176,
186, 187, 190–196, 197.1–197.2, 197.4, 197.6–197.8, 198.3–198.4, 198.7, 198.82–199,230–234 13,300 92 35
Endocrine, nutritional, and metabolic diseases and immunity disorders . . . . . . . . . 240–279 * * *Diabetes mellitus . . . . . . . . . . . . . . . . . . . . . . . . . . . . . . . . . . . . . . . . . . . . 250 * * *
Mental disorders . . . . . . . . . . . . . . . . . . . . . . . . . . . . . . . . . . . . . . . . . . . 290–319 2,900 134 95Diseases of the nervous system and sense organs . . . . . . . . . . . . . . . . . . . . . 320–389 11,100 134 57
Alzheimer’s disease . . . . . . . . . . . . . . . . . . . . . . . . . . . . . . . . . . . . . . . . . 331.0 7,900 127 41Diseases of the circulatory system . . . . . . . . . . . . . . . . . . . . . . . . . . . . . . . 390–459 16,500 131 67
Heart disease . . . . . . . . . 391–392.0, 393–398, 402, 404, 415–416, 420–427, 428.1–429 13,500 121 65Ischemic heart disease . . . . . . . . . . . . . . . . . . . . . . . . . . . . . . . . . . . . 410–414 * * *Congestive heart failure . . . . . . . . . . . . . . . . . . . . . . . . . . . . . . . . . . . . . 428.0 8,400 153 95
Cerebrovascular disease . . . . . . . . . . . . . . . . . . . . . . . . . . . . . . . . . . . . 430–438 4,500 63 10Other diseases of the circulatory system . . . . . . . . . 390, 392.9, 403, 405, 417, 440–459 2,500 180 68
Diseases of the respiratory system . . . . . . . . . . . . . . . . . . . . . . . . . . . . . . . 460–519 6,900 128 101Chronic obstructive pulmonary disease and allied conditions . . . . . . . . . . . . . . 490–496 4,500 142 102
Diseases of the digestive system . . . . . . . . . . . . . . . . . . . . . . . . . . . . . . . . 520–579 *1,800 *99 *30Diseases of the genitourinary system . . . . . . . . . . . . . . . . . . . . . . . . . . . . . . 580–629 *1,600 *79 *41Diseases of the muscuskeletal system and connective tissue . . . . . . . . . . . . . . . 710–739 * * *Symptoms, signs and ill-defined conditions . . . . . . . . . . . . . . . . . . . . . . . . . . 780–799 5,400 135 86Supplementary classification . . . . . . . . . . . . . . . . . . . . . . . . . . . . . . . . . . . V01–V82 * * *
Posthospital aftercare . . . . . . . . . . . . . . . . . . . V42–V46, V52, V53.3–V53.7, V54–V58 * * *Unknown or no diagnosis . . . . . . . . . . . . . . . . . . . . . . . . . . . . . . . . . . . . . . . . . . . * * *
* Figure does not meet standard of reliability or precision because the sample size is less than 30 if shown without an estimate. If shown with an estimate, the sample size is between 30 and 59, or thesample size is greater than 59 but has a relative standard error of 30 percent or more.1Based on the International Classification of Diseases, 9th Revision, Clinical Modification.
NOTES: Numbers may not add to totals because of rounding. Percentages are based on the unrounded numbers.
Current Hospice Care Patients [ February 2004 [ Page 15