Embed Size (px)
Citation preview

___________________________________________________________________________
2009/SOM2/MAG/WKSP/009 Session 2
Current Initiatives and Future Strategy on Green Energy Development in Chinese Taipei
Submitted by: Industrial Technology Research Institute (ITRI)
Workshop on Environmental Goods and Services
Singapore28 July 2009

0
Robert Yie-Zu Hu, Ph.D.Deputy General Director
Energy and Environment Research Laboratories, ITRI
July 28 2009
Current Initiatives and Future Strategyon Green Energy Development
in Chinese Taipei
2009 MAG EGS Workshop2009 MAG EGS Workshop
1
ContentsContents
1. Our Challenges
2. Green Energy Technology & Industry DevelopmentA. Renewable Energy – PV B. Energy Conservation – LED LightingC. Energy Conservation – System Smart NetworkingD. Carbon Capture & Storage
3. Closing Remarks

2
1. Our Challenges1. Our Challenges
3Total: 229.8 billion kWhTotal: 117.7 million kLOE
Final energy consumption, 2008
Energy Situation in CTEnergy Situation in CTIn 2008, more than 99% of energy was imported in which equaled to about 1% of global consumption.In 2008, the sector of Industry shared 60.7% of the final energy consumption; Energy consumed 8.1%; Residential and Service sectors consumed 23.2%; Transportation sector,12.8%. In 2008, the sector of Industry consumed 51% of the total electricity production; Energy sector took 8.5%; Residential and Service sectors were about 38.9%.
Total electricity consumption in 2008
Source: Energy statistics, Handbook 2008, Bureau of Energy, MOEA, June 2009

4
Energy / Economy / COEnergy / Economy / CO22 ComparisonComparison
Chinese TaipeiGlobal OECD Japan German
2005 Rank %
CO2 Emission (Mton) a 261 22 0.96 27,136 12,910 1,214 813
Population (million) 22.9 45 0.36 6,432 1,172 127.8 82.5
GDP (billion US$) b 572 18 0.93 54,618 30,320 3,474 2,169
Energy Supply (1015 Joule) 4,429 21 0.93 478,715 232,267 22,209 14,433
CO2 Density (kg/US$) b 0.46 47 0.50 0.43 0.35 0.38
Energy Density (US$/109
Joule) 129 114 131 156 150
Source: CO2 Emissions from Fuel Combustion 2007 edition, IEA
Note: a. CO2 from the international sea-lane transportation is not includedb. PPP (purchase power parity) with regard of 2000 US$
Energy productivity has a lot of room for improvement
5
Our Challenge Our Challenge –– COCO22 DecouplingDecoupling
GDP growthCO2 emission
Base YearBase Year
Chinese Taipei
1.00
1.50
2.00
2.50
1990 1995 2000 2005
Year
GDP CO2
OECD countries
1.00
1.50
2.00
2.50
1990 1995 2000 2005
Year
GDP CO2

6
2. Green Energy Technology 2. Green Energy Technology & Industry Development& Industry Development
7
Notable Energy Developments in CT Notable Energy Developments in CT Consensus agreement reached in the National Energy Conference (April 15-16, 2009) aimed for charting energy policy & future research topics
Aim for a low-carbon societyReduce carbon emission to the level of 2008 during 2016 ~ 2020Reduce carbon emission to the level of 2000 by 2025Reduce the overall energy intensity at least 2% annually for thenext 8 years, and 50% by 2025Increase the supply of low carbon energy to at least 55% of country energy mix by 2025
Stronger administrational effortsAccelerate the deployment of renewable energies and improvement of energy efficiency in the realm of energy supply and demand sectorsImplement “Flagship Program of Green Energy Industry”Initiate the “National Energy R&D Program”
8
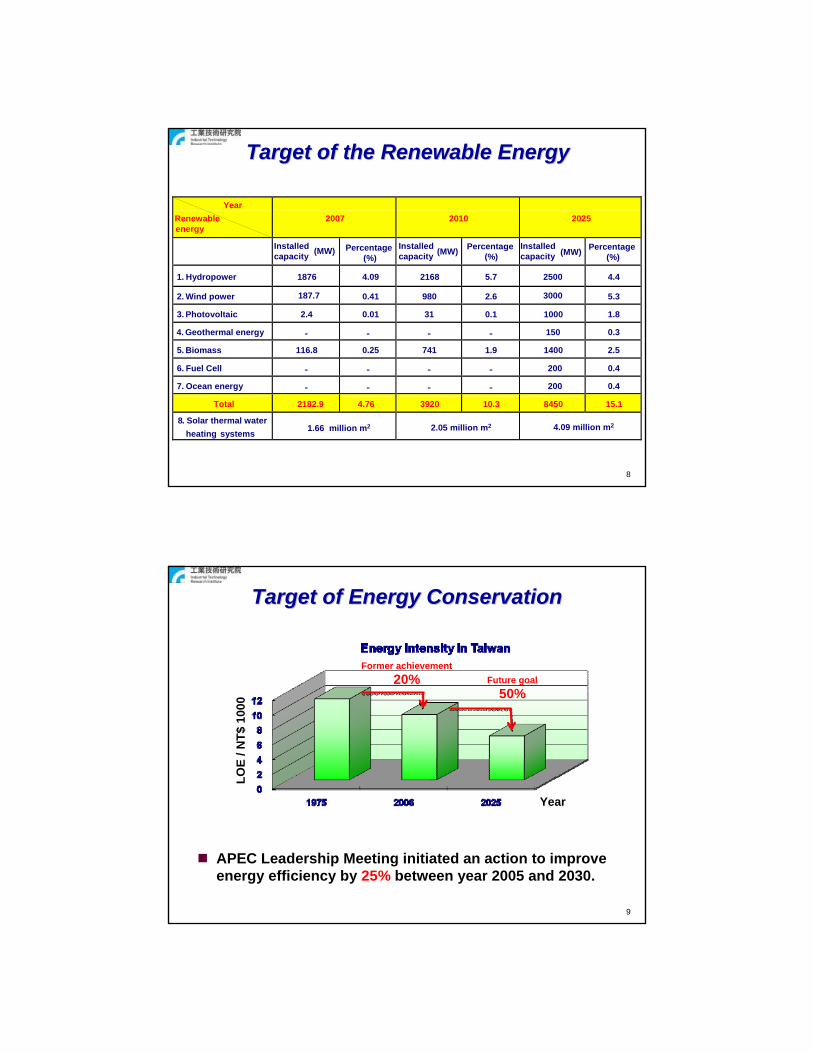
Target of the Renewable EnergyTarget of the Renewable Energy
YearRenewableenergy
2007 2010 2025
Installed capacity (MW) Percentage
(%)Installed capacity (MW) Percentage
(%)Installed capacity (MW) Percentage
(%)
1. Hydropower 1876 4.09 2168 5.7 2500 4.4
2. Wind power 187.7 0.41 980 2.6 3000 5.3
3. Photovoltaic 2.4 0.01 31 0.1 1000 1.8
4. Geothermal energy - - - - 150 0.3
5. Biomass 116.8 0.25 741 1.9 1400 2.5
6. Fuel Cell - - - - 200 0.4
7. Ocean energy - - - - 200 0.4
Total 2182.9 4.76 3920 10.3 8450 15.1
8. Solar thermal water heating systems 1.66 million m2 2.05 million m2 4.09 million m2
9
TargetTarget of of Energy ConservationEnergy Conservation
LOE
/ NT$
100
0
Former achievement20% Future goal
50%
Year
APEC Leadership Meeting initiated an action to improve energy efficiency by 25% between year 2005 and 2030.

10
Green Energy Industry ProgramGreen Energy Industry Program
Approved by the Cabinet on April 23, 2009
1 US$ ≈ 33 NT$
11
LED Lighting Applications
Refuse Derived Fuels (RDF)
Bio-diesel
Wind Power
FC & H2
Smart Meter
Next Generation Solar Cell
Promote Renewable Promote Renewable EnergyEnergy
Develop Green Energy Develop Green Energy IndustryIndustry
Distributed Energy System (DES)
Advanced Metering Infrastructure (AMI)
Enhance Energy Enhance Energy Conservation Conservation
Major Focus of Green Energy Technology in CTMajor Focus of Green Energy Technology in CT
CCS

12
A. Renewable Energy - PV-
13
Outlook of BIPVOutlook of BIPV
High Efficiency Solar CellHIT, bifacial solar cell, planar solar concentrator
Multi-function Solar CellHybrid PV/thermoelectric generator module, self-clean surface
Better Electric Power UtilizationSmart grid energy conservation materials (NIR reflector)
Reliability-better Safety Pass IEC61730 or regional safety regulations
AestheticHigh color rendering index silicon TFPV, chromatic DSSC, EC PV
Green BuildingLow cost / multifunction BIPV Solution

14
1515--times Growth Industrytimes Growth Industry-- BIPV+EnergyBIPV+Energy Conservation Conservation
Residential buildings consume 30 - 40% of global energy PV and energy conservation industries are the best solution to decrease global warmingNanoMarkets: “The estimated growth rate for BIPV is more than 100% in the 2011 - 2013 period”
Sources: NanoMarkets, Frost & Sullivan, Lux Research and ITRI 2009/April
1.48 1.97 5.29 6.67 8.41 10.6
23.7
52.8
75.5
108
0
20
40
60
80
100
120
2006 2007 2008 2009(e) 2010(e) 2011(e) 2012(e) 2013(e) 2014(e) 2015(e)
市場規模($億元)
BIPV is a large market that may eventually account for ~50% of the total area of installed PV ……B.P. Nelson, NREL
Mar
ket s
ize
(100
milli
on U
S$)
15
Development of PV Technology in CTDevelopment of PV Technology in CT
Upstream Midstream Downstream
Polysilicon Ingot / Wafer Solar Cell PV Module PV System
R&D Strategies:Upstream poly-silicon raw materials and purification technologiesModule verification technologyDomestically-made equipments for mass productionDevelop the next generation solar cell
PV production: >2.11 GWp in 2008, (25% share of world PV market) Focus on next (Si, thin film) & next generation (Polymer, DSSC)
Domestic Annual Production (BNT$)
2006 2015 2025
21.9
450
1,000

16
Next Generation Solar CellsNext Generation Solar Cells
Organic hybrid solar cellDye-sensitized, organic solar cellFlexible Solar Cell
Organic Solar Cell
Silicon-based thin film solar cellCIGSInk Printing
Thin Film Solar Cell
17
B. Energy Conservation - LED Lighting-
18
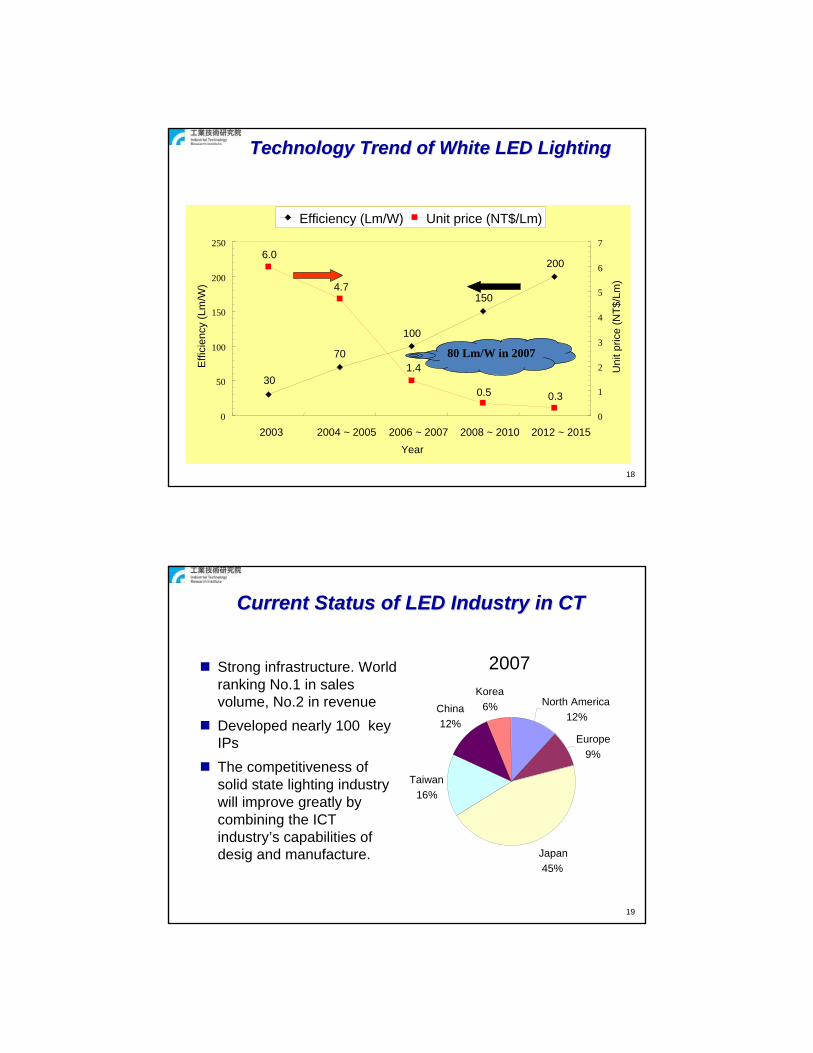
200
150
100
70
300.30.5
1.4
4.7
6.0
0
50
100
150
200
250
2003 2004 ~ 2005 2006 ~ 2007 2008 ~ 2010 2012 ~ 2015Year
Effi
cien
cy (L
m/W
)
0
1
2
3
4
5
6
7
Uni
t pric
e (N
T$/L
m)
Efficiency (Lm/W) Unit price (NT$/Lm)
Technology Trend of White LED LightingTechnology Trend of White LED Lighting
80 Lm/W in 2007
19
Current Status of LED Industry in CTCurrent Status of LED Industry in CT
Strong infrastructure. World ranking No.1 in sales volume, No.2 in revenueDeveloped nearly 100 key IPsThe competitiveness of solid state lighting industry will improve greatly by combining the ICT industry’s capabilities of desig and manufacture.
2007
North America12%
Europe9%
Japan45%
Taiwan16%
Korea6%China
12%

20Output value, Benefit
2015
2012
2009
Green Energy Industry Economy
Streetlamp
Large-sized LCD Backlight
Intelligent Human Factor Lighting
High power WLED 150lm/W
High power WLED200lm/W
High power WLED100lm/W
Develop the innovative high quality LED lighting technology
User-friendly and high quality lighting environment
High power AC LED160lm/W
AC LED Intelligent Mood Lighting
High power AC LED120lm/W
2018 Intelligent Human Factor Interactive Lighting
2018 Scenario2018 Scenario
21
Systems Key Components
LED lighting sourceSpecific power supplyDigital controller Standardized LED module
Modularized LED lighting systemOptical and thermal designSimulation of LED lighting fixture design LED streetlight High reliability design
LED lighting module15W,1000lm,20khrs
LED power supply,87%, 1cm(T) ,MTBF>25K Hrs@60℃
200W LED streetlightTemp. rise : 21℃
Key Components and Systems in LED LightingKey Components and Systems in LED Lighting
Thermal simulation
Standardized LED module20W,60lm/W

22
Establishment of World Class Lighting LaboratoryEstablishment of World Class Lighting Laboratory
FeaturesThe first non US-based NIST certified testing laboratory Provide a platform of standardizationAn information hubAssist in leveraging the product quality and international collaboration
NIST: National Institute of Standards and Technology
23
C. Energy Conservation - System Smart Networking -

24
Distributed Energy System of Today & Tomorrow in Chinese Taipei
CT’s Advantages – A test bed & pilot demonstration from micro grids to future intelligent networkCT has strong history of DE penetration - 17% (world average, 7%) Opportunities for Micro Grid demonstration (hundred kW to a couple of MW)
Sources: BOE, Chinese Taipei; WADE
Development of Distributed Energy SystemDevelopment of Distributed Energy System
1986 (16,793 MW) 2006 (45,091 MW) 2025 (78,000 MW)
CHP, 1.1% CHP, 17.1%Utility Plant,
82.7%
Wind, 0.11% CHP, 17.%Renewable Energy, 8%
Utility Plant, 75%
Utility Plant, 98.9%
25Source: European Smart Grids Technology Platform (EU,2006)
Distributed Energy Technology, An OverviewDistributed Energy Technology, An Overview
Central power plants
Offices
Storages
Houses
Micro-turbines
CHP
Fuel cells
Industrial plants Wind turbines
The full potential of DE can be realized by integrating generation, transmission & distribution and energy storage in a seamless, intelligent network
Technology Scope:Renewable EnergyAdvanced Power ElectronicsEfficient Energy StorageSmart Grid
Technology Scope:Renewable EnergyAdvanced Power ElectronicsEfficient Energy StorageSmart Grid
Micro Grid

26
Security network
Future Intelligent Network (FIN)Future Intelligent Network (FIN)
PowerInfrastructure
Energy Network +
Intelligence Infrastructure
+Security network
+Transportation
network
Generation Transmission Distribution LoadSystem
Management
Distributed Energy Resources (DERs)Advanced Metering Infrastructure (AMI)
Information & Communication
Technology
EVICE MRT
Energy Storage System
LEV
27
Technology Integration for C&R SectorsTechnology Integration for C&R SectorsFeatures
Efficient equipments equipped with inverter controllersFull dimension system integration of efficiency, comfort and health careBack up ESCO industry to implement efficient equipments & systemsCombination of energy conservation industries – HVAC&R, LED and EICT
Energy savingEnvironment friendlyHealth careComfort
Energy savingEnvironment friendlyHealth careComfort

28
The Low Carbon ResidenceThe Low Carbon Residence
Utilize highly efficient energy technology to build a low carbonresidenceUse local resources, e.g. renewable energy, heat recycleEncourage voluntary energy conservation and carbon reduction living standards
~Intelligent infrastructure ~ Indirect day lighting
Solar tracker
Power plant
Network control Energy conservationmanagement system
Day lighting
Transformer Wind power
Controller
Photovoltaics
Light sensor智慧電動窗簾
Intelligent washing machine & dehumidifier
Intelligent electrical
Light ductIntelligent air conditioning
High efficiencyillumination
Intelligentfridge
Battery set
29
EICT for ESCOEICT for ESCO
Combine network communication and artificial intelligence technologies to manage electricity effectivelySave more than 10% of the electricity bill, and the investment pay-back time is about 2 - 3 yearsThe domestic convenient stores have been continually introduced the system and it will speed up the promotion furthermore
Energy Management SystemHardware
Monitoring & Control SystemDistance Monitoring System
SoftwareEnergy Management PlatformReal-time Demand Management
Convenient stores
The monitor system

30
D. Carbon Capture & StorageD. Carbon Capture & Storage
31
Outlook of CCS (This Version)Outlook of CCS (This Version)
Source: Energy Technology Perspective 2008, IEA, p.64
CCS contributes to CO2 reduction ~ 19%9% from industry and transformation and 10% from power generation
Contribution of emission reduction options, 2005-2050
32
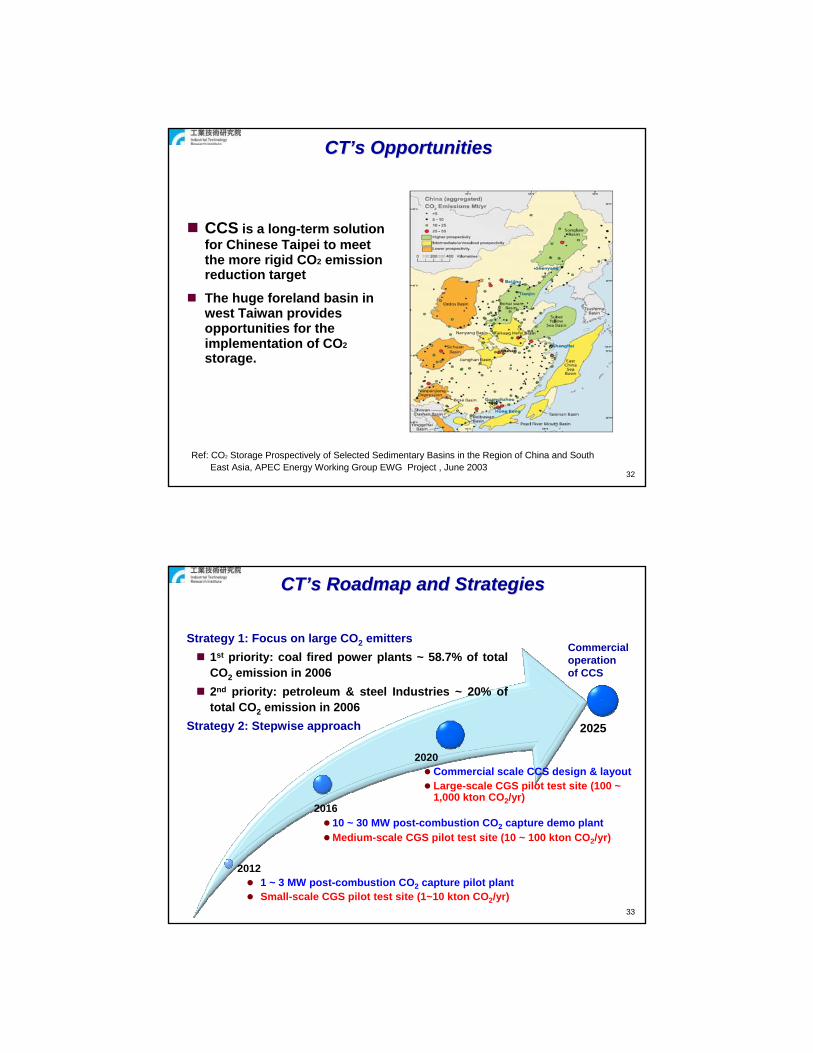
CTCT’’s Opportunitiess Opportunities
Ref: CO2 Storage Prospectively of Selected Sedimentary Basins in the Region of China and South East Asia, APEC Energy Working Group EWG Project , June 2003
CCS is a long-term solution for Chinese Taipei to meet the more rigid CO2 emission reduction target
The huge foreland basin in west Taiwan provides opportunities for the implementation of CO2
storage.
33
CTCT’’s Roadmap and Strategiess Roadmap and Strategies
20121 ~ 3 MW post-combustion CO2 capture pilot plantSmall-scale CGS pilot test site (1~10 kton CO2/yr)
2020Commercial scale CCS design & layoutLarge-scale CGS pilot test site (100 ~ 1,000 kton CO2/yr)
201610 ~ 30 MW post-combustion CO2 capture demo plantMedium-scale CGS pilot test site (10 ~ 100 kton CO2/yr)
Strategy 1: Focus on large CO2 emitters1st priority: coal fired power plants ~ 58.7% of total CO2 emission in 20062nd priority: petroleum & steel Industries ~ 20% of total CO2 emission in 2006
Strategy 2: Stepwise approach 2025
Commercial operation of CCS
34
3. Closing Remarks3. Closing Remarks
35
Chinese Taipei takes its advantages of IT industry, legislation and administrational efforts to support R&D activities and the development of green energy industry, aiming to pursue sustainable development
In 2009, Chinese Taipei passed the Amendment of Energy Management Law and launched the Renewable Energy Development Act, which will more effectively electrify the development of green energy industry and low carbon society
In order to develop the green energy industry, Chinese Taipei strategically focuses on PV, LED, system smart networking and innovative researches in every kind. In addition, we are sincerely willing to cooperate with international community to further bolster green energy technology
Closing RemarksClosing Remarks

36
Thank You Thank You For Your Attention For Your Attention