Embed Size (px)
Citation preview
CURRENT ISSUES IN MINORITYENTREPRENEURSHIP
A SCAN ON THE STATE OF MINORITY ENTERPRISE INTHE UNITED STATES
PREPARED BY
UDAYAN GUPTA, PETER SHATZKIN, AND LORRAINE LEUNG
SUBMITTED TO
THE EWING MARION KAUFFMAN FOUNDATION
FEBRUARY 7, 2001
2
Rationale for Focus of Minority Entrepreneurship Scan
In the discussions to define the scope of the minority entrepreneurship scan, it
was agreed that we would discuss entrepreneurship from a public policy
perspective, and, in particular, we would focus on those aspects of
entrepreneurship which
• contribute to economic development and community growth,
• create jobs,
• build businesses, and
• lead to wealth creation, not simply for an individual but for a larger
community.
We looked at entrepreneurial activity in the mainstream and found that the
companies that fulfilled these criteria the best over the last two decades were
entrepreneurial companies in the technology sector. Technology companies,
ranging from Lotus and Microsoft to eBay and Amazon, have been among the
most efficient in building lasting businesses, creating jobs and creating
community wealth.
Non technology industries, in such areas as traditional manufacturing and
retailing, have had significant companies but their need for high levels of capital
and their relatively slower rate of growth puts them on a lower priority when it
comes to policymaking.
We also found that, particularly as part of the minority entrepreneurship
landscape, mergers and acquisitions, corporate divestitures and roll-ups – while
legitimate and significant areas of private equity activity – were more about
dealmaking than entrepreneurship. The short-term impact of these activities on
jobs and business-building was often harmful to a local economy and to unskilled
labor. As a result we felt that start-ups should be the major focus of the
entrepreneurial scan.

3
Based on our observations we suspected that different ethnic groups had
different rates of success in raising capital for entrepreneurial businesses. When
we looked closer we found that it appeared to be true. The data showed that
these differential rates of success appeared to be influenced not only by
changing demographics but differential participation in education and in business
as well. We felt that only by expanding the discussion to discuss changing
demographics and the differential rates of participation in various areas could we
get a more complete picture of minority entrepreneurship today.
4
Table of ContentsINTRODUCTION......................................................................................................5
HISTORY OF MINORITY ENTERPRISE................................................................2
Creation of MESBICs............................................................................................3
MESBICs Transformed .........................................................................................4
Capital Gap? .........................................................................................................6
Different Groups, Different Experiences...............................................................9
DEFINING AND UNDERSTANDING MINORITY ENTERPRISE.........................10
Minority Participation in Technology Education .................................................12
Science and Engineering Bachelor Degrees, by Race and Hispanic Origin .12
Longitudinal Increases in Science and Engineering Bachelor’s Degreesamong Minorities, from 1977 to 1996..............................................................14
Master’s and Doctorate Degrees, by Race and Origin ...................................15
The Impact of Pre-College Education .............................................................18
Representation in the Science and Engineering Workforce, by Race andOrigin ................................................................................................................20
Employment as a Source of Entrepreneurial Experience..................................21
Differences in Entrepreneurship by Race and Origin ........................................23
FUNDING FOR MINORITY ENTERPRISES ........................................................26
Government Programs Aimed at Small Business..............................................29
Overview of SBA Programs.............................................................................29
Programs at the Local Level............................................................................31
Other Programs...................................................................................................32
Mainstream Venture Capital Funding.................................................................32
Minority Venture Funds.......................................................................................33
RECOMMENDATIONS..........................................................................................37

INTRODUCTION
Minority enterprise and its growth are critical to the future of the United States.
Entrepreneurial businesses, the segment of the economy that is the fastest
growing, have the greatest potential for creating jobs and contributing to
economic expansion. As the traditional minority groups begin to outnumber the
Caucasian population – according to the Census Bureau, minority groups will
outnumber the Caucasian population after 2050 – minorities must become more
involved in the entrepreneurial process to ensure the future sustainability and
growth of the U.S. economy.
The purpose of this report is to contribute to the public dialogue on minority
enterprise, and to expand the discussion to include the specific groups that
comprise the vast majority of those groups making up the category “minority”:
Asian/Pacific Islanders, African Americans, Hispanics and Native Americans1.
Differences in these groups’ experiences are significant and intriguing, but are
too often overlooked or ignored. Opening this discussion should challenge all
parties involved in developing policies and programs affecting minority enterprise
to further explore current trends, roots of these trends, and new directions for the
future.
There are four sections of this report. The first section reviews the origins of
minority enterprise programs, other sources of capital today, and the status of
minority enterprise by race and origin. The second defines minority enterprise
and observes trends in education and employment for each group. The third
explores sources of funding as the fuel of minority enterprise, specifically what
the roles of government programs, mainstream venture capital, and minority
venture capital have been. Finally, the fourth section offers recommendations to
accelerate minority enterprise growth across the board.
1 The terms Asian/Pacific Islander, African American, Hispanic and Native American are usedthroughout the narrative for the purposes of consistency. However, different terms may havebeen used by the many sources cited.

− 2 −
HISTORY OF MINORITY ENTERPRISE
In 1969, the Minority Enterprise Small Business Investment Company (MESBIC)
Act gave rise to the specialized venture capital firms that invest in minority-owned
businesses. Since that time, these Specialized Small Business Investment
Companies (SSBICs) have provided over $2,250.1 million2 in capital to 20,4033
minority-owned businesses. Today, specialized venture funds that target
minority-owned businesses and businesses that involve minorities have assets in
excess of $5 billion and provide financing to an estimated 200 or so companies
each year. Mainstream venture funds, which do not track their investments by
race, provide financing to another 50 or so companies operated and owned by
minorities.
It is ironic that it required legislation to create an investment program for minority
entrepreneurship. Not that the concept of governmental involvement in promoting
entrepreneurship was new. Reacting to criticism that the U.S. was falling behind
the then-U.S.S.R. in the technology race, especially space race, the Eisenhower
Administration proposed small business investment legislation which the
Congress enacted into the Small Business Investment Company (SBIC) Act into
law in 1958. The new law created private investment companies, termed SBICs,
that could borrow up to two dollars of government loans for every dollar in private
equity they raised and invested. It also laid the foundation for what has become
the venture capital industry of today.
2 “SBIC Program Statistical Package January 2001, Table 1.” Small Business Administration. 7February 2001. Small Business Administration. <http://www.sba.gov/INV/stat/2001.html>.
3 “SBIC Program Statistical Package January 2001.” Small Business Administration. 7 February2001. Small Business Administration. <http://www.sba.gov/INV/stat/2001.html>.
− 3 −
Creation of MESBICs
Nearly a decade later, amidst the urban unrest devastating America’s inner cities,
the Johnson Administration, responding to the Kerner Commission Report,
proposed an investment program for minorities, similar to the SBIC program
already in existence. Labeled the MESBIC program, the private investment
companies formed under the new program were chartered to invest exclusively in
businesses owned by minorities and women. For every dollar of private equity
that a MESBIC raised, it could receive up to four dollars in government leverage.
Not much private equity flowed into the MESBIC program in its early days. Most
came from the social responsibility allocation of corporations and from not-for-
profit groups who sought to infuse the minority communities with capital. Indeed,
the lack of financially-oriented capital may have restricted the initial vision and
goals of the MESBIC movement.
For most of its early days, MESBICs invested extensively in media-related
businesses, including radio, television and cable television properties. Their
strategy wasn’t so much classic venture as it was private equity: the financing of
existing businesses in order to achieve economies of scale and create minority
ownership. The strategy received a further boost in the late 1970s when the
Federal Communications Commission proposed such rules as tax certificates
and distress sale procedures to encourage greater diversity of media ownership.
In the mid-1970s, the change in Employee Retirement Income Security Act
(ERISA) rules created a new influx of capital into the mainstream venture capital
industry. The formation of funds such as Kleiner Perkins Caufield & Byers, the
Mayfield Fund, Oak Investment Partners and others that invested almost
exclusively in technology gave rise to the first venture-driven bull market that
began in the early 1980s. Unfortunately, MESBICs did not participate in this
technology funding. However, when the technology markets collapsed in 1983
and venture funds reported a major cyclical collapse in their returns, the
MESBICs didn’t escape unscathed.

− 4 −
By the early 1990s, the MESBIC program was clearly in need of overhaul. The
Small Business Administration, which was overseeing the industry, had shown
little initiative in shaping the program to cope with the changing economy and the
entrepreneurial population. One report, authored by Timothy Bates of Wayne
State University, argued that small pools of capital, the dearth of professional
investment managers, and rigid government supervision all contributed to the
problems experienced by minority venture capital firms.
MESBICs Transformed
The changes began with public pension fund support, the formation of a fund-of-
funds to direct capital exclusively to minority-oriented venture funds and the
growing visibility of a number of minority-backed businesses and minority
entrepreneurs.
The Michael Milken engineered buyout of Beatrice International’s non-U.S.
properties by Reginald Lewis, an African-American lawyer, for $970 million, the
initial public offering of Envirotest, an environmental testing company, and the
growth of Black Entertainment Television (BET) suggested that minority
entrepreneurs could compete in a broader economy. Certainly, the successes
recently experienced by Radio One, founded by African-American entrepreneur
Kathy Hughes, and Granite Broadcasting, a television station chain operated by
former Goldman Sachs banker, Don Cornwell, indicate that minority-owned
businesses can compete for mainstream financing and exist in a broader
marketplace.
By the mid 1990s, minority venture capital firms had gone through a
metamorphosis. They had, for the most part, reduced their dependence on Small
Business Administration (SBA) leverage and were aggressively seeking the
participation of public pension funds such as New York State Common
Retirement Fund, and California Public Employees Retirement System, as well
− 5 −
as leading commercial banks such as The Bank of America, Fleet Bank and
others. At the end of the last decade, venture capital funds that financed minority-
owned businesses or businesses targeting minorities managed assets in excess
of $5 billion.
But for all the growth in capital, most minority venture capital does not flow to
high-technology companies – the core of the mainstream venture capital
investing – but to media businesses and roll-up of more traditional companies.
Businesses backed by minority venture funds still aren’t an integral part of the
mainstream technology economy.
Minority venture capital funds, with few exceptions, have been unable to attract
venture capitalists with an understanding of and a background in technology.
Unlike mainstream venture capital funds that invariably have partners with high-
tech academic or high-tech business backgrounds, few minority venture
capitalists have any training in technology. They are poorly networked in the
investment banking community as well as in the high-tech community. It is
significant that some of the most successful minority entrepreneurs have been
funded by mainstream venture funds, not by minority venture funds. Those
include Jugi Tandon, one of the first minority entrepreneurs to start a computer
business, Suhas Patel, one of the founders of Cirrus Logic, Manny Fernandez,
who founded Gavilan Computers, David Hwang of Televideo, and David Lee of
Qume. In later years, mainstream venture capitalists have gone on to fund even
more prominent minorities, such as Umang Gupta of Gupta Corp., and later
Keynote Systems, Kanwal Rekhi of Excelan, Desh Deshpande of Sycamore
Networks, Sabir Bhatia of Hotmail, and Jerry Yang of Yahoo.
Minority venture funds have shown poor response time in reacting to technology
segment changes, and to individual proposals submitted to them. In terms of
reacting to changes in technology, minority venture capitalists have been lagging.
In the 1980s, while the technology bull market was led by personal computer and
− 6 −
personal computer-based companies, minority venture funds were focusing on
media and communications. While a large portion of the late 1980s dollars was
going to medical and biomedical deals, minority venture capitalists were
noticeably absent in the area. The few minority-owned medical start-ups that
emerged were typically self-funded. Similarly, although the first Internet
investments were being made in the early 1990s, it wasn’t until the mid-1990s
that minority-owned Internet companies such as NetNoir were founded.
Ironically, the initial investment in NetNoir came out of America OnLine and its
Greenhouse project.
Minority entrepreneurs we have interviewed complain that most minority funds
are not aggressive in seeking out deals nor are they sensitive to the needs of
their potential portfolio companies. Entrepreneurs, especially in technology
businesses, say that there are few partners in minority venture funds that have
any real insight into technology, even fewer have any professional technology
education. While mainstream funds have often rectified the problem of being
shorthanded in technology by recruiting entrepreneurs to join, minority venture
funds have not resorted to such a strategy.
Capital Gap?
A recent report prepared by the Milken Institute for the Minority Business
Development Agency of the Department of Commerce argues that the capital
gap that exists for minority-owned enterprises stood at $140 billion in 1992. The
argument, while politically popular, requires closer examination.
The assumption is that minorities – as a homogenous entity – are chronically
undercapitalized. On closer examination, however, we will see that different
groups have different levels of access and rates of success at obtaining capital.
While it is self-evident that all small businesses could benefit from better access
to capital and at lower prices, it is not clear that entrepreneurial businesses run
by minorities are languishing because of the a lack of growth capital.
− 7 −
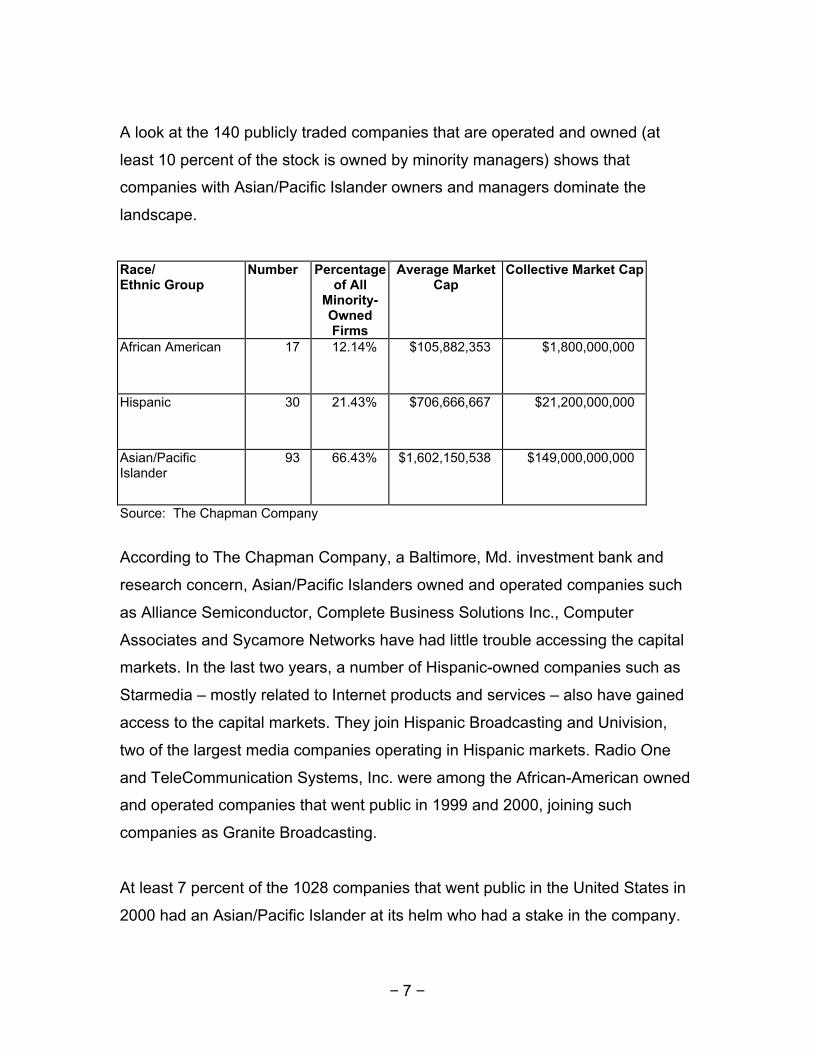
A look at the 140 publicly traded companies that are operated and owned (at
least 10 percent of the stock is owned by minority managers) shows that
companies with Asian/Pacific Islander owners and managers dominate the
landscape.
Race/Ethnic Group
Number Percentageof All
Minority-OwnedFirms
Average MarketCap
Collective Market Cap
African American 17 12.14% $105,882,353 $1,800,000,000
Hispanic 30 21.43% $706,666,667 $21,200,000,000
Asian/PacificIslander
93 66.43% $1,602,150,538 $149,000,000,000
Source: The Chapman Company
According to The Chapman Company, a Baltimore, Md. investment bank and
research concern, Asian/Pacific Islanders owned and operated companies such
as Alliance Semiconductor, Complete Business Solutions Inc., Computer
Associates and Sycamore Networks have had little trouble accessing the capital
markets. In the last two years, a number of Hispanic-owned companies such as
Starmedia – mostly related to Internet products and services – also have gained
access to the capital markets. They join Hispanic Broadcasting and Univision,
two of the largest media companies operating in Hispanic markets. Radio One
and TeleCommunication Systems, Inc. were among the African-American owned
and operated companies that went public in 1999 and 2000, joining such
companies as Granite Broadcasting.
At least 7 percent of the 1028 companies that went public in the United States in
2000 had an Asian/Pacific Islander at its helm who had a stake in the company.
− 8 −
This is in sharp contrast to the handful of Hispanic-owned and African-American
owned companies that went public the same year.
Companies headquartered in Asian and Latin American countries are routinely
raising capital on U.S stock exchanges. Companies such as Infosys, ICICI Bank
and Satyam – all based in India – and Brazil’s Embraer Aircraft Corp., AsiaInfo
Holdings (Beijing), ASAT Holdings Ltd (Hong Kong) are demonstrating that the
markets are open to those companies that can demonstrate shareholder value
and potential.
What explains the difference in market access?
Among the minority groups, Asian/Pacific Islanders have the largest presence in
technology businesses within the United States. Venture capital firms such as
Advent International and Walden Ventures and more recently Softbank (now
raising $4 billion for Asia-related Web infrastructure companies) say they are
extremely comfortable with Asian and Asian-American entrepreneurs and
evaluate them alongside the rest of the technology universe.
Entrepreneurially-driven Hispanic businesses have received an increased flow of
venture capital in recent years because of their potential to connect U.S. and
Latin American markets and the growing economic strength of the Latin and
Hispanic American consumer.
African-American businesses – with few footprints in technology – have generally
not been the beneficiaries of large amounts of venture capital. However,
entrepreneurs with a technology background – American Express’ John Williams,
a founder of Biztravel.com and Maurice B. Tose, who founded
TeleCommunication Systems, Inc. – have been able to attract equity investors.
− 9 −
Native American businesses also have been visibly absent from the growth
economy. But in recent years, the profits from “protected” businesses such as
casinos and natural resource exploration are being channeled into new business
areas. The work of the not-for-profit First Nations Development Institute in
Fredericksburg, Virginia, which currently operates on a annual investment budget
of $2 million, has been a key force in financing new businesses in computer
services, manufacturing support systems and a variety of information services
and systems companies.
Different Groups, Different Experiences
While there are few relevant cross-cultural studies of contemporary
entrepreneurship, it is clear that different minority groups have different sets of
characteristics and resources. A majority of Asian/Pacific Islanders that have
qualified for financing are immigrants who have extensive technology experience
here. Hispanic entrepreneurs that have been able to secure equity recently have
demonstrated unique access to Latin America and to Hispanic markets here and
abroad. By contrast, African Americans and Native Americans have not brought
similar “competitive advantages” to the financing table. In recent years, the work
of Harvard Business School professor Michael Porter on the competitive
advantage of Inner Cities has given African American and Hispanics a new edge.
But not too many ideas have emerged to exploit this “advantage”.
Further anecdotal and empirical research in this area is needed to guide existing
policy and future policy formulation.
− 10 −
DEFINING AND UNDERSTANDING MINORITY ENTERPRISE
Because existing racial and ethnic minorities are projected to become the
majority in the U.S. by 20504, the growth of minority-owned firms is expected to
determine the sustainability of America’s economy in the future. While there is no
comprehensive mechanism for tracking start-up activity among minority
businesses, the statistics from the Minority Business Development Agency
(MBDA) shed light on this sector.
The MBDA estimates that in 1997, there were 3.25 million minority-owned firms
with total sales of $495 billion. The number of minority firms grew at a rate of 17
percent, six times the rate of U.S. firms in general, and sales increased by 34
percent, twice that of all firms. These numbers appear to overstate the actual
performance of these groups because the low base numbers.
However, minority-owned firms are still underrepresented in the economy in
comparison to their overall percentage of the population, and some groups are
disproportionately represented within the total number of minority businesses.
For example, in 1995, African Americans, with 13 percent of the population,
owned only 6.5 percent of all minority businesses, while Asian/Pacific Islanders,
at 4 percent of the population, owned 32.9 percent of minority businesses.
There is also significant disproportionate-ness in the financing of minority
business by SBA programs. For the period October 1999 to September 2000,
African-American owned businesses represented only 1.44 percent (by amount)
of such financings and Hispanic-owned business 0.55 percent. However
Asian/Pacific Islander-owned businesses represented 2.02 percent. Native
American owned businesses represented 0.04 percent.5
4 United States Department of Commerce Minority Business Development Agency. DynamicDiversity: Projected Changes in U.S. Race and Ethnic Composition. Washington: GPO, 2000.
5 “SBIC Program Statistical Package January 2001.” Small Business Administration. SmallBusiness Administration. 7 February 2001. <http://www.sba.gov/INV/stat/2001.html>.
− 11 −
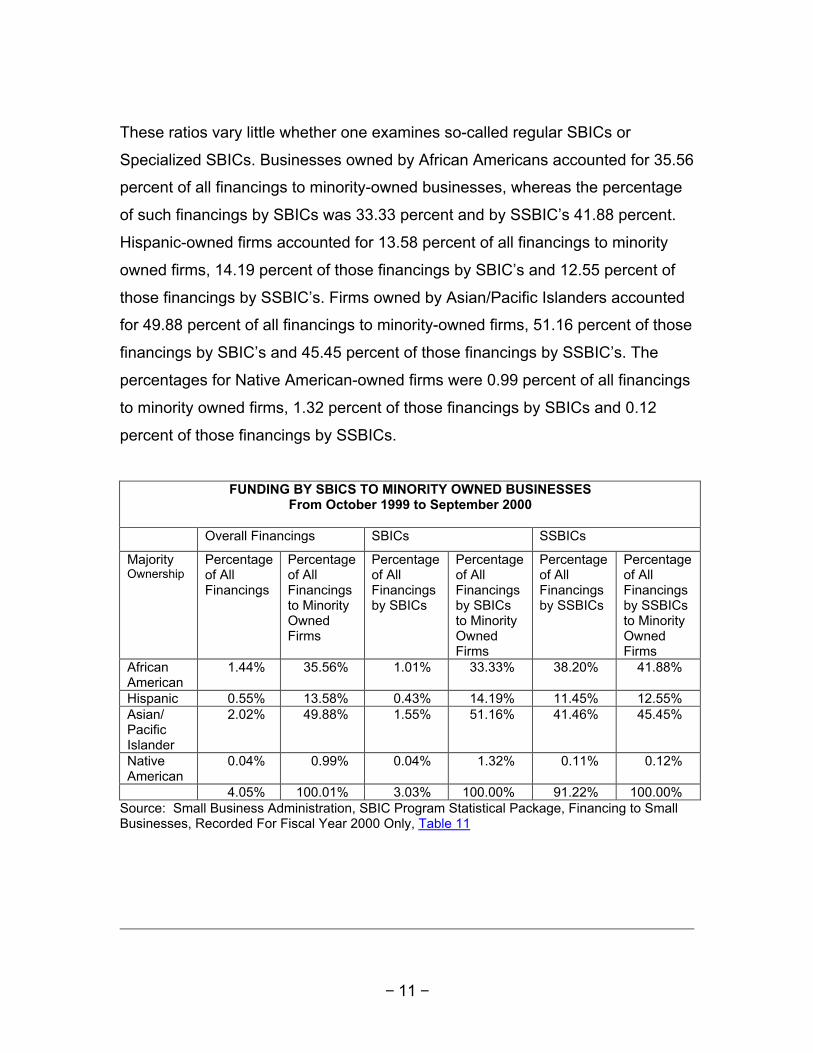
These ratios vary little whether one examines so-called regular SBICs or
Specialized SBICs. Businesses owned by African Americans accounted for 35.56
percent of all financings to minority-owned businesses, whereas the percentage
of such financings by SBICs was 33.33 percent and by SSBIC’s 41.88 percent.
Hispanic-owned firms accounted for 13.58 percent of all financings to minority
owned firms, 14.19 percent of those financings by SBIC’s and 12.55 percent of
those financings by SSBIC’s. Firms owned by Asian/Pacific Islanders accounted
for 49.88 percent of all financings to minority-owned firms, 51.16 percent of those
financings by SBIC’s and 45.45 percent of those financings by SSBIC’s. The
percentages for Native American-owned firms were 0.99 percent of all financings
to minority owned firms, 1.32 percent of those financings by SBICs and 0.12
percent of those financings by SSBICs.
FUNDING BY SBICS TO MINORITY OWNED BUSINESSESFrom October 1999 to September 2000
Overall Financings SBICs SSBICs
MajorityOwnership
Percentageof AllFinancings
Percentageof AllFinancingsto MinorityOwnedFirms
Percentageof AllFinancingsby SBICs
Percentageof AllFinancingsby SBICsto MinorityOwnedFirms
Percentageof AllFinancingsby SSBICs
Percentageof AllFinancingsby SSBICsto MinorityOwnedFirms
AfricanAmerican
1.44% 35.56% 1.01% 33.33% 38.20% 41.88%
Hispanic 0.55% 13.58% 0.43% 14.19% 11.45% 12.55%Asian/PacificIslander
2.02% 49.88% 1.55% 51.16% 41.46% 45.45%
NativeAmerican
0.04% 0.99% 0.04% 1.32% 0.11% 0.12%
4.05% 100.01% 3.03% 100.00% 91.22% 100.00%Source: Small Business Administration, SBIC Program Statistical Package, Financing to SmallBusinesses, Recorded For Fiscal Year 2000 Only, Table 11

− 12 −
The disproportionate percentage of SBIC financings may be due unequal rates of
participation in technology-related education and the technology-related
workforce, and differing entrepreneurial experiences within each minority group.
Minority Participation in Technology Education
If technology is the driving force behind the most successful business enterprises
in this country, the pool of prospective minority entrepreneurs in this area is
largely limited by the number of African-American, Hispanic and Native American
individuals who pursue higher education in science and engineering. Additionally,
there is a correlation between each minority group’s representation in higher
education and the work force, and the numbers of successful entrepreneurs.
Science and Engineering Bachelor Degrees, by Race and Hispanic Origin
Research by the National Science Foundation shows that for the most part,
African Americans, Hispanics and Native Americans are underrepresented, but
that Asian/Pacific Islanders are over-represented in science and engineering
bachelor’s, master’s and doctorate programs. In 1995, the population of 18 to 30-
year olds of U.S. residents was Asian/Pacific Islander 4 percent, African
American 14 percent, Hispanic 13 percent, and Native American 0.8 percent.6
However, a review of the number of science and engineering bachelor’s degrees
conferred in 1996 shows that Asian/Pacific Islanders earned 7.93 percent these
degrees, while African Americans earned 7.43 percent, Hispanics 6.08 percent,
and Native Americans 0.58 percent.7
6 “Data Brief NSF 99-320, January 15, 1999.” National Science Foundation. National ScienceFoundation. 7 February 2001. <http://www.nsf.gov/sbe/srs/databrf/sdb99320.htm>.
7 “Science & Engineering Indicators 2000.” National Science Foundation. National ScienceFoundation. 7 February 2001. <http://www.nsf.gov/sbe/srs/seind00/start.htm>.

− 13 −
Science and Engineering Bachelor’s DegreesConferred to U.S. Citizens or Permanent Residents in 1996, By Race and Hispanic Origin
Asian/PacificIslander
AfricanAmerican
Hispanic NativeAmerican
Number Percent Number Percent Number Percent Number Percent
U.S. Population 18-30(1995)
4.00% 14.00% 13.00% 0.80%
All Degrees (any field) 63,117 5.53% 89,554 7.84% 71,015 6.22% 6,813 0.60%
Science and engineering: 31,031 7.93% 29,055 7.43% 23,791 6.08% 2,268 0.58% Natural sciences 9,829 10.22% 5,274 5.48% 4,899 5.09% 559 0.58% Math and computersciences
3,383 9.70% 3,396 9.74% 1,865 5.35% 142 0.41%
Engineering 6,799 11.66% 3,000 5.15% 3,731 6.40% 243 0.42%
Source: National Science Foundation, “Science & Engineering Indicators – 2000” and NationalScience Foundation Data Brief, NSF 99-320, January 15, 1999.
The disparity between each group’s representation in the 18 to 30 year-old
population and the percentage of science and engineering bachelor’s degrees
earned in 1996 is greater in fields more closely related to high technology. In the
area of mathematics and computer science, Asian/Pacific Islanders earned 9.70
percent of bachelor’s degrees, African Americans earned 9.74 percent, Hispanics
earned 5.35 percent, and Native Americans earned .41 percent. In engineering,
Asian/Pacific Islanders earned 11.66 percent of degrees, African Americans
earned 5.15 percent, Hispanics earned 6.40 percent, and Native Americans
earned 0.42 percent. Asian/Pacific Islanders and African Americans favored
mathematics and computer science, and Asian/Pacific Islanders and Hispanics
favored engineering.8
Engineering technology, which is not considered a science and engineering
degree, was slightly favored by all underrepresented minorities and disfavored by
Asian/Pacific Islanders. Of the bachelor’s degrees in engineering technology
8 “Science & Engineering Indicators 2000.” National Science Foundation. National ScienceFoundation. 7 February 2001. <http://www.nsf.gov/sbe/srs/seind00/start.htm>.
− 14 −
conferred, Asian/Pacific Islanders received 4.79 percent, African Americans 8.99
percent, Hispanics 6.49 percent, and Native Americans 0.74 percent.9
Longitudinal Increases in Science and Engineering Bachelor’s Degreesamong Minorities, from 1977 to 1996
These figures must be considered in the context of a longitudinal increase in the
number and percentage of minorities pursuing higher education, and science and
engineering in particular. A National Science Foundation analysis of Census
Bureau, Department of Education, and its own data showed that a higher
percentage of the 24 year-old general and minority population had bachelor
degrees in 1996 than 1980. For the total 24 year-old population, the percentage
increased to 32.1 from 22.2; Asian/Pacific Islanders increased to 39.2 from 29.5,
African Americans increased to 17.7 from 11.2, Hispanics increased to 14.2 from
10.5, and Native Americans increased to 20.6 from 12.1.10
A comparison of bachelor degrees conferred in 1977 and 1996 also shows that
an increasing number of U.S. citizens and permanent residents earning
bachelor’s degrees, with minorities earning a greater percentage of the science
and engineering degrees than in the past. In 1977, a total of 910,835 bachelor’s
degrees were conferred, and in 1996, a total of 1,142,028 were, with a
decreasing percentage (36.16 percent in 1977 and 34.24 percent in 1996) in
science and engineering.11
9 “Science & Engineering Indicators 2000.” National Science Foundation. National ScienceFoundation. 7 February 2001. <http://www.nsf.gov/sbe/srs/seind00/start.htm>.
10 “Science & Engineering Indicators 2000.” National Science Foundation. National ScienceFoundation. 7 February 2001. <http://www.nsf.gov/sbe/srs/seind00/start.htm>.
11 “Science & Engineering Indicators 2000.” National Science Foundation. National ScienceFoundation. 7 February 2001. <http://www.nsf.gov/sbe/srs/seind00/start.htm>.
− 15 −
Percentage of Science and Engineering Bachelor’s DegreesConferred to U.S. Citizens or Permanent Residents in 1996, by Race and Hispanic Origin
Asian/PacificIslander
AfricanAmerican
Hispanic Native American
1977 1996 1977 1996 1977 1996 1977 1996
Total Science andEngineering
1.88% 7.93% 5.94% 7.43% 2.92% 6.08% 0.35% 0.58%
Natural sciences 2.01% 10.22% 3.55% 5.48% 2.36% 5.09% 0.35% 0.58% Math and computersciences
2.38% 9.70% 5.33% 9.74% 2.16% 5.35% 0.20% 0.41%
Engineering 2.63% 11.66% 3.00% 5.15% 2.80% 6.40% 0.29% 0.42%Source: National Science Foundation, “Science & Engineering Indicators – 2000”
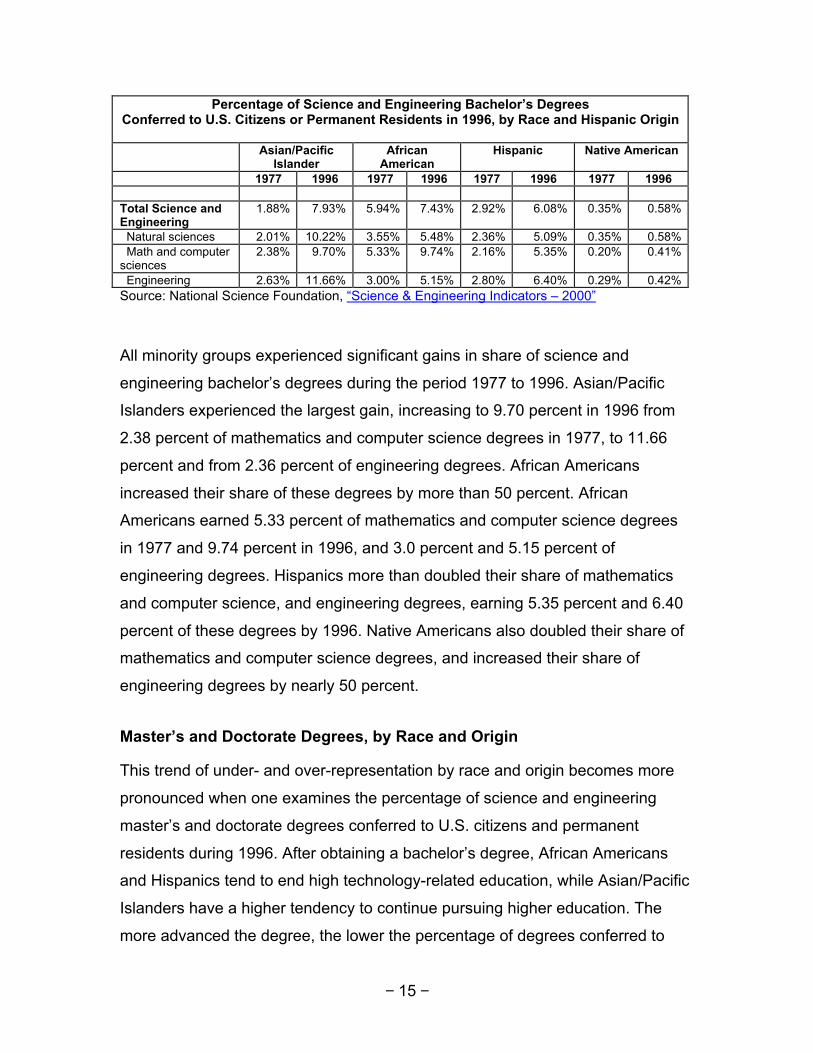
All minority groups experienced significant gains in share of science and
engineering bachelor’s degrees during the period 1977 to 1996. Asian/Pacific
Islanders experienced the largest gain, increasing to 9.70 percent in 1996 from
2.38 percent of mathematics and computer science degrees in 1977, to 11.66
percent and from 2.36 percent of engineering degrees. African Americans
increased their share of these degrees by more than 50 percent. African
Americans earned 5.33 percent of mathematics and computer science degrees
in 1977 and 9.74 percent in 1996, and 3.0 percent and 5.15 percent of
engineering degrees. Hispanics more than doubled their share of mathematics
and computer science, and engineering degrees, earning 5.35 percent and 6.40
percent of these degrees by 1996. Native Americans also doubled their share of
mathematics and computer science degrees, and increased their share of
engineering degrees by nearly 50 percent.
Master’s and Doctorate Degrees, by Race and Origin
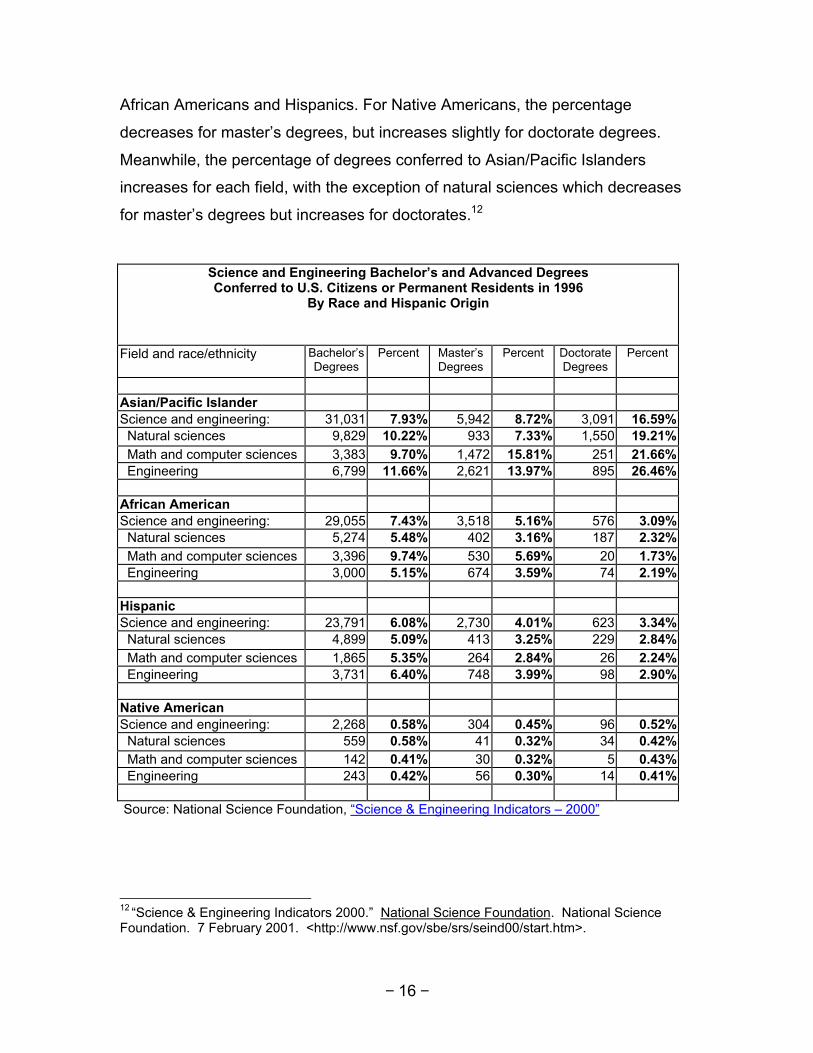
This trend of under- and over-representation by race and origin becomes more
pronounced when one examines the percentage of science and engineering
master’s and doctorate degrees conferred to U.S. citizens and permanent
residents during 1996. After obtaining a bachelor’s degree, African Americans
and Hispanics tend to end high technology-related education, while Asian/Pacific
Islanders have a higher tendency to continue pursuing higher education. The
more advanced the degree, the lower the percentage of degrees conferred to
− 16 −
African Americans and Hispanics. For Native Americans, the percentage
decreases for master’s degrees, but increases slightly for doctorate degrees.
Meanwhile, the percentage of degrees conferred to Asian/Pacific Islanders
increases for each field, with the exception of natural sciences which decreases
for master’s degrees but increases for doctorates.12
Science and Engineering Bachelor’s and Advanced DegreesConferred to U.S. Citizens or Permanent Residents in 1996
By Race and Hispanic Origin
Field and race/ethnicity Bachelor’sDegrees
Percent Master’sDegrees
Percent DoctorateDegrees
Percent
Asian/Pacific IslanderScience and engineering: 31,031 7.93% 5,942 8.72% 3,091 16.59% Natural sciences 9,829 10.22% 933 7.33% 1,550 19.21% Math and computer sciences 3,383 9.70% 1,472 15.81% 251 21.66% Engineering 6,799 11.66% 2,621 13.97% 895 26.46%
African AmericanScience and engineering: 29,055 7.43% 3,518 5.16% 576 3.09% Natural sciences 5,274 5.48% 402 3.16% 187 2.32% Math and computer sciences 3,396 9.74% 530 5.69% 20 1.73% Engineering 3,000 5.15% 674 3.59% 74 2.19%
HispanicScience and engineering: 23,791 6.08% 2,730 4.01% 623 3.34% Natural sciences 4,899 5.09% 413 3.25% 229 2.84% Math and computer sciences 1,865 5.35% 264 2.84% 26 2.24% Engineering 3,731 6.40% 748 3.99% 98 2.90%
Native AmericanScience and engineering: 2,268 0.58% 304 0.45% 96 0.52% Natural sciences 559 0.58% 41 0.32% 34 0.42% Math and computer sciences 142 0.41% 30 0.32% 5 0.43% Engineering 243 0.42% 56 0.30% 14 0.41%
Source: National Science Foundation, “Science & Engineering Indicators – 2000”
12 “Science & Engineering Indicators 2000.” National Science Foundation. National ScienceFoundation. 7 February 2001. <http://www.nsf.gov/sbe/srs/seind00/start.htm>.
− 17 −
Again, these differences in advanced degrees are most pronounced in the high
technology-related fields. In 1996, the percentage of Asian/Pacific Islanders who
were conferred mathematics and computer science bachelor’s, master’s, and
doctorate degrees steadily climbed from 9.70 percent to 15.81 percent to 21.66
percent. Notably, African Americans accounted for more mathematics and
computer science bachelor’s degrees during that year, 9.74 percent. But
master’s degrees dropped to 6.69 percent, and doctorate degrees dropped most
dramatically to 1.73 percent. Mathematics and computer science advanced
degrees dropped most significantly for Hispanics at the master’s degree level,
starting with 5.35 percent of mathematics and computer science bachelor’s
degrees, then declining by more than half to 2.34 of master’s degrees, then 2.24
percent of doctorates.13
For engineering, during 1996, Asian/Pacific Islanders earned 11.66 percent of
bachelor’s degrees but 26.46 percent of doctorates. The percentages dropped
for African Americans, from 5.15 percent of bachelor’s, to 3.59 percent of
master’s degrees, and 2.19 percent of doctorates. Hispanics started with 6.40
percent of bachelor’s, declined to 3.99 percent of master’s, then to 2.90 percent
of doctorates.14
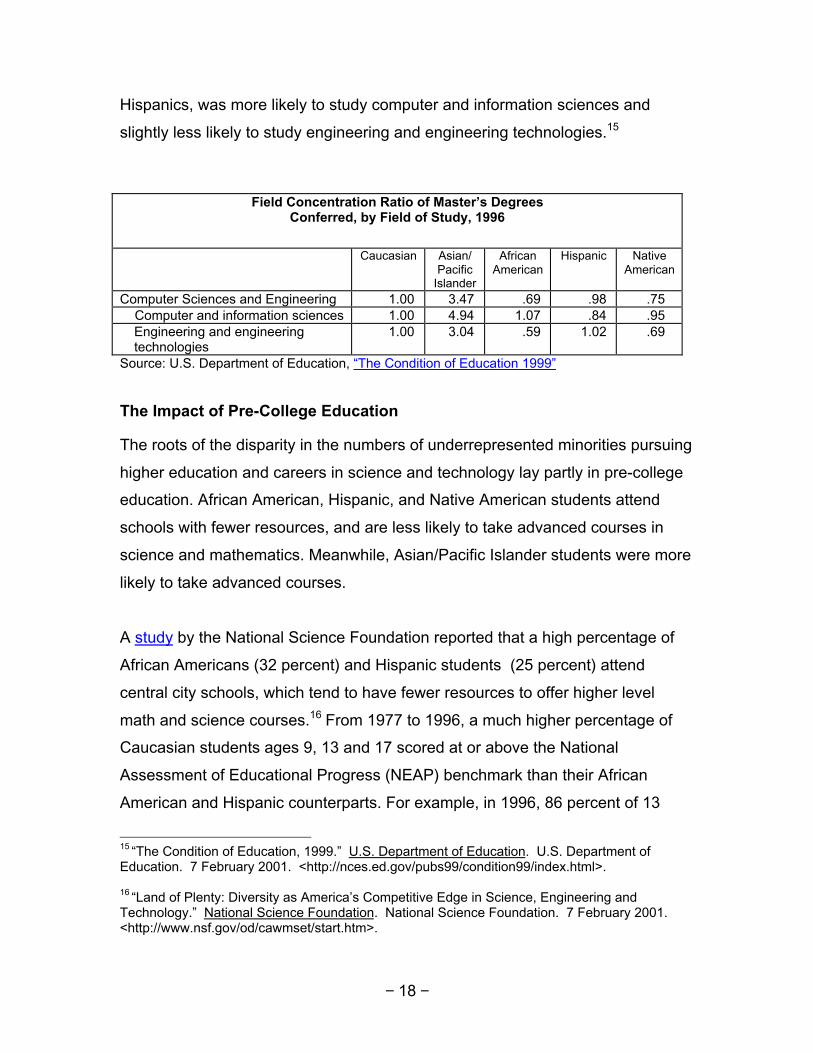
Comparing the frequency that various minority groups obtain degrees in specific
science and engineering fields to their Caucasian counterparts offers another
perspective. A study by the Department of Education of degrees conferred in
1996 shows that Asian/Pacific Islanders are 3.47 times as likely as Caucasians
to earn a master’s degree in computer science and engineering. African
Americans were only 0.69 times as likely, Hispanics were 0.98 as likely, and
Native Americans were 0.75 as likely. Each group, with the exception of
13 “Science & Engineering Indicators 2000.” National Science Foundation. National ScienceFoundation. 7 February 2001. <http://www.nsf.gov/sbe/srs/seind00/start.htm>.
14 “Science & Engineering Indicators 2000.” National Science Foundation. National ScienceFoundation. 7 February 2001. <http://www.nsf.gov/sbe/srs/seind00/start.htm>.
− 18 −
Hispanics, was more likely to study computer and information sciences and
slightly less likely to study engineering and engineering technologies.15
Field Concentration Ratio of Master’s DegreesConferred, by Field of Study, 1996
Caucasian Asian/Pacific
Islander
AfricanAmerican
Hispanic NativeAmerican
Computer Sciences and Engineering 1.00 3.47 .69 .98 .75 Computer and information sciences 1.00 4.94 1.07 .84 .95
Engineering and engineeringtechnologies
1.00 3.04 .59 1.02 .69
Source: U.S. Department of Education, “The Condition of Education 1999”
The Impact of Pre-College Education
The roots of the disparity in the numbers of underrepresented minorities pursuing
higher education and careers in science and technology lay partly in pre-college
education. African American, Hispanic, and Native American students attend
schools with fewer resources, and are less likely to take advanced courses in
science and mathematics. Meanwhile, Asian/Pacific Islander students were more
likely to take advanced courses.
A study by the National Science Foundation reported that a high percentage of
African Americans (32 percent) and Hispanic students (25 percent) attend
central city schools, which tend to have fewer resources to offer higher level
math and science courses.16 From 1977 to 1996, a much higher percentage of
Caucasian students ages 9, 13 and 17 scored at or above the National
Assessment of Educational Progress (NEAP) benchmark than their African
American and Hispanic counterparts. For example, in 1996, 86 percent of 13
15 “The Condition of Education, 1999.” U.S. Department of Education. U.S. Department ofEducation. 7 February 2001. <http://nces.ed.gov/pubs99/condition99/index.html>.
16 “Land of Plenty: Diversity as America’s Competitive Edge in Science, Engineering andTechnology.” National Science Foundation. National Science Foundation. 7 February 2001.<http://www.nsf.gov/od/cawmset/start.htm>.
− 19 −
year-old Caucasian students, 54 percent of African American students, and 58
percent of Hispanic students scored at the 250 NEAP benchmark.17
African-American, Hispanic and Native American minority students are also less
likely than their Asian/Pacific Islander and Caucasian counterparts to take
Advanced Placement courses. In 1996, these students were 25 percent of the
population, but were only 5 to 10 percent of Advanced Placement exam test-
takers.18
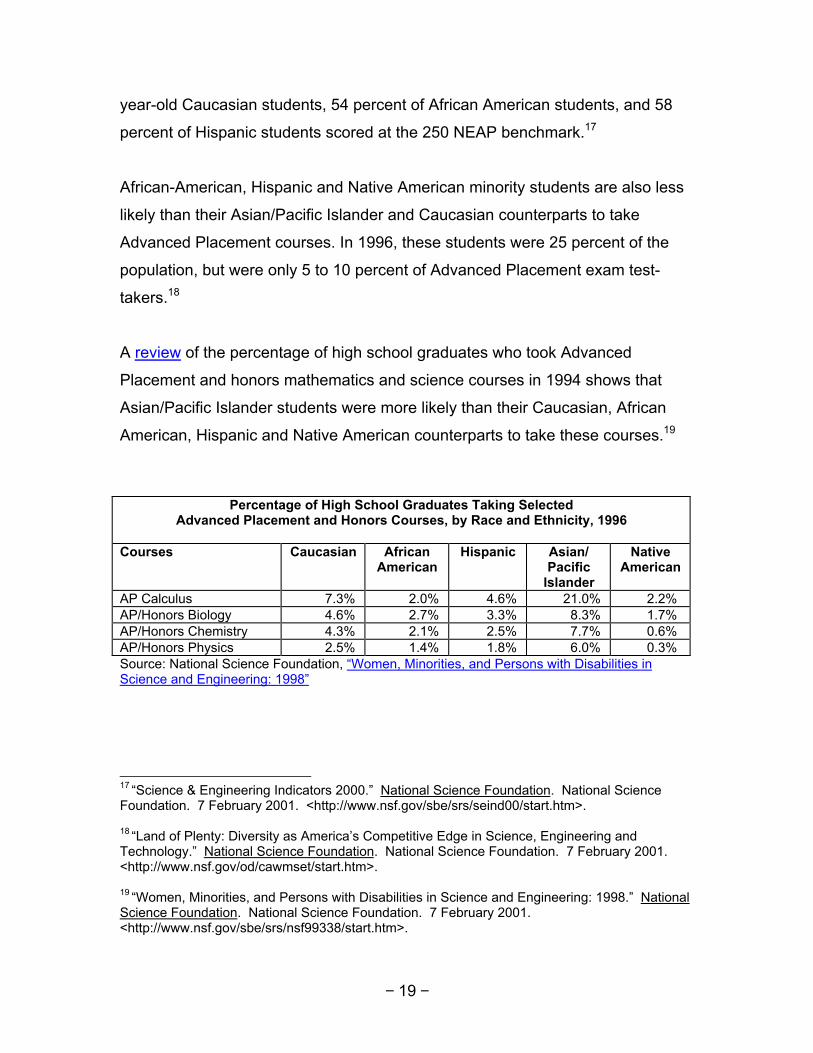
A review of the percentage of high school graduates who took Advanced
Placement and honors mathematics and science courses in 1994 shows that
Asian/Pacific Islander students were more likely than their Caucasian, African
American, Hispanic and Native American counterparts to take these courses.19
Percentage of High School Graduates Taking SelectedAdvanced Placement and Honors Courses, by Race and Ethnicity, 1996
Courses Caucasian AfricanAmerican
Hispanic Asian/Pacific
Islander
NativeAmerican
AP Calculus 7.3% 2.0% 4.6% 21.0% 2.2%AP/Honors Biology 4.6% 2.7% 3.3% 8.3% 1.7%AP/Honors Chemistry 4.3% 2.1% 2.5% 7.7% 0.6%AP/Honors Physics 2.5% 1.4% 1.8% 6.0% 0.3%Source: National Science Foundation, “Women, Minorities, and Persons with Disabilities inScience and Engineering: 1998”
17 “Science & Engineering Indicators 2000.” National Science Foundation. National ScienceFoundation. 7 February 2001. <http://www.nsf.gov/sbe/srs/seind00/start.htm>.
18 “Land of Plenty: Diversity as America’s Competitive Edge in Science, Engineering andTechnology.” National Science Foundation. National Science Foundation. 7 February 2001.<http://www.nsf.gov/od/cawmset/start.htm>.
19 “Women, Minorities, and Persons with Disabilities in Science and Engineering: 1998.” NationalScience Foundation. National Science Foundation. 7 February 2001.<http://www.nsf.gov/sbe/srs/nsf99338/start.htm>.
− 20 −
Representation in the Science and Engineering Workforce, by Race andOrigin
This trend of African American, Hispanic and Native American under-
representation, and Asian/Pacific Islander over-representation, in secondary
education and higher education continues into the science, engineering, and
technology workforce.
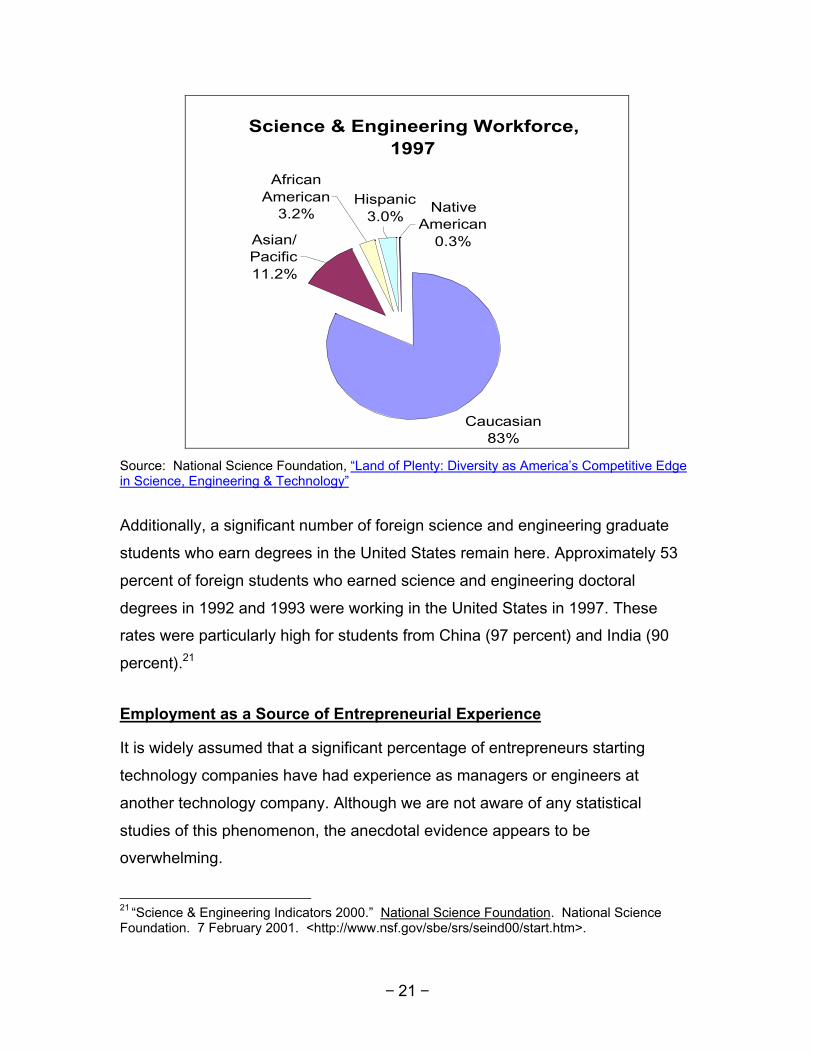
In 1997, minority representation in the science, engineering and technology
workforce was Asian/Pacific Islander 11.2 percent, African American 3.2 percent,
Hispanic 3 percent, and Native American 0.3 percent. More specifically,
representation in the computer science workforce was African Americans 4.3
percent, Asian/Pacific Islanders were 12.2 percent, Hispanics were 2.6 percent,
and Native Americans were 0.2 percent. And for engineering, representation was
African Americans 2.6 percent, Asian/Pacific Islanders were 10.9 percent,
Hispanics were 3.5 percent and Native Americans were 0.3 percent.20
20 “Land of Plenty: Diversity as America’s Competitive Edge in Science, Engineering andTechnology.” National Science Foundation. National Science Foundation. 7 February 2001.<http://www.nsf.gov/od/cawmset/start.htm>.
− 21 −
Science & Engineering Workforce, 1997
Caucasian83%
African American
3.2%
Asian/ Pacific11.2%
Native American
0.3%
Hispanic3.0%
Source: National Science Foundation, “Land of Plenty: Diversity as America’s Competitive Edgein Science, Engineering & Technology”
Additionally, a significant number of foreign science and engineering graduate
students who earn degrees in the United States remain here. Approximately 53
percent of foreign students who earned science and engineering doctoral
degrees in 1992 and 1993 were working in the United States in 1997. These
rates were particularly high for students from China (97 percent) and India (90
percent).21
Employment as a Source of Entrepreneurial Experience
It is widely assumed that a significant percentage of entrepreneurs starting
technology companies have had experience as managers or engineers at
another technology company. Although we are not aware of any statistical
studies of this phenomenon, the anecdotal evidence appears to be
overwhelming.
21 “Science & Engineering Indicators 2000.” National Science Foundation. National ScienceFoundation. 7 February 2001. <http://www.nsf.gov/sbe/srs/seind00/start.htm>.
− 22 −
An analysis of the available data from the Equal Employment Opportunity
Commission with respect to the participation rate for members of minority groups
in managerial, professional and technical positions at technology firms indicates
that African Americans and Hispanics lag behind in this crucial opportunity for
relevant experience. Asian/Pacific Islander show no such deficiency. Indeed, the
statistics for investments by SBICs mirrors these statistics and show that a
disproportionate percentage of investment in minority owned companies is in
Asian/Pacific Islander owned companies, even when the investments of SSBICs
are considered separately.
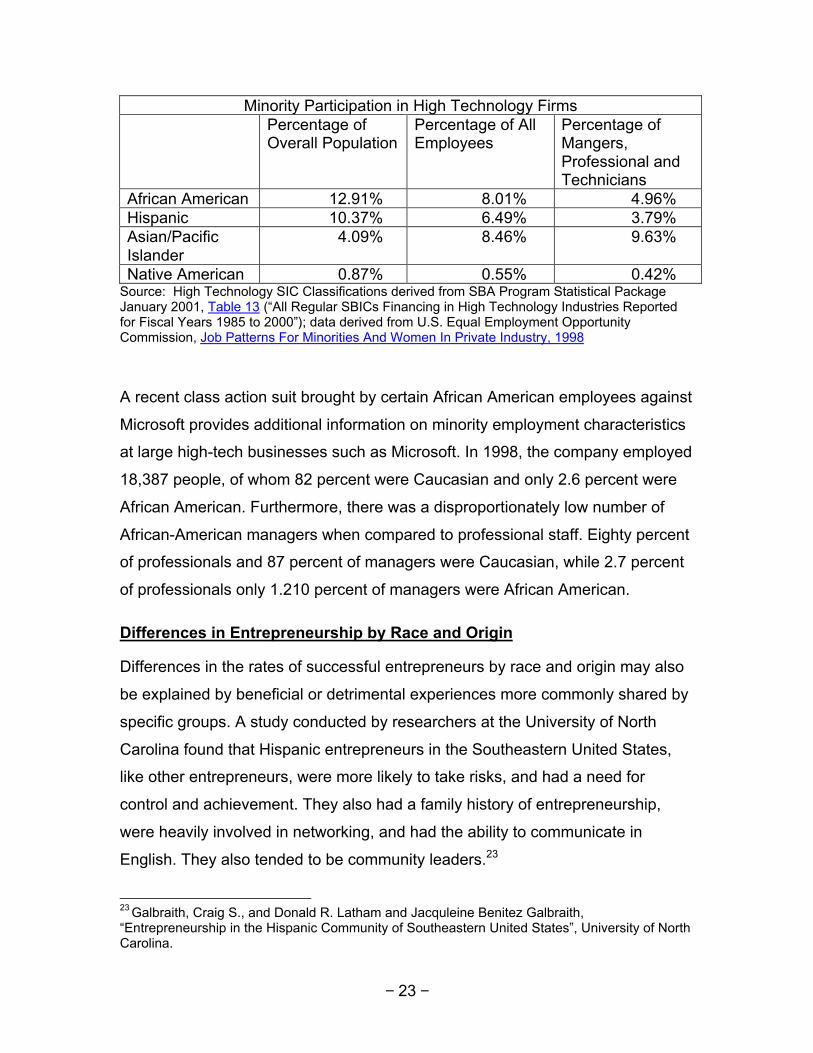
As projected by the United States Census Bureau, African American represented
12.91 percent of the overall population in 2000, with Hispanics representing
10.37 percent, Asian/Pacific Islanders representing 4.09 percent and Native
Americans/Alaskan Natives representing 0.87 percent.22 However, the
participation rates are drastically different if you examine the numbers of
managers, professionals and technicians in those industries identified by the
SBA as “high technology.” Although African Americans represent 8.01 percent of
the overall employees of those companies, they represent only 4.96 percent of
the managers, professionals and technicians. Similarly, Hispanics represent 6.49
percent of the overall employees of those companies but only 3.79 percent of the
managers, professionals and technicians. Conversely, Asian/Pacific Islanders
represent 8.46 percent of the overall employees of those companies and 9.63
percent of the managers, professionals and technicians. Native
Americans/Alaskan Natives represent 0.55 percent of the overall employees of
those companies and 0.42 percent of the managers, professionals and
technicians.
22 MBDA: The Emerging Minority Marketplace, Table 1, Projections and Percent Distribution ofthe Population by Race and Hispanic Origin: 1995 to 2050
− 23 −
Minority Participation in High Technology FirmsPercentage ofOverall Population
Percentage of AllEmployees
Percentage ofMangers,Professional andTechnicians
African American 12.91% 8.01% 4.96%Hispanic 10.37% 6.49% 3.79%Asian/PacificIslander
4.09% 8.46% 9.63%
Native American 0.87% 0.55% 0.42%Source: High Technology SIC Classifications derived from SBA Program Statistical PackageJanuary 2001, Table 13 (“All Regular SBICs Financing in High Technology Industries Reportedfor Fiscal Years 1985 to 2000”); data derived from U.S. Equal Employment OpportunityCommission, Job Patterns For Minorities And Women In Private Industry, 1998
A recent class action suit brought by certain African American employees against
Microsoft provides additional information on minority employment characteristics
at large high-tech businesses such as Microsoft. In 1998, the company employed
18,387 people, of whom 82 percent were Caucasian and only 2.6 percent were
African American. Furthermore, there was a disproportionately low number of
African-American managers when compared to professional staff. Eighty percent
of professionals and 87 percent of managers were Caucasian, while 2.7 percent
of professionals only 1.210 percent of managers were African American.
Differences in Entrepreneurship by Race and Origin
Differences in the rates of successful entrepreneurs by race and origin may also
be explained by beneficial or detrimental experiences more commonly shared by
specific groups. A study conducted by researchers at the University of North
Carolina found that Hispanic entrepreneurs in the Southeastern United States,
like other entrepreneurs, were more likely to take risks, and had a need for
control and achievement. They also had a family history of entrepreneurship,
were heavily involved in networking, and had the ability to communicate in
English. They also tended to be community leaders.23
23 Galbraith, Craig S., and Donald R. Latham and Jacquleine Benitez Galbraith,“Entrepreneurship in the Hispanic Community of Southeastern United States”, University of NorthCarolina.
− 24 −
Recent articles suggest that some of these and other factors may also influence
success among African American entrepreneurs. Further research comparing the
impact of specific factors on entrepreneurs across race and origin would be
useful in developing policy and programs to address the disproportionate rates of
participation.
Some areas to be explored might include historic and perceived access to
capital; exposure to capital; and involvement in networking, which are discussed
below. Another factor is the relationship between immigration and
entrepreneurship. It is significant that a majority of Asian/Pacific Islanders funded
by mainstream venture capitalists are recent immigrants.
A historic lack of access to capital from banks and private investors, and possibly
bias, continue to have an impact on African Americans today. It is estimated that
African Americans received less than 0.25 percent of the $46.5 billion in private
equity invested in 1999. Some African American entrepreneurs feel that they are
subjected to a higher threshold for raising capital than Caucasians and
Asian/Pacific Islanders.24 By contrast, many Hispanics feel that there has been
an improvement in their access to bank loans over the past 20 years.25 Bias,
intentional or not, does affect capital access. Additionally, perceived bias may
also impact on aggressiveness in seeking and success in obtaining capital.
The percentage of individuals seeking further education and careers in high
technology may be influenced by exposure to technology and technology use.
When it comes to Internet usage by households, which increases cyber-literacy,
24 Abramson, Ronna. “Networks of Color.” The Standard. 13 November 2000. The IndustryStandard. 7 February 2001 <http://www.thestandard.com/article/display/0,1151,20076,00.html>.
25 Nicolova, Rossitsa. “Hispanic Entrepreneurs are gaining clout.” Kansas City. 25 September1998. The Business Journal Serving Metropolitan Kansas City. 7 February 2001<http://kansascity.bcentral.com/kansascity/stories/1998/09/28/story4.html>.
− 25 −
African Americans have the lowest percentage and Asian/Pacific Islanders have
the highest.26 Likewise, Hispanics did not study fields such as engineering in the
past because they felt that they would not be accepted within the industry and
few others in their community pursued such careers.27
Involvement in mainstream networking along industry lines may also have an
impact on an entrepreneur’s success. The Indus Entrepreneurs (TIE) and the
Washington High Tech Council have both emerged as powerful networks of
Asian/Pacific Islander entrepreneurs. Their ranks consist of some extremely
successful CEOs who in turn have become angel investors in new minority
ventures. These entrepreneurial networks provide valuable guidance and
capital, they also open the doors to many companies.
While African American technology and entrepreneurial networking groups have
sprouted on both coasts and in the Midwest, many of the people of color are not
involved in networking outside of these groups. These networking groups include
the Network, Minority Internet and Technology Professionals (MITP), Chicago
InterNetworking, Network of African American Technology Entrepreneurs List
(NATELi), and Bay Area InterNetwork.28 In the Hispanic community, there is
National Internet Community of Hispanic Entrepreneurs (NICHE-Net). However,
some also feel that more Hispanics would be successful if they became involved
in mainstream networks for their industries.29
26 Ehmann, Lain Chroust. “Beyond the Pale.” The Standard. 24 January 2000. The IndustryStandard. 7 February 2001 < http://www.thestandard.com/article/display/0,1151,9069,00.html>.
27 Barbee, Darren and Tom Whitehurst Jr. “Public employers are more diverse at the top.” Caller.
10 November 1999. Corpus Christi Caller Times. 7 February 2001<http://www.caller.com/1999/november/10/today/local_ne/832.html>.
28 Abramson, Ronna. “Networks of Color.” The Standard. 13 November 2000. The IndustryStandard. 7 February 2001 < http://www.thestandard.com/article/display/0,1151,20076,00.html>.
29 Barbee, Darren and Tom Whitehurst Jr. “Public employers are more diverse at the top.” Caller.10 November 1999. Corpus Christi Caller Times. 7 February 2001<http://www.caller.com/1999/november/10/today/local_ne/832.html>.
− 26 −
FUNDING FOR MINORITY ENTERPRISES
If one distinguishes between programs aimed at growth or entrepreneurial
companies anticipating or attaining rapid growth, entrepreneurial financing
programs such as the Small Business Investment Companies (SBIC) program
and the Small Business Innovation Research (SBIR) program have had limited
impact on the overall growth of minority-owned entrepreneurial companies.
Most enterprises are funded by a combination of equity, debt, sales and
miscellaneous sources of capital, such as grants. The combination varies with
the growth characteristics of the business and the ability of the capital to grow
exponentially. High growth business tends to require large infusions of capital at
an early stage where there are few assets – fixed or movable – that can be
collateralized. Slower growing businesses have to build their asset base before
they can attract capital, which is mostly in the form of debt. Most businesses rely
on the profit from sales to fund growth.
Minority enterprises are no different. Their demographics limit their ability to
borrow. And there are relatively few companies that fit into the venture capital
mold. As a result, large numbers of minority-owned businesses have relied on
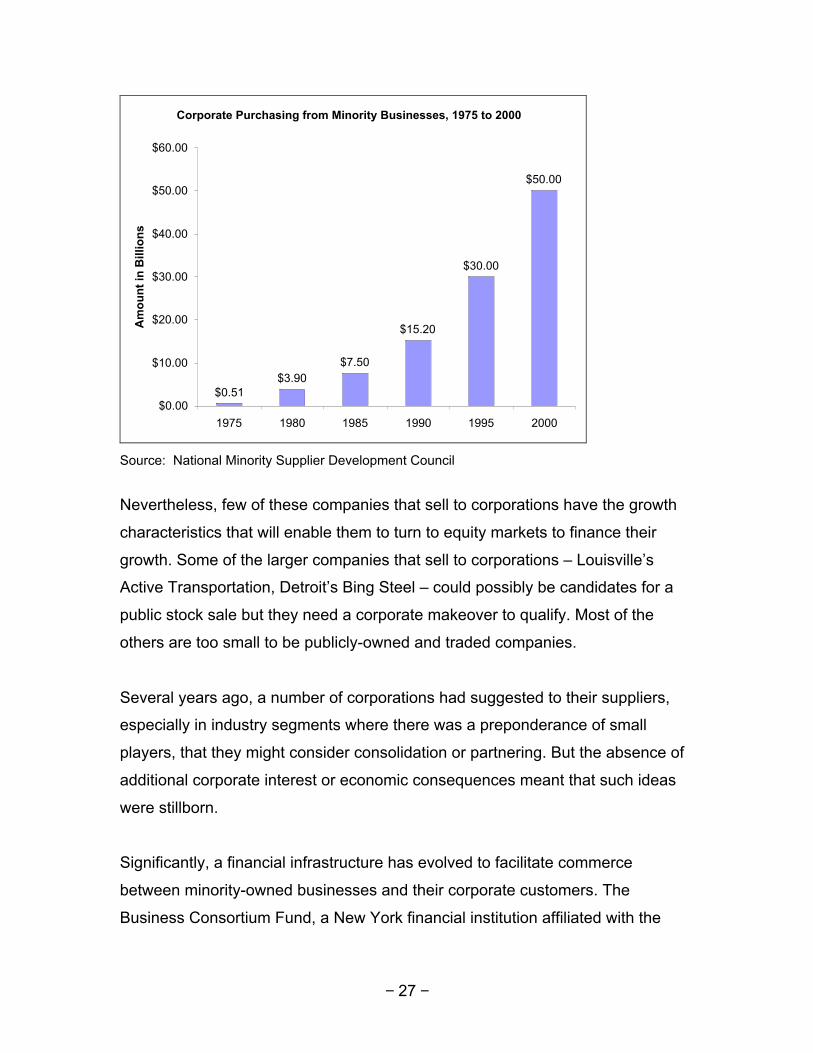
selling to corporations as a major source of revenue and growth. According to the
National Minority Supplier Development Council (MSDC), a New York-based
group that certifies minority-owned businesses, minority business enterprises
(MBEs) in 2000 sold an estimated $50 billion of goods and services to
corporations doing business in the United States.
According to the NMSDC, purchasing activity by corporations from minority
businesses has steadily climbed from $86 million in 1972 to $50 billion in 2000.
− 27 −
Corporate Purchasing from Minority Businesses, 1975 to 2000
$0.51$3.90
$7.50
$15.20
$30.00
$50.00
$0.00
$10.00
$20.00
$30.00
$40.00
$50.00
$60.00
1975 1980 1985 1990 1995 2000
Am
ou
nt
in B
illio
ns
Source: National Minority Supplier Development Council
Nevertheless, few of these companies that sell to corporations have the growth
characteristics that will enable them to turn to equity markets to finance their
growth. Some of the larger companies that sell to corporations – Louisville’s
Active Transportation, Detroit’s Bing Steel – could possibly be candidates for a
public stock sale but they need a corporate makeover to qualify. Most of the
others are too small to be publicly-owned and traded companies.
Several years ago, a number of corporations had suggested to their suppliers,
especially in industry segments where there was a preponderance of small
players, that they might consider consolidation or partnering. But the absence of
additional corporate interest or economic consequences meant that such ideas
were stillborn.
Significantly, a financial infrastructure has evolved to facilitate commerce
between minority-owned businesses and their corporate customers. The
Business Consortium Fund, a New York financial institution affiliated with the

− 28 −
NMSDC, will finance purchase orders that corporate customers give to their
MBEs. In 16 years of its existence, BCF has provided $115.9 million in loans to
MBEs. Unfortunately, the BCF serves a very small portion of the MBE universe
and it is seen to be extremely slow in responding to its clients. Moreover, its rates
and transaction fees, while somewhat lower than those charged by mainstream
asset-based lenders can still be quite onerous for small MBEs.
Corporations themselves also have helped finance the operations of their
minority suppliers. Ford Motor Co., through its Dearborn Capital SSBIC, has
provided a significant amount of capital to MBEs, but has limited its involvement
to those companies that do business with the automaker.
Corporate SSBICs such as Dearborn Capital and institutions such as the BCF
could be more effective in the markets they serve. Unfortunately, these
organizations suffer from a lack of experienced financing professionals as well as
limited operating capital, factors that have hurt their ability to play a larger and
wider role.
Although the number of corporate dollars directed at minority-owned businesses
continues to grow, they are a decreasing proportion of total corporate
expenditures. It is believed that corporate America – except in some very select
areas – has not assimilated minority-produced goods and services into their
“critical” goods and services area. Moreover, there is also the fear that the push
towards electronic marketplaces such as Covisint – the procurement portal being
jointly developed by Ford, General Motors and Chrysler-Daimler – will reduce
minority business access to corporate customers. Most minority businesses
aren’t geared to efficiently participate in electronics selling. Moreover, there is a
belief that the competition on these purchasing portals will be on price, ignoring
some of the key advantages that minority goods and services bring to the
marketplace.
− 29 −
Government Programs Aimed at Small Business
The major funding programs for small businesses fall under the auspices of the
Small Business Administration. And although the SBA has announced a number
of specialized programs aimed at start-up and or minority business, it is doubtful
that any of these programs have had, or will have, a major impact on the
advancement of businesses owned by minority entrepreneurs.
A number of states and cities also have financing programs aimed at smaller
businesses. But these programs have generally proved ineffective as sources of
equity capital for small businesses, including MBEs.
The initial government programs directed at minorities were aimed specifically at
helping African Americans. Over the next two decades, these programs began to
address other minorities as well. But the perception that these programs are
primarily African American in scope continues today. Indeed, African-American
businesses are the largest group of businesses on certified MBE rosters,
followed by Hispanics and Asian/Pacific Islanders.
Overview of SBA Programs
The principal loan program of the SBA is the 7(a) Loan Guaranty Program. The
basic parameters of the 7(a) program are (a) that the borrower meets the SBA’s
lending criteria, (b) a lender certify that it cannot provide funding on reasonable
terms except with an SBA guaranty, and (c) the SBA guarantee is limited to 80
percent on loans up to $100,000 and 75 percent on loans greater than $100,000.
In most cases, the maximum guaranty is $750,000 (75 percent of $1 million).
The SBA has recently announced a loan program it calls “CommunityExpress,”
supposedly targeted to small businesses in geographic areas covered by the
MBDA’s “New Markets” initiative with the purpose of helping small businesses
− 30 −
start, build or grow. These companies have sales less than $2 million per year
and are located in areas in which the poverty rate is 20 percent or more, within a
metropolitan area and in which 50 percent or more of the households in that tract
or division have an income below 60 percent of the area median gross income,
outside a metropolitan area in which the median household income does not
exceed 80 percent of the statewide median household income, within a
HUBZone, within an Urban Empowerment Zone or Urban Enterprise Community
or within an Rural Empowerment Zone or Rural Enterprise Community. However,
this program is limited to a maximum loan of $250,000 with a guarantee limit of
50 percent. (This program is similar to the “SBAExpress” program which has a
$150,000 loan limit and a 50 percent guarantee restriction.)
However, each of these programs is a loan program that requires immediate
positive cash flow to fund the repayment of the loan.
The SBA does have a group of programs designed to assist minority
entrepreneurs compete for Federal contracts, principally the 8(a) Business
Development Program and the Small Disadvantaged Business Certification
Program. In conjunction with these programs it provides management and
technical aid to eligible individuals and small business clients under the 7(j)
Management and Technical Assistance Program. The SBA also has established
an 8(a) mentoring program.
The primary SBA equity program is the Small Business Investment Company
(“SBIC”) program, which now consists of two types of SBICs: the original, or
“regular” SBICs and Specialized Small Business Investment Companies
(“SSBICs”). As noted above, the SSBICs were specifically targeted toward the
needs of entrepreneurs who have been denied the opportunity to own and
operate a business because of social or economic disadvantage. However, the
Small Business Program Improvement Act of 1996 repealed Section 301(d) and,
− 31 −
accordingly, no new SSBIC licenses are being issued but existing 301(d)
licensees were “grandfathered” and still in operation.
Although the “leverage” provided by the SBA does increase the pool of available
capital, the need to service the debt generated as a consequence of this
leverage immediately means that an equity only portfolio is simply not feasible.
Indeed, the statistics for financings for the period October 1999 through
September 2000 show that a full 57.62 percent of such financings were either
straight debt or equity with a debt component.30
Programs at the Local Level
States and localities also have “venture capital” programs. However, the lack of
any viable exit strategies has caused may of these programs to see their funding
dwindle and the programs essentially become limited grant programs rather than
equity programs based on the prospect of realizing a return on the equity
invested.
The State of Minnesota, for example, has had one of the more expanded
programs aimed at financing small businesses. Operated by the Minnesota
Investment Network Corporation, the program consists of a $7 million equity
fund, the majority of which was already invested in small Minnesota companies
by 1999. But the attempt to expand the capital pool of the fund – through capital
from the state or from donations – has had limited success.
In terms of state programs, Minnesota’s is one of the more successful. But its
scale of investment – less than $1 million – and the small size of its potential
portfolio of companies has prevented any substantive recouping of its investment
capital and the expansion of the fund.
30 “SBIC Program Statistical Package January 2001.” Small Business Administration. 7 February2001. Small Business Administration. <http://www.sba.gov/INV/stat/2001.html>.
− 32 −
Other Programs
Other programs have been created by quasi-public entities. For example, the
New York City Partnership has created an entity, the New York City Investment
Fund, which, according to the organization, “provides funding for projects that
stimulate business development, job creation and economic growth in the city
and its neighborhoods.” However, the funding includes both debt and equity
investments and is not limited to for-profit entities, nor is it specifically targeted to
minority owned businesses.
Other programs seek to facilitate investment in minority businesses. For
example, on January 24, 2001, with great fanfare, AOL Time Warner and the
Rev. Jesse Jackson announced the establishment of a program intended to
increase opportunities for minority business owners by bringing them together
with investors. Called i-DealFlow, the program will include a training program for
minority entrepreneurs to hone business plans scheduled this fall to be followed
approximately a month later by a venture capital fair.
Mainstream Venture Capital Funding
While we know of no statistics on the dollars flowing from mainstream venture
capital firms to minority entrepreneurs, the amounts are significant. A review of
several major venture capital firms reveals many such minority-owned
businesses.
Starting in the 1980s, with companies such as Tandon Computers and Gupta
Corp., venture capitalists have gone on to finance such companies as HotMail,
Sycamore Networks, Microstrategy, ShopNow (Network Commerce), and Yahoo,
all of which have had significant minority ownership.
− 33 −
Were venture capitalists specifically looking for minority-owned businesses? No.
They were looking at companies and ideas that offered returns in keeping with
their expectations.
Having minorities as partners in mainstream venture funds also has helped.
Kleiner Perkins’ partner Vinod Khosla (a Stanford MBA and India-born) has been
a key figure in getting Kleiner Perkins to finance businesses founded and
operated by Indians. Mayfield partners Kevin Chang and Yogen Dalal have been
instrumental in bringing minority deals to the Palo Alto fund. Other mainstream
funds where minority partners have opened the doors to investments in minority-
owned businesses include Walden Ventures, Polaris Venture Partners, and
Venrock.
Minority Venture Funds
Minority funds on the whole, have not participated in the early stages of
technological change. Most lack the personnel and resources to identify new
technology segments and to support investments in them.
Minority businesses in new technology areas are more likely to need managerial
and infrastructure support than their mainstream counterparts. Many of them
need help to fill out their management and scientific teams. Unfortunately,
minority venture capital firms simply do not have the resources to help fledgling
ideas take shape. Minority venture funds continue to be staffed by investors with
a financial background – and often little or no technology experience. So when
start-ups with minorities at the helm need technology help, these minority venture
funds are often in no position to be helpful.
What has also become apparent is that technology companies need increasingly
large amounts of capital to be significant players in their markets. The cost of
sustaining a business to profitability is much more than it was twenty years ago,

− 34 −
and small venture capital firms, especially minority firms, do not have the
capacity to participate effectively and for the long haul.
The few minority venture funds that are large enough to make sizeable
investments in companies often lack the infrastructure to provide the broad range
of services these companies now need.
In addition, another aspect of the problem is that there is a shortage of deals
rather than capital. One role for minority venture funds might be to create a
climate where there is more qualified minority deals, providing training to
companies by serving as an incubator.
One model to look at might be that of eFiltro Co., a Coral Gables, FL outfit that
labels itself as “the premier facilitator for new ventures in the Americas.” The
success of eFiltro depends on the team that runs it – a group of technologically
proficient Hispanics – and the business and corporate network it has developed.
What also helps is its realistic approach to making the venture work.
eFiltro’s goal is to provide a fast and efficient platform for entrepreneurs to obtain
funds and for risk capital and enabling companies to select promising ventures.
Through its New Idea center, a Web-based database and filter mechanism,
business plans are analyzed using a methodology provided to eFiltro by
McKinsey & Co. Entrepreneurs submit their business plan to only one source and
receive valuable feedback. Capital providers then select concepts that are highly
rated and meet their investment preferences.
eFiltro says it has developed key strategic alliances to give it a marketing
advantage to obtain deal flow. It has established agreements with over sixty firms
to enable it to attract new venture ideas. It has been working with the major
Internet portals to reach the general population and the entrepreneurially minded.
It also has relationships with universities to host their business plan competitions

− 35 −
and utilize their students and professors as a variable skilled workforce. It also
has agreements with the First Tuesday organization in Miami and Latin America
to co-sponsor matchmaking events.
“Our firm has a solid business model that obtains operational profitability,without counting on equity gains, through variable cost structure andmultiple revenue streams. We expect positive cash flow within one year,break-even return within two years, and realization of significant equitygains after three years. Our greatest financial strength is the depth andvariety of our operation income sources: matchmaking success fees(32%), sponsor subscriptions for business plan filter service (24%),analysis and consulting for business plans (22%) and educationalseminars (18%).”31
Focusing on entrepreneurial development does not mean dismissing the notion
of small business health. We firmly believe that a healthy small business sector is
imperative for entrepreneurial growth, especially at the minority level. Not only
are small businesses significant customers of many entrepreneurial goods and
services, they also act as a recruiting ground for entrepreneurial companies.
Creating an environment where minorities become technology literate, where
minority business owners have easier access to cash and other vital resources
and the general population is trained in business creation and development
strategies is an important step in promoting minority entrepreneurial
development. Indirectly, such programs as Los Angeles’ Operation Hope, an
economic and business development program targeting the Los Angeles Inner
City, bears watching.
In the Fall of 2000, Operation Hope opened the first of its three cyber cafes in
Los Angeles’ inner city to provide the local residents with high technology skills,
job placement and a convenient location to conduct business. The Cyber Café
will offer six courses through UCLA Extension after which program participants
will receive a certificate qualifying them to hold jobs in the high-tech sector.
31 eFiltro business plan.

− 36 −
Operation Hope also has partnered with a provider of e-learning courses to
provide 4,500 scholarships over three for those interested in taking internet
learning courses provided by the e-learning partner.
− 37 −
RECOMMENDATIONS
If technology and technology related businesses continue to be the largest
recipients of venture capital, it is imperative that the pool of technology
professionals have more representation from African Americans and Hispanics.
But this is a long-term strategy. Technology programs in schools that cater to
minority programs need to be strengthened. Similarly non-curricular activities
such as science camps, scientific expeditions and science-related work and
internships programs need to be put in place so that all minority groups can
access them.
The following strategies have the potential of providing paybacks in the
immediate future and long term.
.
♦ Entrepreneurs-in-Residence:
Many mainstream venture funds have been using these Entrepreneur in
Residence (EIR) programs to attract entrepreneurs and help them design and
launch their businesses. The advantages of such programs are that they don’t
require large cash outlays and are collaborative in nature. They usually involve
venture capitalists working closely with entrepreneurs to create a business plan,
put together a management team and finance the seed round. The probability
that these projects turn into real businesses is very high. However, such
programs require that venture funds have the expertise in house or can quickly
call on external sources for help. Almost every major venture capital fund,
including Accel Partners, Kleiner Perkins Caufield & Byers, Mayfield Fund and
New Enterprise Associates, has an EIR program in place.
♦ Technology Incubators:
Incubators historically have been a real estate resource shared by small
businesses. Incubator tenants also share a variety of business services.
Universities expanded the notion of the incubator to directly include
− 38 −
commercialization of technology. Such initiatives have resulted in such projects
as New Haven’s Science Park, which was partly funded by Yale University, and
incubator programs at Renssalaer Polytechnic, Worcester Polytechnic and
others.
We believe that incubator programs that bring together technologies looking for
commercialization and entrepreneurs, even if they are not formally trained in
technology, have the capability of bearing quick results. Not only do they make
key technologies available to potential entrepreneurs, they also help
entrepreneurs become more familiar with the technology in the setting it was
born.
A few venture funds, notably Kleiner Perkins Caufield & Byers, New Enterprise
Associates and the Mayfield Fund also experimented with the notion of a venture
incubator. An affiliated feeder fund, Onset Partners, jointly financed by the three
funds, was given responsibility to provide the seed stage financing and
development to early-stage ideas. The incubated projects then were eligible to
receive follow-on financing from Kleiner Perkins, NEA and Mayfield.
Small technology-oriented incubators that have ties with late stage funds may be
ideal for creating minority-owned businesses that then become eligible for
additional financing.
♦ Social Venturing:
There is a need for patient capital to create sustainable businesses and jobs in
minority communities. While this capital may not deliver enormous financial
returns in the short term, it has the capability of creating a pool of qualified
professionals and companies that then can grow larger.
A model for such patient investing is Silicon Valley Community Ventures (SVCV),
which is backed by such venture capitalists as John Doerr of Kleiner Perkins

− 39 −
Caufield & Byers, Jim Breyer of Accel Partners, and Gib Myers of the Mayfield
Fund. SVCV offers comprehensive resources to entrepreneurs through advising,
a resource network, loans and equity financing. The business advisory program
provides advice and assistance to low-income area businesses. While this Inner
City program situated in the San Francisco/San Jose Bay area does not
specifically target minorities, nearly 50 percent of its clients are minority-owned
businesses.
♦ On-Line Minority Business Marketplace:
Events to bring together traditional minority businesses and capital providers
have generally proved abortive because of the lack of understanding between
the two and the failure to follow up. Exit interviews at Dow Jones
Entrepreneurship Conferences and recent events co-sponsored by the NMSDC
have shown that most minority entrepreneurs are not familiar with the
expectations of capital providers. Similarly, capital providers often do not have
the structural or programmatic flexibility to accommodate the financial structures
of most minority-owned businesses. We are confident that a “minority business
marketplace” site could provide minority groups access to a broad range of
business information, market opportunities and financial services and tools
designed to help these companies grow and succeed.
We see this site offering business and entrepreneurial news and information to
each of the minority groups. We also see this site offering tools to improve the
financial competitiveness and reporting abilities of minority-owned businesses as
well as organizational and management tools. The Minority Business
Marketplace site should contain a “uniform disclosure form,” a single document
providing all the information that is needed to qualify for loans or participate in
certified purchasing programs. The mechanism to generate the disclosure form
should be an interactive, tutorial-like process through which the minority
entrepreneur would be assisted in identifying his needs and refining the plans for
his business. We also see the site working with service providers, such as
− 40 −
insurance, law and accounting firms and others, to supply regular and cost-
effective consulting services to minority-owned businesses.
♦ Minority Venture Consortium:
As noted above, minority venture capital firms are typically small and with limited
technological and management experience. However, collectively, such funds do
command a significant pool of capital. In order to maximize the impact of that
pool of capital, a consortium should be established to provide (a) technical and
management support (through fellowships, training programs and workshops),
(b) a mechanism for the early identification of promising technology companies
and (c) a mechanism for pooling resources so that sufficient capital and
management and technological assistance is made available to adequately
support such promising companies. The fellowship aspect of such a program
could be modeled on the Kauffman Fellows Program.

− 41 −
Rationale for Focus of Minority Entrepreneurship Scan
In the discussions to define the scope of the minority entrepreneurship scan, it
was agreed that we would discuss entrepreneurship from a public policy
perspective, and, in particular, we would focus on those aspects of
entrepreneurship which
• contribute to economic development and community growth,
• create jobs,
• build businesses, and
• lead to wealth creation, not simply for an individual but for a larger
community.
We looked at entrepreneurial activity in the mainstream and found that the
companies that fulfilled these criteria the best over the last two decades were
entrepreneurial companies in the technology sector. Technology companies,
ranging from Lotus and Microsoft to eBay and Amazon, have been among the
most efficient in building lasting businesses, creating jobs and creating
community wealth.
Non technology industries, in such areas as traditional manufacturing and
retailing, have had significant companies but their need for high levels of capital
and their relatively slower rate of growth puts them on a lower priority when it
comes to policymaking.
We also found that, particularly as part of the minority entrepreneurship
landscape, mergers and acquisitions, corporate divestitures and roll-ups – while
legitimate and significant areas of private equity activity – were more about
dealmaking than entrepreneurship. The short-term impact of these activities on
jobs and business-building was often harmful to a local economy and to unskilled

− 42 −
labor. As a result we felt that start-ups should be the major focus of the
entrepreneurial scan.
Based on our observations we suspected that different ethnic groups had
different rates of success in raising capital for entrepreneurial businesses. When
we looked closer we found that it appeared to be true. The data showed that
these differential rates of success appeared to be influenced not only by
changing demographics but differential participation in education and in business
as well. We felt that only by expanding the discussion to discuss changing
demographics and the differential rates of participation in various areas could we
get a more complete picture of minority entrepreneurship today.