Embed Size (px)
Citation preview

The Institute for Health, Health Care Policy, and Aging Research
Current Living Situation and
Service Needs of Former
Nursing Home Residents:
An Evaluation of New Jersey's Nursing
Home Transition Program
Sandra Howell-White, Ph.D.
June 2003


Acknowledgements
This research was supported in part by The Robert Wood Foundation. We would
like to thank Leslie Hendrickson, Martin T. Zanna, Jean Cetrulo, Nicole Wray, Barbara
Parkoff, Rebecca McMillen, and Sharon Graham from the New Jersey Department of
Health and Senior Services for supporting and facilitating this research. We would also
like to thank Mina Silberberg, who led the pilot study, for setting the framework for this
report. We would also like to thank members of the Center for State Health Policy
research staff for their support including Dorothy Gaboda, J.R. Bjerklie, Julie Caracino,
Coko Eggleston, Ayorkor Gaba, Nirvana Huhtala, Karen Kolvites, Mario Kravanja,
Adrienne Mason, Elana Miller, Suzanne Palmer, Winifred Quinn, Rosemarie Weaver,
Kamela Koontz, and Sulay Sannoh.
Evaluation of NJ's Nursing Home Transition Program iii

iv Rutgers Center for State Health Policy, May 2003
Table of Contents
Executive Summary............................................................................................................vii Introduction .........................................................................................................................
Methods................................................................................................................................1
Results ..................................................................................................................................3
Current Living Situation .......................................................................................3
Demographics and Physical Health Characteristics..........................................4
Unmet Needs and Potential Impact of Living Situation ....................................12
Professional Services.............................................................................................15
Quality of Life .........................................................................................................16
Discussion............................................................................................................................19
Conclusions .........................................................................................................................20
Endnotes ..............................................................................................................................23
References ...........................................................................................................................25
Appendix A: Sub-Population Analysis ..............................................................................27
Evaluation of NJ's Nursing Home Transition Program v

Rutgers Center for State Health Policy, May 2003 vi

Current Living Situation and Service Needs of Former
Nursing Home Residents:
An Evaluation of New Jersey's Nursing Home
Transition Program Sandra Howell-White, Ph.D.
EXECUTIVE SUMMARY
Introduction
As part of its evaluation of the New Jersey Senior Initiatives Community Choice
Counseling Program, the Center for State Health Policy at Rutgers conducted an
evaluation of former nursing home residents who were discharged through the
Community Choice Counseling Program. This report addresses clients' current living
situation, use of informal and formal assistance, service deficiencies, satisfaction, and
quality of life.
Methods
All 1,750 clients discharged from January 1, 2000 through December 31, 2000 were
asked to participate in the survey approximately six to eight weeks after discharge. In
total 859 former nursing home residents or their proxies were interviewed. Excluding the
deceased and those who were unable to participate due to physical or mental
impairment, our response rate was 56.6 percent (859/1,519).
Results
Current Living Situation
The majority of clients (77%) are now living in a home-based setting1, with more
than half living in their own home or apartment. One-third are living alone, while almost
two-thirds are living with a relative (spouse, child, or other relative). Almost one-fourth
of clients are in a community-based facility setting,2 with most in an assisted living setting
(11.6% of the total). Only a few clients (3.7%) are living in nursing homes again.3 Eighty-
Evaluation of NJ's Nursing Home Transition Program vii
six percent reported being satisfied with their current living situation and an additional
seven percent were somewhat satisfied.
Demographics and Physical Health Characteristics
Clients include more females, and almost all are English speaking. About half
were widowed and about one in five are married. One-third of the clients had completed
high school, with about one-fifth having either some high school or some college. About
ninety percent are over 65 years of age, with a third between 75 and 84; a quarter are over
the age of 85. Most of the respondents reported no difficulty with having their speech
understood (83.3%), hearing normal conversation (70.9%), and seeing normal print
(55.7%). The majority reported difficulty with lifting up to ten pounds (61.6%), walking
three city blocks (71.7%), and climbing a flight of stairs (61.3%).
Ability or Inability to Perform I/ADLs
On average, the home-based respondents are able to do 3.8 (s.d.=1.7) of the five
ADLs and 4.3 (s.d.=2.7) of the 9 IADLs. Facility-based clients could perform significantly
more ADLs (ave.=4.3, s.d.=1.3) and IADLs (ave.=4.2, s.d.=2.3). They had significantly less
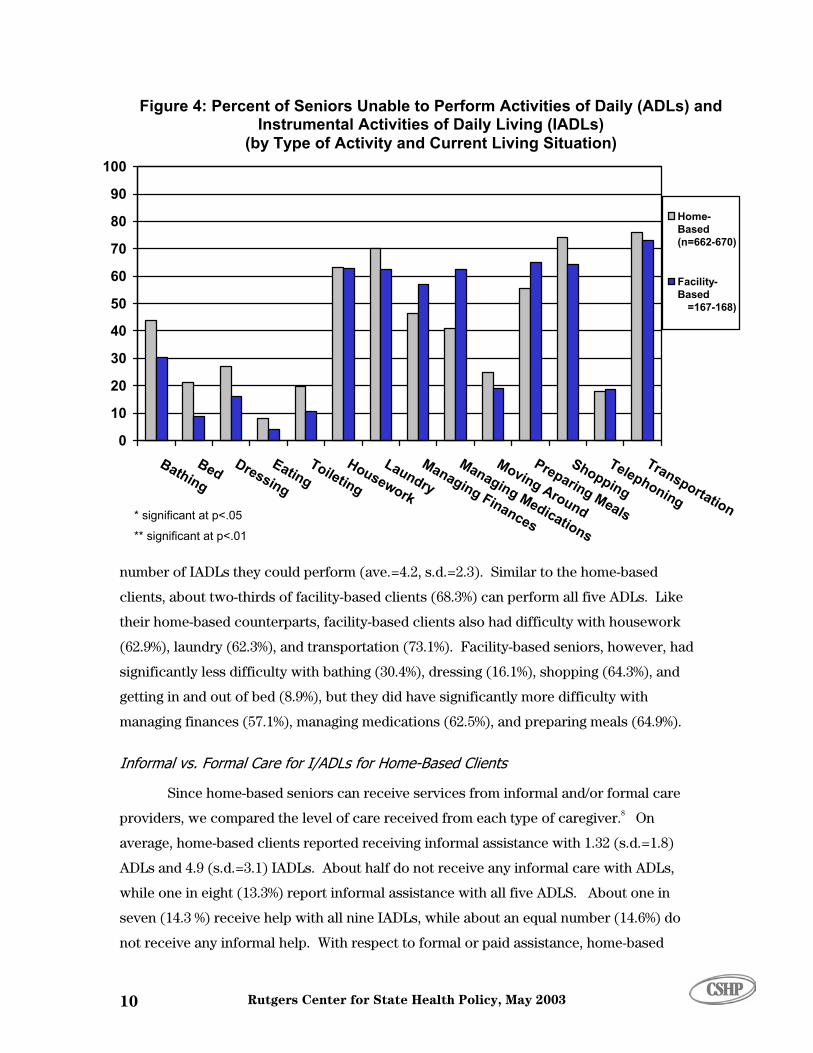
difficulty with bathing (30.4%), dressing (16.1%), shopping (64.3%), and getting in and out
of bed (8.9%), but significantly more difficulty with managing finances (57.1%), managing
medications (62.5%), and preparing meals (64.9%) than their home-based counterparts.
Informal vs. Formal Care for I/ADLs for Home-Based Clients
On average, home-based clients reported receiving informal assistance with 1.32
(s.d.=1.8) ADLs and 4.9 (s.d.=3.1) IADLs. Home-based respondents reported formal or
paid assistance with an average of about 1 ADL ((=.98, s.d.=1.61) and 1.5 IADLs (s.d.=2.3).
Most home-based clients received informal care from a relative (53.3%) usually a child
(29.3%) or spouse (13.9%). About one quarter said they cared for themselves, some
(16.1%) indicating solely and others (7.4%) in combination with family, friends, or paid
caregivers.
Unmet Needs and Potential Impact of Living Situation
Four out of five (79.4%) of the home-based seniors did not need any (additional)
help, while approximately one in ten (9.8%) reported needing assistance with all five
ADLs. Few facility-based clients (or their proxies) reported needing help (or more help).
Additionally, most clients or their proxies (85.2%) said that they have the help and
Rutgers Center for State Health Policy, May 2003 viii
services they need to stay where they are. Approximately ninety percent (n=749/827)
responded that they had the help and services needed to avoid injury.
Quality of Life
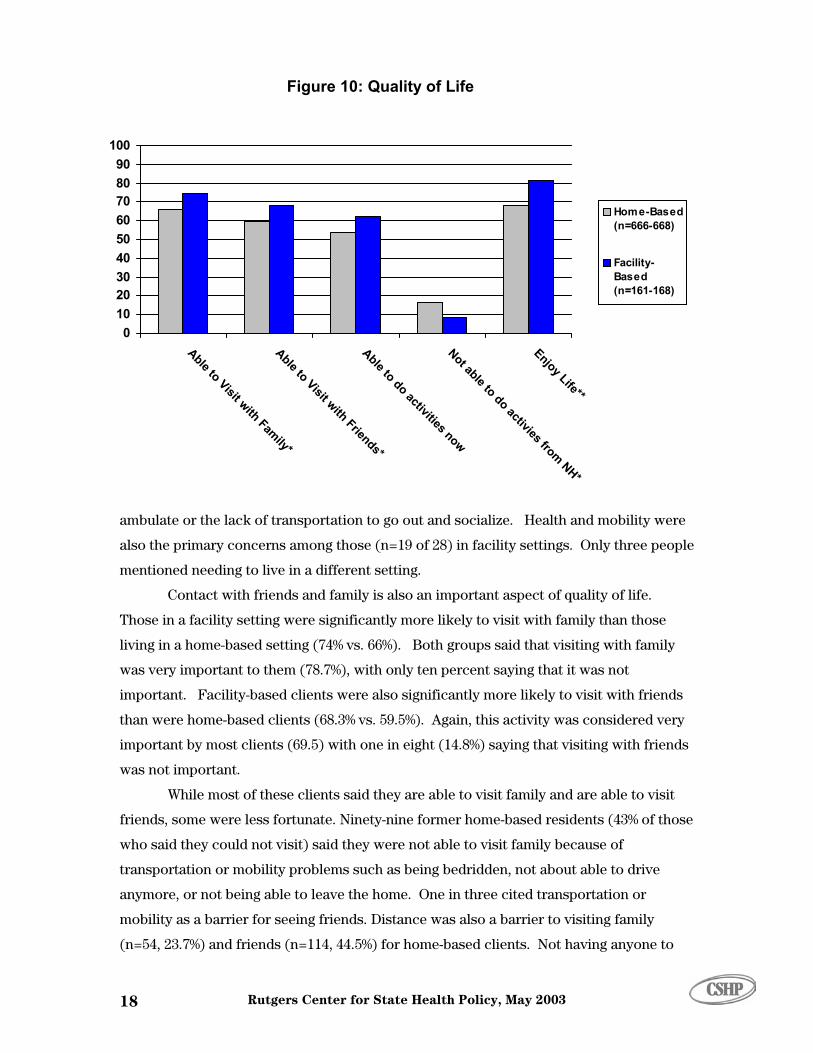
Significantly more facility-based clients (81.5%) said they enjoyed life more than
their home-based counterparts (68%). Those in a facility setting were significantly more
likely to visit with family than those living in a home-based setting (74% vs. 66%). Facility-
based clients were also significantly more likely to visit with friends than were home-
based clients (68.3% vs. 59.5%). Regarding activities that they could now do, home-based
clients mentioned caring for one's self, cooking and eating better (preferred) foods,
watching TV, driving, shopping, and walking. When asked why they were not able to do
these activities in the nursing home, most cited being too frail or the restrictiveness of the
nursing home. Activities they had been able to do in the nursing home, that they now
could not included: physical therapy or rehabilitation treatment, socializing with others,
playing bingo, or doing arts and crafts.
Conclusions
In light of these results, there are several conclusions, mainly:
• Most former nursing home residents are very satisfied with their current
living situation.
• Quality of life is also improved with most able to do things that make life
enjoyable and visit with family and friends.
• Of those former nursing home clients interviewed, most are able to perform
almost all of the activities and about half of the instrumental activities of
daily living.
• Although most clients were able to perform the ADLs, between 10 and 20
percent of the clients indicated a need per activity.
• Most people who reported unmet needs were already receiving assistance
usually from an informal caregiver.
• In spite of unmet needs, most people did not feel that their ability to remain in
the community setting was jeopardized.
In conclusion, the Community Choice Counseling program seems to be
successfully assisting nursing home seniors to return to the community with the
Evaluation of NJ's Nursing Home Transition Program ix
appropriate set of services. More importantly, seniors are benefiting from an enhanced
quality of life.
1 Home-based settings include the client's own home or apartment, a shared private
home, and senior subsidized apartments. 2 Facility-based settings include assisted living facilities, residential health care facilities,
and group home. These settings are differentiated from home-based settings because they offer a package of support services such as meals, housekeeping, etc.
3 These clients were removed from further analysis since they are no longer residing in a community setting.
Rutgers Center for State Health Policy, May 2003 x

Current Living Situation and Service Needs of Former
Nursing Home Residents:
An Evaluation of New Jersey's Nursing Home
Transition Program Sandra Howell-White, Ph.D.
Introduction
In August 1998, the New Jersey Department of Health and Senior Services
(NJDHSS) initiated the Community Choice Counseling Program to provide counseling for
Medicaid-eligible nursing home residents identified as candidates for discharge.
Counselors provide these residents with information about housing and service
alternatives available in the community, help them make informed choices about their
living arrangements and other needed services , and they provide emotional support to
ease the transition from the nursing home to the community.
As part of its evaluation of the New Jersey Senior Initiatives, Rutgers Center for
State Health Policy conducted an evaluation of the Community Choice Counseling
Program.1 This report addresses clients’ current living situation, their use of informal and
formal assistance mechanisms, service deficiencies, and client satisfaction, and quality
of life.
In the following sections, we describe our research methods, including the
respondents, and the questionnaire design. We conclude with a discussion of the survey
results, addressing implications for the Community Choice Counseling program, and
recommendations/considerations for further study of the program.
Methods
All 1,750 clients discharged from January 1, 2000 through December 31, 2000 were
asked to participate in the survey. Using information obtained from the discharge
summary forms supplied by NJDHSS, we contacted the former nursing home clients
approximately six to eight weeks after discharge. When possible, the nursing home
dischargee was interviewed; however, a proxy was used when the mental or physical
condition of the client prevented his/her participation, or the client preferred the proxy
be interviewed.2 When a proxy was used, the client (if able) was asked to confirm the
Evaluation of NJ's Nursing Home Transition Program 1

proxy choice. In a small number of cases, both clients and their proxies completed the
interviews (see Appendix A for further details).
The interview consisted of a series of closed and open-ended questions, and took
approximately 20 minutes to complete (see Appendix B).3 The survey instrument
included questions about preventive health characteristics, physical ability
characteristics, quality of life indicators, service use and needs, safety concerns, and
respondents’ current living situation.4
In total, 859 former nursing home residents or their proxies were interviewed (see
Table 1). One hundred people refused to participate, 245 were unable to participate due
to a physical or mental impairment and had no caregiver, family member, or friend to
serve as a proxy respondent. We were unable to contact 560 clients.5 In addition, another
211 clients were deceased. Excluding the deceased and those who were unable to
participate due to physical or mental impairment, our response rate was 56.6 percent
(859/1,519).
A comparison of respondents and non-respondents showed that the groups have
significantly different nursing home lengths of stay. In particular, those who refused to
participate had significantly longer lengths of stay than participants. These groups are
not significantly differentiated by gender.
Table 1. Sample Disposition
Results Total Sampling Frame Average Length of Stay Days in NH (s.d.)6*
Surveyed 859 109.9 (229.7) Unable to Participate 245 111.6 (299.6)
Refused** 100 230.7 (429.7) Deceased 211 86.6 (178.1)
Unable to Reach/Locate 560 129.3 (247.2) TOTAL 1975 119.1 (254.1)
* Significantly different (p<.01) between the groups F=5.9 ** Significantly different (p<.01) from the average length of stay of those who participated.
Rutgers Center for State Health Policy, May 2003 2
Results
Current Living Situation
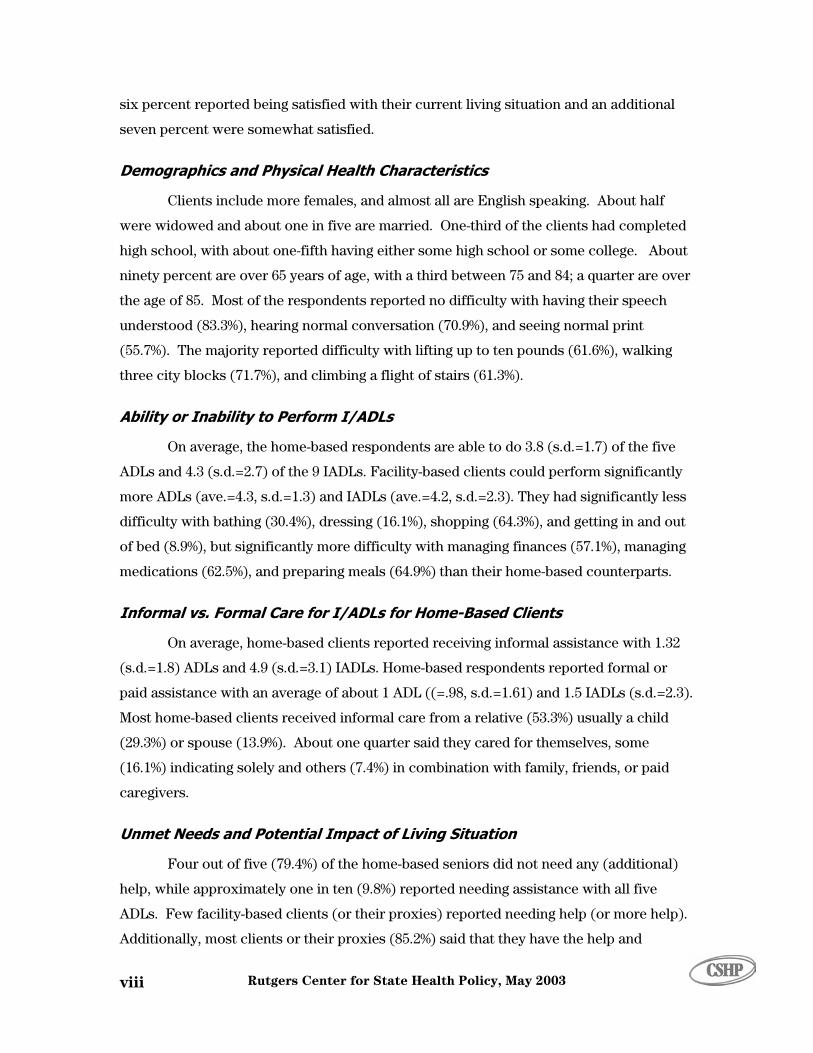
The majority of clients (77%) are now living in a home-based setting (see Figure
1). More than half are living in their own home or apartment (49.4% of the total), while
one in ten live in a senior-subsidized apartment (9.7%) and one in six are living in
someone else’s home (17.4%). Of those living in a home-based setting, one-third (34.4%)
are living alone. The majority of home-based clients (57.6%) are living with a relative –
most often a spouse (22.2%), a child (24.6%), or another relative (4.9%). Only a few are
living with friends (4.0%), paid caregivers (4.0%), or someone else (0.9%). Nearly one-
fourth (23.0%) of clients are in a facility-based setting, with the majority in an assisted
living setting (11.6% of the total). Only a few clients (3.7%) have returned to living in a
nursing home setting.7
Figure 1: Seniors’ Current Living Situation
9.7
49.4
17.6
11.6
3.71.8
3.71.8
0
10
20
30
40
50
60
Senior Subsidized Apartment
Own Home or Apartment
Someone Else's Home
Assisted Living Facility
Residential Health Care Facility
Boarding/Group Home
Nursing Home
Other
Total Home-Based=76.7% Total Facility-Based=17.1% (not including NH and other)
n=874
Evaluation of NJ's Nursing Home Transition Program 3

The overwhelming majority of respondents were satisfied with their current living
ituation. Eighty-six percent (n=716/831) of the clients (or their proxies) reported being
atisfied with their current living situation, and an additional seven percent (n=60) were
omewhat satisfied. Only seven percent (n=51) were dissatisfied. Of those living in
ome-based settings, thirty-four people were dissatisfied. Most of these clients were
issatisfied either because of some issue with their home (e.g., size, expense, or lack of
rivacy) or a safety concern such as living in an unsafe neighborhood or in an
nvironment that makes it difficult to use a wheelchair or walker. Those living in a
ies
an
ings . With
in
,
iving
Demographics and Physical Health Characteristics
re more likely to be in a facility than in a home-based situation. Regarding
educational level, one-third of the clients had completed high school, with about one-fifth
. About ninety percent are
ver 65
west
s
s
s
h
d
p
e
facility-setting who were dissatisfied also commented that they disliked their living
situation, would rather be at home, didn't like the food or the staff, or they wanted
additional privacy.
Although there were no significant differences between how clients and prox
rated their living situation, clients living in home-based settings were more satisfied th
those living in facility-based settings (X2 =12.9, p<.01). There were, however, no
significant satisfaction differences within the home-based or facility-based sett
regard to client satisfaction, there were no significant differences among those living
their own home, a senior subsidized apartment, or another person’s home. Similarly
there were no differences between those in a residential care facility or an assisted l
facility.
To understand the characteristics of those seniors who participated in the study,
we asked a number of questions about their social and physical characteristics. In
general, the clients include more females than males and almost all are English speaking
(see Table 2). About half were widowed and about one in five are married. Married
clients are more likely to be in a home-based situation than in a facility, while those never
married a
having either some high school or some college experience
o years of age, with a third between 75 and 84 and a quarter over the age of 85.
Proxies were more likely to respond for the oldest group (O2=27.99, p<.01) and the lo
educational group (O2=47.52, p<.01).
Rutgers Center for State Health Policy, May 2003 4

Table 2: Client Characteristics
Characteristic Percentages
Age (n=689) (ave.=74.7, s.d.=14.2) range=22 through 101
2.8% <40 8.7% 40 through 54 8.3% 55 through 64 21.8% 65 through 74 33.5% 75 through 84 25.0% 85 and older
Gender (n=787) 32.3% Male 67.7% Female
Primary Language (n=755) 94.8% English 1.0% Spanish 4.2% Other
Education Level (n=755)
19.6% Elementary but not High School 20.9% Some High School 35.2% Complete High School 16.4% Some College or Trade School 7.7% Completed College or higher
Marital Status (n=779)
21.2% Married 47.9% Widowed 15.8% Divorced 15.1% Never Married
In addition to their demographic characteristics, we also asked seniors about their
preventive health behaviors (see Table 3). Not surprisingly, almost all of them had seen a
physician in the previous 12 months, had a regular check-up in the previous year, and
tried to eat a healthy diet. Most of the clients reported taking vitamins or dietary
supplements on a regular basis, and about two-thirds said that they exercise daily. The
clients’ tobacco and alcohol use also reflect these healthy behaviors. While one in eight is
currently using tobacco, half of the respondents reported never having used tobacco.
Likewise, only one in ten are currently using alcohol, with more than two-thirds having
rarely or never used alcohol in the past.
Evaluation of NJ's Nursing Home Transition Program 5
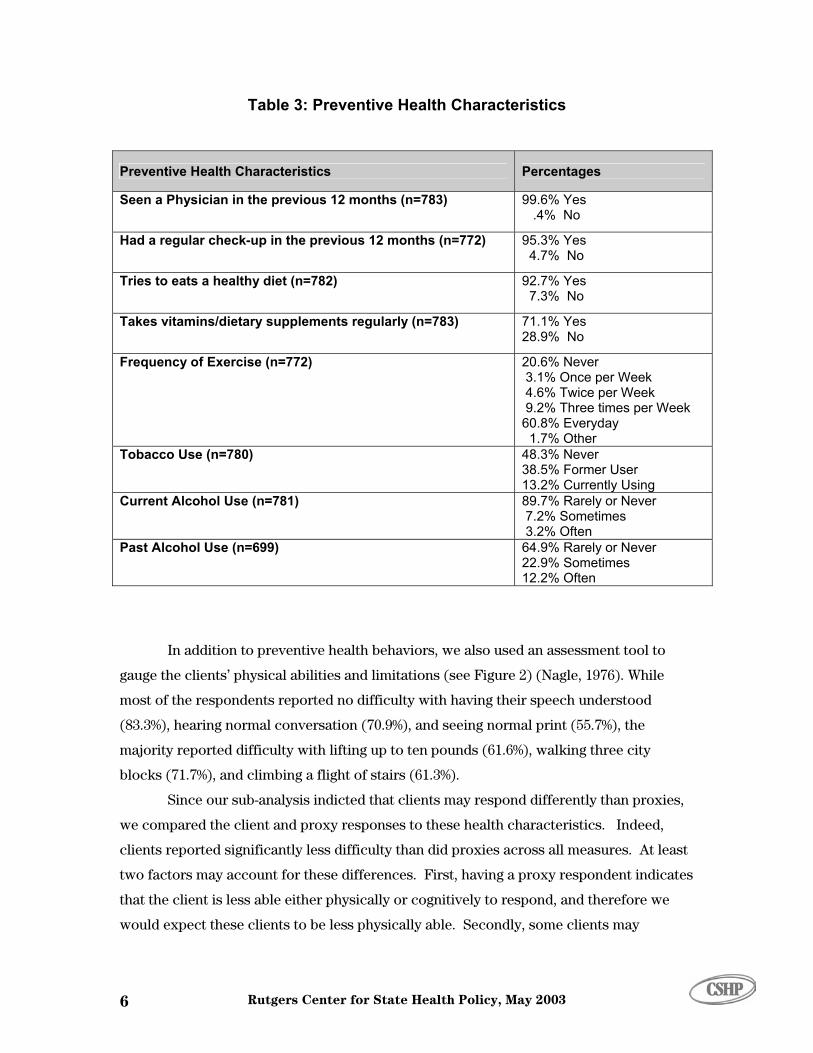
Table 3: Preventive Health Characteristics
Preventive Health Characteristics Percen
Had a regular check-up in the previous 12 months Yes o
(n=772) 95.3% 4.7% N
92.7% 7.3%
Y
Takes vitamins/dietary supplements regularly (n=7 71.1% Yes .9% No
83) 28
3 4.6% Twice
1.7% Other 48.3% Never 38.5% Former U13.2% Currently Using 89.7% Rarely or Neve 7 3.2
Past Alcohol Use (n=699) 9% Rarely or Never ometimes
12.2% Often
64.22.9% S
tages
Seen a Physician in the previous 12 months (n=783) 99.6% Yes .4% No
Tries to eats a healthy diet (n=782) es No
Frequency of Exercise (n=772) 20.6% Never .1% Once per Week
per Week 9.2% Three times per Week 60.8% Everyday
Tobacco Use (n=780) ser
Current Alcohol Use (n=781) r .2% Sometimes
% Often
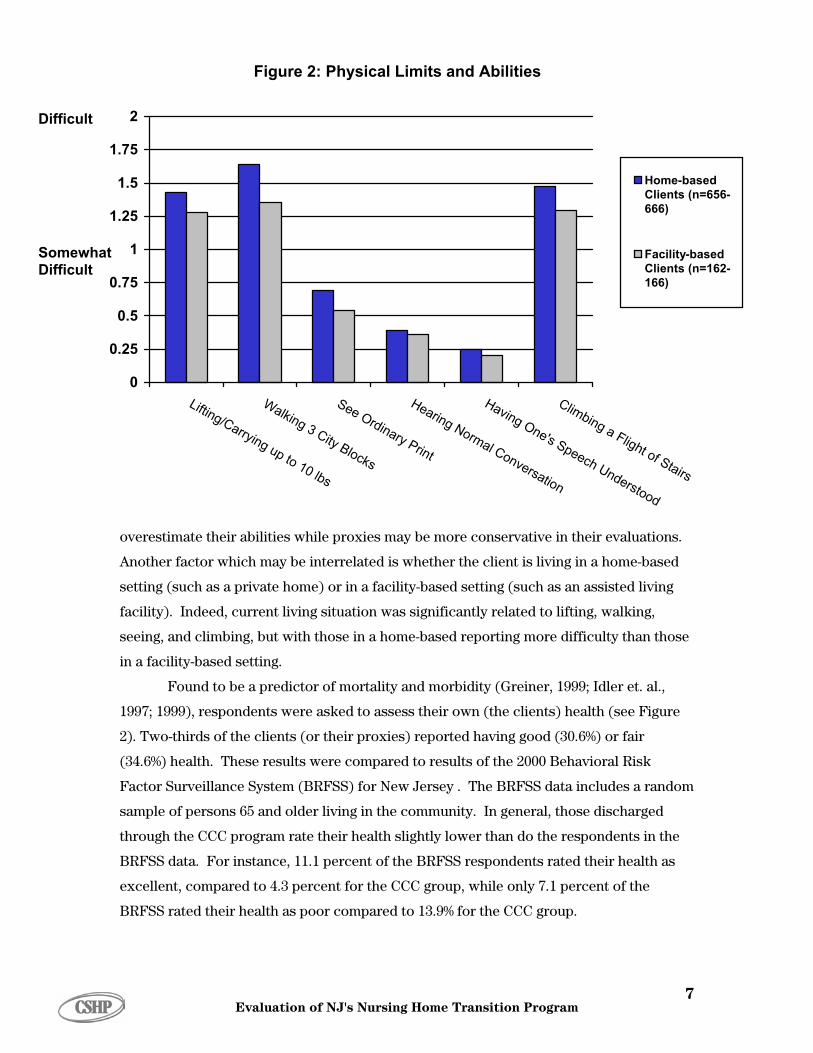
In addition to preventive health behaviors, we also used an assessment tool to
gauge the clients’ physical abilities and limitations (see Figure 2) (Nagle, 1976). While
most of the respondents reported no difficulty with having their speech understood
(83.3%), hearing normal conversation (70.9%), and seeing normal print (55.7%), the
majority reported difficulty with lifting up to ten pounds (61.6%), walking three city
blocks (71.7%), and climbing a flight of stairs (61.3%).
Since our sub-analysis indicted that clients may respond differently than proxies,
we compared the client and proxy responses to these health characteristics. Indeed,
clients reported significantly less difficulty than did proxies across all measures. At least
two factors may account for these differences. First, having a proxy respondent indicates
that the client is less able either physically or cognitively to respond, and therefore we
would expect these clients to be less physically able. Secondly, some clients may
Rutgers Center for State Health Policy, May 2003 6
0
0.25
0.
1.25
1.5
1.75
2
Lifting/Carrying up to 10 lbs
Walking 3 City Blocks
See Ordinary Print
Hearing Normal Con
Havin
a Flight of Stairs
0.5
75
1
versch Unation
derst
g Obing ne's Spee
ood
Clim
is living in a home
uch as an ass
Home-basedClients (n=656-666)
Facility-basedClients (n=162-166)
Figure 2: Physical Limits and Abilities
Difficult
Somewhat Difficult
overestimate their abilities while proxies may be more conservative in their evaluations.
Another factor which may be interrelated is whether the client -based
setting (such as a private home) or in a facility-based setting (s isted living
cility). Indeed, current living situation was significantly related to lifting, walking,
seeing, and climbing, but with those in a home-based reporting more difficulty than those
in a facility-based setting.
Found to be a predictor of mortality and morbidity (Greiner, 1999; Idler et. al.,
1997; 1999), respondents were asked to assess their own (the clients) health (see Figure
2). Two-thirds of the clients (or their proxies) reported having good (30.6%) or fair
(34.6%) health. These results were compared to results of the 2000 Behavioral Risk
Factor Surveillance System (BRFSS) for New Jersey . The BRFSS data includes a random
sample of persons 65 and older living in the community. In general, those discharged
through the CCC program rate their health slightly lower than do the respondents in the
BRFSS data. For instance, 11.1 percent of the BRFSS respondents rated their health as
excellent, compared to 4.3 percent for the CCC group, while only 7.1 percent of the
BRFSS rated their health as poor compared to 13.9% for the CCC group.
fa
Evaluation of NJ's Nursing Home Transition Program 7
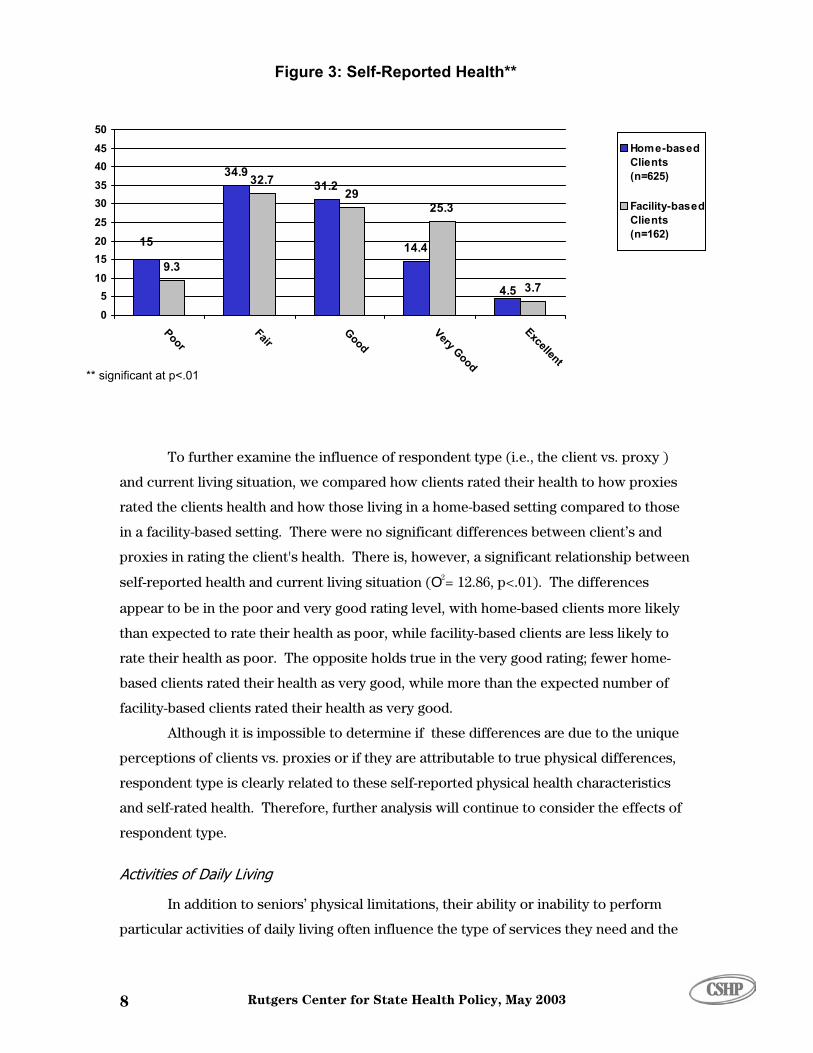
Figure 3: Self-Reported Health**
34.9
14.49.3
32.7
25.3
3.7
31.2
15
4.5
29
05
202530354045
PoorFair
GoodVery Good
Excellent
1015
50Home-basedClients(n=625)
Facility-basedClients(n=162)
** significant at p<.01
To further examine the influence of respondent type (i.e., the client vs. proxy )
and current living situation, we compared how clients rated their health to how proxies
rated the clients health and how those living in a home-based setting compared to those
ely
he opposite holds true in the very good rating; fewer home-
ique
in a facility-based setting. There were no significant differences between client’s and
proxies in rating the client's health. There is, however, a significant relationship between
self-reported health and current living situation (O2= 12.86, p<.01). The differences
appear to be in the poor and very good rating level, with home-based clients more lik
than expected to rate their health as poor, while facility-based clients are less likely to
rate their health as poor. T
Rutgers Center for State Health Policy, May 2003 8
es,
Activities of Daily Living
to perform
particular activities of daily living often influence the type of services they need and the
based clients rated their health as very good, while more than the expected number of
facility-based clients rated their health as very good.
Although it is impossible to determine if these differences are due to the un
perceptions of clients vs. proxies or if they are attributable to true physical differenc
respondent type is clearly related to these self-reported physical health characteristics
and self-rated health. Therefore, further analysis will continue to consider the effects of
respondent type.
In addition to seniors’ physical limitations, their ability or inability
quality of their life. Thus, the client’s ability to perform five key activities of daily living
(ADLs) and nine instrumental activities of daily living (IADLs) indicated an individual’s
level of independence. For example, although an older adult may be able to prepare a
light meal or snack, they may also be receiving assistance with the activity, perhaps
having a relative prepare the main meals. Therefore, we also considered whether clients
were receiving help from informal caregivers, such as family and friends, and/or from
paid caregivers; e.g., home health aides. Since facility-based living situations often
provide a package of services, we only considered receiving help from formal and
informal caregivers for the home-based population. Although some individuals may be
able to perform these activities of daily living or receive assistance with their care, they
still may have additional unmet needs. Therefore, we asked whether they needed (or
assistance with the five activities of daily living and the nine instrumental
activities of daily living. Although a person may report an unmet need, having unmet
needs does not necessarily indicate how these unmet needs may impact their life. For
,
Ability or Inability to Perform I/ADLs
g situation. On average, the
t
vities which presented the greatest difficulty for home-based seniors
were bathing (43.6%), housework (63.1%), laundry (70.0%), managing finances (46.5%),
aring meals (55.5%), shopping (74.1%), and
However, they were not significantly different than home-based clients in terms of the
needed more)
instance, a person may need more help with such IADLs as doing laundry and shopping
but these needs may not impact their ability to stay in a home-based setting. To fully
understand the impact of having unmet needs, we also asked whether they felt they had
the services they needed to remain in their community setting and to avoid injury.
Although facilities provide services, we did examine whether facility-based, as well as
home-based clients perceive themselves as having unmet needs.
We considered the individual’s ability to perform activities of daily living
separately for home- and facility-based seniors since one’s ability to perform I/ADLs can
often influence (as well as be influenced by) one’s livin
home-based respondents are able to do 3.8 (s.d.=1.7) of the five ADLs and 4.3 (s.d.=2.7) of
the 9 IADLs. About half (52.9%) were able to perform all five ADLs, while only seven
percent were unable to perform any of the five activities. Regarding IADLs, one in eigh
are able to perform all nine IADLs, and again only 7.5 percent were unable to perform any
of the IADLs. Acti
managing medications (40.8%), prep
transportation (75.9%) (see Figure 4).
Facility-based clients could perform significantly more ADLs (ave.=4.3, s.d.=1.3).
Evaluation of NJ's Nursing Home Transition Program 9
n
Figure 4: Percent of Seniors Unable to Perform Activities of Daily (ADLsInstrumental Activities of Daily Living (IADLs)
0
0
0
0
0
0
0
athined ressi
atingoiletin
ouserk
aundranagi
Fina ces
anagi Med
ations
ovingroun
epari Mea
hoppieleph
ing
an
(n
c
) and
(by Type of Activity and Current Living Situation)
0
10
2
3
4
5
6
7
8
90
100
B B Dng
E T
g
Hwo
LyM
ngn
Mng
ic
M
Ad
Prng
ls
Sng
Ton
Trsportation
Home-Based(n=662-670)
Facility-Based
=167-168)
1
I
th
(
s
g
m
p
a
A
w
s
n
** significant at p<.01
g
* significant at p<.05
umber of IADLs they could perform (ave.=4.2, s.d.=2.3). Similar to the home-based
lients, about two-thirds of facility-based clients (68.3%) can perform all five ADLs. Like
Rutgers Center for State Health Policy, May 2003 0
clients also had difficulty with housework
ver, had
nformal vs. Formal Care for I/ADLs for Home-Based Clients
8
ADLs,
al assistance with all five ADLS. About one in
eir home-based counterparts, facility-based
62.9%), laundry (62.3%), and transportation (73.1%). Facility-based seniors, howe
ignificantly less difficulty with bathing (30.4%), dressing (16.1%), shopping (64.3%), and
etting in and out of bed (8.9%), but they did have significantly more difficulty with
anaging finances (57.1%), managing medications (62.5%), and preparing meals (64.9%).
Since home-based seniors can receive services from informal and/or formal care
roviders, we compared the level of care received from each type of caregiver. On
verage, home-based clients reported receiving informal assistance with 1.32 (s.d.=1.8)
DLs and 4.9 (s.d.=3.1) IADLs. About half do not receive any informal care with
hile one in eight (13.3%) report inform
even (14.3 %) receive help with all nine IADLs, while about an equal number (14.6%) do
ot receive any informal help. With respect to formal or paid assistance, home-based

res
IADLs (s.d.=2.3). Abo t e with
ADLs (64.5%) or IA ive ADLs
(7.7%) or all nine IADLs (1.9%).
Although a majority of home-based clients received no assistance with ADLs,
when they did receive assistance, it was more likely to come from informal sources, such
as family and friends, rather than paid caregivers (see Figure 5). Help with bathing was
the most common type of ADL assistance, with 22.6 percent of clients receiving informal
help only, another 15.4 percent receiving informal and formal help, and 18.9 percent
receiving only formal help. In contrast to help with ADLs, the majority of clients did
receive assistance with IADLs. In particular, clients received the majority of assistance
with housework (78.9%), laundry (78.5%), shopping (81.6%), and transportation (81.0%).
The overwhelming majority of assistance came from informal caregivers. For instance,
Figure 5: Percent of Home-Based Seniors who Receive No Help, Informal Help, Paid Help, and Both Informal and Formal Help
pondents reported help with an average of about 1 ADL (0=.98, s.d.=1.61) and 1.5
ut two-thirds of clients did not receive any formal assis anc
DLs (56.8%). Only a few clients received formal help with all f
over h
(54.9%
perce
gettin
* k** g Fin
es
Medions *
oun*
Meals** ing**
ation
1
0
10
20
80
Bat**
Be D
g*
Eat*
To
g**
H
wor
L
y**
Ma
anc
ing
icat*
Mo
Ard *
Preparing
Shopping
Telephon
Transport
**
l OnlyBoth
al Only
90
100
30
40
50
60
70Forma
InformNo Help
hingd**
ressining*
iletinouse
aundrnagin
Manag ving
n=635-652
** significant at p<.0
of
alf of the clients received all of their assistance with laundry (53.1%), finances
), shopping (65.4%), and transportation from informal caregivers. Only about ten
nt reported receiving IADL assistance solely from formal caregivers with most
g help with housekeeping (15.3%) and laundry (14.1%). Between 10 to 15 percent
Evaluation of NJ's Nursing Home Transition Program 11
respondents received both informal and formal help with the IADLs. The exception w
managing finances for which less than four percent of the clients or their proxies
reported using formal caregivers.
as
Main Caregiver
ned
y
-
eight (4.6%) home-based seniors paying for help with shopping and twenty-seven %)
paying f
Unmet Needs and Potential Impact of Living Situation
Independent of how much assistance a person maybe getting with the activities of
daily living, they may still need additional assistance. To measure unmet need, clients
(or their proxies) were asked if they needed any (or more) assistance with the five ADLs
and the nine IADLs. To understand the effects of unmet needs, clients were also asked if
their unmet needs could potentially impact their living situation, either by threatening
their ability to continue to live in their current environment or whether they had the
and services they needed to avoid injury.
As one's current living situation, a home-based or a facility-based setting,
influences the assistance one receives, it can also effect the level and type of unmet needs
one may have. This was true for both unmet ADL and IADL needs. The average home-
based client needed help (or more help) with less than one (.71, s.d.=1.6) ADL and two
(1.4, s.d.=2.5) IADLs. Four out of five (79.4%) of the home-based seniors did not need any
(additi approximately one in ten (9.8%) reported needing assistance with
all five ADLs. Slightly more than two-thirds (72.3%) did not indicate needing help (or
all
When asked about their main caregiver, most home-based clients received
informal care from a relative (53.3%), usually a child (29.3%) or spouse (13.9%). About
one quarter said they cared for themselves, some (16.1%) indicating solely and others
(7.4%) in combination with family, friends, or paid caregivers. Less frequently mentio
caregivers included friends, grandchildren, multiple family, and combinations of famil
and paid caregivers. While informal help from family and friends usually means unpaid,
that may not always be the case. Therefore, respondents were asked if they paid their
informal caregiver. Almost all informal care was provided without pay, with only twenty
more help) with any of the nine IADLs, while 8.3 percent indicated needing help with
nine IADLs. The most prevalent areas of need include: bathing (13.9%), dressing (14.9%),
housework (19.7%), laundry (17.6%), getting around (14.2%), preparing meals (17.5%),
shopping (17.1%), and transportation (20.5%) (see Figure 6).
(4.5
or help with transportation.
help
onal) help, while
Rutgers Center for State Health Policy, May 2003 12

(ADLs) and Instrumental Activities of Daily Living (IADLs)
0
5
10
15
20
25
30
35
BathBed
DresEati
ToilHou
rk
LauMan
Fie
Man
M
ti
Mov Aro
Preparing M
Shopping
Telephoning
Transportati n
n=639
ing sing
ng eting sewo
ndry aging
aginging
nancs
edicaons
und eals
o-648
Although facility-based clients typically receive a package of services, facilities
may not necessarily fulfill all of a client’s needs. Few facility-based clients (or their
proxies) reported needing help (or more help), with the average respondent indicating an
unmet need in less than one area (0=.10, s.d.=.62 for ADLs, 0=.25, s.d.=1.25 for IADLs). In
fact, almost all of the facility-based seniors (96.8%) reported no unmet ADL needs or
IADL need (reported by 93.0%). Additionally, facility-based clients were less likely to
report having an unmet ADL need (O2=27.0, p<.01) or an unmet IADL need (O2=33.2,
p<.01) than those in home-based settings.
The impact of respondent type on level of need was also considered. Proxies
were significantly more likely to cite unmet needs than were client respondents. Several
factors could account for these differences. First, having a proxy respondent was related
to less healthy or able clients. In turn, these clients would probably have greater needs
and might therefore be more likely to have higher levels of unmet needs. Second, the
proxy may be providing assistance, and therefore might be more likely to indicate
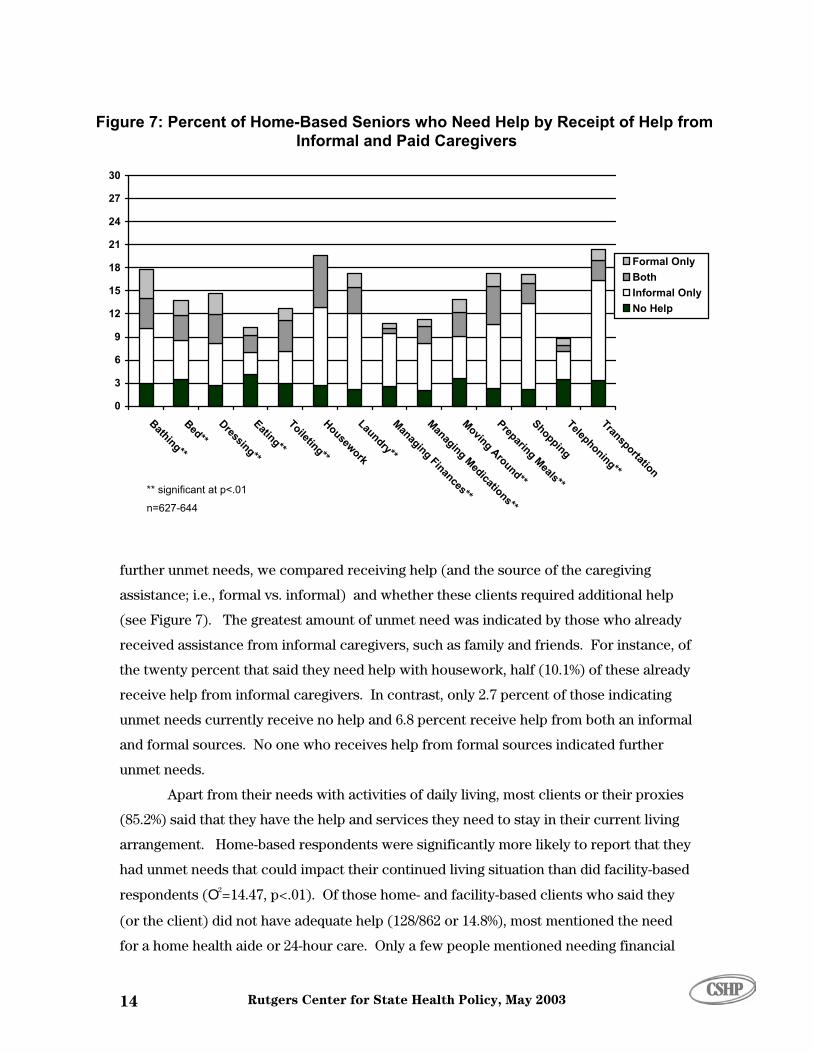
needing assistance. To test the relationship between getting help (and from whom) and
Figure 6: Percent of Home-Based Seniors Who Need (More) Assistance with Activities of Daily
(by Type of Service)
Evaluation of NJ's Nursing Home Transition Program 13
(se
rec
the
rec
unm
and
(85
(or
for
14
0
3
6
9
12
15
18
21
24
27
30
Bathing**
Bed**
Dressing**
Eating**
Toileting**
Housework
Laundry**
Managing Finances**
Managing Medications**
Moving Around**
Preparing Meals**
Shopping
Telephoning**
Transportation
Formal OnlyBothInformal OnlyNo Help
fur
ass
Figure 7: Percent of Home-Bas d Help by Receipt of Help from Informal and Paid Caregivers
ed Seniors who Nee
unm
arr
had
res
** significant at p<.01
n=627-644
Rutgers Center for State Health Policy, May 2003
e Figure 7). The greatest amount of unmet need was indicated by those who already
eived assistance from informal caregivers, such as family and friends. For instance, of
twenty percent that said they need help with housework, half (10.1%) of these already
eive help from informal caregivers. In contrast, only 2.7 percent of those indicating
et needs currently receive no help and 6.8 percent receive help from both an informal
formal sources. No one who receives help from formal sources indicated further
es
.2%) said that they have the help and services they need to stay in their current living
d
the client) did not have adequate help (128/862 or 14.8%), most mentioned the need
a home health aide or 24-hour care. Only a few people mentioned needing financial
ther unmet needs, we compared receiving help (and the source of the caregiving
istance; i.e., formal vs. informal) and whether these clients required additional help
et needs.
Apart from their needs with activities of daily living, most clients or their proxi
angement. Home-based respondents were significantly more likely to report that they
unmet needs that could impact their continued living situation than did facility-base
pondents (O2=14.47, p<.01). Of those home- and facility-based clients who said they

help, a particular form of therapy, or a different living situation. Reasons given for not
(14/128).
Another important factor influencing whether an elderly person is able to remain
in the community is their vulnerability to injury. Approximately ninety percent
(n=749/827) responded that they had the help and services needed to avoid injury.
Although few people indicated they felt they did not have the services needed to avoid an
injury, those living in facility-based settings were significantly less likely to feel
vulnerable to injury than those in home-based settings (2.4% vs., 11.2%). Those who felt
they did not have the services necessary to avoid injury most often mentioned needing a
home health aide, 24-hour care, or a specific service or piece of equipment such as a
wheelchair. Again, the chief reasons given for not having these services included lack of
finances and not knowing whom to contact.
Each of these approaches (needing assistance with ADLs or IADLs, having the
services available to avoid injury, and having the services to remain in one’s current living
situation) provides specific detail about the type of assistance needed. Across these
measures, one-third of all respondents expressed an unmet need in at least one of these
four areas. There is, of course, some overlap of need areas. For instance, individuals who
felt that unmet needs jeopardized their living situation often perceived a threat of injury
or
Services
having these services include lack of finances (42/128) and not knowing whom to contact
(55/152 or 36.2%). However, the same people do not always report multiple needs. F
instance, about half (58/124 or 46.8%) of the individuals who reported needing help or
services in order to remain in their living situations reported no unmet ADL needs.
Likewise, about half (40/78 or 51.3%) who considered themselves at risk for injury did not
report needing any (further) help with ADLs. This relationship also held true for needing
help with IADLs, with forty percent reporting a threat of injury (31/77), or needing
services to remain in one's current living situation (58/124), but no unmet IADL needs.
Professional
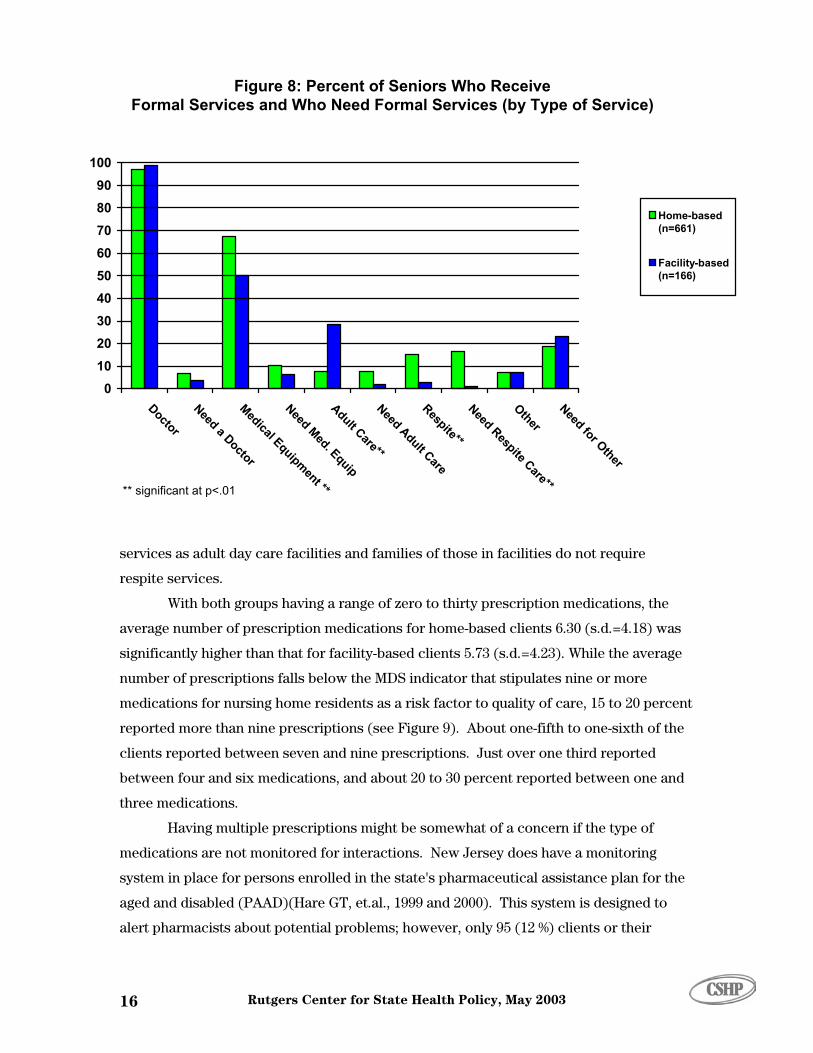
As might be expected, almost all respondents reported seeing a physician (see
Figure 8). More than half of the respondents reported using medical equipment, with
significant differences between those living in home-based settings (67.3%) and those in
facility-based settings (50.0%). Although few people reported needing these services,
home-based clients were significantly more likely to need respite (15.2% vs. 2.9%)
and adult day services (82.9% vs. 29.0%) than were those in a facility-based setting.
These differences are expected as facilities often provide the same social and medical
Evaluation of NJ's Nursing Home Transition Program 15
0102030
Do
D
l pm
**
ar
Needdu
ar
e**
N Ot
r
405060708090
100
ctor
Need a octor
edicaEqui
ent
Need Med. Equip
dult Ce**
Alt C
e
Respiteed Respite Care**
her
Need fo Other
M A
Home-based(n=661)
Facility-based(n=166)
Figure 8: Percent of Seniors Who Receive Formal Services and Who Need Formal Services (by Type of Service)
** significant at p<.01
Rutgers Center for State Health Policy, May 2003 16
was
ercent
services as adult day care facilities and families of those in facilities do not require
respite services.
With both groups having a range of zero to thirty prescription medications, the
average number of prescription medications for home-based clients 6.30 (s.d.=4.18)
significantly higher than that for facility-based clients 5.73 (s.d.=4.23). While the average
number of prescriptions falls below the MDS indicator that stipulates nine or more
medications for nursing home residents as a risk factor to quality of care, 15 to 20 p
reported more than nine prescriptions (see Figure 9). About one-fifth to one-sixth of the
clients reported between seven and nine prescriptions. Just over one third reported
ications, and about 20 to 30 percent reported between one and
he
to
between four and six med
three medications.
Having multiple prescriptions might be somewhat of a concern if the type of
medications are not monitored for interactions. New Jersey does have a monitoring
system in place for persons enrolled in the state's pharmaceutical assistance plan for t
aged and disabled (PAAD)(Hare GT, et.al., 1999 and 2000). This system is designed
alert pharmacists about potential problems; however, only 95 (12 %) clients or their

4.1
20.8
36.7
18.8 19.7
1.4
31.9
39
12.814.9
0
5
10
15
20
25
30
35
40
45
None1 to 3
4 to 67 to 9
More than 9
50
Home-Based(n=640)
Facility-Based(n=141)
Figure 9: Number of Prescription Medications by Current Living Situation**
prox
those
Medi
Qua
quali
comm
impo
have
end,
more
were
Figur
signi
based
misse
espec
** significant at p<.01
Evaluation of NJ's Nursing Home Transition Program 17
-
ce to
ies specifically mentioned having PAAD. This number probably under-represents
on PAAD, as many did indicate that Medicare or other forms of coverage such as
caid and private insurance paid for their prescriptions.
hey
y
ble,
lity of Life
A primary goal of the Community Choice Counseling program is to enhance
ty of life of nursing home residents by providing them with the choice to return to a
unity setting. Ultimately, it is the individual's perceived quality of life that is
rtant. If individuals are happy about returning to the community and feel that t
an improved quality of life, then the program has realized an important goal. To this
clients (or their proxies) were asked if they were able to do the things that made life
enjoyable, whether they were able to visit with family and friends, and what the
able to do in the community that they could not do while in the nursing home (see
e 10).
While most people said they are able to do things that make their lives enjoya
ficantly more facility-based clients (81.5%) said they enjoyed life than their home
counterparts (68%). Of the 213 seniors living in a home-based setting who said they
d things that made their life enjoyable, almost half (n=94) mentioned poor health,
ially lack of mobility, as the reason. Other problems included needing assistan
0102030405060708090
100
Able to Visit with Fily*
Able to Visit with Friends*
Able to do activities now
Not able to do activies fro
Enjoy Life**
Home-Based(n=666-668)
Facility-Based(n=161-168)
Figure 10: Quality of Life
am
m NH*
ambulate or the lack of transportation to go out and socialize. Health and mobility wer
also the primary concerns among those (n=19 of 28) in facilit
e
y settings. Only three people
live in a different setting.
Contact with friends and family is also an important aspect of quality of life.
Those in a facility setting were significantly more likely to visit with family than those
living in a home-based setting (74% vs. 66%). Both groups said that visiting with family
was very important to them (78.7%), with only ten percent saying that it was not
important. Facility-based clients were also significantly more likely to visit with friends
than were home-based clients (68.3% vs. 59.5%). Again, this activity was considered very
important by most clients (69.5) with one in eight (14.8%) saying that visiting with friends
was not important.
While most of these clients said they are able to visit family and are able to visit
friends, some were less fortunate. Ninety-nine former home-based residents (43% of those
who said they could not visit) said they were not able to visit family because of
transportation or mobility problems such as being bedridden, not about able to drive
anymore, or not being able to leave the home. One in three cited transportation or
mobility as a barrier for seeing friends. Distance was also a barrier to visiting family
(n=54, 23.7%) and friends (n=114, 44.5%) for home-based clients. Not having anyone to
mentioned needing to
Rutgers Center for State Health Policy, May 2003 18

visit was also a problem, one in ten home-based clients (n=25, 10.9%) reported not having
any (or any nearby) family, while one third (28.9%) said they have no (or any nearby)
friends. Of the forty-three facility-based clients who said they were unable to visit with
family, half (53.5%) cited either lack of family or distance to family as why they could not
see them. Lack of friends (or lack of friends nearby) was also mentioned by 65.4%
(n=34/52) clients. These facility-based clients also mentioned lack of transportation as
why they could not visit with family (16.3%) and friends (11.5%).
Clients divided evenly on whether they can now do activities that they could not
do in the nursing home. Facility-based clients, however, were significantly more likely to
report being able to do activities that could not do in the nursing home (O2 =4.4, p<.05).
Home-based clients reported now being able to perform many different activities such as
caring for one's self, cooking and eating better (preferred) foods, watching TV, driving,
shopping, and walking. In essence, these people reported being able to lead a more
independent life. In addition to these activities, facility-based clients also noted being
able to socialize more. When asked why they were not able to do these activities in the
nursing home, most cited being too frail or the restrictiveness of the nursing home. The
overwhelming majority of both groups (89%) said that now being able to do these
activities was very important to them.
Although most felt they were able to do more in their community setting, one in
eight (n=125, 14.9%) said there were activities they had been able to do in the nursing
home that were no longer possible. Half of these clients (50.8%) said these activities were
very important to them. Another one-third (35.%) said they were somewhat important.
Both home- and facility-based clients mentioned physical therapy or rehabilitation
treatment, socializing with others, play bingo, or doing arts and crafts. These activities
were lost because they were no longer able to get in-home therapy or had difficulty
leaving the home. Home-based clients were significantly more likely to say they could no
longer perform some activities than were facility-based clients (16.5% vs. 8.3%, (O =7.1,
p<.01). This difference is not surprising as facility-based settings, such as assisted living
facilities, often offer similar social activities.
At approximately eight weeks after discharge from a nursing home, almost all of
the clients who were assisted back into the community by the New Jersey Community
Choice Program were living in a home-based setting or a community-based facility setting
2
Discussion
Evaluation of NJ's Nursing Home Transition Program 19
such as an assisted living residence. Less than five percent had returned to a nursing
home. More importantly than where they reside, the overwhelming majority of the
respondents were satisfied with their current living situation. Most felt they were more
able to visit with family and friends and more able to do the things that made life more
enjoyable.
The clients who participated in this study exhibited fairly healthy life styles with
high levels of regular check-ups, healthy eating habits, and low rat
es of smoking and
,
le to
ing (or needing more) help. Only a few of the
ome-b s.
or
ho
ailable to compare respondents to non-
respondents, respondents were significantly different from non-respondents in terms of
the nursing home. For the most part respondents were more likely to
ave ha
drinking. Additionally, the average senior was able to do about four of the five activities
of daily living and four of the nine instrumental activities of daily living. Home and
facility-based seniors had the most difficulty with physically and logistically challenging
activities such as bathing, housework, managing finances and medications, and
transportation.
Although most seniors are able to do a fair number of activities of daily living
many are receiving assistance especially with IADLs. Informal caregivers, typically a
family member, provided most of this assistance. Less than ten percent of clients
received all of their assistance from formal or paid help. Another one in ten received
assistance from both informal and formal sources. Although many clients were ab
perform I/ADLs, a number reported need
h ased clients who were currently receiving no assistance expressed need in I/ADL
The majority of those who expressed needing assistance were already getting help from
informal sources, or a combination of informal and formal caregivers. Again, the most
prevalent areas of unmet need include: bathing, housework, laundry, preparing meals,
shopping, and transportation. In spite of their unmet needs, the majority of clients (
their proxies) were confident that their current level of help is adequate to remain in the
community and felt they had the help and services needed to avoid injury. Those w
didn’t have what they needed, usually mentioned needing a home health aide, 24-hour
care, and financial help. Although the respondents reported these needs, Medicaid does
not provide for all types of services, such as 24-hour care.
While only minimal information was av
length of stay in
h d shorter lengths of stay in the nursing home. Therefore, these results should be
considered with caution. Nonetheless, the results from these former nursing home
Rutgers Center for State Health Policy, May 2003 20

residents do provide an appropriate picture of the living situation of those discharged
through the Community Choice Counseling program.
Conclusions
In light of these results, several conclusions can be drawn, primarily:
ntal
tivities of daily living.
0
stance,
y
ld
ditionally, clients and their
ul
• Most former nursing home residents are very satisfied with their current
living situation.
• Quality of life is also improved with most able to do things that make life
enjoyable; e.g., visiting with family and friends.
• Of those former nursing home seniors interviewed, most are able to
perform almost all of the activities and about half of the instrume
ac
• Although most clients were able to perform the ADLs, between 10 and 2
percent of the clients indicated some limitation per activity.
• Most people who reported unmet needs were already receiving assi
usually from an informal caregiver.
• In spite of unmet needs, most people did not feel that their ability to
remain in the community setting was jeopardized.
In conjunction with the Community Choice program, DHSS also provided several
community programs, the Caregiver Assistance Program (CAP), CCPED, the Assisted
Living (AL) Waiver program, Alternate Family Care (AFC), and Jersey Assistance
Community Caregiving (JACC). These programs provide community services for both
Medicaid (CAP, CCPED, AL waiver, and AFC) and non-Medicaid populations (JACC).
Although these community programs are available to assist seniors, they still receive the
bulk of assistance from informal caregivers. Additionally, these programs have eligibilit
requirements as well as coverage limits for the services. Clients and their families shou
be well educated about the type and scope of resources available in the community and
whether they are covered under the Medicaid program. Ad
families should also be educated to detect changes in the client’s situation that may
warrant re-examining whether their setting is the most appropriate.
In conclusion, the Community Choice Counseling program seems to be successf
in assisting nursing home seniors to return to the community with the appropriate set of
services. More importantly, seniors are benefiting from an enhanced quality of life.
Evaluation of NJ's Nursing Home Transition Program 21

Rutgers Center for State Health Policy, May 2003 22

Evaluation of NJ's Nursing Home Transition Program 23
Endnotes
1 From August 27 to October 11, 1999, the Center conducted a pilot study of 107 former nursing home residents who had been counseled through New Jersey’s Community Choice Counseling (CCC) program and subsequently discharged. Our current study is an expansion of that pilot project to include all clients discharged from January 1, 2000 through December 31, 2000.
2 When proxies answered the survey, interviewers were instructed to ask for proxy
views on subjective questions (rather than for proxy estimations of clients’ views).
3 The original questionnaire was developed with input from Community Choice
Counselors and other program staff, the Advisory Committee of the Senior Initiatives Evaluation, Center for State Health Policy staff and an external reviewer with expertise in long-term care.
4 The survey instrument also includes questions about the experience with the
Community Choice Counselors and selected health episodes, but these areas are not reported in this report.
5 Clients were deemed unable to locate if we could not reach them after successive
attempts. A detailed protocol specified the number of attempts, variation in times and days, and number of interviews before a client was deemed unable to locate. Additionally, this category includes persons for whom we had no contact information.
6 This information was not available for all clients. 7 These clients were removed from further analysis since they are no longer
residing in a community setting. 8 Since services are provided as a package for those living in facilities, we only
report on assistance received by home-based seniors.

Rutgers Center for State Health Policy, May 2003 24
Evaluation of NJ's Nursing Home Transition Program 25
References
Greiner, Philip, David Snowdon, and Lydia Greiner. “Self-rated function, self-rated health, and postmortem evidence of brain infarcts: Findings from the nun study.” The Journals of Gerontology. 1999; 54B(4) 219-222. Hare, GT., SC. Reinhard, JH. Brick, C. Tepper, and MT. Zanna. "Polypharmacy. Reducing adverse events among the elderly in NJ." New Jersey Medicine. 2000; Jan;97(1):29-34. Hare, GT., SC. Reinhard, JH. Brick, C. Tepper, and MT. Zanna. "Polypharmacy. Reducing adverse events among the elderly in NJ. Part 1." New Jersey Medicine. 1999; Dec;96(12):35-38. Idler, Ellen, and Yael Benyamini. “Self-rated health and mortality: A review of twenty-seven community studies.” Journal of Health and Social Behavior. 1997; 38(March): 12-37. Idler, Ellen, Shawna Hudson, and Howard Leventhal. “The meaning of self-ratings of health: A qualitative and quantitative approach.” Research on Aging. 1999; 3, 458-476. Nagle, S. Z. “An epidemiology of disability among adults in the United States.” Milbank Memorial Fund Quarterly, Health and Science, 1976; 54, 439-467. National Center for Chronic Disease Prevention and Health Promotion. Behavioral Risk Factor Surveillance System. 2000 Prevalence Data.

Rutgers Center for State Health Policy, May 2003 26

Evaluation of NJ's Nursing Home Transition Program 27
Appendix A
Sub-Population Analysis
Due to concerns regarding potential memory and cognitive ability, as well as
differences in knowledge and perceptions between proxy and client, we conducted
several sub-population analyses. First, differences in responses between respondent
type (client, proxy, or both), cognitive understanding, and knowledge were considered.
Approximately 43 percent of our interviews were answered by clients, 52 percent by
proxies, and 4 percent by both a proxy and client (see Table A). Using a three-point scale,
interviewers were asked to assess respondents’ knowledge of what was asked and their
level of confusion about questions they were asked. Almost all respondents seemed
knowledgeable (93.5%) and were not confused (92.6%). None of the respondents were
either totally confused or had no knowledge. Using the knowledge and confusion
questions, a cognitive index rating of the respondent’s ability to answer questions with
full understanding was created. Most respondents (89.2%) seemed knowledgeable and
were not confused when answering the survey questions (see Table A).1 Although almost
all respondents scored high, significantly more caregivers were knowledgeable and not
confused (93.3%) than clients (85.5%).
Rutgers Center for State Health Policy, May 2003 28
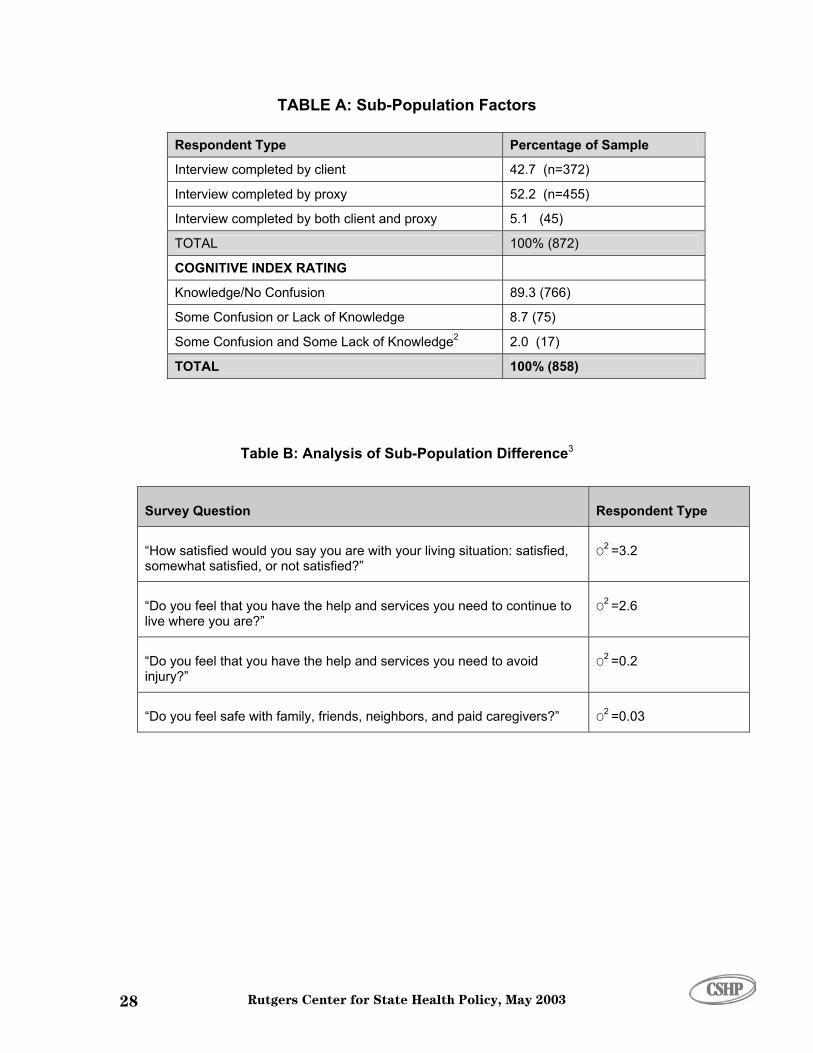
TABLE A: Sub-Population Factors
Respondent Type Percentage of Sample
Interview completed by client 42.7 (n=372)
Interview completed by proxy 52.2 (n=455)
Interview completed by both client and proxy 5.1 (45)
TOTAL 100% (872)
COGNITIVE INDEX RATING
Knowledge/No Confusion 89.3 (766)
Some Confusion or Lack of Knowledge 8.7 (75)
Some Confusion and Some Lack of Knowledge 2.0 (17) 2
TOTAL 100% (858)
Table B: Analysis of Sub-Population Difference3
Survey Question Respondent Type
“How satisfied would you say you are with your living situation: satisfied, somewhat satisfied, or not satisfied?”
O2 =3.2
“Do you feel that you have the help and services you need to continue to live where you are?”
O2 =2.6
“Do you feel that you have the help and services you need to avoid injury?”
O2 =0.2
“Do you feel safe with family, friends, neighbors, and paid caregivers?” O2 =0.03
Evaluation of NJ's Nursing Home Transition Program 29
To determine whether we should analyze sub-groups separately, we tested the
effect of t on several key survey questions. osen
because ponses, addressed crucial issues (such as client
safety), and/or could threaten seniors’ living situation.
The questions were:
How satisfied would you say you are with your living situation?
• Do you feel that you have the help and services you need to continue to live
where you are?
• Do you feel that you have the help and services you need to avoid injury?
• u feel safe with family, friends, neighbors, or paid caregivers?2
• The distribution of responses for our sub-populations was quite similar, and
analysis showed no significant difference for any of the pairings (see Table
B).4 Therefore, a disaggregated analysis was not required by respondent type
for cert
1No composite score was computed if one or both of the ratings was missing. 2Onl e proxy and one client) said they did not feel safe (or feel the client was safe) with family, friends, neighbors, caregivers. Therefore, significance testing for this question was unnecessary and inappropriate. 3Sin ve percent of the surveys were answered by a combination of client and proxy responses, we analyzed differences by respondent type using only the categories of “client only” and “proxy only.”
terviewers were also asked to assess the client’s memory of the Community Choice Counseling experience in particular, but this was not considered an indication of general functioning, and was therefore not included in the index. Overall, this assessment supported the validity of answers to the Community Choice questions.
type of responden The questions were ch
they required subjective res
Do yo
ain elements.
y two respondents (on
ce only fi
4In


![Index [] · 2017. 4. 25. · Index 05-51675 1005 South Africa situation, 77, 337, 341 Yugoslavia (former) situation, 474 Austria (elected member of the Security Council during 1991](https://img.pdfslide.net/doc/110x75/61345aeddfd10f4dd73bad68/index-2017-4-25-index-05-51675-1005-south-africa-situation-77-337-341.jpg)