Embed Size (px)
Citation preview
CURRENT POPULATION REPORTS
opul tion Estimates and rojections
U.S. Department of Commerce BUREAU OF THE CENSLJS
Series P-25, 1\10. 681 Issued April 1977
1973 (Revised) and 1 Population mates nd 1972 (Revised) and 1974 Per Cap Counties and Incorporated Pia
This report is one o'f a series containing current estimates o'f the population and per capita money income 'for selected areas in each State. The population estimates relate to July 1, 1973 and July 1, 1975, and the estimates o'f per capita income cover calendar years 1972 and 1974. Current estimates of population below the county level and per capita money income for all general purpose governments were prompted by the enactment of the State and Local Fiscal Assistance Act of 1972. The figures are now used by a wide variety of Federal, State, and local governmental agencies for program planning and administrative purposes.
Areas included in this series of reports are all counties (or county equivalents such as census divisions in Alaska, parishes in Louisiana, and independent cities in Maryland, Missouri, Nevada, and Virginia) and incorporated places in the State, plus active minor civil divisions (MCD's), commonly towns in New England, New York, and Wisconsin, or townships in other parts of the United States. 1
These State reports appear in Current Population Reports, Series P-25, in alphabetical sequence as report number 649 (Alabama) through number 698 (Wyoming). A list indicating the report number 'for
1 In certain midwestern States (illinois, Kansas, Minnesota, Missouri, Nebraska, and the Dakotas) some counties have active minor civil divisions whiie others do not.
Incom mates N
each State is appended. No separate report is to be issued 'for the District of Columbia. However, the estimates for the District of Columbia, together with a summary table 'for all States, will be presented in a report detailing the methods used to estimate income and population, and will contain further evaluation of the estimates. This report will appear in Current Population Reports, Series P-25, No. 699.
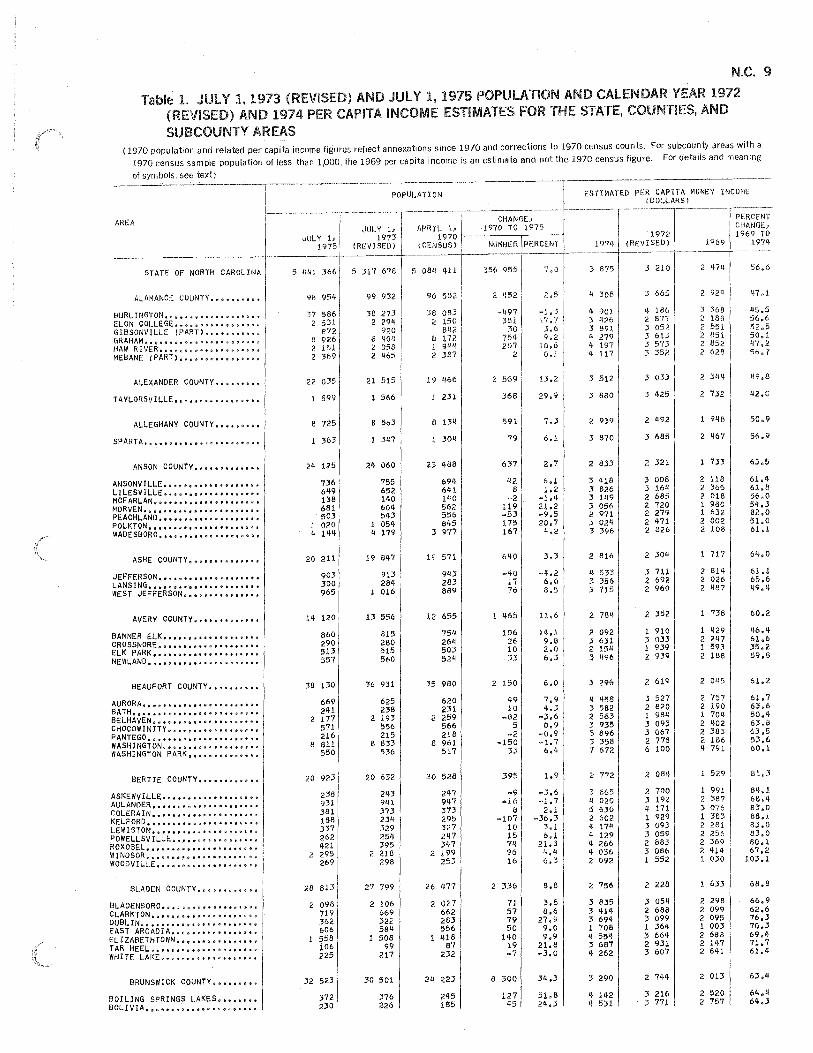
The detailed table 'for each State shows July 1, 1975 and revised July 1, 1973 estimates of the population of each area, together with April 1, 1970 census population and numerical and percentage change between 1970 and 1975. The 1970 population and related per capita income figures reflect annexations since 1970 and include corrections to the 1970 census cou nts. I n addition, the table presents per capita income estimates for calendar years 1974 and 1972 (revised), plus calendar year 1969 per capita money income derived from data collected in the 1970 census.
The estimates are presented in the table in county order, with all incorporated places in the county listed in alphabetical order, 'followed by any functioning minor civil divisions also listed in alphabetical order. Minor civil divisions are always identified in the listing by the term "township," "town," or other MCD category. When incorporated places fall in more than one county, each county piece is marked "part," and totals for these places are presented at the end of the table.
For sale by the Superintendent of Documents, U.S. Government Printing Office, Washington, D.C. 20402, and U.S. Department of Commerce district offices. Postage stamps not acceptable; currency submitted at sender's risk. Remittances from foreign countries must be by international money order or by draft on a U.S. bank. Additional charge for foreign mailing, $14.00. All population series reports sold as a single consolidated subscription $56.00 per year. Price for this report 45 cents.
2
POPULATION ESTIMATES METHODOLOGY
To estimate the population of each subcounty area, a component procedure (the Administrative Records method) was used, with each of the components of population change (births, deaths, net migration, and special populations) estimated separately. The estimates were derived in two stages, moving from 1970 as a base year to develop estimates for 1973, and in turn, moving from 1973 as the base year to derive esti mates for 1975.
Migration. individual Federal income tax returns were used to measure migration by matching individual returns for successive periods. The places of residence on tax returns filed in the base year and in the estimate year were noted for matched returns to determine in-migrants, out-migrants, and nonmigrants for each area. A net migration rate was derived, based on the difference between the inmigration and out-migration of taxpayers and dependents, and was applied to a base population to yield an estimate of net migration for all persons in the area.
Natural increase. Reported resident birth and death statistics were used, wherever available, to estimate natural increase. These data were collected from State health departments and supplemented, where necessary I by data prepared and pu blished by the U.S. Department of Health, Education, and Welfare, National Center for Health Statistics. For subcounty areas where reported birth and death statistics were not available from either source, estimates were developed by applying national fertility and mortality rates to the 1970 census counts for the cohort of the female population 18 to 34 years old and to the total population 65 years old and over, respectively, in these areas. These estimates were subsequently controlled to agree with birth and death statistics for larger areas where reported data were available.
Adjustment for special populations. In addition to the above components of population change, estimates of special populations were also taken into account. Special populations include immigrants from abroad, members of the Armed Forces living in barracks, residents of institutions (prisons and longterm health care facilities), and college students enrolled in full-time programs. These populations were treated separately because changes in these types of population groups are not reflected in the components of population change developed by standard measures, and the information is generally available for use as an independent series.
In generating estimates for counties by this procedure, the method was modified slightly to make the county estimates specific to the resident population under 65 years of age. The resident population 65 years old and over in counties was estimated separately by adding the change in Medicare enrollees between April 1, 1970 and July 1 of the estimate year to the April 1, 1970 population 65 years old and over in the county as enumerated in the 1970 census. These estimates of the population 65 years old and over were then added to estimates of the population under 65 years old to yield estimates of the total resident population in each county.
Annexations and new incorporations. The 1970 census counts shown in this report reflect all population "corrections" made to the figures after the initial tabulations. In addition, adjustments for large annexations through December 31, 1975, are reflected in the estimates. 2 For new incorporations occurring after 1970, the 1970 population within the boundaries of the new areas are shown in the detailed table. This geographic updating is accomplished largely as a result of an annual boundary and annexation survey conducted by the Bureau of the Census.
Other adjustments. For areas where special censuses were conducted after Ju Iy 1, 1972, such special censuses were taken into account in developing the estimates. 3 In several States, the subcounty estimates developed by the Administrative Records method were averaged with estimates for corresponding geographic areas which were prepared by
21n genet ai, an annexation was included if the 1970 census count for the annexing area was 5,000 or more and the 1970 census count for the annexed area or areas exceeded 5 percent of the 1970 count for the annexing area. Adjustments were also made for a limited number of "unusual" annexations where the annexations for an area did not meet the minimum requirements but were accepted by the Office of Revenue Sharing for inclusion in the population base.
3 Only special censuses conducted by the Bureau of the Census or by the California, Florida, Oregon, or Washington State agencies participating in the Federal-State Cooperative Program for Local Population Estimates were used for this purpose. In addition, in a relatively small number of cases where special censuses were conducted by localities, where the procedures and definitions were essentially the same as those used by the Bureau of the Census, the results of these special censuses were also taken into account in preparing the estimates.
State agencies participating in the Federal-State Cooperative Program for Local Population Estimates (FSCP). These States include California, Florida, Oregon, Washington, and Wisconsin.
The estimates for the subareas in each county were adjusted to independent county estimates. For 1973, the county estimates are revisions to those prepared by the Bureau of the Census alone or by the Bureau of the Census in conjunction with participating State agencies as a part of the FederalState Cooperative Program. These estimates are revisions of those published in Current Population Reports, Series No. For 1 an inter-
set of county estimates was since all of the data necessary to develop final estimates under program were not available. ically, data for two of the methods upon in the estimates (Le., Component Method II and the Administrative Records method) were available. The 1975 estimates result from adding the average 1974-1915 population change indicated by the two methods to the 1974 county population figures contained in Current Population Reports, Series and P-26.
The county estimates, in turn, were adjusted to be consistent with independent State estimates lished by the Bureau of the Census in Current Popu-
Reports, Nos. and in which the Administrative Records-based estimates were averaged with the estimates prepared using Component Method II and the Regression method. 4
PER CAPITA INCOME ESTIMATES METHODOLOGY
The 1974 and revised 1972 per capita income (PCI) figure is the estimated average amount per person of total money income received during calendar years 1914 and 1912 for all persons residing in a given political jurisdiction in April 1975 and April 1973, respectively. The 1974 and revised 1972 PCI estimates are based on the 1970 census and have been updated using rates of change developed from various administrative record sets and compilations, mainly from the Internal Revenue Service (I RS) and the Bureau of Economic Analysis (BEA).
4 For further discussion of the methodologies used in preparing State estimates, see Current Population Reports, Series P-25, No. 640.
3
The PCI estimates are based on a money income concept. Total money income is defined by the Bureau of the Census for statistical purposes as the sum of:
• Wage and salary income • Net nonfarm self-employment income • Net farm self-employment income • Security and retirement
income • Public assistance income • AI! other income
income at the types income for these updated using rates of aggregate money income Economic
At county these procedures were estimates of income data for sub-State were to nOrlreporting of address information on the tax return and to misassignment of geographic location for reported addresses. To minimize the impact on the estimates from such potentia! sources of error, per capita wage and salary income for counties was updated intact as a per capita figure using the percentage change in wage and salary income per exemption reported on ! RS returns. In addition, because of differences in the definition of data collection techniques, and estimation procedures, 1969 in-
5 I ncome data from the 1970 census reflect income received in calendar year 1969.
4
come estimates from the census and BEA were not strictly comparable. These differences were especially evident at the county level for nonfarm and farm self-employment income. B EA estimates for these types of income tend to have considerably more year-to-year variation than estimates derived from surveys and censuses. To minimize the effects
these differences, constraints were put on the rate of change in income from these sou rees in developing the 1972 and 1974 PCI updates.
As a final step to insure a uniform series of estimates at the State and county levels, the updated county per capita figures were converted to a total aggregate income and were adjusted to agree with the State aggregate level before a final per capita income was calculated.
Procedures for subcounty per capita income estimates. The 1974 and revised 1972 per capita income estimates for subcounty governmental units were developed using a methodology similar to that used to derive county-level figures. However, there are differences· in the number of separate categories of inco.me types used in the estimation procedure, and in the sources used to update the income components.
As in the case of the population estimates, a two-step procedure was relied upon to update the income figures from their 1969 level to refer to 1974. The 1972 estimates were prepared using the rate of change from 1969 to 1972. The 1974 estimates are based on the 1972 estimates, and were updated by an estimate of change from 1972 to 1974. Also, as in the case of the population figures, the subcounty income data were uniformly adjusted to reflect major annexation and boundary changes which occurred since 1970.
1969 base estimates. The 1970 census PCI figures for small areas are subject to sizable sampling variability, causing them to lack sufficient statistical reliability for use in the estimation process. For this report, the 1969 PCI shown for areas with a 1970 census sample population estimate of less than 1,000 is a weighted average of the original 1970 census sample value and a regression estimate. Research has indicated that this procedure results in a considerable improvement in accuracy compared to the procedure relied upon in earlier estimates, which was to use the county PCI amount for various small governmental units. The resulting 1969 estimate for each of these areas is a base estimate for preparing 1972 and 1974 estimates and does not represent a change in the 1970 census value for these areas.
For subcounty updating, 1969 total money income was divided into two components: (1) Jltaxable income" which is approximately comparable to that portion of income included in I RS adjusted gross income, and (2) "transfer income" which for the most part is not included in adjusted gross income. These 1969 subcou nty estimates were adjusted to 1970 census totals for higher level government units. This was done using a two-way adjustment procedure controlling both to county totals and to several size class totals for the State. 6
1972 (revised) and 1974 PCI updates. The taxable income portion of the 1969 money income was updated using the percent change in adjusted gross income (AG I) per exemption as computed from! RS tax return data. However, if the number of I RS tax returns for any area was very small, or if the ratio of exemptions to the population or the change in this ratio from 1969 to 1972 and 1972 to 1974 was not within an acceptable range, the I RS data for the subcounty area were not used in the update process. In such cases the percent change in AGI per exemption for the county was used. Similarly, if the IRS data for a particular subcounty area passed the above conditions, but the percent change in AG I per exemption was excessively large or small compared to that for the county, the change was constrained to a proportion of the county change.
The percentage change in per capita transfer income at the subcounty level was assumed to be the same as that implied by the BEA estimates at the county level.
The 1974 and 1972 estimates of taxable income and transfer income were adjusted separately using a two-way procedure similar to that used for the base estimates and were then combined to estimate total money income. The 1974 and 1972 PCI estimates were formed by dividing the total money income aggregates by the July 1975 and 1973 population estimates, respectively.
REVISION OF 1973 POPULATION AND 1972 PER CAPITA INCOME ESTIMATES
The July 1, 1973 population and calendar year '1972 per capita income estimates presented in this report supersede those estimates published earlier in
6 Additional review and evaluation detail concerning the 1969 estimated income for places under 1,000 population is contained in Current Population Reports, Series P-25, No. 699.
Current Population Reports, Series P-25, Nos. 546 through 595. The July 1, 1973 population estimates shown in this report differ from those published previously for several reasons: (1) The procedure for correcting missing address information on the original tax forms was changed to more accurately reflect the population distribution of the various areas; (2) more accurate and up-to-date information on several components of population change (births,
" deaths, and special population groups) are now available; (3) the net migration component has been changed from a civilian population base to refer instead to the non-group quarters population (i.e., resident population excluding members of the Armed Forces living in barracks, inmates of longterm hospitals and prisons, and fu II-time students enrolled in college); and (4) additional special censuses are available for use that were conducted since the time of the last estimates.
Similarly for per capita income: (1)The 1969 income levels for small areas have been estimated rather than relying upon reported 1970 census figures, and (2) a revised procedure was used in controlling the 1972 estimates for internal agreement.
LIMITATIONS OF THE ESTIMATES
Population estimates. Tests of the accuracy of the methods used to develop State and county population estimates appearing in Current Population Reports, Series P-25 and P-26 have been documented elsewhere. The results of evaluations against the 1970 census at the State level are reported in Series P-25, No. 520, while similar 1970 tests for counties are presented in Series P-26, No. 21. In summary, the State estimates averaging Component Method II and the Regression method yielded average differences of approximately 1.9 percent when compared to the 1970 census. Subsequent modifications of the two procedures that have been incorporated in preparing estimates for the 1970's would have reduced the average difference in 1970 to 1.2 percent. For counties, the 1970 evaluations indicated an average difference of approximately 4.5 percent for the combination of procedures used. It should be noted that all of the evaluations against the results of the 1970 census concern estimates extending over the entire 10-year period of 1960 to 1970.
Since 1970, however, the Administrative Records method has been introduced with partial weight in
5
the estimates for States and counties, and except for the few States in which local estimates are utilized, carries the full weight for estimates below the county level. The data series upon which the estimates procedure is based has been available as a comprehensive series for the entire United States only since 1967. Nonetheless, several studies have been under·" taken evaluating the Administrative Records estimates from the State to the local level. At the Statewide level, little direct testing can be performed due to the lack of special censuses covering entire States. Some sense of the general reasonableness of the Administrative Records estimates may be obtained, however, by reviewing the degree of correspondence between the results of the method against those of the "standard" methods tested in 1970 and already in use to produce State estimates during the 1970's. It must be recognized that the differences between the two sets of estimates may not be interpreted as errors in either set of figures, but may only be used as a partial gu ide indicati ng the degree of consistency between the newer Administrative Records system and the established methods.
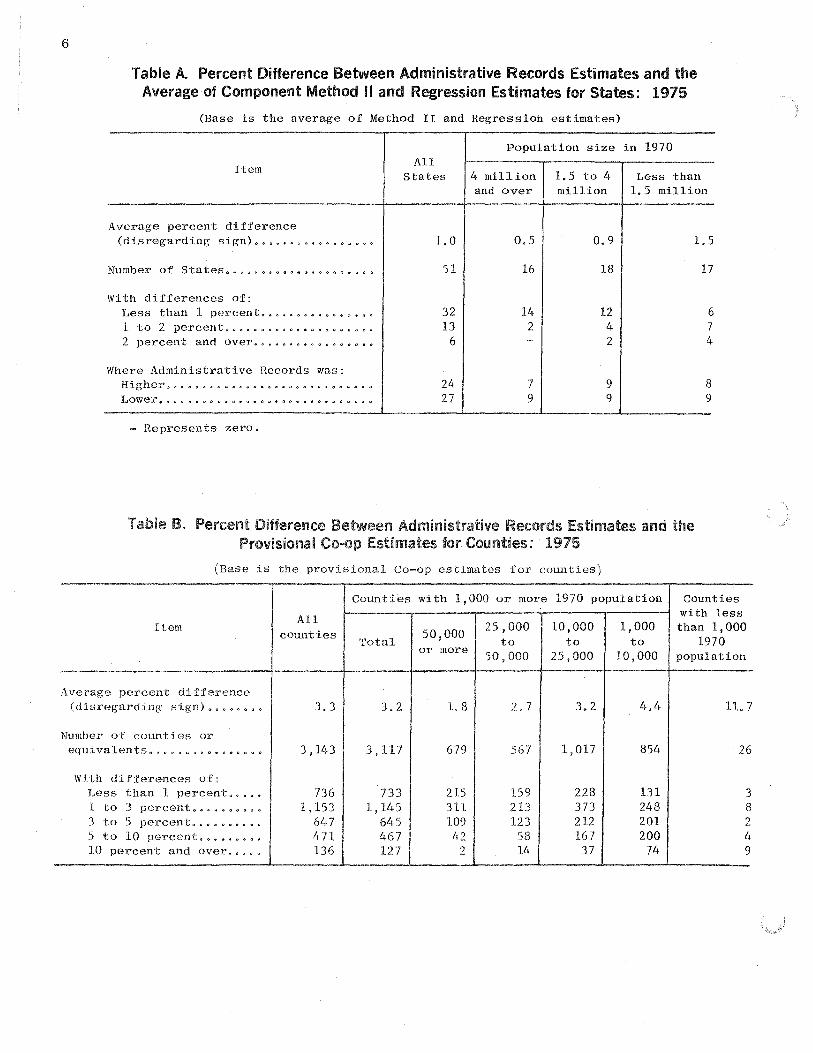
Table A presents such a comparison for State estimates referring to July 1, 1975. A rather close agreement may be observed in the estimates for all States at only a 1.0 percent difference. Only two States exceeded a 3-percent difference, with both being smaller States (under one million population) and both having unique circumstances that affect population patterns (Alaska and the District of Columbia). The variation of the Administrative Records method from the average of the other methods does increase noticeably for smaller States in a regular pattern, but still reaches an average of only 1.5 percent for the smallest size category.
The findings indicate no directional bias in the Adm inistrative Records method either for all States or by size. It should also be noted that the Administrative Records estimate falls in the middle of the th ree esti mates for 18 States, in contrast with approximately 17 cases to be expected by chance.
A similar comparison may be made at the county level (table B). Although the differences between the Co-op estimates and the Administrative Records results are larger at the county level than for States, the variations are well within the range that would be expected for areas of this population size, and the county pattern matches closely the findings for States. The overall differences for all counties is 3.3 percent, and ranges from 1.8 percent for the larger counties to 11.7 for the 26 small counties under 1,000 population.
6
Table A. Percent Difference Between Administrative Records Estimates and the Average of Component Method II and Regression Estimates for States: 1975
(Base is the average of Method II and Regression estimates)
Population size in 1970
Item All
States 4 million 1.5 to 4 Less than and over million 1.5 million
Average percent difference (disregarding sign) •••••.••.•••••• , • 1.0 0.5 0.9
Number of States ••••.•••••••••••••• ,. 51 16 18
With differences of: Less than 1 percent. , , .••.••••••••. 32 14 12 1 to 2 percent" " " .... " . a " " • '" " <10 " " 0,) (I Q III It 13 2 4 2 percent and over ...••.••••••••••• 6 - 2
Where Administrative Records was: Higher ••.•••.•••. , •••••••• , •••••••• 24 7 9 Lower" 0 ...... " " " " .. <) .. " ..... " .. (I I) .. " " " .... " (I " " ..
27 9 9
- Represents zero.
Table B. Percent Difference Between Administrative Records Estimates and the Provisional Co~op Estimates for Counties: 1975
(Base is the provisional Co-op estimates for counties)
1.5
17
6 7 4
8 9
Counties with 1,000 or more 1970 population Counties
All with less
Item counties 50,000 25,000 10,000 1,000 than 1,000
Total to to to 1970 or more 50,000 25,000 10,000 population
- -1---
Average percent difference (disregarding (I"" <) Q Q <;0 (I 3.3 3.2 1.8 2.7 3.2 4.4 110 7
Number of counties or equi valen ts ••.•• , •••••••••• 3,143 3,117 679 567 1,017 854 26
With differences of: Less than 1 percent •.••• 736 733 215 159 228 131 3 1 to 3 percent •••.•••••. 1,153 1,145 311 213 373 248 8 3 to 5 percent •••••••••. M7 645 109 123 212 201 2 5 to 10 percent ••••.•••• 471 467 42 58 167 200 4 10 percent and over ••.•• 136 127 2 14 37 74 9
Comparison of these results for States and counties in 1975 with a similar analysis based on 1973 estimates is helpful as an indication of consistency over time. Some deterioration in the match of results from a selection of estimating techniques should be anticipated as the length of the estimating period increases and as the methods respond in varying degrees to the dynamics of population shifts. At the State level, such divergence is found. The overall variation increased from 0.6 percent difference in 1973 to 1.0 percent in 1975, with the most dramatic jumps occurring in the small States. On examination of the independent estimates from each method, however, this may be attributed as much to an increased variability in the Method II and Regression method results as to a tendency for the Administrative Records estimates to wander.
At the county leve" the findings over time are more mixed. The level of difference for all counties indicates little change since the 1973 estimates (3.1 percent difference in 1973 and 3.3 percent in 1975). There are noticeable reductions in the differences for the largest and smallest population size categories (from 2.3 percent in 1973 to 1.8 percent in 1975 for counties of 50,000 or more, and from 18.1 percent to 11.7 percent for counties under 1,000 population), but modest increases may be observed in the variations for the remaining categories. In general, there appears to be some decrease of correspondence in the State level figures that should be monitored in coming years, but little change has occurred in the county variations, with even some convergence of estimates for the larger and smaller counties.
7
Three tests of the Administrative Records population estimates against census counts have been undertaken. First, a limited evaluation involving 24 large areas (16 counties and 8 cities) was conducted on estimates for the 1968-1970 period. 7 Althoughthe test shows the estimates to be qu ite accu rate (1.8 percent difference), the areas may not be assumed to be representative of the 39,000 units of government covered by the Administrative Records estimating system, and the time segment evaluated refers only to a 2-year period.
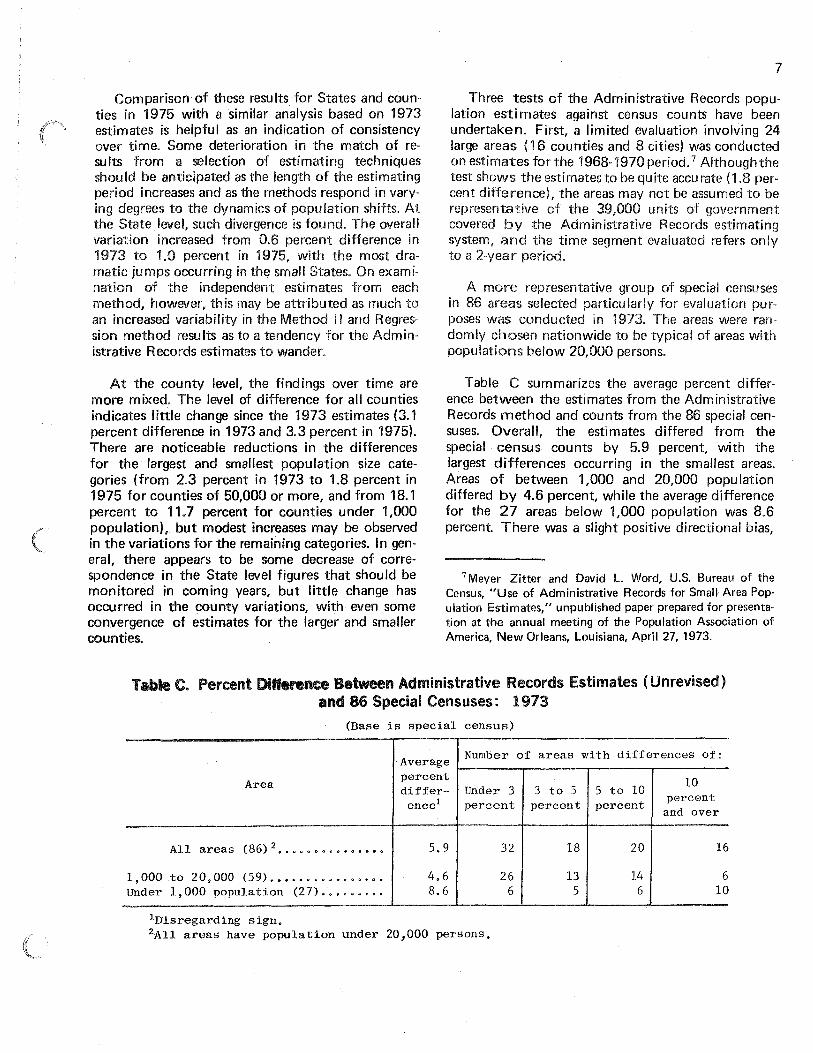
A more representative group of special censuses in 86 areas selected particularly for evafuatiol1 purposes was conducted in 1973. The areas were randomly chosen nationwide to be typical of areas with populations below 20,000 persons.
Table C summarizes the average percent difference between the estimates from the Administrative Records method and counts from the 86 special censuses. Overall, the estimates differed from the special census counts by 5.9 percent, with the largest differences occurring in the smallest areas. Areas of between 1,000 and 20,000 popUlation differed by 4.6 percent, while the average difference for the 27 areas below 1,000 population was 8.6 percent. There was a slight positive directional bias,
7 Meyer Zitter and David L. Word, U.S. Bureau of the Census, "Use of Administrative Records for Small Area Pop· ulation Esti mates," unpubl ished paper prepared for presentation at the annual meeting of the Population Association of America, New Orleans, Louisiana, April 27, 1973.
Table C. Percent Difference Between Administrative Records Estimates (Unrevised) and 86 Special Censuses: 1973
(Base is special census)
Average Number of areas with differences of:
Area percent 10 differ- Under 3 3 to 5 5 to 10 ence1 percent percent percent
percent and over
All areas (86)2 •••.••••••••••• 5.9 32 18 20 16
1,000 to 20,000 (59) •••••••••••••••• 4.6 26 13 14 6 Under 1,000 population (27) .••.••••. 8.6 6 5 6 10
IDisregarding sign. 2All areas have population under 20,000 persons.
8
with about 60 percent of the estimates exceeding the census counts. Again the impact of population size on the expected level of accuracy may be noted. Even though all of the areas in this study are relatively small-less than 20,000 population-the larger ones demonstrate much lower variation from census figures than the smaller ones.
The third evaluation involving census comparisons is currently underway, and is based upon the approximately 2,000 special censuses that have been conducted since 1970 at the request of localities throughout the United States. Such areas constitute a fairly stringent test for any method in that they are generally very small areas, often are experiencing rapid population growth, and frequently are found to have had a vigorous program of annexation since the last census. This evaluation study has not been completed for use here but will be included in detail as a part of the comprehensive methodologV description in Current Population Reports, Series P-25, No. 699.
As a final caution, it must be noted that for convenience in presentation, the estimates contained in table I are shown in unrounded form. It is not intended, however, that the figures be considered accurate to the last digit. The nature of estimates prompts the rounding of figures in related Bureau reports and must be kept in mind during the application of the estimates contained here.
Per capita income estimates. Similar types of analyses and evaluation are not available for the updated estimates of PCI. Income data and PCI for 1972 are available for the 86 areas in which special censuses were conducted for testing purposes. As noted, however, the areas in which the censuses were taken are relatively small. The PC! estimates are based upon data from the 1970 census, which are subject to sampling variability due to the size
the areas. Consequently, PCI did not change enough in the 1970-72 period in most instances to move outside of the relatively large range of sampling variability associated with the 1970 census results on income for small areas. Thus, it is not possible to obtain a reliable reading or even rough approximations on the accuracy of the change in PCI using the 86 areas as standards. The estimates were made avai lable to persons working with economic statistics .in each State for review prior to publication. Comments from this "local" review helped identify problem areas and input data errors.
RELATED REPORTS
The population and per capita income estimates shown in this series of reports supersede those found in Current Population Reports, Series P-25, Nos. 546 through 595 for 1973. The population estimates contained here for States are consistent with Series P-25, No. 533 (1973) and No. 642 (1975). The county estimates for 1975 are superior to the provisional 1975 figures published earlier in Series P-25 and P-26 due to the addition of a second method, but will not be reported elsewhere in Current Population Reports. The county population estimates will be replaced by subsequent final 1975 figures to be developed through the FederalState Cooperative Program for Local Popu lation Estimates.
DETAILED TABLE SYMBOLS
In the detailed table entries, a dash "_" represents zero, and the symbol "z" indicates that the figure is less than 0.05 percent. The symbol "8" means that the base for the derived figure is less than 75,000. Three dots " . .. " mean not applicable, and uNA" means not available.
N.C. 9
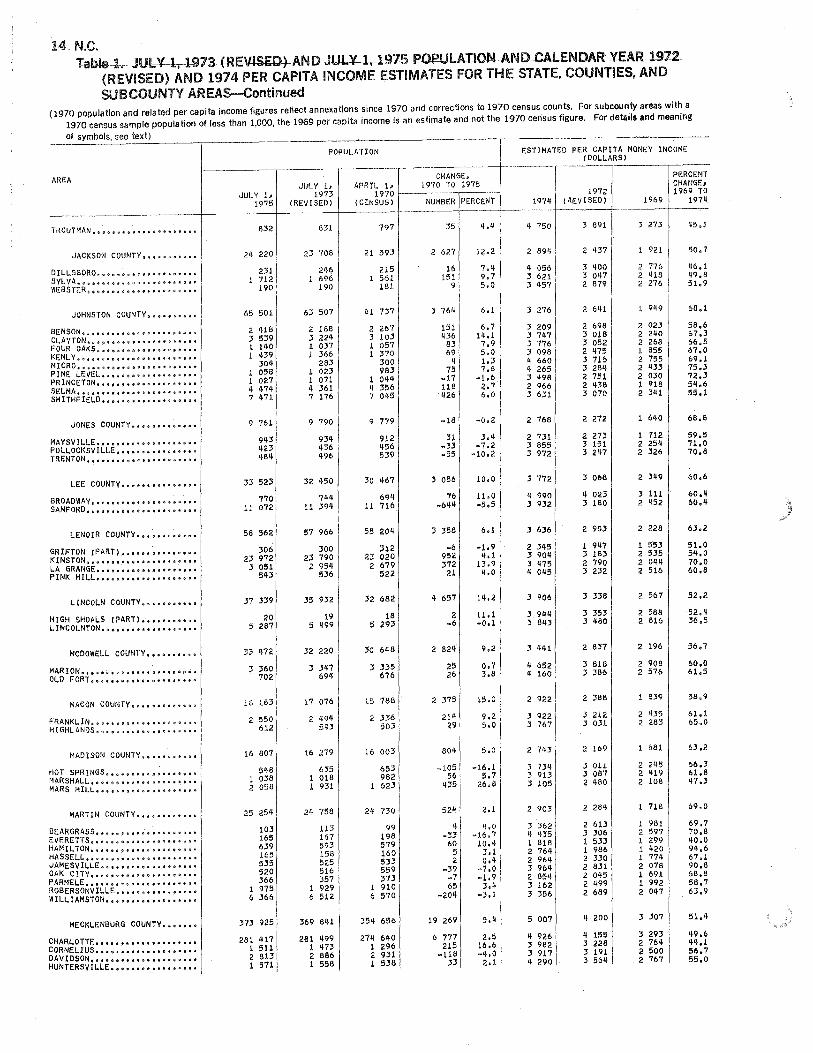
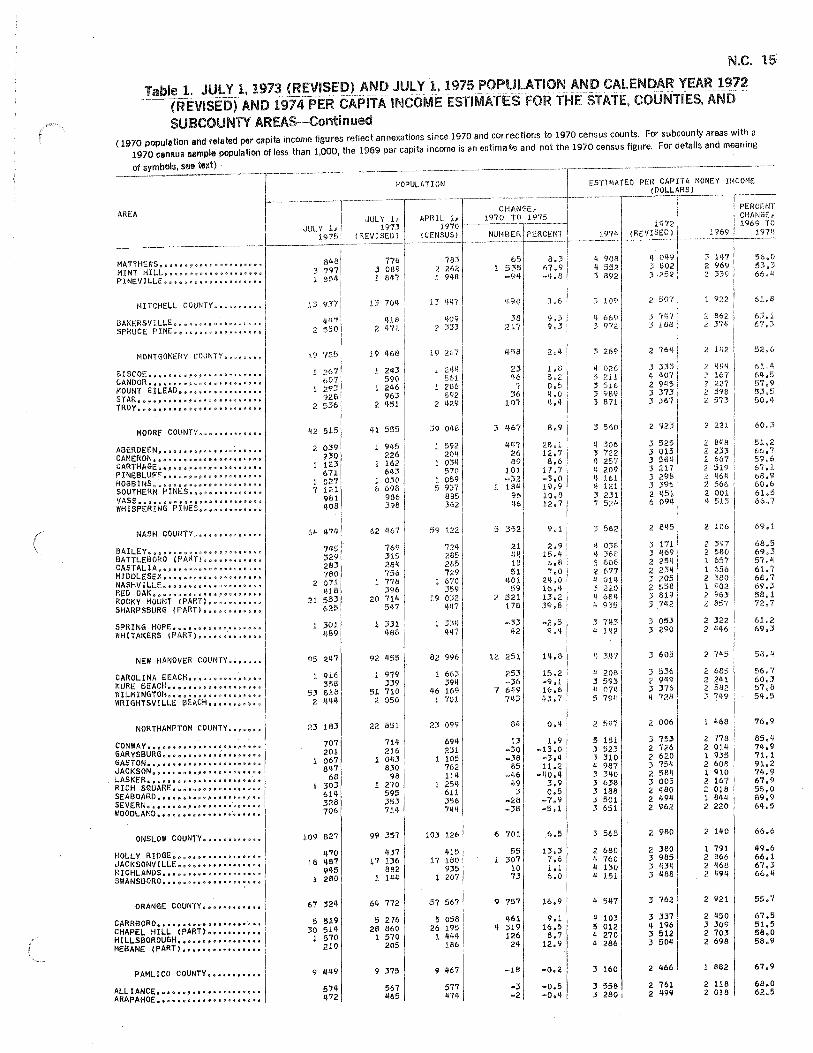
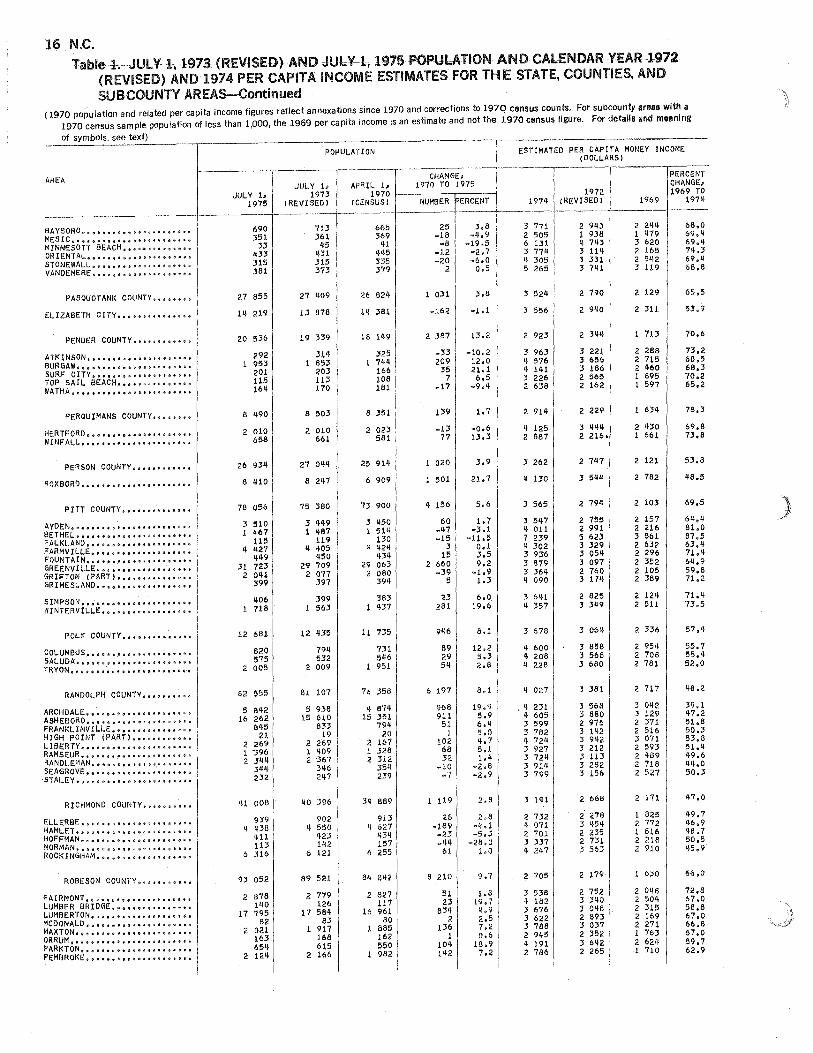
Table 1. JULY 1. 1973 (REVISED) AND JULY 1, 1975 POPULATION AND CALENDAR YEAR 1972 (REVISED) AND 1974 PER CAPITA INCOME ESTIMATES FOR THE STATE, COUNTIES, AND
SUBCOUNTY AREAS (1970 population and related per capita income figures reflect annexations since 1970 and corrections to 1970 census counts, For subcounty areas with a
1970 census sample population of less than 1,000, the 1969 per capita income is an estimate and not the 1970 census figure, For details and meaning
of symbols, see text)
AREA
STATE OF NORTH CAROLINA
ALAMANCE COUNTY ••••••••••
BURLINGTON, ••••••••••••• , •••• ELON COLLEGE ••••••••••••••••• GIBSONVILLE (PART ••• , •••••••• GRAHAM ~ d Ii) U ... 10 ~ "'" /I <> ~ " a ~ II Q ~ a $ ~ "
HAW RIVER .................. .. MEBANE (PART) ••••••••••••••••
ALEXANDER COUNTy •••••••••
TAyLORSVILLE •••••••••••••••••
ALLEGHANY COUNTy •••••••••
ANSON COUNTy •••••••••••••
ANSONVILLE ••••••••••••••••••• L1LESVILLE ••••• a •••••••••••••
MCFARLAN.~ ••••••••••••••••••• MORVEN ••••••••••••••••••••••• PEACHLAND ...... , .... p ..... g ••• jj •
POLKTON ••••••••••••••••••• ". / WADESBORO ••••• , ••••••••• , ••••
ASHE COUNTy ••••••••••••••
JEFFERSON ••••••• I) • e ••••• " ••• "
LANSING •••••••••••••••••••••• WEST JEFFERSON •••••••••••••••
AVERY COUNTy •••••••••••••
BEAUFORT COUNTy ••••••••••
AURORA •••••• , •• II • " II ...... I , •• "
SA TH. " • " • " •••••• " ••••• It It • ~ •• ~ 8ELHAVEN ••••••••• ,.$_.D.~ ••. e
CHOCOWINITY •••••••• a •••••••• f
PANTEGOe •• e •• e •• e •• e •••• j'.e~ WASHINGTON •••• e.GoB •••• Q.~.~~ WASHINGTON PARK ••••••••••••••
BERTIE COUNTy ••••••••••••
ASKEWVILLE .................. . AULANDER ••••••• , ••••••••••••• COLERAIN ••••••••••••••••••• "/ KELFORD •••••••••••••••••••••• LE.ISTON ••••••••••••••••••••• POWELLSVILLE ••••••••••••••••• ROXOBEL •••••••••••••••••••••• WINDSOR ••••••••••••••••••• , •• WOODVILlE ••••••• , ••••••••••••
BLADEN COUNTy ••••••••••• ,
BLADENBORO ••••••••••••••••••• CLARKTON.~~ ••••• P~~~&~'Q~.~Qa DUBLIN ...................... . EAST ARCADIA ••••••••••••••••• ELIZABETHTOWN •••••••••••••••• TAR HEEL. ~ •• ~ • ~ ell" •• '" $ 1I ft ...... p
WHITE LAKE •••• , ••••••••••••••
BRUNSWICK COUNTy •••••••••
BOILING SPRINGS LAKES •••••••• BOL 1 V I A ... " • I> Il Be" " II • ell .. 1;1 ~ " g • 1;1 ~
5
98 954
37 586 2 531
872 8 926 2 151 2 389
22 035
599
8 725
1 383
736 649 138 681 503
1. 020 ~ l~II
20 211
903 300 965
14 iii I 557
38 130
669 2q1
2 177 571 216
8 811 550
20 923
238 931 381 188 337 262 '121 295 269
28 813
2 098 719 362 606 558, 106 225
32 523
372 230
POPULATION
920 8 ~08
2 058 2 465
2J. 515
566
8 563
3'17
24 060
755 652 140 60'1 5'13
1 054 4 179
13 556
815 280 515 560
36 931
625 238
2 193 556 215
8 833
536/ 20 632
2lfJ 9'11 373 234 329 254 395
2 218 298
27 799
2 106 669 322 584 508
99 217
30 501
376 226
APRIL 1, 3.970
(CENSUS)
08t; 411
19 '166
1. 231
23 488
694 641 140 562 556 8q5
3 977
19 571
9~3 283 889
12 655
751! 26'1 503 52'f
35 980
620 231
2 259 566 218
8 961 517
20 528
247 9'+7 373 295 .327 2WI 347
2 199 253
26 1177
2 027 662 283 556 418
87 232
CHANGE, 1970 TO 1975
NUMBER PERCENT
;356 955
~If97
381. 30
754 20'7
2
2 569
368
591
79
637
'12 8
-2 119 -53 175 167
640
-'10 17 76
'165
106 26 10 33
2 150
49 10
-82 5
-2 -150
33
395
-9 -16
8 -107
10 15 7Lf 96 16
2 336
71 57 79 50
1'10 19 -7
8 300
3.27 <!5
7.0
29.9
7.3
6.1
2.7
6.1 1.2
-l,q 21.2 -9.5 20.7
4.2
14.1 9.8 2.0 6.3
6.0
7.9 q.3
-3.6 0,9
-0.9 -1.7
6.1!
-3.6 ·'1.7 2.1
-36.3 3.1 6.1
21.3 4.4 6.3
8.8
3.5 8.6
27.9 9.0 9.9
21.8 -3.0
ESTIMATED PER CAPITA MONEY INCOME (DOLLARS)
:3 512
3 880
2 939
3 870
2 833
3 416 3 826 ;3 1'19 3 056 2 971 :3 02'1 3 396
" 816
" 533 :I 356 :3 715
;2 7S'l
2 092 :3 631 2 15'1 :\ 496
3 296
'l '158 :I 582 2 563 3 935 3 896 3 358 7672
2 772
3 665 I 'I 020 I 5 630 2 602 'I 174 " 129 q 266 'I 036 2 092
2 756
:3 835 3 '114 :3 694 1 708 'I 554 :3 687 4 262
2 '192
685
2 321
:3 008 3 164 2 685 2 720 2 279 2 472 2 826
2 304
:3 711 2 692 2 960
2 352
1 910 3 033 1 939 2 939
2 619
:3 527 2 820 1 984 3 093 3 067 2 778 6 100
2 oa'l
2 700 3 192 'I 171 1 929 :3 093 3 059 2 883' 3 086 1 552
2 228
:3 05~ 2 688 3 099 1 364 3 66'1 2 931 3 607
PERCENT CHANGE, 1969 TO
).969 .1.97'1
2 471,
929
3 ~68 2 188 2 551 2 851 2 852 2 628
2 344
2 732 '
733
2 1.18 2 365 2 018 1 980 1 632 2 002 2 108
1 717
2 814 2 026 2 487
1 738
1 429 2 247 1 593 2 188
: ::: I 2 190 1 704 2 402 2 383 2 186 4 791
1 529
991 2 387 ::> 076 1 383 2 281 2 256 2 369 2 41', 1 030
633
2 298 2 099 2 095 1 003 2 688 2 147 2 641
2 013
2 520 2 757
49.8
42.0
50.9
56.9
61.4 61.8 56.0 54.:> 82.0 51.0 61.1
60.2
46./1 61.6 35.2 59.8
61.2
61.7 63.6 50.'1 63.8 63.5 53,6 60.1
81.3
84.1 68,4 83.0 88.1 83.0 83.0 80.1 67.2
103.1
68.6
66.9 62.6 76.3 70,3 69.4 71.7 61.'1
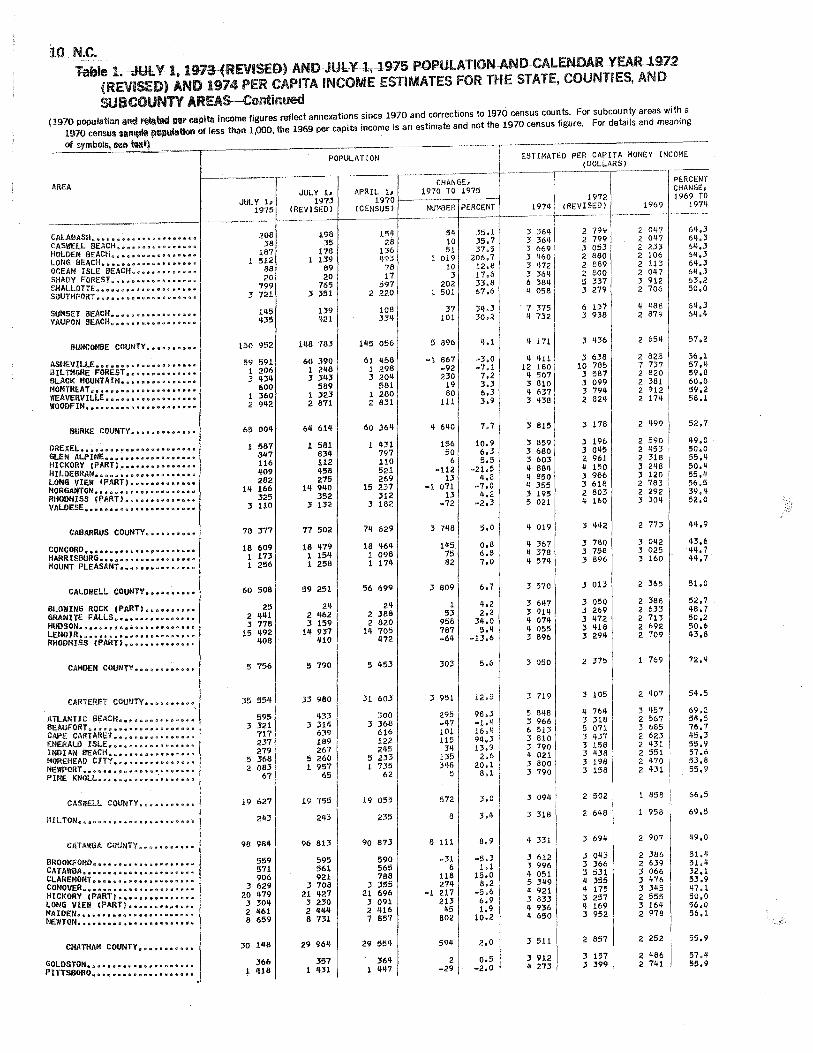
10 N.C. Table 1. JUl¥-1,1g.7a--{RElJISED)AND-JUl't!,-1975 POPULATION AND CAlENDARYEAR-J.972
(REVISED) AND 1914 PER CAPITA INCOME ESTIMATES FOR THE STATE, COUNTIES, AND
SUBCOUNTY AREAS-Continued (1970 population Ind ftlDtatiper capita income figures reflect annexations since 1970 and corrections to 1970'census counts. For subcounty areas with a
1970 census limpID Pllllllilltion of less than 1,000, the 1969 per capita income is an estimate and not the 1970 census figure. For details and meaning
of symbols, !i(!§ ttit)
AREA
ESTIMATED PER CAPITA MONEY INCOME (DOLLARS)
POPULATION ----.-~-r---.---- .-. _______ ,---__________ t-. __ . ____ ~.---~-------,----
CHANGE, 1970 TO 1975
PERCENT CHANGE, 1969 TO
JULV 1. 1975
JULY 1, APRIL 1. 1973 1970 I--.-----~----j
(REVISED) (CENSUS) NUMBER PERCENT 1972
1974 (REVISED) 1969 1974
__ ~ _____ ._ ..... ~ .. ~ __ ~_~f__.---.. - ._-.. ~ __ +------.-l___-- _._.-_. __ .4-----+--_._----- ----.---+-----
CALABASH" ... " Il ~" .. Q- '" U ~ 011 ~ tj!" d 8 fi\..,'" CASWELL BEACH •••••••••••••••• HOLDEN BEACH ••••••••••••••••• LONG BEACH ••••••••••••••••••• OCEAN ISLE BEACH ••••••••••••• SHADY FOREST ••••••••••••••••• SHAlLOTTE •• s~.$ .... ~ •• $e .. e •••• u
SOUTHPORT~$~&~coQoeog.$.$C$QO
SUNSET BEACH ••••••••••••••••• YAUPON BEACH •••••••••••••••••
BUNCOMBE COUNTy ••••••••••
ASHEVIlLE ••••• &.$$ •••••••••••
BILTMORE FOREST •••••••••••••• BLACK MOUNTAIN ••••••••••••••• MONTREAT ••••••••••••••••••••• WEAVERVILLE •••••• o o ••••••••••
WOODFIN s ... a ....... eo 0'11." "' •• *' .. ., .. 0'
BURKE COUNTy •••••••••••••
CABARRUS COUNTy ••••••••••
CALDWELL COUNTy ••••••••••
BLOWING ROCK (PARTI •••••••••• GRANITE FALLS •••••••••••••••• HUDSON ... e •• " ell.,. ••• "" a 8 .. "" .... II • lENOIR.e •••••••• ~ •• oe ••••••• a RHODHISS (PART) ••••••••••••••
CARTERET COUNTV ••••••••••
ATLANTIC BEACH ••••••••••••••• 8EAUFORTe •• 8 ••• ~ •••••••• Q .... $
CAPE CARTARET •••••••••••••••• EMERALD ISLE ••••••••••••••••• INDIAN BEACH ••••••••••••••••• MOREHEAD CITy •••••••••••••••• NEWPORT .... "'''I\''' $~ iii "''' 01> 11101 e e '" ""'~ .. PINE KNOLL ... GO .. e <;I Ii'''' It" 0 ",' I\' 10 .. .., i!< • II
CASWELL COUNTy •••••••••••
MILTON •••••••••••• eo •••••••••
CATAWBA COUNTy •••••••••••
CHATHAM COUNTy •••••••••••
208 38
187 1 512
88 20
799 3 721
145 435
150 952
59 591 1 206 3 43'1
600 1 360 2 9'12
65 00'1
1 587 847 116 Q.09 282
1'1 166 325
:3 110
78 377
18 609 1 173 1 256
60 508
25 2 'I'll 3 778
15 q:92 q:08
5 756
35 55t;
595 :3 321
717 237 279
5 368 2 063
67
19 621
2113
96 984
559 571 906
3 629 20 q:79
3 30'1 2 1461 8 659
30 1'1'8
366 ~ '118
196 35
178 1 139
89 20
765 3 351
139 '121
1'16 783
60 390 1 246 3 3'13
589 1 323 2871
611 61'1
1 581 83'1 112 458 215
1'1 9'10 352
:3 132
77 502
18 479 1 154 1 258
59 251
2'1 2 '162 3 159
14 937 '110
5 790
33 9110
q33 3 31'1
639 189 267
5 260 1 957
65
96 813
595 561 921
:3 701l 21 427
:5 230 2 '1'1'1 6 731
29 96'f
357 1 '131
154 26
136 '193
78 1'7
597 2. 220
108 3311
1'15 056
61 458 1 298 3 20'1
581 1 280 2 831
60 36'1
1 '131 797 110 521 269
15 237 312
3 182
74 629
16 '16'1 1 098 1 171JC
56 699
2'1 2 3118 2 620
14 705 '172
5 '153
31 603
300 J 368
616 122 2'15
5 233 1 735
62
19 055
235
90 873
590 565 788
J 355 21 696
3 091 2 '116 7 857
29 55'1
364 1 1JCl/7
54 10 51
1 019 10
3 202
1 501
37 101
5 896
-1 867 -92 230
19 80
111
II 6'10
156 50
6 -112
13 -1 071
13 -72
3 748
1'15 75 62
3 609
1 53
958 787 -6'1
303
;; 951
295 -'17 101 115
34 135 )'Ia
5
572
8
8 111
-31 6
118 27'1
-1 217 213
'15 802
59'1
2 -29
35.1 35.7 37.5
206.7 12.8 17.6 33.8 67.6
-3.0 -7.1 7.2 3.3 6.3 3.9
7.7
10.9 6.3 5.5
-21.5 4.8
-7.0 4.2
-2.3
0.8 6.8 7.0
6.7
'1.2 2.2
34.0 5.4
-13.6
5.6
12.5
98.3 -1.4 16.4 9'1,3 13.9
2.6 20.1
8.1
8.9
-5.3 1.1
15.0 8.2
-5.6 6.9 1.9
10.2
2.0
0.5 -2.0
3 364 3 364 3 669 3 460 J 472, 3 364 6 38'1 4 058
., 375 4 732
'I 171
'I 411 12 180
4 507 3 810 'I 637 3 438
3 815
3 859 :5 680 :I 603 'I 88'1 'I 850 4 355 3 195 5 021
'I 019
4 367 4 378 4 574
3 570
3 647 3 914 4 074 'I 055 :3 896
:5 050
:3 719
5 8118 :5 966 6 513 3 810 3 790 'I 021 :3 800 :3 790
'I 331
:5 612 3 996 'I 051 5 349 II 921 3 833 4 936 'I 650
3511
3 912 4 273
2 799 2 799 3 053 2 880 2 889 2 800 5 337 3 279
6 137 3 938
3 436
3 638 10 785
:5 587 3 099 :3 79'1 2 824
:3 178
3 196 3 0'15 2 961 'I 150 3 986 3 618 2 803 'I 160
:3 '1'12
:3 780 ;3 758 3 696
:3013
;3 050 :; 269 3/172 ;3 /118 ;3 2911
2 375
3 105
'l 76'1 :; 318 5 071 3 '137 3 156 ;3 '138 3 19B 3 158
2 502
2 6'18
3 69/1
:3 0'131' :5 366 :3 531 II 355 'I 175 3 257 4 169 :3 952
2 857
3 157 ;3 399
2 0'17 2 0'17 2 233 2 106 2 113 2 0'17 :; 912 2 706
'I 488 2 879
2 65/1
2 825 7 737 2 620 2 381 2 912 2 17'1
2 499
2 590 2 '153 2 318 :5 2'18 3 120 2 783 2 292 3 30'1
2 773
3 0'12 3 025 3 160
2 365
2 3881, 2 633 2 713 2 692 2 709
1 769
2 '107
3 '157 2 567 :3 685 2 623 2 '131 2 551
2 '170 I 2 431
1 658
1 958
2 907
2 386 2 639 Ii
3 066 ;3 '176 3 3'15 2 555 :3 16'1 2 978
2 252
2 '186 2 7/11
57.2
56.1 57.'1 59.8 60.0 59.2 58.1
52.7
~9.0 50.0 55.~ 50.4 55.4 56.5 39.'1 52.0
51.0
52.7 ~8.7 50.2 50.6 '13.8
72.4
69.2 5'1.5 76.7 45.3 55.9 57.6 53.8 55,9
66.5
69.5
'19,0
51.'1 51.4 32.1 53.9 ~7.1 50.0 56.0 56.1
55.9
57.4 55.9
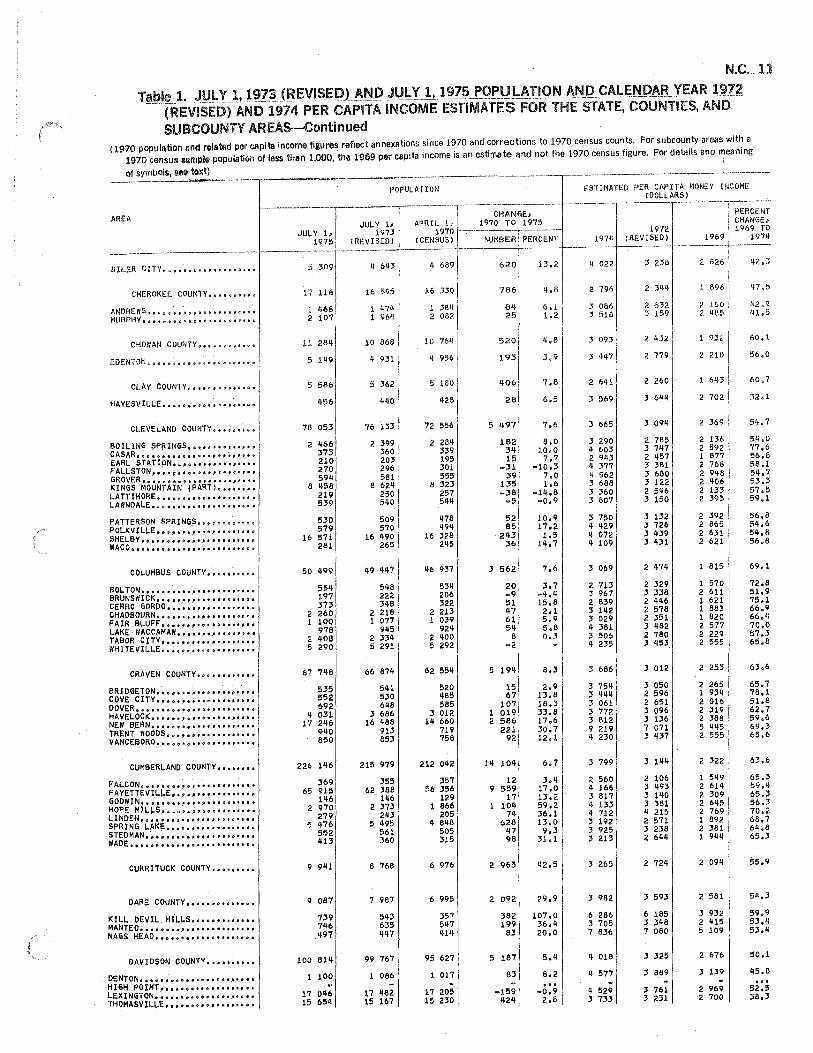
N.C. 11
T~tbJ~_t~ . JlIl\CkJ~?~JB EVISEPL~~R)J~b),J·-,_!~Z!;~Q~tJ B"..~ TIQN.l<f\J.QJ;/1I,..ENDAR. YFE:.AR 1 ~1~ (REVISED) AND 1914 PER CAPITA INCOME ESTIMATES FOR THE STATE, COUNTIES, AND SUBCOUNTY AREAS-Continued
(1970 population and filiated per capita Income figures reflect annexations since 1970 and corrections to 1970 census counts, For subcounty areas with a 1970 census sSimple population of less than 1,000, the 1969 per capita income is an estimate and not the 1970 census figure. For details and meaning
of symbols, 8ee text)
AREA
CHEROKEE COUNTy ••••••••••
ANDREWS~,9~o~~~o~.'o~~eep'o.o MURPHY.G~O~OU.~'0~t.O.O.GUO~.
CHOW AN COUNTy, •••••••••••
EDENTON. Q " " 0 • 0 OJ 0 ~ ~ •• 0 " '" •• I " • .,
CLEVELAND COUNTy •••••••••
BOILING ~P~ING? ••• o •••••••••
CASAR ••••••••••••••• P •• ~~ ••••
EARL STATION •••••••••••• ~., •• FALLSTON, ••••• ~., ••• , •••••••• GROVER •••• e ••••••••••••• ~ •• ,.
KINGS MOUNTAIN (PART) •••••••• LATTIMORE .................... . LAWNDALE ••••••• e' ••• *' •••• 8 •• "
PATTERSON SPRINGS ••• , ••••• , •• POLKV I LL~ ......... ~ ••• " • a ... 8 II ••
SHELBy •••••••••••••••••••• , •• WACO •• ". 0 ••• t .......... to I ••••
COLUMBUS COUNTy ••••••••••
BOLTON ....................... . BRUNSW I CK ••••• " •••• " • " • , ••••• CERRO GORDO •••••••••••••••••• CHADBOURN •• "." ••••••••••••••• FAIR BL.UFF ••••••••••• I (I .,. ". II
LAKE WACCAMA~ ....... " ••• " •••• " TABOR CITy ••••••••••••••••••• WHITEVILL.E •••••••••••••••••••
CRAVEN COUNTy ••••••••••••
BRIDGETON ••• " •.•••••••••• " •••• COVE CITY.~ •••••••••••••••••• OOVER ••••• o~ •• , ••••••••••••••
HAVELOCK ••••••••••••••••••••• NEW BERN •• 0 ••••••••••••••••••
TRENT WOODS .................. . VANCEBORO. 0 •••••••• a •••••••••
CUMBERLAND COUNTy ••••••••
FALCON ••••••••••••••••••••••• FAYETTEVILLE~ ••• ~ •••••••••••• GODWIN •••••••••••• , •••••••••• HOPE MIL.'""S .•••• , ••••••••••• e.lI. LINDEN •••••••••••••••• a ••••••
SPRING LAK~ ••• ~ ••••••••••••• g
STEDMA~ e •• fII' ~ •••• "' ••••••••••• WADE •••••••••••••••••••••••••
CURRITUCK COUNTy •••••••••
DARE COUNTy ••••••••••••••
KILL DEVIL. HIL.L.S •••••• .,.u ... MANTEO ••••••••••••• g ••••• t •••
NAGS HEAD ............ " ••••••••
DAVIDSON COUNTy ••••••••••
DENTON •• 11 •••• 0 ••••••••••.•••••
HIGH POINT, ••••• , •••••••• " ••• LEXINGTON •••••.••••• "' •• "'''' •• (I', THOMASVILLE ••••••••••••••••••
5 309
17 116
1 '166 2 107
11 28'1
5 1119
5 566
'156
78 053
2 '166 373 210 270 59'1
8 '158 219 539
530 579
16 571 281
50 '199
55'1 197 313
2 260 1 100
978 2 'lOB 5 290
67 7'18
535 552 692
'I 031 17 2'16
9'10 850
226 1'16
369 65 915
1116 2 970
279 5 '176
552 '113
9 9'11
9 087
739 7'16
,'197
100 81'1
100
17 0'16 15 6511
POPULATION
JULY 1, 1973
(REVISED)
10 868
II 931
5 362
'1'10
76 133
2 399 360 203 296 581
8 62'1 250 5'+0
509 570
16 '190 265
'19 '1'17
5'18 222 3'18
2 218 1 077
9115 2 33'1 5 291
66 87'1
5tH 530 M8
3 686 16 1188
913 853
215 979
355 62 388
1116 2 373
2'13 5 '195
561 360
8 768
99 767
086
17 tl82 15 167
APRIL 1, 1970
(CENSUS)
.. 689
10 764
4 956
5 180
428
72 556
2 281t 339 195 301 555
8 323 257 5t111
478 4911
16 328 245
46 937
53'1 206 322
2 213 1 039
9211 2 1100 5 292
62 554
520 485 585
J 012 14 660
719 758
212 0112
357 56 356
129 1 866
205 It 848
505 315
6 976
95 627
1 017
17 205 15 230
CHANGE, 1970 TO 1975
NUMBER PERCENT
620
786
811 25
520
193
406
28
tl97
182 311 15
·:51 39
135 -38 -5
52 85
2113 36
3 562
20 -9 51 tl7 61 54
6 -2
5 1911
15 67
107 1 019 2 586
221 92
14 lOti
12 9 559
17 lOll
7t1 628
47 98
2 965
2 092
382 199
83
5 187
63
-159 lI2t1
13.2
3.9
7.8
6.5
8.0 10.0 7.7
-10.3 7.0 1.6
-14.8 -0.9
10.9 17.2 1.5
14.7
7.6
3.7 -4.1I 15.8 2.1 5.9 5.8 0.3
8.3
2.9 13.8 18.3 33.8 17.6 30.7 12.1
6.7
3." 17.0 13.2 59.2 36.1 13.0 9.3
31.1
29.9
107.0 36." 20.0
8.2
ESTIMATED PER CAPITA MONEY INCOME (DOLLARS)
1972 1974 (REVISED)
4 022
2 796
J 086 :5 516
3 093
J 665
3 290 4 603 2 943 q 377 q 562 :3 688 :3 360 3 807
:3 750 q 429 4072 q 109
:3 069
2713 3 967 2 839 :3 1112 :3 029 II 381 :3 506 4 235
:3 686
3 75V, 3 v,v,q 3 061 3 772 3 812 9 219 4 230
3 799
2 560 .. 166 3 817 4 133 4 712 3 192 :3 925 3213
:3 265
J 982
6 286 :3 705 7 836
q 018
'1577
q 529 :3 7:J3
::I 231:l
2 432
2 779
2 260
3 6'lv,
:3 09V,
2 785 3 7V,7 2 lI57 :3 381 :3 680 3 122 2 596 3 150
3 132 ) 726 3 1139 3 4:31
2 li74
2 329 3 338 2 lIlI6 2 578 2 351 :3 1182 2 780 ;3 453
3 012
;3 050 2 596 2 651 3 096 3 136 7 071 3 437
:3 Iv,(f
2 106 :I tl93 3 1110 3 361 V, 215 2 571 :3 238 2 611V,
3 593
6 165 3 3118 7 080
3 325
:3 889
:5 761 :3 231
PERCENT CHANGE, 1969 TO
1969 19'1'f
2 826
896
2 160 2 485
932 I
2 210
6'13
702
369
2 136 2 592 1 877 2 768 2 948 2 406 2 133 2 393
2 392 2 865 2 631 2 621
815
1 570 2 611 1 621 1 883 1 820 2 577 2 229 2 555
2 253
2 265 1 934 2 016 2 319 2 388 5 4V,5 2 555
2 322
1 549 2 614 2 309 2 645 2 769 1 892 2 381 1 9qq
2 09'1
2 581
;;I 932 2 '115 5 109
2 676
3 139
2 969 2 700
47,5
60.1
56,0
60.7
32,1
54.0 77.6 56.8 58.1 511.7 53.3 57.5 59.1
56,8 54.6 5'1.8 56.8
69.1
72.8 51.9 75.1 66.9 66.1I 70.0 57.~ 65.8
63.6
65.7 78.1 51.8 62.7 59.6 69.3 65.6
63.6
65.3 59.q 65.3 56.3 70.2 66.7 64.8 65.3
55.9
S4,3
59,9 5).4 53.Q
50.1
'15.8 ... 52.5 38.3
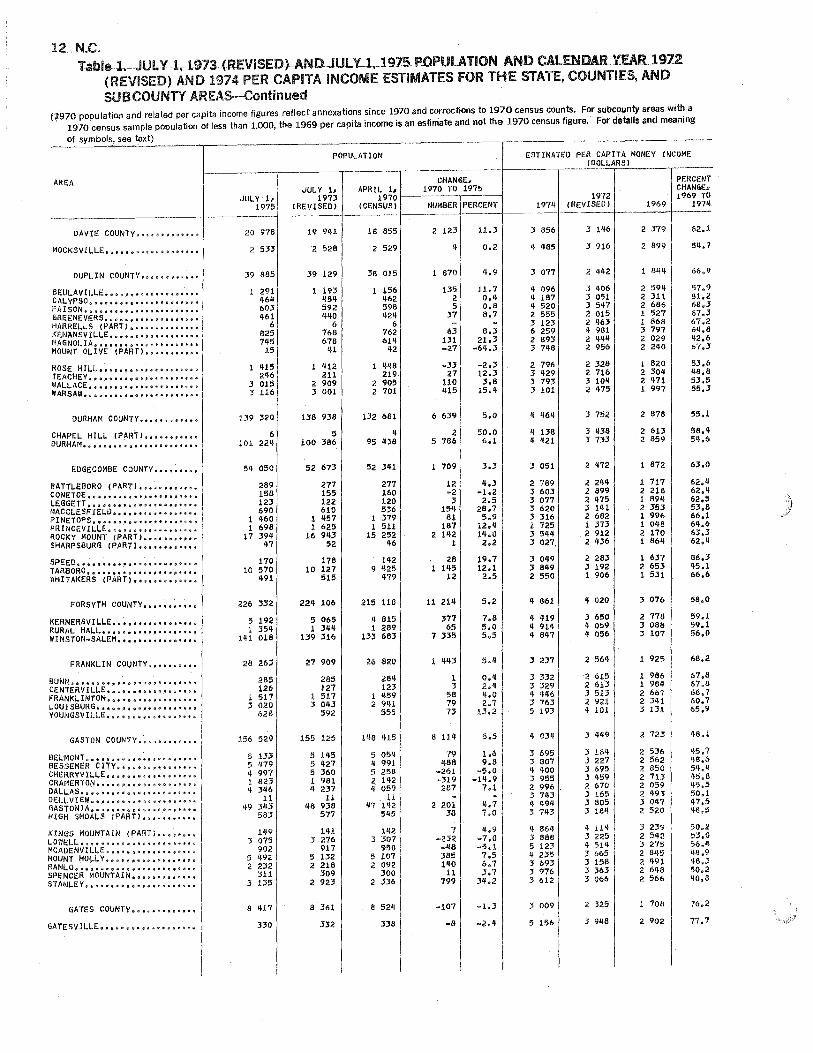
12 N.C. Tablel~JUlY .. 1, 1973 (REViSED}-ANDJUL 'Ll,1975POWLAtlOl\t ANQCALENDAR YEAR1912
(REVISED) AND 1974 PER CAPITA INCOME ESTIMATES FOR THE STATE, COUNTIES, AND SUBCOUNTY AREA5-Continued
n970 population and related per capita income figures reflect annexations since 1970 and corrections to 1970 census counts. For subcounty areas with a 1970 census sample population of less than 1,000, the 1969 per capita income is an estimate and not the 1970 census figure. For details and meaning
of symbols, see text)
AREA
DUPLIN COUNTy ••••••••••••
ROSE HrLLe'.'.~.DO.'.DD ••• U ••
TEACHEY De •• <I 0 •• e 0 0 ••. ' It II (I ••• <I •
WALLACE •• e,.'" ~ 011 I 0 •• II It •• D'"''
WARSAW. o •• , .................. .
DURHAM COUNTy ••••••••••••
CHAPEL HILL (PART) ••••••••••• DURHAM,;" Ii e''' •••• It e ,,,'.0- 10 •••• to
EDGECOMBE COUNTy •••••••••
BATTLEBORO (PART) •••••••••••• CONETOE" ., ••• 0) " ." iii tI ." ••• II ••• , •
LEGGETT •• II " •• e 'fl • " D •• " • II • e, •• MACCLESFIELD ••••••••••••••••• PINETOPS ...... II ... ""'"'''' • 11 II Gil.
PRINCEVILLE •• c,,;~~ijCi*~i.~. ROCKY MOUNT (PART) ••••••••••• SHARPSBURG (PART) ••••••••••••
FORSYTH COUNTY •• 'aa' •••••
KERNERSVILLEa.~.'.' ••••• ,., •• RURAL HALL ••••••••• e •• ee •••••
WINSTON~SALEM., ••••••••••••••
FRANKLIN COUNTy ••••••••••
GASTON COUNTy., ••••••••••
BELMONT ••••••••••••••••••• , •• BESSEMER CITy •••••••••••••••• CHERRVVIL~E ••••••••• 9.6 •• , •••
CRAMERTON"". D" II" If' $" ~. 1:1 .. 1:1 8. g" DALLAS e .. '" " • 1I • a 0 • It <;0 • It II ... " •• " " .,
OEI .. LVIEW Ii .... e"" Ii'. II I> """'" ,I.'" II
GASTONIA ••••••••••••• e •••••••
HIGH SHOALS (PART) •••••••••••
KINGS MOUNTAIN (PART) •••••••• LOWELL". e .. <I"""" ..... ,, Q ~ ~ II"" b" e ~ ~ MCADENVILLE.6e.~~~eo~o'oQ.~m. MOUNT HOLLy •••••••••••••••••• RANLOeQ.Do ••• O ••• q.~.,.~ ... ,. SPENCER MOUNTAIN ••••••••••••• STANLEy ..................... .
GATES COUNTy ............ .
GATESVILLE •••••••••••••••••••
POPULATION ESTIMATED PER CAPITA MONEV INCOME
-------r-------r------,--.-~----.-____ .___ (DOLLARS) --,------.-
JUL.Y 1, JULY 1, 1973
1975 (REVISED)
20 978
2 533
39 885
1 291 '1M 603 '161
6 825 7'15
15
1 '115 2'16
3 015 :3 116
139 320
(,
101 224
5'1 050
289 156 123 690
1 '160 1 698
17 394 47
170 10 570
'191
226 332
5 192 1 354
I'll 018
28 26J
285 126
1 517 :3 020
628
156 529
5 J.33 5 '179 'I 997 1 82' i! 3'16
11 '19 3113
58J
1'19 3 075
902 5492 2 232
311 3 135
a '117
330
19 941
2 528
39 129
1 193 4511 592 11110
6 766 678
111
1 '112 211
2 909 3 001
138 938
5 100 386
52 67:3
277 155 122 610
1 '157 1 625
16 9'13 52
178 10 127
515
224 106
5 065 1 31111
139 316
27 909
285 127
1 517 :s 011:3
592
155 125
5 1'15 5 4427 5 360 1 981 .. 237
11 118 938
577
141 :3 276
911 5 132 2 218
309 2 923
8 361
332
CHANGE, APRIL 1, 1970 TO 1975
1970~------~r----~ (CENSUS) NUMBER PERCENT
18 855
2 529
38 015
1 156 1162 598 112'1
6 762 614
'12
1 11'18 219
2 905 2 701
52 3111
277 160 120 5:36
1 379 1 511
15 252 46
1'12 9 1125
'179
215 118
4 815 1 289
1:3:; 683
26 820
28t! 123
1 459 2 9'H
555
1'18 '115
5 054 'I 991 5 256 2 1'12 'I 059 ,l,l
47 1'12 5115
1'12 3 307
950 5 107 2092
300 2 336
2 123 11.3
'I 0.2
1 870 11.9
135 11.7 2 0.11 5 0.8
37 6.7
63 8.3 1:31 21.3 -27 -61!.3
.33 -2.3 27 12.3
110 3.8 '115 15.4
6 639 5.0
2 50.0 5 786 6.1
1 709 3.3
12 -2 ,
1511 81
187 2 1'12
1
28 1 1'15
12
1121'1
:377 65
7 335
1 '1'13
1 :3
58 79 73
8 1111
79 1488
-261 -319
287
2 201 38
7 -232 -liB :385 1'10
11 799
-107
-8
11.3 -1.2 2.5
28.7 5.9
12.4 14.0 2.2
19.7 12.1 2.5
5.2
7.8 5.0 5.5
0.'1 2.'1' '1.0 2.7
13.2
5.5
1.6 9.8
-5.0 -111.9
7.1
'1.7/ 7.0 ,
11.9 -7.0 -5.1 7.5 6.7 3.7
311.2
1972 19711 (REVISED)
:3 856
" '185
:3 077
" 096 II 187 II 520 2 555 3 123 6 259 2 893 J 7'18
2 796 :3 '129 :3 793 J 101
" 116'1
" 138 II '121
:3 051
2 789 :3 603 J 077 3 620 J 316 1 725 :3 544 :3 027,
3 0!I9 :3 8!l9 2 550
II 861
" '119 If 914 " 8'17
:3 237
3332 :3 329 q '1146 , 763 5 193
" 03'1
3 695 :3 807 'I 1100 :3 955 2 996 3 71!J '! '1911 :3 7'13
II 86'1 .J 888 5 123 II 235 3 693 J 976 :'I 612
J 009
5 156
3 l'I6
:3 916
2 '142
:3 '106 3 051 :3 547 2 015 2 '163 " 981 2 '11111 2 956
2 328 2 716 3 10'1 2 475
:3 752
3 438 :3 733
2 472
2 244 2 899 2 475 J 141 2 682 1 373 2 912 2 ~36
2 28.3 :3 192 1 906
'I 020
:3 650 'I 059 q 056
2 5611
2 615 2 61) 3513 2 921 q 101
J '1119
3 18'1 :3 227 J 695 :3 1159 2 670 3 165 :5 a05 .3 184
" 11'1 :3 225 '151'1 3 665 J 158 J 36) :3 066
2 325
3 9118
PERCENT CHANGE. 1969 TO
1969 1974
2 379
2 899
1 B'lll
2 5911 2311 2 686 1 527 1 868 3 797 2 029 2 2/10
1 820 2 30'1 2 '171 1 997
2 B78
2613 2 859
1 1 872
1 717 2 218 1 119'1 2 353 1 996 1 0'18 2 170 1 8611
1 637 2 65:3 1 531
3 076
2 776 .3 088 J 107
1 925
1 986 1 9811 2 667 2 )'11 :3 131
2 723
2 536 2 562 2 850 2713 2 059 2 '193 3 Oil? 2 520
3 239 2 5'12 3 275 2 645 2 '191 2 6'16 2 566
1 708
2 902
62.1
511.7
66.9
57.9 81.2 68,3 67.:S 67.2 6'1.8 112.6 67.3
53.6 '18.8 53,5 55.3
55.1
58.'1 5'1.6
63.0
62.11 62.'1 62.5 53.8 66,1 M.6 6:3.3 62.'1
86.3 115.1 66.6
58.0
59.1 59.1 56.0
68.2
67.8 67.8 66.7 60.7 65.9
48.1
'15.7 48.6 54.'1 '15.8 '15.5 50.1 117.5 '18.5
50.2 53.0 56.'1 '18.9 'fa.;, 50.2 '10.8
76.2
77.7
)
~ ..
\
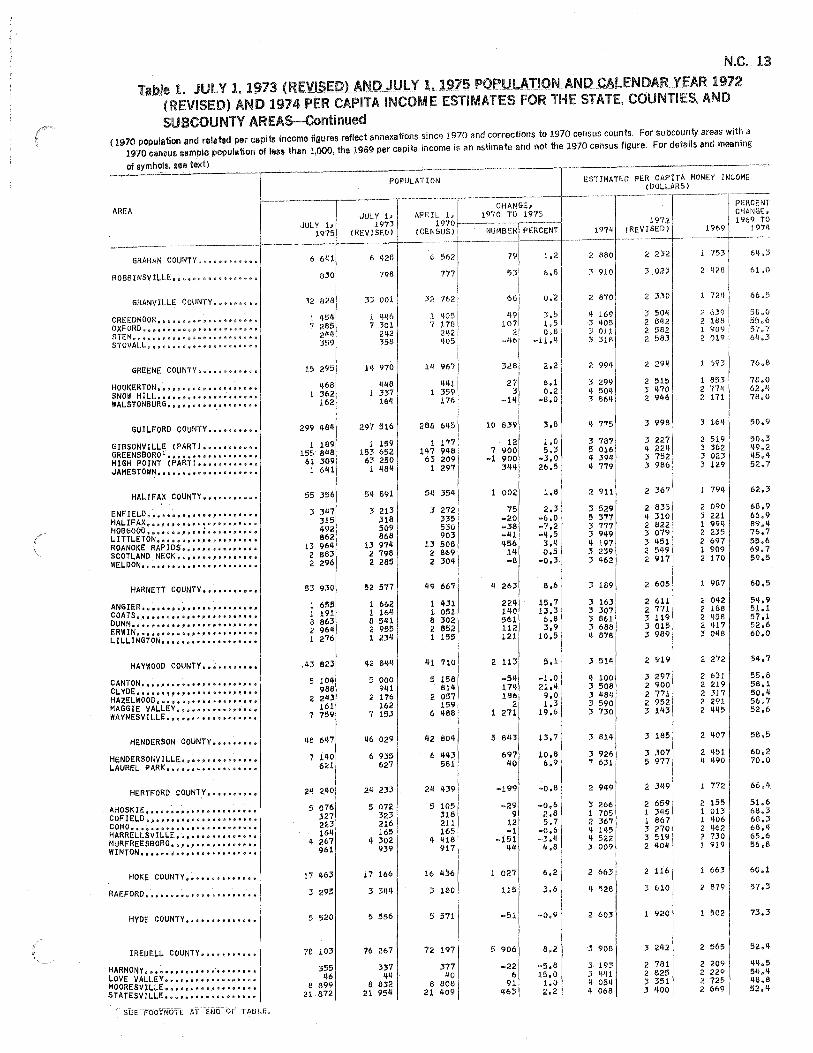
N.C. 13
Table 1. JULY 1, 19Z3JRE~lSED1ANOJUlY 1, 1975 PQPULATIONANOCALENDAR YEAR 1912 (REVISED) AND 1974 PER CAPITA INCOME ESTIMATES FOR THE STATE, COUNTIES, AND
SUBCOUNTY AREAS--Continued (1970 popul~tlon and related per capita income figures reflect annexations since 1970 and corrections to 1970 census counts. For subcounty areas with a
1970 een$US sample population of len than 1,000, the 1969 per capita income is an estimate and not the 1970 census figure. For details and mas,ning
of symbols, see text)
AREA
POPULATION ESTIMATED PER CAPITA MONEY INCOME
,,---..... -----1--------- --.. CHANGE,
1970 TO 1975 APRIL 1, 1970~------._--~
(DOLLARS) ,---.--~.--.-.--
1972
PERCENT CHANGE, 1969 TO
1971+ JULY 1.
1973 (REVISED) (CENSUS) NUMBER PERCENT 197q (REVISED)
________ . ________ -+ ______ --+_. ____ +-----+-------.--.--- _________ 1-------._----+-._--JULY 1,
1975
GRAHAM COUNTy ••••••••••••
GRANVILLE COUNTy •••••••••
CREEDMOOR@e~ijoo0~ObO$9Q~GO$@~ OXFORD;; I> D" 0 ,. 11 to II;; II 1:1 e 1:1 Ii' " II. It II" II It II
STEM" p "'" "(1 If,. 0 ..... Ii & " tI It " " >I It 11 ~ '" II ~ srOVALLpfi'u~c~Ge~o .. "'@8a&Q.~~fI~
GREENE COUNTy ••••••••••••
HOOKERTON.o, •• ofi'l~ee.c ••• o,co SNOW HILL,e .... fle •• oliee' ••• lioe WALSTONBURG.Q.e,e.,.o" •• ~e.oe
GUILFORD COUNTV ••••••••••
GIBSONVILLE (PART) ••••••••••• GREENSBOR01.'.'e~., •• e ••••••• HIGH POINT (PART) •••••••••••• JAMESTOWN. 'II 11 II • II , .. Ii> " .1:111 II II ,. 1/ e e.
HALIFAX COUNTy •••••••••••
ENFIEL.O II II II ~"II II e II o. II "'"''1 (I (I.,. 0
HALIFAXe It,,'" II" fl." co E!""" 1/" /I" '" 1>. HOBGOOD ........... ; ......... . LITTLETON, ..... , II" 0" 'I"'" 1>,,""" ROANOKE RAPIDS ••••••••••••••• SCOT~AND NECK. II ••••••• oo.fle.'
WELDONelle ••• eefi' •• II""'.Go.,~
ANG I ER I II .' I' I' I' • I • 8 II • I 1/ • " , ••••• "
COATS •••• , ~ , fI • " fi II •••• I ... fi ••••
DUNN. fI • II •••• , II', fll •• " II •• ' ••• "
ERWIN ••••••••••••••• ~ ••• ,I •••• LILLINGTON,,,,,,,,, •• ,, •• ,,,,,,.,, fI "'.
HAYWOOD COUNTy •••••••••••
CANTON. "." •••••••••••• ~ •• I'll II' CL.YOE e •••••• " •••• ·" •••••.••• ,. HAZELWOOD •••••••••••• , ••••••• MAGGIE VALLEy •••••••••••••••• WAyNESVILLE ••••• , ••••••••••••
HENDERSON COUNTy •••••••••
HENDERSONVILLE ••••••••••••••• LAUREL PARK ••••••••••••• ,., ••
HERTFORD COUNTy ••••••••••
AHOSKIE, 1.1" •••••••• I •• '" 1.1.
COFIELD •.••• ~ (I. I. ,1.1,1.0 CO". ,. 0"
COMO. o ., '001' II' ••• II ..... "II'''''' HARRELLSVILLE •••••••••••••••• MURFREESBO~O ••• e •••• o' ••••••• WINTON ...................... .
HOKE COUNTy ••••••••••••••
RAEFORD, •• , •• " .. " fI It 1)".0 be, fl""
IREDELL COUNTy •••••••••••
32 828
1 '154 7 285
2l(q 359
15 295
468 1 362
162
299 48'1
1 189 155 8'18
61 309 1 6'11
55 ;356
3 3'17 315 492 862
13 96'1 2 863 2 296
53 930
1 655 1 191 8 863 2 96'1 ), 276
.'13 823
5 10'1 988
2 2'1' 161
7 759
118 6ft7
7 1110 621
24 2'10
5 076 327 223 16'1
q 267 961
J 295
5 520
78 103
355 46
8 899 21 8721
6 428
798
:53 001
1 '146 7 301
2'12 358
297 516
1 159 153 652
63 250 1 '1M
54 891
3 213 318 509 868
13 974 2 798 2 285
52 577
1 662 1 16'1 8 541 2 955 1 234
'12 81.1'1
5 000 9'11
2 176 162
7 153
'16 029
6 935 627
24 233
5072 323 216 165
'I 302 939
5 556
76 26'7
337 ~q
8 832 21 95~
6 562
777
32 762
28f) 6'15
1 177 1'17 9'18
63 209 1 297
5'1 35'1
3272 335 530 903
13 508 <1 869 2 30'1
'19 667
1 '131 1 051 8 302 2 852 1 155
'11 710
5 158 81'1
2 057 159
6 1188
2'1 '139'
5 105 318 211 165
'I '118 917
16 436
3 180
5 571
72 197
377 '10
8 8081 21 1109 I
79
53
66
'19 107
2 -'16
328
27 :3
-1" 10 839
12 7 900
-1 900 3'11.
1 002
75 -20 -38 -'11 '156
1'1 -8
'I 263
22'1 1'10 561 112 121
2 113
-511 1711 186
2 1 271
5 8'13
697 '10
-199
-29 9
12 -1
-151 Ill!
1 027
115
-51
5 906
-22 6
91 1163
l.2
0.2
3.5 1.5 0.8
-11."
6.1 0.2
-8.0
3.8
2.3 -6.0 -7.2 -11.5 3.4 0.5
-0,3
8.6
15.7 13.3 6.8 3.9
10.5
-1.0 21.'1 9.0 1.3
19.6
13.7
10.6 6.9
-0.8
-0.6 2.8 5.7
-0.6 ,·3.'1
'1.8
6.2
3.6
-0.9
8.2
-5.8 15.0
1.0 2.2
2 8BO
::5 910
2 870
'I 1691 3 Q05 :;; 011 3 318
;1. 99,,1 3 2991 " 50'1 :3 86'!
Il 775
;; 787 5 016 'I 39" q 779
2 911
:5 529 5 377 3 777 :3 9"9 'I 197 ;, 239 :3 "62
J 189
3 163 :3 307 :3 861 3 688 'I 878
3 51'!
'I 100 :3 508 3 '!8Lf :3 590 :3 730
381ij
:3 926 7 631
2 9119
3 266 1 705 2 367 " 1115 Ij 522 :3 009
2 663
'l 528
2 603
3 908
:I 193 :5 '141 q 054 4 068
2 232
3 023
2 3ClO
3 50'! 2 B42 2 582 2 583
2 29"
2 515 3 "70 2 9'16
3 998
3 227 q 22" 3 752 :3 986
2 367
2 835 'l 310 2 822 :3 079 J 451 2 5'19 2 917
2 605
2611 2 771 :3 119 3 015 3 989
2 919
3 297 2 900 2 771 2 952 3 1'13
3 185
3 307 5 977
2 3'19
2 659 1 31+5 1 667 ;5 270 :5 519 2 'lOll
2 116
3 010
1 920
3 242
2 781 2 825 J 351 :5 '100
753
1 724
2 639 2 188 1 909 2 019
693
1 853 2 774 2 171
J 164
2 519 ;5 362 3 023 3 129
1 7911
090 3 221 1 99'1 2 235 2 697 1 909 2 170
987
2 0112 2 188 2 q58 21117 3 048
272
2 631 2 219 2 317 2 291 2 11'15
2 407
2 '151 'I '190
772
2 155 1 013 1 '106 2 '162 2 730 1 919
663
2 879
1 502
2 565
2 209 2 229 2 725 2 669
58 11 0 55.6 57,7 64,3
76.8
78.0 62.'1 78,0
50.9
50,3 '19,2 115,'1 52.7
62.3
68.9 66.9 89.'1 76.7 55.6 69.7 59.5
60.5
5'1.9 51.1 57,1 52,6 60,0
S'I.7
55.8 58.1 50,11 56.7 52.6
58,,5
60.2 70.0
66.'1
51.6 66.3 68.;' 68." 65.6 56.8
60.1
7:3.3
'1'1,5 54,'! 118.8 52,'1
14 N.C. labl3-1-.-- JULY 1, ~n(REV-lSED}ANO-JUt.'aLl-,l915--PORULATION AND CALENDAR YEAR 1912
(REVISED) AND 1974 PER CAPITA INCOME ESTIMATES FOR THE STATE, COUNTIES, AND SUBCOUNTY AREAS-Continued
(1970 population and related per capita income figures reflect annexations since 1970 and corrections to 1970 census counts. For subcounty areas with a 1970 census sample population of less than 1,000, the 1969 per capita income is an estimate and not the 1970 census figure. For deblils and meaning
of symbols, see text)
AHEA
JACKSON COUNTy •••••••
DILLSBOROe ••• oeeeo~B •••••
SYLVA*.~j.eso.'Ge$uooo •• e WEBSTER~e •• ~ •• o.e.e ••• e' •• Q'.
JOHNSTON COUNTy ••••••••••
JONES COUNTy •••••••••••••
MAySVILLE •••••••••••••••••••• POLLOCKSVILLE •••• aee •••••••• m
TRENTON ••••••••••••••••••••••
BROADWAy •••••••••••••• , •••••• SANFORD ••••••••••••••••••••••
LENOIR COUNTy ••••••••••••
GRIFTON (PART) ••••••••••••••• KINSTON a .... , ... , ••• , •••• ~ •••• II
LA GRANGE •••• '.mo •••• " ••• ", •• PINK HILL"" •• , ••• "",, •••••••••
LINCOLN COUNTy •••••••••••
HIGH SHOALS (PART) ••••••••••• LINCOLNTON." •••••• , ••••••••••
MCDOWELL COUNTy ••••••••••
MARION •• e ••••• Q, iii S to .... Q ••••••
OLD FORT •• , •• i ••• "~ •••••• II •••
FRANKL! N f • 0 1/ • Gil •• " .... \I S Ii' ..... <I> ..
HIGHLANDS,. II 1)"".1/' I/o" II II '1\"" fI"" <)
MADISON COUNTy •••••••••••
MARTIN COUNTy ••••••••••••
BEARGRASS •••••••••••••••••••• EVERETTS ••••••••••••••••••••• ' HAMILTON".slI.all ••••••••••• , •• HASSELL. II <) ...... " " " " ...... a •• " "
JAMESVILLE. a •• ao" U a" a $ II ..... '
OAK CITV,$e$ •••• ~''' •••••••••• PARMEl.E, •• , .. iii • I\" ., iii' " •• " " • " " • $ •
R08ERSONVILLE"$G •• eD""~'" WILLIAMSTON., •• 'eo.DG ••••••••
MECKLENBURG COUNTy •••••••
POPULATION
JUL Y !. JULY 1. 1973
1975 (REVISED)
832
24 220
231 712 190
65 501
2 418 3 5:39 1 1'10 1 '139
30'1 1 058 1 027 If'lH 7471
33 523
770 11 072
58 562
306 23 972
:3 051 5113
37 339
20 5 287
33 472'
:3 360 702
18 163
2 550 612
16 807
548 1 038 2 058
25 254
103 165 639 165 535 520 366 975 366
373 925
281 417 1 511 2 81:3 1 571
831
23 708
246 696 190
63 507
2 188 3 224 1 037 1 366
283 1 023 1 071 'I 361 7 176
9 790 I 934 , '136 . 496
57 966
300 23 790
2 95'1 536
35 932
19 5 1199
32 220 '
3 3'17 69'1
17 076
2 '19'1 593
16 279
635 018 931
24 756
113 167 593 158 525 516 357
1 929 6 512
369 8~1
281 499 1 1173, 2 886 1 558
APRIL 1. 1970
(CENSUS)
797
21 593
215 1 561
181
61 737
2 267 3 103 1 057 1 370
JOO 983,
1 O'll! I q 356 7 0115
9 779
912 '156 539
55 20'1
312 23 020
2 679 522
32 682
18 5 293
)0 6'18
335 676
15 788
336 583
16 003
653 982 623
2'1 730
99 19B 579 160 533 559 373
1 910 6 570
3511 656
27'1 6'!0 1 296 2 931 1 538
CHANGE, 1970 TO 1975
NUMBER PERCENT
35
2 627
16 151
9
37M
151 '136
83 69
4 75
~17 118 '126
:3 358
-6 952 372
21
4 657
2 -6
82'+
25 26
804
-105 56
'135
52'+
II -33
60 5 2'
_39 -7 65
-20'1
19 269
6 777 215
-118 33
-0.2
10.0
11.0 -5.5
11.1 -0.1 I
0.7 3.8
15.0 i
9.2 5.0
5.0
-16.1 5.7
26.8
4.0 -16.7
10.4 3.1 O.l!
-7.0 -1.9 ~
3.4 -3.1
2.5 16.6 .q.O
2.1
ESTIMATED PER CAPITA MONEY INCOME (DOLLARS)
1972 l.97'1 (REVISED)
If 750
2 89'1
q 056 :3 621 3 457
3 276
3 209 :5 71.f7 J 776 3 098 4 660 '+ 265 :3 '198 2 966 :3 631
2 768
2 731 :3 855 3 972
:5 772
'I 990 3 932
3 636
2 3'+5 3 9011 :3 475 '+ OqS
:3 906
3 9411 :3 8<13
3 '141
'+ 652 '! 160
2 922
:5 922 3 767
2 743
3 73'1 3913 3 105
2 903
3 362 '+ '+35 1 818 2 76'+ 2 964 :3 96'+ 2 85'1 3 162 3 356
5 007
q 926 3 982 :3 917 '+ 290
3 891
2 437
:3 'tOO ;; 0'17 2 879
2 6'+1
2 698 3 016 3 052 2 '+75 3 715 3 28<1 2 751 2 438 3 070
2 272
2 273 3 151 3 247
3 068
4 023 :3 180
2 903
1 9'17 :5 183 2 790 :3 2n
3 338
3 353 3 480
2 837
3 818 :3 386
2 388
:3 212 :5 031
2 169
3011 3 087 " '180
2 28'1
2613 :; J06 1 533 1 986 2 330 2831 2 0'15 2 '199 2 689
'I 200
q 155 3 228 3 191 :; 56'!
PERCENT CHANGE, 1969 TO
1969 197'1
3 273
1 921
2 776 2 'lIS 2 276
9'19
2 023 2 2'10 2 268 1 855 2 755 2 If))
2 030 1 918 2 3'11
6'10
1 712 2 25'1 2 326
2 228
1 553 2 535 2 0'1'1 2 516
2 567
2 588 2 816
2 196
2 908 2 576
8J9
2 'IJ5 2 283
681
2 245 2 419 2 108
1 718
1 981 2 597 1 299 1 '120 1 770, 2 078 1 691 1 992 2 0'17
:3 307
:3 293 2 764 2 500 2 767
50.7
68.1
58.6 67,3 66.5 67.0 69.1 75.3 72.3 5/1.6 55.1
68.8
59.5 71.0 70.8
60.6
60.'1 60./1
63.2
51.0 5'1.0 70.0 60.8
52.2
52.'1 36.5
56.7
60.0 61.5
58,9
61.1 65.0
63.2
66,3 61.8 /17.3
69.0
69.7 70.8 '10.0 9'1.6 67.1 90.8 68.8 58.7 63.9
51.'1
'19.6 '1'1.1 56.7 55.0
(
N.C. 15
Table 1. JULY I, 1913 (REVISED) AND JULY 1, 1975 POPULATION AND CALENDAR YEAR 1912 -----(-REVISED)-AN-DT9i4PERCAPftA INCOME ESTIMATES FOR THE STATE. COUNTIES, AND
SUBCOUNTY AREAS-Continued (1970 population and related per capita income figures reflect annexations since 1970 and corrections to 1970 census counts. For subcoun\y areas with a
1970 census sample population of less than 1,000, the 1969 per capita income is an estimate and not the 1970 census figure. For details and meaning
01 symbols, sell text)
POPULATION
AREA JULY 1. APRIL I.
ESTIMATED PER CAPITA MONEY INCOME (DOLLARS)
PERCENT CHANGE, 1969 TO 1973 1970 I---_-'c---'--=--'--'--r~~~_: ___ ··_I 1972
_______________________________ 4 ____________ + __ ( ~~vl~:~:. ___ ~.::_N_S_l~)_+--------------f----.;::-----f-------:1.-9-. ___ 7:_q'+...<_F<..~~_I.:.~~ JULY 1969 19'74
MATTHEWS,~G~Ge~O$G~QeeG&~eee" MINT Hlt.L, •••• ,,"', ....... ,. PINEVILLE",g ~ <iO <> e ~ e'" ~ .. $ Q!.<" ~ 0 e ~ ..
MITCHELL COUNTy ••••• "".
BAKERSVILI.E ............. ". " SPRUCE PINE~~.~.0~u~~O~~t~~~.
MONTGOMERy COUNTY.,.,., ••
8 I scot::" .. II III "" Ii e II \11 ~ .. " " " ~ t ~ II'" \I .. (I
CANDORII •• ~IIIBDa~9~~~~$gll.lle.~. MOUNT GILEAD ••• , •• , •• ,.", •• , STAR ... II 911" \II' ot .. (I C ,IIISI<> " ". ell U '" 0 .. '
TROY" II \I It" " II "1) II .. II 1) ~ t!I .. II II II" I "" .. ~
ABERDEENc.9.91l&O~gll.pe .. ~G"".~ CAMERON" e"" 11 It " II ,,/I II It" II 11 ,,~to ~ 11,$ (I
CARTHAGE iI ell" II 0 II II ~ II II " II Ii ~ § Q ,," \I "
PINE8LUFF.".II ••• 'e~.oeoQcu~ ••
ROBBINS ...... ,.,. .. ", ... , .. , SOUTHERN PINESOllllllo.o.~~e$".e
VASS"" II \I" II II .. "" .. I II"" a .. e "" O!< " " ~ ~ WHISPERlNG PINES •••• , •• " •• ,'
NASH COUNTY, ••••• ", ••• " I BAILEY6o •• \!I"II •• """O.~IIBII"II .... BATTLEBORO (PART),.,., •• , •• ,. CASTAl.. I A"" fI (j II .. It (I II .. II 0) • III ~ .. II "C II ...
MIDOLESEX .... lle.o$ogll.a.e~." ••
NASHVILLE.o.lloo,le .. t!I.o"o ..... ~8 RED OAKlioo08aCee$O'~G.u,.@.~, ROCKY MOUNT (PART) •••• ,""" SHARPSBURG (PART) •• , •••• , •• ,.
SPRING HOPE •• " ••• , •• , ••• , ••• WHITAKERS (PART) ...... , •• " ••
NEW HANOVER COUNTy •••••• ,
CAROLINA BEACH ••••• ,.".,', •• KURE BEACH,." III " It It Ii " " 0 Ii ~ e ~ II It $ , ~ WILMINGTON ............... , ••• _ WRIGHTSVILLE BEACH,." ••••• ,. I
NORTHAMPTON COUNTy •••• ".
CONWAY •• II'" Ii" (I e II." III •••• e,," \I Ii. GARYSBURG •• eee"" •• ".: ••• eee ••
GASTON ••• tie" 1>" 0 It" ... e tI •• Olt .... " ..
JACKSON ••• oltoe •• , ••••• eae ••••
LASKER ••• eoe ••• oe.lil>.e,e,o.,..
RICH SQUARE" ••• ".,."", •• , SEABOARD •• o.fi •• DD •••• o •••• ~"e SEVERN o ."., Ii" to Ii' Ii" C Ii IF •• q •• ". ~ WOODLAND ................. ,.,. I
ONSLOW COUNTy •••• "",.,.
HOLLY RIDGE ••• ,." •• "", ••• , JACKSONVILLE., •••••• ", •• ,.,. RICHLANDS •• (I II. III" 8 Ii ill' II II' 8"" II" e
SWANSBORO."",.,." ••• ,.,."
ORANGE COUNTy, •••• ".,.,.
CARRBORO •••• , .... , ••••• ,.,., • CHAPEL HILL (PART).,.", •••• , I HILLSBOROUGH."." ••• " ••••• , MEBANE (PART) ••••••••••••••••
PAMLICO COUNTY.,.".,.,.,
ALLIANCE •••• Ii!" •••• iii"."". 11" •• "
ARAPAHOE • • II •• " •• " , II •• " ••• , •••
e'18 3 797 1 85i~
13 937
1l'17 2 550
19 725
2
'12 515
2 039 230 123 671 027 121 ' 981
1 '10 0
1 M t;74
7'+5 329 283 700 071 ~lB
21 553 625
301 'IB9
95 2'1'1
91.6 356
53 818 2 'fll'I
23 1aJ
707 201 067 8'17
68 1 303
61'1 328 706
109 827
470 18 '187
9'15 280
67 32li
5 519 30 51'1
1 570 210
716 J 099 1 847
19 116($
2113 590
1 2"6 963
2 '151
'11 555
9451 226
162 I 6'13
1 030 6 698
986 398
62 /167
769 315 28 1\ 756 778 ~96
20 714 547
331 '188
92 455
979 339
51 710 2 050
22 851
714 216 Oll3 830
98 270 595 353 714
99 357
'137 17 136
882 14'1
6'1 772
5 276 26 860
1 570 205
9 375
567 '165
783 2 262 1 9~8
19
2
39 alia
592 2M 03'1 570 059
5 937 885 362
59 .122
72'1 285 265 729 670 359
19 032 ~1!7
62 996
1 663' 39'1
'16 169 1 701
23 099
694 231 105 762 l1'~ 25'1 611 356 7114
103 126
'115 17 180
935 207
57 567
5 058 26 195
1 '1'1'1 186
t+S8
23 1+6
7 36
107
3 467
41.\7 26 89
101 -32 18/1
96 '16
5 352
1 21 tpi Ie 51
401 59
2 521 178
12 251
84
13 -30 -38
-~~I' 'f9
3 -28 -38
6 701
55 307
10 73
9 757
'161 '! 319
126 211
J,6
8,9
28,1 12.7 8,6
.t7,7 -J,O 19,9 10,8 12.7
2,9 15,,4 6.8 7.0
2t+,O 16. 1,
13.2 '9,8
-2,5 9.'+
,14.8
15,2 -9.1 16,6 '13.7
O.'f
1.9 -13.0
-3,'1 11.2
-40.'1 3.9 0,5
-7.9 -5.1
6.5
13,3 7,6 1,1 6.0
16.9
9.1 16.5 8.7
12.9
-0.2
-0.5 -0.4
q 908 II 552_ :5 892
y 109
I, :;;
4 5 3 J J
II 'I 2 2 ~ 01'1 3 220 It 6[~4
4 935
3 7'13 'I 142
'f 3'17
'I 208 I J 5931 'I 074 5 794 I
2 597
5 151 :> 523 :; 310 4 987 3 340 3 638 3 188 3 501 :; 651
:> 565
2 680 'I 760 'I 130 'I 151
4 5'17
q 103 5 012 'I 270 'I 286
3 160
:I 558 3 280
'I 0'19 3 802 J -252
2 507
2 761+
3 333 'I 1107 2 9'15 3 373 3 367
2923
3 3 :; 3 3' 3 2 '151 6 094
845
} 171 3 '169 2 254 2 234 :5 205 2 558 J 819 ~ 742
3 053 3 290
J 605
:> 536 2 9'19 J J76 4 726
2 006
:; 753 2 726 2 620 3 75~ 2 58!f 3 005 2 1180 2. '194 2 962
I
2. 980
2 380 3 985 J '134 :3 1188_
3 7621 ;I 337 'I 196 3 512 3 5011
2 466
2 761 I 2 '199
2 22.\
2 848 2 233 2 667 2 519 2 464 2 566 2. 001 4 513
2 106
2397 2 580 1 657 1 2 1 2.
857
2 685 , 2 241 2 582 J 7'19
1 '168
2 778 2 0111 1 935 2 608 1 910 2 167 2 018 1 844 2 220
2 1'10
1 791 2 866 2 468 2 494
2 921
2 450 3 309 2 703 2 698
1 882
2 116 2 016
60,;;
51.2 66,7 59,6 67.'. 68,9 60.6 61,5 66,7
68105 69.3 57.'! 61.7 68.7 69,J 58,1 72.7
61,2 69 •. 3
56\)7 60.3 57.8 5'1.5
76,9
85.4 7'1.9 71.1 91.2 7~,9 67.9 58.0 89.9 6~,5
66.6
'19.6 66.1 67.3 66.4
55.7
67.5 51.5 58.0 58.9
67.9
68.0 62.5
16 N.C. T-ablel.-JUlV-l, 1975 (REVISED} AND JUt. Y'l, 1975 POPULATION AND CALENDAR YEAR 19i'2-
(REVISED) AND 1974 PER CAPITA INCOME ESTIMATES FOR THE STATE, COUNTIES, AND SUB COUNTY AREAS--Continued
(1970 population and related per capita income figures reflect annexations since 1970 and corrections to 1970 census counts. For subcounty arelle with a 1970 census sample population of less than 1,000, the 1969 per capita income is an estimate and not the 1970 census figure, For details and meaning
of symbols see text)
AREA
-_. BAYBOROO) Q ~ ....... ",," Q" II •• """ II •• It
MES Ie ..... a III II " .. " • " .. 0 .. p , • b \I e " ~ D "
MINNESOTT BEACH •••••••••••••• ORIENTAL ••••• ,o8o.GoQ.a.o ••• ~ STONEWALL •••••••••••••••••••• VANDEMERE ....................
PASQUOTANK COUNTy ••••••••
ELIZABETH CITy •••••••••••••••
PENDER COUNTy ••••••••••••
A a s T W
TKINSON. II. G ••••• (j \I \I 8 If. If.". o. URGAW. 11 0 00 II •••• III 0.' II. II •• 11 \I \I.
URF CITY.II •• ollo ••••• o •••• oo.
OP SAIL BEACH •••• fea ••••••••
ATHA t II <t ••••• ., •• II" 1/ II II II 1/ ••••• 01
PERQUIMANS COUNTy ••••••••
H W
ERTFORD ••• ~ •••••••• ,.'o.Go •• INFALL ••••••••••••••••••••••
PERSON COUNTy ••••••••••••
R OXBORD ••••••••••• "". til •• "'"''
PITT COUNTy ••••••••••••••
A 8 F F F G G G
yDEN •••••••••••••• o •••••• B ••
ETHEL." •• ". Oil t •• 41 • II /I,. OIl ,0 fit 8
ALKLAND.o.o •• o.ae ••••• fi •• 'O. ARMVILLE e• If! 0' '" Olt"'" II •• 0' e. OUNTAIN •• H ••••••••• , ••••••••
REENVILLE ••••• _ ••••••••••••• RIFTON (PART) •••••••• ,,, ...... RIMESLAND.,6 •••• , ••• " ..... ~.
S '1/
IMPSON, ••• <I '" 11.'11011 ••• ' ••••••
INTERVILLE ••••••••••••••••••
POLK COUNTy ••••••••••••••
OLUMBUS •••• '., •• i ••••••••••• C S TR
ALUDA ••• " •• a •• II ••••••••••• ,q
AR AS FR HI L.! RA RA SE ST
EL HA HO NO RO
YON." II" /II \I. /II" (10 I} /II"" \I g /II '·0
RANDOLPH COUNTy ••••••••• ,
CHDALE'/IID& ••• e.o/ll(lQ.OQ~'Q9. HEBORO/lle".80e8.""B.&"~' ANKLINVILLE •••••••••••••••• GH POINT (PARTl ............ BERTY ••• e&" •• eo •••• q •••••••
MSEUR" \I ... \I .. ~ • (I ., $ C 111" c ~ " a e • S 0 A
NDLEMAN ••• , ••••••• ~&G ••••• e
AGROVE" " " II " • 0 ., • " " ~ 0 ~', •• , (I • 0 ALEY. ~ III II I II ~ • Ii " " ~ fI Ii 0 II ... !it , II .......
RICHMOND COUNTy ••••• , ••••
LERBE ~ 0 e 10) ~ if 0)" fit \I , '" if G Q ... ~ ~ ". if
MLEro)$.§Q~Ge&oe~$e •• o'~o.o). FFMAN" a ,'<l ,. 0" 'II ill ." II ~ 0 II • I ~ II 9 t RMAN III, @ " ., <I " 0 " ,. R .... , ~ • ~ 0) I III e D
CK INGHAM .. & ~ li ij " .. , i< It 0) 6 '" fit , '" " 0) •
ROBESON COUNTy •••••••••••
IRMONT ...... 0 ~'.' 0 .. ~,.,. .. " .. ~ It o. MBER BRIDGE,~e~.~.II"~V,~.,.$
FA I_U LU Me MA OR PA PE
MBERTONq •• ~ ••• a •• '8.~e.aef·. DONALD •••••••• II ••• ~~ •• o.o ••
XTON .... ~ 01.' "''' U II" ". It. I ~ ... II' •• t
RUM •• e •• , •••••• o •••••••••••
RKTON II 01." II _ a II .. II" II ~ ~ 0 0 "' .... IJ II (I
MBROKE II • 8 " II '" .. 9 II e '" .... , • fI It a • $
JULY 11 1975
690 351
33 433 315 381
27 855
14 219
20 536
292 1 953
201 115 16q
8 1190
2 010 658
26 934
8 410
78 056
3 510 1 '167
115 II 1127
41!9 J1 723
2 0'11 399
'+06 1 718
12 681
820 575
2 005
82 555
5 8'12 16 262
8'15 21
2 269 1 '396 2 Jill!
3411 232
41 0013
939 'I '138
'111 113
6 316
93 052
2 878 1'10
17 795 82
2 021 163 6Stj
2 121!
POPULATION
--CHANGE;
JULY 11 APRIL 11 1970 TO 1975 1973 1970 1----
PERCENT (REVISED) (CENSUS) NUMBER ----- -----
713 665 25 3.8 361 369 "18 "4.9
45 41 ~8 -19.5 431 445 ~12 -2.7 315 335 -20 "6.0 373 379 2 0.5
27 409 26 824 1 031 3.ll
13 878 1'; 381 -162 -1.1
19 339 18 149 2 387 13.2
314 325 -33 -10.2 1 853 1 744 209 12.0
203 166 35 21.1 113 106 7 6.5 170 181 -17 -9.4
8 503 8 351 139 1.7
2 010 2 023 -13 -0.6 661 581 77 13.3
27 0'14 25 9111 1 020 3.9
8 2'17 6 909 1 501 21.7
75 380 73 900 'I 156 5.6
:3 '1119 :; 1150 60 1.7 1 '187 1 5111 -117 -3.1
119 130 -15 -11.5 II 1105 4 '124 3 0.1
450 434 15 3.5 29 709 29 063 2 660 9.2
2 077 2 080 _39 "1.9 397 394 5 1.3
399 383 23 6.0 1 563 1 '+37 281 19.6
12 435 11 735 9'+6 8.1
79'1 731 89 12.2 532 5'16 29 5.3
2 009 1 951 5'1 2.8
81 107 76 358 6 197 8.1
5 938 q !l7'! 968 19.9 15 610 15 351 911 5.9
833 79'+ 51 6.'1 19 20 1 5.0
2 269 2 167 102 '1.7 1 409 1 328 68 5.1 2 367 2 :H2 32 1.'1
346 35'1 -10 -2.8 2'17 239 -7 -2.9
40 396 39 889 1 119 2.8
902 913 26 2.8 'I 550 Ij 627 -189 "4.1
423 434 -23 -5.3 142 157 _1111 -28.0
6 121 6 255 61 1.0
89 521 84 8112 8 210 9,7
2 779 2 827 51 1.8 126 117 23 .19.7
17 58'1 16 961 83'1 '1.9 83 80 2 2.5
1 917 1 685 136 7.2 166 I 162. 1 0.6 615
I 550 I 10'1 18.9
2 166 1 982 1'12 7.2
I I
'- .
ESTIMATED PER CAPITA MONEY INCOME (DOLLARS)
PERCENT CHANGE I
1972 1969 TO 1974 (REVISED) 1969 1974
3 771 2 943 2 244 68.0 2 505 1 938 1 479 69.4 6 131 4 743 :5 620 69.4 :3 774 3 114 2 165 74.3 4 305 J 331 2 542 69.4 5 265 3 741 :3 119 68.8
:3 524 2 790 2 129 65.5
3 556 I 2 940 2311 53.9
2 923 2 34'1 1 713 70.6
:3 963 3 221 2 288 73.2 4 576 :3 656 2 715 68.5 4 141 3 186 2 460 68.3 J 226 2 565 1 895 70.2 2 638 2 162 1 597 65.2
2 914 2 229 1 6311 78.3
/I 125 :; 'W~ 2 1130 69.8 2 887 2 216. 1 661 73.8
J 262 2 747 2 121 53.8
'I 130 ;5 5114 2 782 118.5
3 565 2 794 2 103 69.5
J 547 2 755 2 157 611.11 II 011 2 991 2 216 81.0 7 239 5 623 3 861 87.5 ~ 302 3 329 2 632 63.11 3 936 3 0511 2 296 ?l.1l 3 879 :3 097 2 352 611.9 3 361! 2 760 2 105 59.8 4 090 3 174 2 389 ?l.2
3 641 2 825 2 121j 71.4 4 357 3 349 2 511 73.5
3 678 3 061! 2 336 57.4
I! 600 3 858 2 954 55.7 4 20'S :3 568 2 70S 55.'+ q 228 3 680 2 781 52.0
, q 027 3 381 2 717 48.2
If 231 J 568 ;I 0'12 39.1 'I 605 3 880 ;I 129 117.2 3 599 2 975 2 371 51.8 3 782 3 1'12 2 516 50.3 'I 72lj 3 9'+2 :5 071 53.8 ;I 927 3 212 2 593 51.4 :5 72'1 J 113 2 '189 49.6 3 91'1 3 282 2 718 44.0 3 799 :; 156 2 527 50.3
3 191 2 668 2 171 47.0
2 732 2 278 1 825 49.7 'I 071 3 454 2 172 46,9 2 701 2 235 1 816 48.7 3 337 2 731 2 218 50.5 4 2'+7 ' 3 563 2 910 45,9'
2 705 2 179 1 630 66.0
:5 538 2 752 2 0'18 72.8 ~ 182 3 340 2 50'1 67.0 3 676 3 o'la 2 315 58.8 3 622 2 693 2 169 67.0 3 788 3 037 2 271 66.8 2 91!5 2 352 1 763 67.0 'I 191 3 6'12 2 62,. 59.7 2 786 2 265 1 710 62.9
''''. 'il
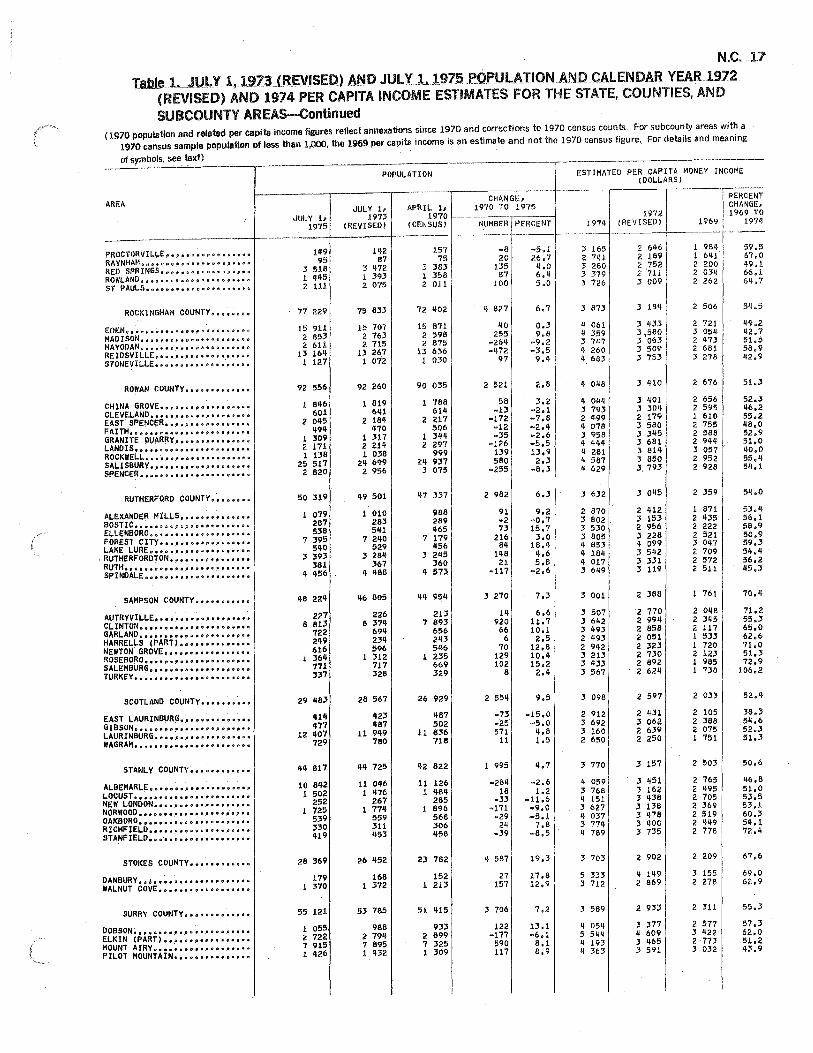
N.C .. 17
table_l~_JUlY_l.J9Z3(RE~[SEDLANPJUl Yl,1915POPUlAIIONAND . CAL EN DAR YEAR 1972 (REVISED) AND 1974 PER CAPITA INCOME ESTIMATES FOR THE STATE, COUNTIES, AND
SUBCOUNTY AREA5-Continued (1970 population and related per capita income figures reflect annexations since 1970 and corrections to 1970 census counts. For subcounty areas with a
1970 census sample population of less than 1,000, the 1969 per capita income is an estimate and not the 1970 census figure. For details and meaning
of symbols, see text)
AREA
POPULATION ESTIMATED PER CAPITA MONEY INCOME (DOLLARS)
CHANGE. 1 PERCENT JUl.Y I. APRIL 1. 1970 TO 1975 CHANGE,
JULY I, 1973 19701-------.----1 1972 ' 1969 TO ____________ ~~-------1-9-7-5+--(-R-E-V-rs-E-.D-)~-(-C-E-N:~ __ .N.U .. M_B_E_R.I_P_E_R_CE_N_T-+ ___ l_97 .. 4.i __ (R_E_V_I_S_",_D_)+-_._.1.9_6_9i---1974
PROCTORVILLE.e.e •• po~ •••• o •• e RAyNHAM,." •• 9 ~ .• " (0 e." Iii" /II It. 900"
REO SPRINGS •••••••• D •••••••••
ROWLAND ••••••• e •••• mo o •••••••
5T PAULS ue •• lto ••• II !.I. '11'0" 8f1 """
ROCKINGHAM COUNTy ••••••••
EDEN., •• .., It 1# 8 11".0" 11" ...... It&-. '" """."
MADISON. II fJ.,." &.0 e 00 ~"o;>. $I" iii o.
MAVODAN. III " II •• 0 .0 • II III •• " II • ell • ., ., 9
REIDSVILLE" II II' 0.0.""". II 0'''''.01111 STONEVILLEolI(lso."(I •••• o; ••• olll
ROWAN cOUNTy •••••••••••••
CHINA GROVE ••• ~ •• oo.~ ••••••• o CLEVEL.ANDi1 ....... p ••• ~ •••••••• EAST SPENC~R ............. o.II ••
FAITH ••••••••••••••••••• , •••• GRANITE ~UAR~Y ... ~ ••••• e~ •••••
LANDIS ••••••••••••••••••••••• ROCKWEL.L. ••••• e .• ". "'" ••••• "" •• " SALISBURy •••••••••••••••••••• SPENCER ••••••••••••••••••••••
RUTHERFORD COUNTy ••••••••
ALEXANDE~ MILL~.~ ••••••••••• _ BOSTIC=;=;==#=~~~=OI=.o#~ee;e ELLENBORO •••••••••••••••••••• FOREST CITY. _ •.•• " ••• -'. -'. -' ..... LAKE LURE •••••••••••••••••••• RUTHERFO~OTON.~ •••••••••••••• RUTH ••• iI •• ~ ................... . SPINDALE •••••••••••••••••••••
SAMPSON COUNTy •••••••••••
AUTRyVILLE ••••••••••••••••••• CL.INTON ......................... \I GARLAND •••••••••••••••••••••• HARRELLS (PART,) ................. . NEWTON GROVE ••••••••••••••••• ROSEBO~O •••••• ~ •••••••••••••• SAlEHBURG ••• p.~ .......... o ••••
TURKEy •••••••••••••••••••••••
SCOTLAND COUNTy ••••••••••
EAST L.AURINBURG ............ .. GIBSON •••••••• , •••••••••••••• L.AURINBU~G .••••.••.••••.••••.••••• WAGRAM •••••••••••••••••••••••
STANLY COUNTy ••••••••••••
ALBEMARLE ••• _ •. _ •••••••••.••••• LOCUST~ ••••••• " ••• ~." •••••••• NEW LONDON ••••••••••••••••••• NORWOOD ••••• III 8 ..... III •.••• "., ••••
OAK80RO •• '11* III ••••• " ..... • •• " ••
RICHFIEL.D •••• ............. # ••••
STANFIELD •• .....................
STOKES COUNTy ••••••••••••
DANBURY. jt'"'' II ... ".""" .......... " WALNUT COVE •••• ~ •••••••••••••
SURRY COUNTy •••••••••••••
008S0N~ •••••••••••••••••••••• EL.KIN (PART) ••.•••• " ••••• " •••• MOUNT AIRy ••••••• "" ..... " •••••• PILOT MOUNTAIN •••••••••••••••
1119 95
3 518 1 11'15 2 111
77 229
15 911 2 853 2 611
13 16'1 1 127
92 556
1 8116 601
2 0'15 '19'1
1 309 2 171 1 138
25 517 2 820
50 :119
1 079 287 538
7 395 5'10
3 393 381
" '156
48 22'1
227 8 813
722 2119 616
1 3611 771 3:17
29 1183
'11'1 1177
12 1107 729
'14 817
10 8112 1 502
252 1 725
539 JJO '119
28 :169
179 1 370
55 121
1 055. 2 722 7 915 1 426
1112 87
3'172 1 393 2 075
15 833
15 707 2 763 2 715
13 267 1 072
92 260
1 819 6'H
2 18'1 '170
1 317 2 21/1 1 038
2/1 699 2 956
119 501
1 010 283 5Q1
7 2'10 529
328'1 367
II /188
'16 805
226 8 374
69/1 23'1 596
1 312 717 328
28 567
'123 Q87
11 9'19 780
'III 725
11 0'16 1 '176
267 1 77/1
559 311 '153
26 Q52
168 1 372
5' 785
988 2 79'1 7 895 1 '132
157 -8 -5.1 :3 165 2 6'16 1 984 59.5 75 20 26.7 2 741 2 169 1 641 67.0
3 383 135 4.0 3 280 2 752 2 200 49.1 1 358 87 6.'1 3 379 2 '711 2 03Q 66.1 2 011 100 5.0 3 726 :5 009 2 262 M.7
72 1102
15 871 2 598 2 875
13 636 ! 030.
90 035
1 788 6111
2 217 506
1 ''''I 2 297 999
2/j 937 :J 075
117 337
988 289 '165
7 179 '156
3 2115 360
" 573
'Ill 95'1
213 7 893
656 2'13 5'16
1 2'5 669 329
26 929
'187 502
11 836 718
/j2 822
11 126 1 /j8'l
285 1 696
568 306 1156
23 782
152 1 21:3
51 1115
9" 2 899 7 325 1 :S09
'I 827
110 255
~26'1 -1172
97
2 521
58 -13
-172 -12 -35
-126 139 560
-255
2 982
91 -2 73
216 8/1
H8 21
-117
:3 270
1'1 920
66 6
70 129 102
8
2 5511
-73 -25 571
11
1 995
-28'1 18
-33 -171
-29 2/j
-39
II 587
27 157
3 706
122 -177
590 117
6.7
0.3 9.8
··9.2 -3,5
9.'1
3.2 -2.1 -7.8 -2.11 -2.6 -5.5 13.9 2.3
-8.3
6.3
9.2 -0,7 15.7 3.0
18.11 11.6 5.8
-2.6
6.6 11.7 10.1
2.5 12.6 10.11 15.2
2./1
9.5
-15.0 -5.0
'1.6 1.5
-2.6 1.2
-11.6 -9.0 -5.1
7.8 -6.5
19.3
17.6 12.9
13.1 -6.1
8.1 8.9
3 873
II 061 II 359 .3 747 II 260 ". 683
'I 04e
II 0114 J 793 2 '199 II 078 :3 958 'I 411'1 II 281 " 587 II 629
:3 632
2 870 3 802 . 3 530 3 805 " 853 II 18'1 4 017 3 6119
:3 001
:5 507 3 6112 .3 1193 2 '193 2 9'l2 3213 3 4JJ J 567
3 098
2 912 :3 692 J 160 2 650
3 770
'I 059 3 768 'I 151 ;3 627 'I 037 ;3 77'1 'I 789
;3 703
5 333 3 712
J 589
'I 0511 5 5'1'1 'I 193 II 363
3 16'1
J '+'3 3,580 3 063 J 509 :3 753
:3 410
3 '101 ' J 30'1 2 179 3 580 J 345 3 681 3 8111 .3 850 3. 793
:5 0'15
2 412 :3 153 2 956 :3 228 'I 099 J 5'12 :3 331 :3 119
2 388
2 770 2 99<1 2 856 2 051 2 )23 ? 730 2 692 2 624
2 597
2 '131 ;3 062 2 639 2 250
3 157
3 '151 3 162 3 '1:58 :3 136 3 '178 3 '100 :3 735
2 902
'I 1'19 2 869
2 933
:3 377 'I 609 3 '165 :5 591
2 506
2 721 :3 05'1 2 '173 2 681 :3 278
2 676
2 656 2 595 1 610 2 755 2 588 2 9'1'1 :3 057 2 952 2 928
2 359
1 671 2 '135 2 222 2 521 ;3 0'17 2 709 2 572 2 511
1 761
2 0'18 2 3'15 2 117 1 533 1 720 2 123 1 965 1 730
2 033
2 105 2 386 2 075 1 751
2 503
2 765 2 '195 2 705 2 369 2 519 2 '1'19 2 776
2 209
3 155 2 278
2 311
2 577 3 422 2 773 :3 032
5'1.5
119.2 '12.7 51.5 58.9 '12.9
51.3
52.3 ~6.2 55.2 ~8.0 52.9 51.0 40.0 55.'1 58.1
5/1.0
53.'1 56.1 58.9 50.9 59.3 511.4 56.2 45.;!
70.'1
71.2 55.3 65.0 62.6 71.0 51.' 72.9
106.2
38.' 5'1.6 52.' 51.3
50.6
'16.8 51.0 53.5 53.1 60.3 5'1.1 72./1
67.6
69.0 62.9
55.3
57.3 62.0 51.2 43.9
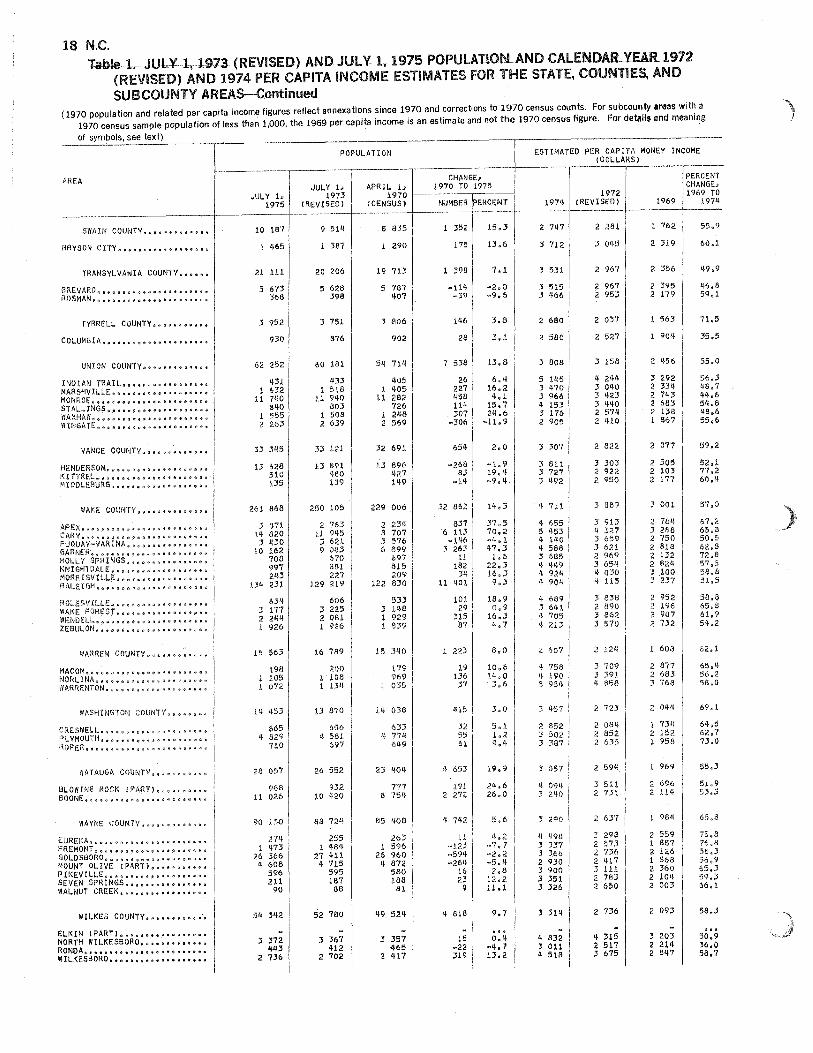
18 N.C. Table LJUL¥1.~19i'3 (REVISED) AND JULY 1, 1915 POPULATIONAND_CAlENDARYEAR.l912
(REVISED) AND 1974 PER CAPITA INCOME ESTIMATES FOR THE STATE, COUNTIES, AND SUBCOUNTY AREAS--Continued
(1970 population and related per capita income figures reflect annexations since 1970 and corrections to lQ70 census counts. For subcounty areas with a 1970 census sample population of less than 1,000, the 1969 per capita income is an estimate and not the 1970 census figure. For details and meaning
of symbols, see text) ~
AREA
SWAIN COUNTy •••••••••••••
BRYSON CITy ••••••••••••••••••
TRANSYLVANIA COUNTy ••••••
TYRRELL COUNTy •••••••••••
COLUMBIA.,. 01160 II d (I" to"" 1I~<t""" II" II"
UNION cOuNTy •••••••••••••
INOIAN TRAILom~"'''"&~6~''''''"o" MARSHVILLE~~" •• "dll".""."""O&. MONROEo ••• (i~""~"O •• &O~II".06"0 STALLINGS"."A&OGO""OIl""'''"IIG''O WAXHAW" (! II II" " " " It" " II" II " " " e * 10 8 10 ~ WINGATE."e~~,,,ooeot908olOoo.lO.
APEX II ~ <J e- Q 0 Ii! e ~ " " Of ~ " fI ~ ~ " e " $ fJ f) 0} 10
CAR Y II ~ 0 <I! 0 ~ II " ~ @ " e !O o!! (\ 0 Q II 011 " " f) '" .. Q FUQUAY-VARXNA3QQ08a5~.0oP0~CQ GARNER.~ooll""'o}<I"~Q"$"Q"QOQ""!lQ HOLLY SPRINGS~~~ij9$O'09Q'QQOQ KNIGHTDALE."""." •• ,."., • MORRISVILLEQfJQ$QQ~~oe-oe-Q.QaQk RALEIGH~o0Q.QQ6~~'9~@0Qe-QQ~$1O
ROLESVILLE~5"a8a&OQoa.oOIi!C$Q. WAKE ~ORESTQQ"C08Q~OQIO.8.~"O" WENDELlQ~Qf)~8Q.ruQeQ~"e~~G~Go~ ZEBULON ~ ~ ~ !t '" j}" 0 .. ~ l) I' G j)" Q >& " ~ \l # l)
WASHINGTON COUNTy •••••• ,.
IATAUGA COUNTy •••••••••••
BLOWING ROCK (PART)."", •••• BOONE ~ ~ ~ Ii! <II ~ Ii! olI " ~ II II 1/ ~ II 0 <l e e 0 It \9 .. l!
lAYNE COUNTy •••••••••• , ••
ELKIN (PART) ••••••••••••••••• NORTH WILKESBORO ••••••••••••• RONDA, "c. 0 It ., II OJ" .. ill B .". 0 I> ., • , • II .,.
WILKESBORO •••• t ..... weoo •••• oB
JULY 1, 1975
10 187
~65
21 111
5 673 368
952
930
62 252
431 1 632
11 7/tO SIJO 555 263
13 m I
261 868
J 071 H 820
3 430
10 162 '1 708 997 2'13
13'+ 231
o3!! 3 1'77 2 21J4 .1 926
16 563 1
.198 105 072
14 453
665 4 829
110
28 057
968 11 026
90 150
27'1 1 473
26 366 q 608
596 211
90
3 372 '1'13
2 736
POPULATION ESTIMATED PER CAPITA MONEY INCOME
JULY I. 1973
(REVISED)
CHANGE. APRIl.. 1. 19'70 TO 1975
(CEN~~~~ NUMBER PERCENT 197'! (REVI~~6~ 1969
--.----,.-----------+--.--.---(-00"''1''
9 51'! 8 835 352 15.3 2 747 2 281 I 1 762
387
20 206
5 628 398
3 751
876
60 181
q33 1 518
11 940 803
1 508 2. 639
33 121
13 891 480 139
2!,O 105
:2 763 I
11 9'f5 3 621 9 083
670 881 227
129 219
606 3 225 2 OB.\ 1 926
16 789
200 108 13'1
13 870
656 '! 581
697
26 552
932 10 ~20
88 72'1
255 1 '18
'!
27 411 4 715
595 187
86
52 780
3 367 U2
2 702
290
19 713
5 787 '107
806
902
5/1 71'!
405 1 '105
11 282 726 2/18 569
32 691
13 896 q27 149
229 006
2 23~ a 707 :5 576 6 899
697 815 209
122 830
533 .3 l'1a 1 929 1 1139
15 :HO
179 969 035
14 038
85 408
263 1 596
26 960 q 872
580 186
81
49 524
:3 357 '165
2 '117
175
28
1 7 538
26 227 458 11'1 307
~306
:'2 862
831
" 11~ ~11!6
:3 263 11
182 34
11 '101
101 29
315 87
1 223
19 136
37
415
321 55 I 61
'I 653
191 2 272
'l 7~21 II
~1.23 ! -59'1 -264
16 23
9
q 818
15 -22 319
7.1
13.8
6.'1 16.2 4.1
15.7 2'1.6
-11.9
37115 70.;2 -'j,l 47,3 1,6
22.3 16.3 9,3
18.9 0.9
16.3 '1,7
8,0
10,6 1'1.0 3.6
3.0
19.9
2'1.6 26.0
5.6
4.2 -7.7 -2.2 -5.'1 2.8
12.2 11.1
9.7
. .. 0.'1
-11.7 13.2
3 712
531
3 515 3 '.66
2 680
2 580
3 608
5 145 :3 470 3 966 ~ l.53 3 176 2 905
3 307
3 811 3 727 J'+92
'I 711
~ 655 5 453 'I 1'10 'I 588 i 3 685 'I '1'.9 'I 92'1 'I 90'1
'I 689 3 641 'I 705 4213
2 607
'I 758 'f 190 5 954
3 457
2. 852 ::; 502 3 387
:3 057
I) 09'; 3 240
J 290
'I '198 ::; 337 :3 366 2 9~O 3 900 :3 351 3 326
3 31'1
'I 832 3011 'I 516
3 0'+5
2 967
2 967 2 953
2 0,37
2 527
3 153
'I 2'1'1 J 0'10 3 423 ) 440 2 57/1 2 '110
2 822
3 303 2 922 2. 950
3 838 2 890 3 862 3 5'70
2 12'1
3 J 'I
2 723
2 08~ 2 852 2 635
3 2
2 6:57
3 298 2 573 2 736 2 ~17 3 111 2 783 2 650
2 736
q 315 2. 517 3 675
2 319
356
2. 395 2 179
563
904
2 '156
3 292 2 33/1 2. 743 2. 683 2 138 1 867
2 077
2 505 2. 10:; 2 177
3 001
2 7S4 J 286 2. 750 2 818 2 132 2 8211 3 100 :; 237
2 952 2 196 2 907 2 732
608
2 877 2 683 J 768
2 O't4
1 73'1 2. 152 1 958
1 969
2 696 2 114
984
2 559 1 887 2 126 1 868 2 360 2 10'1 2 003
2. 093
3 203 2 214 2 8'17
PERCENT CHANGE. 1969 TO
1974 +----
55.9
60.1
'16.8 59,1
71.5
35,5
55.0
56.3 48.7 '1'1,6 5'1,8 48.6 55.6
57.0
67.2 65,8 50.5 62.8 726 8 57.5 58.8 51,5
55.3
65,8
58.~
... 50.9 36.0 58.7
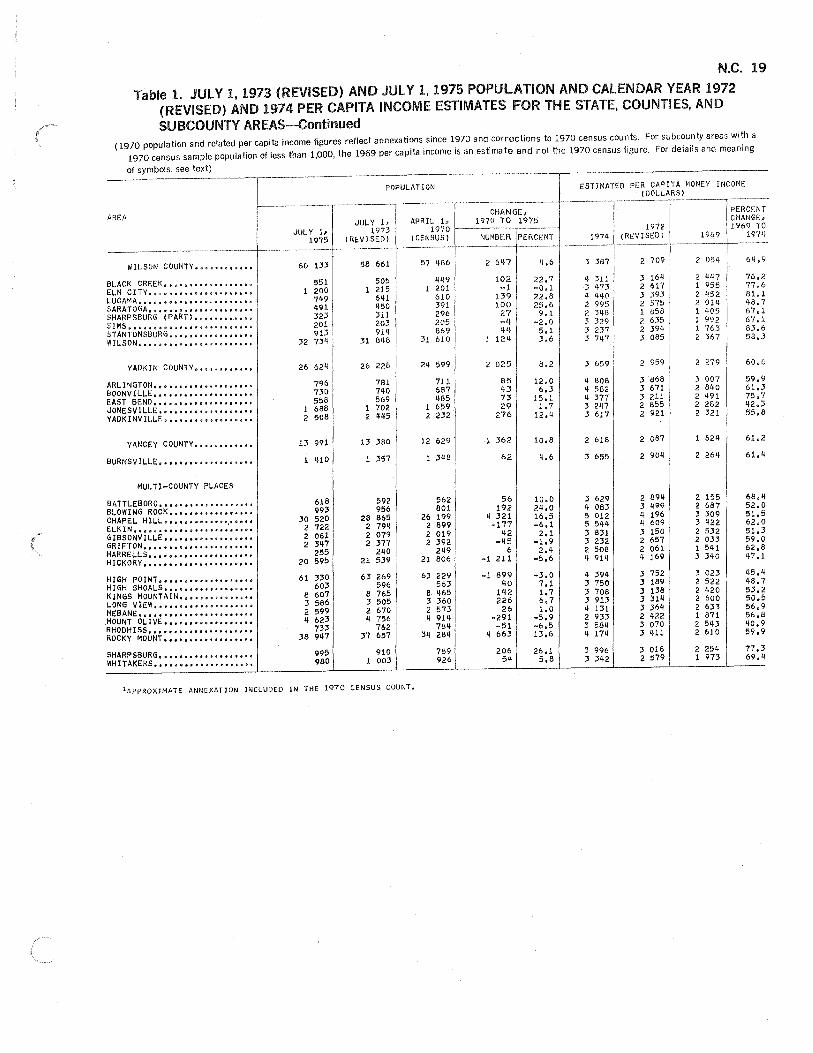
N.C. 19
Table 1. JULY 1,1973 (REVISED) AND JULY 1, 1975 POPULATION AND CALENDAR YEAR 1972 (REVISED) AND 1974 PER CAPITA INCOME ESTIMATES FOR THE STATE, COUNTIES, AND SUBCOUNTY AREAS-Continued
(1970 population and related per capita income figures reflect annexations since 1970 and corrections to 1970 census counts. For subcounty areas with a 1970 census sample population of less than 1,000, the 1969 per capita income is an estimate and not the 1970 census figure. For details and meaning
of symbols, see text)
POPULATION PER CAPITA MONEY INCOME (DOLLARS)
f.-.-...--. AREA
i9~O 1970 Toi\175 PERCENT
JULY 1, CHANGE,
JULY 1> 1973 1972 196i9~~ 1975 (REVISED) ( NUMBER PERCENT 1974 (REVISED) 1969
. __ ._- ---------1--. -- ---_._--
WILSON COUNTy •••••••••••• 60 133 58 661 57 466 2 647 4.6 3 387 2 709 2 054
BLACK CREEK •••••••••••••••••• 551 505 Lf'l9 102 22.7 If 311 3 164 2 'I'I? 76.2
ELM CITY .. " It .. 0" ~ /I ~ 0 II It D" ... ~ .. ft" ~ 1 200 1 215 1 20l -1 -0.1 3 '173 2 617 1 955 77.6
LUCAMA ....................... 7'+9 641 610 139 22.8 4 440 :3 393 2 452 81.1
SARATOGAG~.~aoa ••• n'o •• e.$o.9 491 450 391 100 25.6 2 995 2 575 2 014 48.7
SHARPSBURG (PARTl ............ 323 311 296 27 9.1 2 348 1 858 1 405 67.1
SIMS. (tli.' •• G";o-ji,, ."I1" ..... III<I.U. 201 203 205 -4 -2.0 3 329 2 635 1 992 67.1
STANTONSBURG ••••••••••••••••• 913 91'1 869 '1'1 5.1 3 237 2 394 1 763 83.6
WILSON ....................... 32 734 31 648 31 610 1 124 3.6 3 7Wr :3 085 2 367 58 •. 3
YADKIN COUNTy •••••••••••• 26 624 26 228 24 599 2 025 8.2 :3 659 2 959 2 279 60.6
ARLINGTON ••••••••• e.i ... Go •• O$ 796 781 711 85 12.0 4 808 3 868 3 007
I 59.9
BOONVILLE .................... 730 740 687 '13 6.3 lj 582 3 671 2 840 61 • .3
EAST BEND •••••••••••••••••••• 558 569 485 7.3 15.1 'I 377 3 211 2 491 75.7
JONESVILLE •• o •• e~.'."." •• a. 1 688 1 702 1 659 29 1.7 .3 247 2 855 2 282 42.3
yADKINVILLE .................. 2 508 2 445 2232 276 12.4 .3 617
1
2 921 2 321 55.8
YANCEY COUNTy •••••••••••• 13 991 13 380 12 629 1 362 10.8 2 618 2 087 I 1 6211 61.2
BURNSVILLE •••••••••••••••••• , 1 410 1 357 1 348 62 4.6 3 655 2 90'1 2 264 61.'1
MULTI-COUNTY PLACES I
BATTLEBORO •••••••••••••••••• , 618 592 562 56 10.0 .3 629 2 894 2 155 68.4
BLOWING ROCK ••••••••••••••••• 993 956 801 192 24.0 'I 083 .3 '199 2 687 52.0
CHAPEL HILL •••••••••••• ',_" II" 30 520 28 865 26 199 4 321 16.5 5 012 'I 196 .3 309 51.5
EL.KIN •••••••••••••••••••••••• 2 722 2 794 2 899 ~177 -6.1 5 5lf4 'I 609 .3 422 62.0
GIBSONVILLE •••••••••••••••••• 2 061 2 079 2 019 42 2.1 3 831 3 150 2 532 51.3
GRIFTON. II" II ••••••••••••• • ••• 2 347 2 377 2 392 -'15 -1.9 3 232 2 657 2 033 59.0
HARRELLS,. (I •••••••••••••• , • , • '" 255 240 249 6 2.4 2 508 2 061 1 541 62.8
HICKORy ••••••••• (I •••• (I ••••••• 20 595 21 539 21 806 -1 211 -5.6 '1914 q 169 3 340 47.1
HIGH POINT ................... 61 330 63 269 63 229 -1 899 -3.0 4 394 3 752 3 023 45.4
HIGH SHOALS •••••••••••••••••• 603 596 563 '10 7.1 :3 750 3 189 2 522 48.7
KINGS MOUNTAIN ••••••••••••••• 8 607 8 765 8 465 1'12 1.7 3 708 3 138 2 420 53.2
L.ONG VIEW ••• (I, (I •••••• (I ••••• ,I. 3 586 3 505 3 360 226 6.7 3913 :3 31'1 2 600 50.5
MEBANE •.•••••••••••••••••••••• 2 599 2 670 2 573 26 1.0 4 131 :3 36'1 2 633 56.9
MOUNT OLiVE •••••••••••••••••• 4 623 'I 756 'I 914 -291 -5.9 2 933 2 '122 1 871 56.8
RHODHISS, ••••••• I'" \I" II •••• II 733 762 78'1 -51 -6.5 3 584 :3 070 2 5'13 '10.9
ROCKY MOUNT •••••••••••••••••• 38 947 37 657 34 284 'I 663 13.6 4 174 :3 'Ill 2 610 59.9
SHARPSBURG ••••••••••• , ••••••• 995 910 789 206 26.1 3 996 3 018 2 254 77,3
WHITAKERS ••••••••••••• , •••••• 980 1 003 926 5'1 5.8 3 3'12 2 579 1 973 69.4
'APPROXIMATE ANNEXATION INCLUDED IN THE 1970 CENSUS COUNT.
Superintendent of Documents U.S. Government Printing Office Washington, D.C. 20402
Official Business
.. Postage and Fees Paid . U.S. Department
of Commerce
first Class Mail
COM·202
1975 Population and Per Capita Income Estimates, and Revised 1973 Estimates for Counties, Incorporated Places, and Selected Minor Civil Divisions
No. 649 No. 650 No. 651 No. 652 No. 653 No. 654 No. 655 No. 656 No. 657 No. 658 No. 659 No. 660 No. 661 No. 662 No. 663 No. 664 No. 665 No. 666 No. 667 No.66B No. 669 No: 670 No. 671 No. 672 No. 673
(Reports may not be published in numerical order)
Alabama Alaska Arizona Arkansas California Colorado Connecticut Delaware Florida Georgia Hawaii Idaho Illinois Indiana Iowa Kansas Kentucky Louisiana Maine Maryland Massachusetts Michigan Minnesota Mississippi Missouri
No. 674 No. 675 No. 676 No. 677 No. 678 No. 679 No. 680 No. 681 No. 682 No. 683 No. 684 No. 685 No. 686 No. 687 No. 688 No. 689 No. 690 No. 691 No. 692 No. 693 No. 694 No. 695 No. 696 No. 697 No. 698 No. 699
Montana Nebraska Nevada New Hampshire New Jersey New Mexico New York North Carolina North Dakota Ohio Oklahoma Oregon Pennsylvania Rhode Island South Carolina South Dakota Tennessee Texas Utah Vermont Virginia Washington West Virginia Wisconsin Wyoming U.S. Summary and
Detailed Methodology
U.S. MAil