Embed Size (px)
Citation preview

Current status of the fish community and
quality of fishing at Lake Webster, Indiana
Jed Pearson, fisheries biologist
Fisheries Section Indiana Department of Natural Resources
Division of Fish and Wildlife I.G.C.-South, Room W273 402 W. Washington Street Indianapolis, IN 46204
2005

2
EXECUTIVE SUMMARY
To address a variety of needs and issues, the Indiana Division of Fish and
Wildlife conducted a study at 774-acre Lake Webster during 2005. The purpose was to
estimate density and size structure of the muskie and bass populations, examine fishing
activity and the quality of fishing, assess possible impacts of muskie stockings and weed
control efforts on the fish community, and determine whether changes in fish or lake
management strategies are needed. Muskie fingerlings are annually stocked at the rate of
5/acre. A 14-inch size limit on bass went into effect in 1999 and more aggressive
measures have been taken recently to control non-native invasive aquatic plants.
Based on spring trapping for muskies and electrofishing for bass, Lake Webster
contained 5,363 muskies, 23.5-50.5 inches long, and 3,850 bass (≥ 8-in). Average muskie
length was 33 inches. Mean muskie lengths from age-3 through age-8 were 26, 29, 33,
36, 40, and 45 inches, while estimated numbers of age-3 through age-8 muskies were
416, 2127, 1279, 938, 408, and 183, respectively. Anglers fished 70,829 hours during
April through November and effort was primarily directed at muskies and bass. They
made 6,399 trips to fish specifically for muskies and 2,342 trips to fish specifically for
bass. Anglers removed 11,203 fish, but kept only 14 muskies and 210 bass. They also
caught and released 2,201 muskies and 8,275 bass. Bluegills dominated the July fish
population survey catch but nearly all were less than 7 inches. Submersed aquatic plants
covered 90% of the littoral zone in May and 84% in July and were dominated by curly-
leaf pondweed in May and coontail in July. Forty-one beds of emergent plants were
mapped, covering 34 acres.
Lake Webster continues to support a high-quality muskie fishery that provides
high-quality muskie fishing experiences. Muskie density, fishing effort, and catches have
increased substantially over the years with no apparent or significant adverse effects on
the native fish community or angler satisfaction for other species, although bluegill and
bass catches were lower in 2005. Bass density was 50% lower in 2005 compared to 1998
but more larger bass were present and the angler catch rate doubled from 0.3/hour to
0.6/hour. No changes in current fish management strategies are needed or recommended.
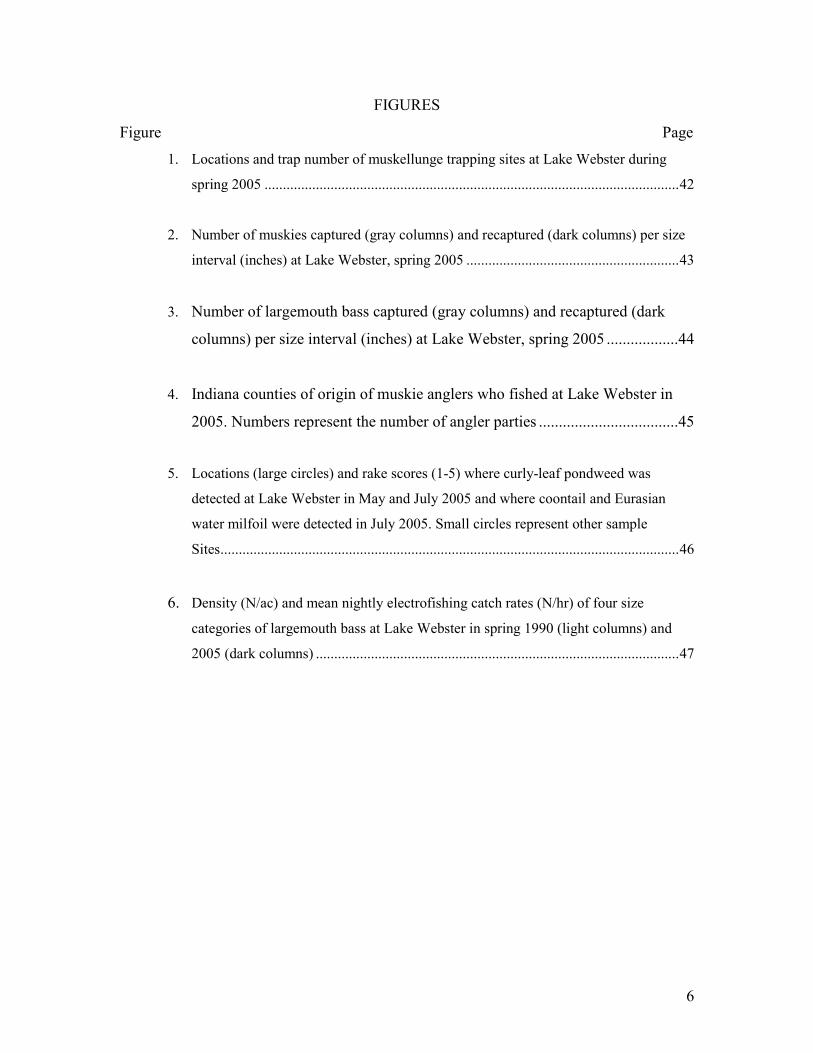
Cover photo: Fisheries biologist Jed Pearson (right), assisted by Manchester University student Jared Mobley (left),
displays a 49½-inch muskellunge captured in a trap at Lake Webster in April 2005.

3
CONTENTS
Page
LIST OF TABLES...............................................................................................................4
LIST OF FIGURES .............................................................................................................6
INTRODUCTION ...............................................................................................................7
STUDY SITE.......................................................................................................................8
METHODS ..........................................................................................................................9
RESULTS ..........................................................................................................................11
DISCUSSION....................................................................................................................20
SUMMARY AND RECOMMENDATIONS....................................................................24
REFERENCES ..................................................................................................................25
APPENDICES ...................................................................................................................47

4
TABLES
Table Page
1. Number, size and source of muskellunge stocked at Lake Webster from 1978
through 2005...............................................................................................................26
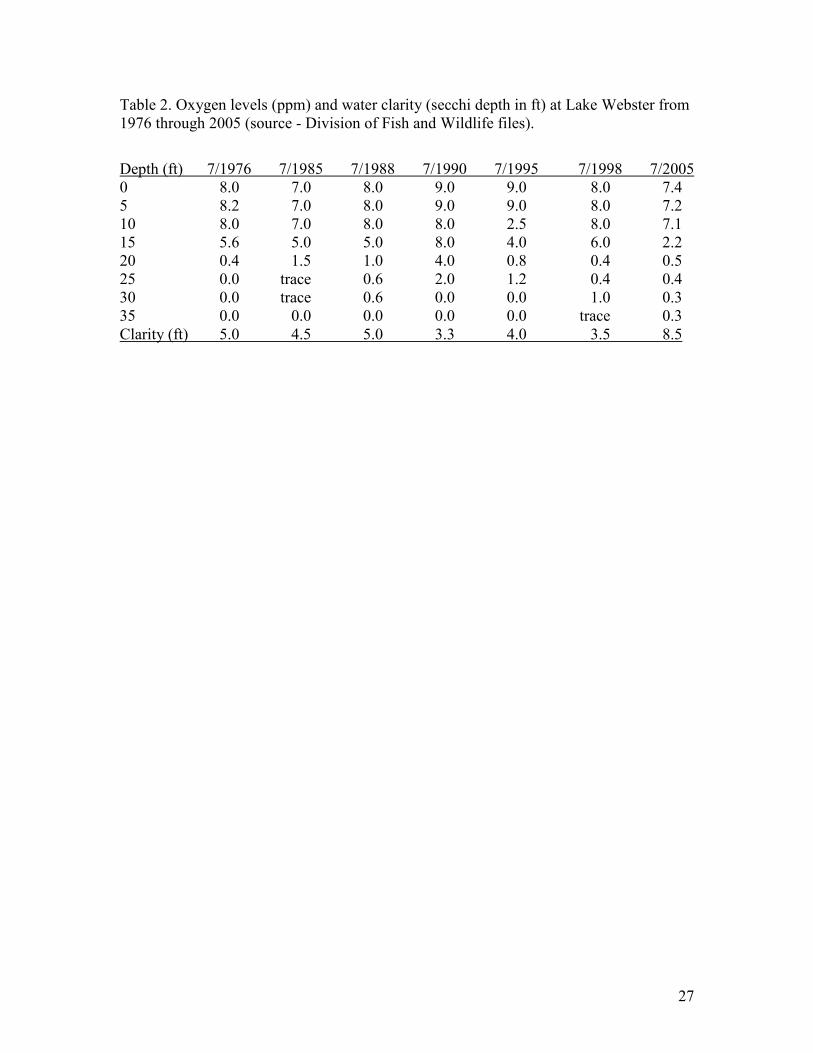
2. Oxygen levels (ppm) and water clarity (secchi depth in ft) at Lake Webster from
1976 through 2005 (source - Division of Fish and Wildlife files)..............................27
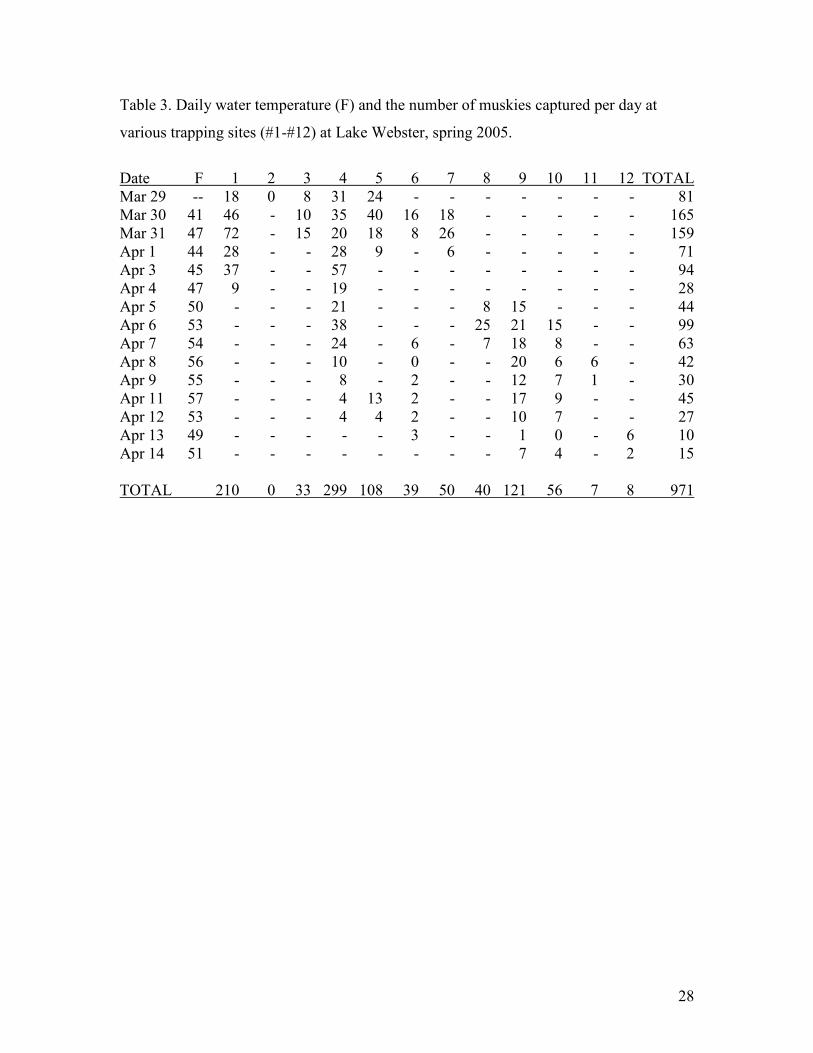
3. Daily water temperature (F) and the number of muskies captured per day at various
trapping sites (#1-#12) at Lake Webster, spring 2005................................................28
4. Daily water temperature (F), number of muskies caught (C), muskie deaths (D),
marked muskies at large (M), recaptured muskies (R), muskies transported to Fawn
River (T), muskies shipped back for release (S), untagged muskies released (U),
Schnabel population estimate (N), and standard error (SE) at Lake Webster, spring
2005 ............................................................................................................................29
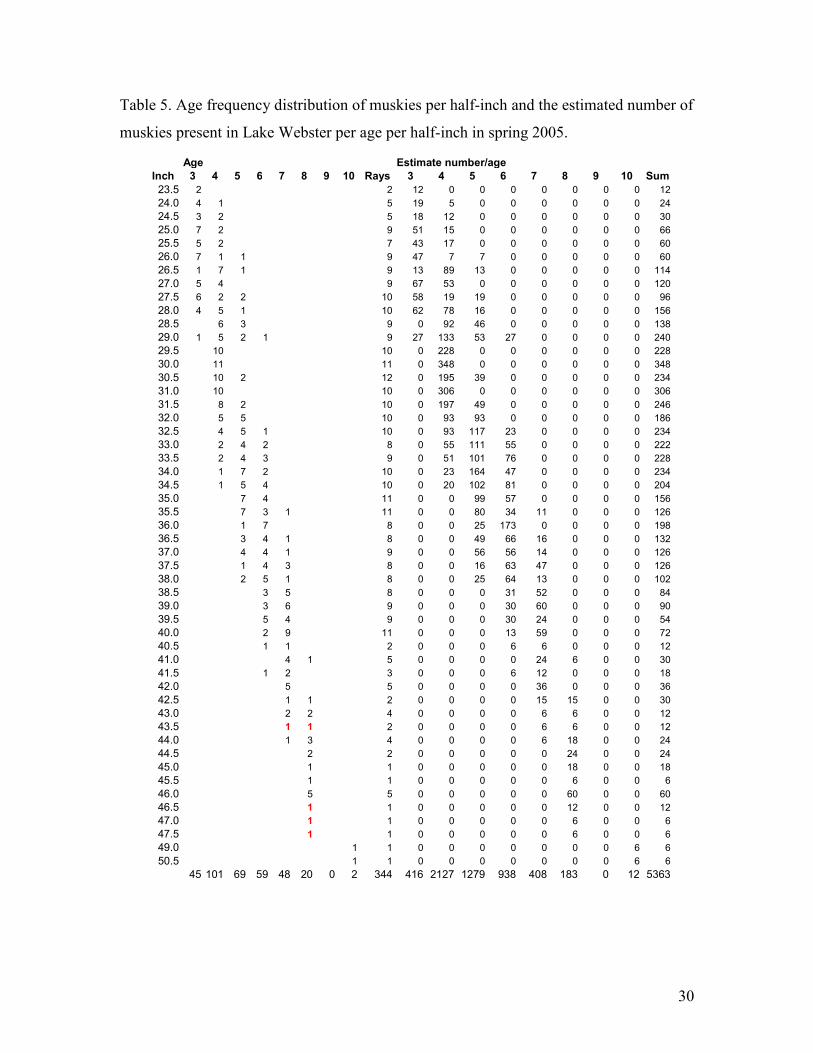
5. Age frequency distribution of muskies per half-inch and the estimated number of
muskies present in Lake Webster per age per half-inch in spring 2005 .....................30
6. Length distribution of largemouth bass captured (Catch) and recaptured (Recaps) at
Lake Webster in spring 2005 (catch does not include recaptured fish) ......................31
7. Nightly electrofishing effort in seconds (H), catches (C), marked bass at large (M),
recaptures (R), Schnabel population estimate (N), and standard error (SE) of 8-inch
and larger largemouth bass in Lake Webster and the Backwater Area during April-
May 2005 ....................................................................................................................32
8. Mean daily counts of boat anglers (meanB), shore anglers (meanS), length of a
fishing day (Hrs/day), fishing days per month (Day/m), estimated hours fished by
boat anglers (BoatHrs) and shore anglers (ShoreHrs), and total angling effort
(TotalHrs) on weekend (we) and weekdays (wd) per month at Lake Webster, April
through November 2005 .............................................................................................33

5
9. Number of interviewed angler parties who fished for various species or combinations
of various species at Lake Webster per month from April through November 2005 .34
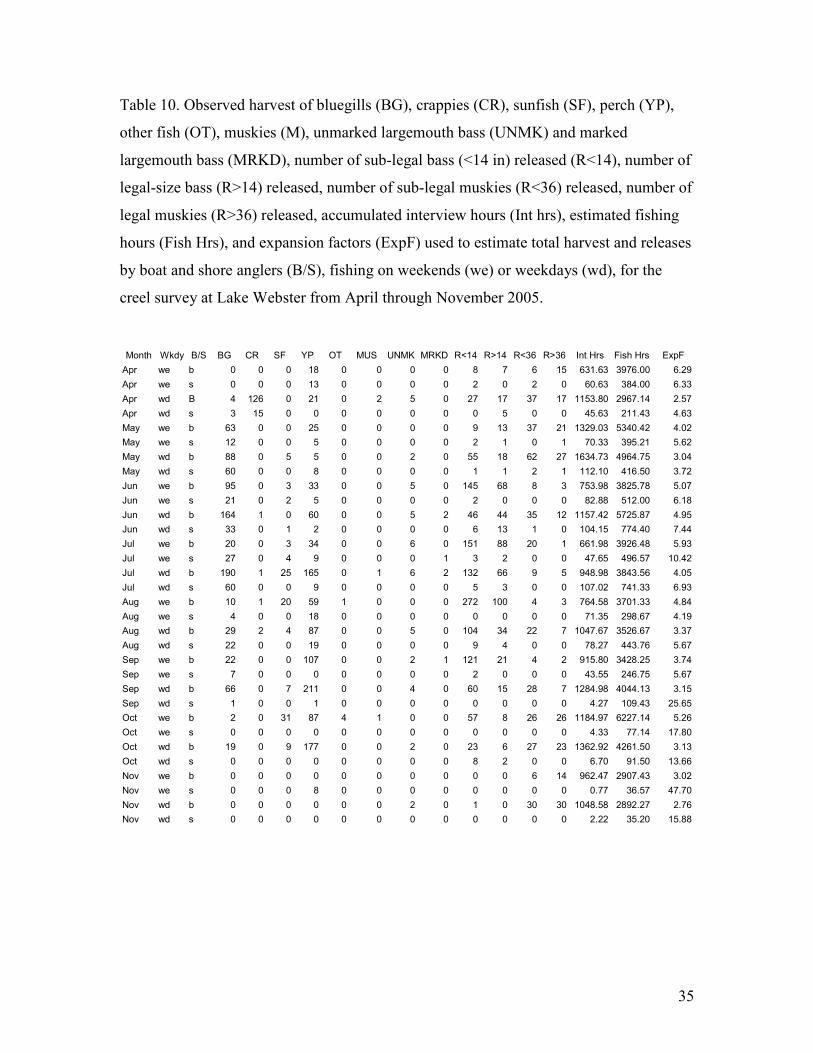
10. Observed harvest of bluegills (BG), crappies (CR), sunfish (SF), perch (YP), other
fish (OT), muskies (M), unmarked largemouth bass (UNMK) and marked largemouth
bass (MRKD), number of sub-legal bass (<14 in) released (R<14), number of legal-
size bass (R>14) released, number of sub-legal muskies (<36) released, number of
legal muskies (R>36) released, accumulated interview hours (Int hrs), estimated
fishing hours (Fish Hrs), and expansion factors (ExpF) used to estimate total harvest
and releases by boat and shore anglers (B/S), fishing on weekends (we) or weekdays
(wd), for the creel survey at Lake Webster from April through November 2005.......35
11. Size distribution of fish taken by anglers each month at Lake Webster from April
through November 2005 .............................................................................................36
12. Number of interviewed anglers parties who rated fishing as fair, good or poor based
on their species preference at Lake Webster from April through November 2005 ....38
13. Number and weight of fish collected during standard fish population surveys at Lake
Webster from 1976 through 2005...............................................................................39
14. Number of bluegills collected per size interval during standard fish population
surveys at Lake Webster from 1976 through 2005.....................................................40
15. Estimated number of fish of various species taken by anglers during surveys
conducted at Lake Webster in 1987 (summer only), 1990, 1998 and 2005................41
6
FIGURES
Figure Page
1. Locations and trap number of muskellunge trapping sites at Lake Webster during
spring 2005 .................................................................................................................42
2. Number of muskies captured (gray columns) and recaptured (dark columns) per size
interval (inches) at Lake Webster, spring 2005 ..........................................................43
3. Number of largemouth bass captured (gray columns) and recaptured (dark
columns) per size interval (inches) at Lake Webster, spring 2005 ..................44
4. Indiana counties of origin of muskie anglers who fished at Lake Webster in
2005. Numbers represent the number of angler parties ...................................45
5. Locations (large circles) and rake scores (1-5) where curly-leaf pondweed was
detected at Lake Webster in May and July 2005 and where coontail and Eurasian
water milfoil were detected in July 2005. Small circles represent other sample
Sites.............................................................................................................................46
6. Density (N/ac) and mean nightly electrofishing catch rates (N/hr) of four size
categories of largemouth bass at Lake Webster in spring 1990 (light columns) and
2005 (dark columns) ...................................................................................................47

7
INTRODUCTION
Lake Webster is currently Indiana’s premier lake for muskie fishing. Muskies
were first introduced into the lake in 1978 when 48,000 fry were stocked into the adjacent
Backwater Area (Table 1). In 1981 the Michiana Chapter of Muskies, Inc., purchased
fingerlings from a Wisconsin source and stocked additional fish in 1982-1985. The
Division of Fish and Wildlife (DFW) added muskie fingerlings produced in state rearing
ponds from 1982-1988. Beginning in 1989 and since then, only fingerlings produced at
the Fawn River State Fish Hatchery and reared on live forage fish have been stocked.
Since 1981 a total of 56,059 muskie fingerlings have been released. Assuming a
commercial price of $8 each, the program costs to date are valued at $448,472.
Various surveys have been conducted by the DFW at Lake Webster to monitor
success of the stocking program and assess its effects on the fish community. Standard
fish population surveys were conducted in July 1976, 1985, 1988, 1990 and 1995. Angler
surveys were conducted in 1987 and 1990. Largemouth bass density, size structure, and
exploitation were examined in 1990 at a time when no minimum size limit was in effect.
In 1998, the DFW conducted a more-extensive study of the muskie population. Purposes
at that time were to estimate muskie density and size structure, examine angler interest
and catch, monitor impacts on the fish community, and track radio-tagged muskies to
better understand their behavior and locate possible spawning concentrations for
broodstock collections. No surveys were conducted after 1998 but sexually-ripe muskies
have been trapped each spring for hatchery broodstock.
Since 1998 two other issues have come to the forefront of fish management at
Lake Webster. Local lake residents are now more active in controlling Eurasian water
milfoil and plans are to increase control of curly-leaf pondweed. Unusually dense
growths of milfoil reached nuisance levels in 1999 and 2002, prompting lake-wide
applications of fluridone (Sonar®). Although the 1999 treatment was considered
successful, water clarity and overall plant abundance declined sharply following the 2002
treatment. By 2004 some plants had recovered, although anglers expressed concerns over
possible long-term adverse effects of the fluridone treatments on fish and fishing.
Throughout the same period, some anglers also complained about poor bass fishing and
attributed it to muskie predation.

8
Based on a variety of needs and issues, the DFW conducted a follow-up study at
Lake Webster in 2005. Purposes of the study were to again estimate density and size
structure of the muskie and bass populations in the lake, examine fishing activity and the
quality of fishing, continue to assess any possible impacts of the muskie stockings on
native fish, monitor the effects of weed control efforts on the fish community, and
determine whether any changes in fish or lake management strategies are needed. The
results of this work are presented in this report.
STUDY SITE
Lake Webster, including the Backwater Area, is a 774-acre lake located at North
Webster, Indiana, about equal distance from Fort Wayne and South Bend. The lake
formerly consisted of five small natural lake basins that were impounded in the 1800s.
Public access is available at a state-owned site along CR 550N. The lake lies within the
Tippecanoe River watershed and drains 31,488 acres, 92% of which enters the Backwater
Area. The outlet leaves the west side of Webster Lake over a concrete structure and flows
to James Lake. Maximum depth is 52 feet and average depth is 12 feet. A large
percentage of the lake, including the Backwater Area, is less than 6 feet deep and
estimates of hydraulic retention time range from 49-82 days.
Lake Webster is a mesotrophic lake. During summer however, enough oxygen is
present for fish (> 3 ppm) only in the top 10-15 feet of water (Table 2). From 1976
through 1998, water clarity varied from 3.3-5.0 feet but increased to 8.5 feet in 2005. The
bottom materials are mostly muck and sand. Curly-leaf pondweed, coontail, and Eurasian
water milfoil are the most common submersed plants, although herbicides are used
annually to control curly-leaf pondweed and milfoil. Duckweed is also abundant in the
Backwater Area and floats down into the main area of the lake. Some floating-leaf
emergent plant beds are scattered throughout the lake. Most of the lake is residentially
developed but significant wetlands and natural shoreline sections are still present in the
northeast corner of the main lake and at the south end of the Backwater Area.

9
METHODS
An attempt was made to estimate the number of adult muskies in Lake Webster
during spring 2005 using large commercial trap nets set at 12 locations (Figure 1) from
March 29 through April 14. The number of traps fished per day ranged from two to six.
The traps, as well as their leads, were checked daily except on April 2 and 10 and moved
when catches were low. The number of sets at each site varied from one to 13 during the
period. Water temperature varied from 41-57 degrees and averaged 50 degrees. Each
trapped muskie was measured, marked with a left-pectoral fin ray clip (also used for age
determinations), tagged with a uniquely-coded PIT tag near the base of the dorsal fin, and
sexed. The dates and capture locations of each muskie and each recaptured muskie were
recorded. If sexually-ripe, females, along with a number of males, were trucked to the
Fawn River State Fish Hatchery for egg-taking and fertilization. Otherwise, each muskie
was taken by boat to sites in the general center of the lake. Fish taken for spawning were
also hauled back to the lake and released at offshore locations away from the traps. A
Schnabel estimate of the muskie population over the entire size range of captured fish
was then generated (N= (∑(CtMt)/ ∑R+1) based on the daily (t) catch (C), number of
marked muskies at large (M), and recaptures (R).
Largemouth bass density, size and growth were determined at Lake Webster and
the Backwater Area from mark-recapture electrofishing over a four-week period from
April 25 through May 16. Water temperatures varied from 48-58 degrees. Three crews,
each sampling approximately two hours per night, covered the entire shoreline of Lake
Webster and the northern half of the Backwater Area each night. Stunned bass were
retrieved by two dip-netters in each boat, measured, and marked with a right ventral fin-
clip before release. A Schnabel estimate of 8-inch and larger bass was then generated
from the four nightly mark-recapture sessions. Mean nightly estimates of catch per effort
for four size categories of bass (8-11½ in, 12-13½ in, 14-17½ in, ≥18 in) were calculated.
Numbers of bass in each size category were then determined by multiplying the mean
nightly proportions of each group times the population estimate. Scale samples for
growth analyses were also obtained from bass collected at this time. A separate estimate
of the bass population over the entire length range was made and partitioned into various
age groups based on age proportions per half-inch to examine annual survival.

10
To estimate fishing effort and catch, a creel survey was conducted from April 1 to
November 30. During the survey, boat and shore anglers were counted at regular
intervals on four occasions daily (three occasions daily in November), throughout an
early period (morning to mid-afternoon) or late period (mid-afternoon to dark) on seven
randomly selected weekdays and three weekend days every two weeks. Fishing effort
was calculated for boat and shore anglers each month for weekends and weekdays by
multiplying the average daily count of anglers times the number of hours available per
day (12 hrs in April, October and November, 14 hrs in May and September, 16 hrs in
June, July and August) times the number of weekend and weekdays per month. Angler
catch was determined by interviewing as many anglers as possible during each sampling
day. Total catch of each species was then calculated by multiplying the observed catch
times the fraction of the total effort for each month. Harvested fish were also measured to
determine size structure and each harvested muskie or bass was inspected for PIT tags or
fin-clips. Estimates of percentages of legal-size muskies (≥ 36 in) and bass (≥ 14 in)
removed by anglers from the population were calculated by dividing the harvest estimates
by the spring population estimates. During each interview, a spokesperson for the party
was asked which species they were fishing for, whether they released any legal or sub-
legal muskies or bass, how they rated fishing quality, and their county of residence.
A standard fish population survey was conducted at Lake Webster on July 18-21.
Surface water temperature was 82 degrees and water clarity was 8½ feet. No sampling
was done in the Backwater Area. To ensure comparability with previous surveys, effort
included 60 minutes of pulsed DC electrofishing (504V) at night with two dip-netters and
three gill nets set for three days, but one net was damaged by a large boat (8 lifts). Two
trap nets were also set for two days at four sites (4 lifts). All captured fish were measured
to the nearest tenth-inch and released when possible. Weights were estimated from
standard length-weight formulas generated from data on file from natural lake fish
population surveys in the area. Fish scales were taken from dominant game fish for age
and growth analyses using standard body-length:scale-length relationships.
Submersed aquatic plants were sampled at 132 random littoral sites in Lake
Webster and the Backwater Area on May 31 and at 134 sites on July 29 using a doubled-
head rake according to Division of Fish and Wildlife sampling guidelines. Site locations

11
on the first occasion were recorded with a GPS unit and then approximately relocated on
the second occasion. Sample sites were located within the littoral zone and varied up to
14 feet deep in May and up to 15 feet deep in August. Channel areas were not included.
Plant abundance, including algae, was quantified at each site by stacking the plants
evenly across one side of the rake tines. Scores (0-5) were assigned to the amount of
plants based on increments marked evenly on the tines. Species were then separated and
scored individually at each site. The sampling was closely patterned after similar
sampling on two occasions in 2003 and 2004.
Emergent plant beds were mapped on August 9 by boating along the lakeward
perimeters of all beds and recording GPS coordinates of their edges. Width of the bed at
each GPS point, oriented perpendicularly to shore (i.e. visual transect), was measured
with a laser rangefinder. Bed size was calculated by summing areas of each polygon
created by the linear distance between two consecutive GPS points and their mean width.
The presence of various species along each visual transect was recorded, as was the
presence of various nearshore wetland plants associated with each transect. Beds were
generally defined as areas where emergent plants covered more than 625 square feet and
spaces between plants were more than 25 feet. Small emergent stands, defined as isolated
patches (<625 sq ft), were also mapped and characterized by species.
RESULTS
Muskie population parameters
A total of 971 muskies, including 72 recaptures, were trapped in spring 2005 at an
average rate of 15 per lift (Table 3). At the end of trapping, 844 muskies had been PIT-
tagged and released. The peak catch occurred on March 30-31 and accounted for 33% of
the total when water temperature increased from 41 to 47. Two sites (#1 and #4) in the
northeast and northwest corners of the lake (Figure 1) provided 52% of the total catch.
Traditional broodstock collection sites (#5, #9, #10) provided 29% of the total catch. The
largest single daily catch was 72 muskies and occurred at site #1 on March 31. Based on
the mark-recapture sampling (Table 4), Lake Webster and the Backwater Area contained
5,363 (SE = 628) muskies in spring 2005. The estimate represented a population density
of seven muskies per acre and tagged muskies comprised 16% of the population.
12
Individual muskies captured in trap nets (895) ranged from 23.5-50.5 inches long
and averaged 33 inches (Figure 2). Those less than 30 inches long made up 25% of the
catch, while those that were 36-inch or larger accounted for 24%. Based on these
percentages, Lake Webster contained 1,300 legal-size muskies, 2,720 that were 30-35.5
inches, and 1,342 that were less than 30 inches, although those less than 30 inches were
probably not as vulnerable to the traps and were therefore likely underestimated. Muskies
that were 40-inch or larger accounted for 7% of the overall catch and represented 30% of
the legal-size muskies in the lake (389). Recaptured muskies, including a 30-inch fish
that was recaptured twice, ranged from 25.5-41.0 inches long and averaged 31.5 inches.
Of these, 31% were less than 30 inches and 11% were 36-inch or larger.
Muskies caught in spring 2005 ranged in age from age-3 to age-10 (Table 5),
although no age-9 muskies were presumed present since no fingerlings were stocked in
1996. Mean lengths at capture for each age from age-3 to age-8 increased from 26 inches
to 29, 33, 36, 40, and 45 inches, respectively. The two largest muskies appeared to be 10
years old and averaged 50 inches. Based on age key analysis of scales samples taken per
half-inch over the entire length range, the estimated numbers of age-3 to age-8 muskies in
the lake were 416, 2127, 1279, 938, 408, and 183, respectively, while the number of age-
10 muskies was estimated to be 12. Assuming this age composition is typical of the
muskie population at Lake Webster each year, annual survival of age-4 muskies is 57%
and annual survival of age-5 muskies is 55%. Survival decreases to 39% for age-6
muskies, 32% for age-7 muskies, and 6% for age-8 and older muskies.
Largemouth bass population parameters
A total of 1,138 largemouth bass (≥ 8 in), including 118 recaptures, were caught,
marked, and released during the four nights of spring electrofishing (Figure 3). Based on
these results (Tables 6 and 7), the population estimate of 8-inch and larger bass was 3,850
(SE = 353) and represented five per acre. Excluding recaptures, the number of individual
8-inch and larger bass captured during sampling was 1,020 and represented 27% of the
estimate. By the end of sampling, 258 legal-size bass (≥ 14 in) had been marked and
released. An additional 487 small bass (< 8 in) were also captured and marked, of which
29 were later recaptured. Although these fish were likely under-represented, including

13
them in the overall population estimate increased the total number to 6,541 (SE = 538), or
eight bass per acre.
The average nightly catch rate of 8-inch and larger bass was 44/hour of
electrofishing, including average nightly catch rates of 28/hour of 8- to 11.5-inch bass,
5/hour of 12- to13.5-inch bass, 8/hour of 14- to 17.5-inch bass, and 3/hour of 18-inch and
larger bass. Mean nightly estimates of the proportional size distribution of these four size
groups were 64%, 11%, 19% and 6%, respectively. Based on these percentages, the
estimated numbers of bass in each size group were 2456, 433, 731 and 230.
Largemouth bass up to 8 years old were aged from scale samples. Mean back-
calculated lengths at each current age from age-1 through age-8 were 5, 8, 10, 12, 14, 16,
18 and 19 inches, respectively. Based on the age composition of scale samples taken
within each half-inch group over the entire length range and the overall population
estimate (6,541), Lake Webster contained 747, 2299, 926, 1287, 480, 455, 282 and 65
bass that were age-1 through age-8, respectively. Using these figures, annual survival of
bass, age-2 through age-7, was 60%, 74%, 50%, 63%, 43%, and 19%, respectively.
Angler creel survey
Anglers fished 70,829 hours at Lake Webster (92 hrs/ac) during April through
November (Table 8). Anglers fishing from boats accounted for 65,559 hours (93%) and
anglers fishing from shore or piers accounted for 5,270 hours (7%). Peak effort occurred
in May (16%), June (15%), and October (15%), although the single maximum monthly
amount of fishing effort from boats occurred in October (10,489 hrs). April (11%) and
November (8%) experienced the least effort. Shore anglers fished more in June (1,286
hrs) and July (1,237 hrs). Total fishing pressure on weekends (35,780 hrs) was nearly
identical to effort on weekdays (35,049 hrs). Boat anglers on weekends accounted for
47% of the total effort and 51% of the boat angling effort, while boat anglers on
weekdays accounted for 45% of the total effort and 49% of the boat angling effort.
Fishing effort was primarily directed at muskies and largemouth bass (Table 9).
Of 2,215 angler parties interviewed during the survey, 1,205 (54%) fished solely for
muskies, 128 (6%) fished for muskies in combination with other species, and 380 fished
solely for bass (17%). Bluegills were sought by less than 4% of the parties, followed by

14
perch (2%) and crappies (2%). Anglers who expressed no species preferences accounted
for 10% of the total, while anglers who fished for various combinations of fish accounted
for 6%. Overall, individual species were mentioned alone or in different combinations
2,446 times. Muskies were named 1,333 times (55%), followed by bass (21%), anything
(9%), bluegills (8%), perch (5%), crappies (3%), sunfish or others (<1%).
As might be expected, boat anglers in general fished for different species than
shore anglers, but differences among weekend and weekday anglers were minor. Boat
anglers were more likely to fish specifically for muskies (61%) than shore anglers (5%),
although shore anglers fished for bass (16%) about as much as boat anglers (17%). Shore
anglers were more likely to fish for “anything” (48%) compared to boat anglers (5%).
Bluegills were also specifically sought more by shore anglers (15%) than boat anglers
(2%). Preferences for crappies, perch or other fish were similar between both groups.
Muskies were targeted by 53% of anglers on weekends and 56% of anglers on weekdays.
Bass were slightly more popular among weekend anglers (21%) than weekday anglers
(15%). Differences between preferences for the other species were less than 3%.
Fishing preferences and effort directed at each species varied by month. The
percentages of anglers who fished solely for muskies were greater during April (63%),
May (65%), October (77%) and November (95%) than the other months. Fewer than 30%
of angler sought muskies in July or August. In contrast, largemouth bass were sought
more in July (30%) and August (37%) than during other months (<21%). The percentage
of anglers seeking bluegills was greatest in June and July (6%), while the percentage
seeking crappies was greatest in April (13%). Anglers seeking perch peaked in July (5%).
Of the 70,829 total hours fished, anglers who fished specifically for muskies accounted
for 38,532 (54%). Muskie fishing effort was greatest in October (8,250 hrs) and May
(7,214 hrs), followed by November (5,547 hrs), April (4,719 hrs), June (4,421 hrs) and
September (4,204 hrs), then August (2,257 hrs) and July (2,095 hrs). Bass effort was
greatest in August (2,942 hrs) and July (2,693 hrs), then June (2,191 hrs) and September
(1,462 hrs), and less than 1,000 hours in April, May, October, with zero hours in
November. Bluegill effort peaked in June (704 hrs), crappie effort peaked in April (978
hrs), and perch effort peaked in August (400 hrs).

15
Anglers caught and removed 11,203 fish during the creel survey, including 5,203
yellow perch, 4,801 bluegills, 414 crappies, and 534 miscellaneous sunfish (Table 10).
They caught and kept only 210 largemouth bass, including 32 (15%) that had been
marked in the spring. They kept only fourteen muskies. Fishermen also removed 26 other
fish, mainly bullheads. However, anglers also caught and released 8,275 bass, including
2,555 (31%) that were reportedly 14-inch or larger. They also caught and released 2,201
muskies, of which 1,385 (63%) were reportedly less than 36 inches and 816 muskies
(37%) that were 36-inch or larger. Of the 2,215 total muskies caught by anglers
(including those taken home), 24% were caught in May and 20% were caught in October.
Catches in April and May each contributed 13% to the total. Another 10% were caught in
November. Of the 8,485 largemouth bass caught during the survey (including those taken
home), 28% were caught in July, 28% in August, 21% in June, 10% in September, 7% in
October, 4% in May, 3% in April, and fewer than 1% in November. Perch catches were
greatest in July, September, and October. Bluegill catches were greatest in June and July,
while crappie catches were greatest in April. Anglers who fished solely for muskies
fished 22.8 hours on the average to catch one but catch rates varied considerably per
month, ranging from 17.6 hours in May to 41.5 hours in September. Anglers who
targeted bass caught them at an average rate of one per 1.7 hours of fishing. Monthly bass
catch rates varied from one bass per 1.3 hours in July to 4.1 hours in May. Catch rates by
anglers targeting only bluegills, crappies, or perch were one fish per 1.2, 1.6, and 0.5
hours, respectively.
Harvested bass ranged from 14-20 inches long while harvested muskies were 36-
48 inches (Table 11). Most panfish taken by anglers were small. Bluegills were 5-11.5
inches and averaged 6.5 inches. Crappies were 6-12.5 inches and averaged 8 inches.
Perch were 5-11.5 inches and averaged 7 inches. Only 8% of bluegills taken by anglers
were 8-inch or larger and only 8% of crappies were 10-inch or larger. While 25% of
perch were 8-inch or larger, less than 2% were 10-inch or larger. In contrast, mean length
of harvested bass was 16 inches and mean length of harvested muskies was 39.5 inches.
Of the 210 bass kept by anglers, 43 (20%) were 18-inch and larger. The 210 bass
represented 22% of the number of legal bass (≥ 14 in) present at the start of the survey,
slightly higher than the 15% estimate based on the expanded harvest of marked bass. The
16
14 legal muskies kept by anglers represented 1% of the estimated number of legal fish
present in April (1300).
Muskie anglers came from a wider geographic area and had a more favorable
opinion of fishing quality than other anglers. Anglers who fished solely for muskies came
from 53 Indiana counties (Figure 4) and nine other states. Those who fished only for bass
came from 29 Indiana counties and four other states. In contrast, bluegill anglers came
from 16 Indiana counties and two other states, crappie anglers came from 11 counties and
one other state, and perch anglers came from seven counties and one other state. When
asked to rate fishing quality, 80% of muskie-only anglers described it as good, 15% said
it was fair, and 5% said it was poor (Table 12). In contrast, 57% of bass-only anglers
rated fishing as good, 32% said it was fair, and 11% said it was poor. Among bluegill
anglers, 66% considered fishing good, 28% said it was fair, and 6% said it was poor. The
responses from perch anglers were similar (75% good, 22% fair, 8% poor) to bluegill
anglers but crappie fishermen were less satisfied (46% good, 24% fair, 29% poor).
Among all anglers, 70% rated fishing good, 22% rated fishing fair, and 8% rated fishing
poor. Anglers who said they were lake residents were also generally satisfied, rating
fishing as either good (72%) or fair (21%).
Contrary to what may have been expected, more lake residents specifically fished
for muskies (28%) than bass (19%), bluegills (9%), perch (6%), or crappies (3%),
although 21% had no preference. Meanwhile, 77% of out-of-state anglers fished for
muskies, of which 70% came from Illinois and 15% came from Ohio, and 10% came
from Michigan. Only 10% of out-of-state anglers came specifically to Lake Webster to
fish for bass. Bass fishing, however, was more popular (31%) among local Kosciusko
county residents (excluding lake residents) than were muskies (26%). Among anglers
who came from the six neighboring counties (Elkhart, Fulton, Marshall, Noble, Wabash,
Whitley), 50% fished solely for muskies and 28% fished solely for bass. Likewise,
anglers who came from all other Indiana counties fished mostly for muskies 68%, while
13% fished for bass.
Muskie anglers generally fished longer than other anglers. Among all anglers who
fished solely for muskies and had completed fishing at the time of the interview, average
trip length was 6.2 hours. Mean complete fishing trip length for bass-only anglers was 5.2

17
hours. Anglers who fished for muskies in combination with bass fished an average of 4.9
hours. Average trip lengths for bluegill, crappie, and perch anglers were 4.2, 3.3, and 4.5
hours, respectively. Based on these figures, anglers who fished solely for muskies made
6,399 trips to Lake Webster. Bass-only anglers made 2,342 trips, while anglers who
fished for muskies in combination with bass made 683 trips. The numbers of fishing trips
made by bluegill, crappie, or perch anglers were 637, 398, and 345, respectively.
Fish population survey
During the July fish population survey 2,205 fish, representing 19 species and
weighing 383 pounds, were collected (see appendices). Bluegills dominated the catch by
number (63%) and accounted for the largest share of the weight (29%). Perch ranked
second, comprising 10% of the number and 10% of the weight. Gizzard shad were third
in number (7%) and second by weight (13%), while largemouth bass were fourth in
number (6%) and weight (12%). Only five muskies were captured. They accounted for
10% of the survey weight. Altogether game fish comprised 91% of the catch by number
and 80% of the weight.
Bluegills ranged from 1-7 inches long, but only three were 7 inches. Most were
5.5 inches (246) or 6 inches (249) and ages 3-5. Of all 3-inch and larger bluegills (997),
36% were 6-inch or larger. Electrofishing provided 510 (128/15-min) and traps provided
857 (214/lift). Bluegill growth was slow, especially after age-4 and averaged less than 6
inches long by age-4.
Yellow perch ranged in length from 5-9 inches but most were 6.5-8 inches. Only
37 of the 218 perch caught during the survey were 8-inch or larger. Sixty-eight were
caught in gill nets at a rate of 9/lift and 64 were captured during electrofishing, while 86
were caught in traps. Older perch were mostly age-4 and also grew slowly, averaging 6½
inches long in spring 2005.
A total of 123 largemouth bass were collected in the July survey. They measured
1.5-20 inches long, although only seven bass were 14-inch or larger. Peaks in the size
distribution were at 2.5, 6.5, and 9.0 inches and corresponded to age-0, age-1, and age-2
fish, based on scales taken from bass captured during the spring sampling. All but eight
bass were captured by electrofishing (29/15-min), including 53 bass that were 8-inch or
18
larger (13/15-min) and at a catch rate similar to spring (11/15-min). The catch rate of
legal-size bass (≥ 14 in), however, was about half (1.5/15-min) the catch rate in spring
(2.8/15-min).
Other gamefish in the survey catch included 72 pumpkinseeds, 65 black crappies
up to 10 inches long, 46 redear, 40 yellow bullheads and 37 brown bullheads, 16 longear,
12 warmouth, and the five muskies. The muskies were 29.5-35.5 inches. The smallest
was caught during electrofishing and the two largest were caught in gill nets. A 31-inch
and a 33.5-inch muskie were caught in traps.
Of the 154 gizzard shad collected during the survey, most were 8-12 inches long.
Four were age-0 and were 2-2.5 inches. Only four shad were larger than 12 inches with
the largest measuring 15.5 inches. Nearly all shad (91%) were captured during
electrofishing and only eleven were caught in gill nets. In addition to shad, other non-
game fish included 19 golden shiners, six spotted gar, six brook silversides, two lake
chubsuckers, a 28-inch carp, a 26.5-inch bowfin, and one bluntnose minnow.
Aquatic plant surveys
Submersed aquatic plants were found to a depth of 14 feet at 90% of the sample
sites in late May and to a depth of 15 feet at 84% of the sample sites in late July. The
percentages of sites with native plant species on both occasions were 76% and 82%,
respectively. Water clarity was 18 feet in May but declined to 8.5 feet in July. During
May, 48% of the sites were within the 5-foot contour, 50% were within the 5.5- to 10-
foot contour, and 2% were with the 10.5- to 14-foot contour. In July, 50% were within
the 5-foot contour, 43% were within the 5.5- to10-foot contour, and 10 sites were within
the 10.5- to 15-foot contour. Ten species, including Eurasian water milfoil and curly-leaf
pondweed, were found in May and 13 species, including both non-native plants, were
found in July. The maximum number of species per site was six on both occasions, while
the mean number per site dropped from 2.2 in May to 1.6 in July. Species diversity
indices were similar on both dates (0.77-0.78) and average rake scores were also similar:
3.9 in May and 3.3 in July.
Curly-leaf pondweed and coontail were the two most dominant species. Curly-
leaf pondweed was the dominant species in May and occurred at 81% of the littoral sites
19
with a mean rake score of 2.9 (Figure 5). After herbicide treatment and mid-summer
senescence, curly-leaf pondweed was found at 14% of the littoral sites with a mean rake
score of 1.1. During May sampling, it provided rake scores of 5 at 34% of the sites where
present but only provided rakes scores of 1 or 2 in July. Coontail ranked second in
dominance (i.e. percent of maximum potential abundance) in May (19) but ranked first in
July (30). It occurred at 48% of the sample sites in May and 64% in July with mean rakes
scores of 2.0 and 2.4, respectively. Eight (13%) of the sites where it was detected in May
produced a rake score of 5, whereas 19 (22%) of the sites where it was detected in July
produced a rake score of 5.
Other species were distributed less widely and most were present at lower levels
of abundance. Eurasian water milfoil occurred at 39% of the sites in May and 12% in
July and yielded mean rake scores of 2.4 and 1.1. Chara ranked fourth in dominance in
May and third in July, occurring at 12% and 10% of the sample sites. Dominance scores
for all other species were less than 5 on each occasion and included elodea, common
naiad, sago pondweed, flat-stem pondweed, eel grass, and Illinois pondweed in May.
Water stargrass, leafy pondweed, spiny naiad, variable-pondweed and large-leaf
pondweed were found in July, but not common naiad, eel grass, or Illinois pondweed.
These species were typically found at less than 10% of the sample sites.
Forty-one beds of floating-leaf emergents were mapped in Lake Webster and the
northern end of the Backwater Area. They covered 34 acres, or 4% of the surface, and
had a lakeward perimeter of 2.2 miles, or 28% of the shoreline length. Mean bed width
was 71 feet. Most beds (63%) covered less than half an acre and only six beds were larger
than an acre. The largest bed was 13 acres and present in a bay along the north shore.
Few beds were present in the western half of the lake. Spatterdock occurred in each of the
41 beds and was noted along 30-100% of the visual transects in each bed, although 36
beds contained spatterdock throughout. Water lilies were present in six beds and were
noted at 22-100% of transects in beds where they occurred. Other species associated with
the 41 beds included cattails, arrow arum, purple loosestrife, swamp loosestrife,
pickerelweed, arrowhead, and phragmites. Twenty-nine isolated patches of emergents
were also noted, of which 55% contained water lilies and 48% contained spatterdock.

20
DISCUSSION
The current estimate of adult muskie population density (6.9/ac) at Lake Webster
was much higher than the previous estimate (1.5/ac) obtained in 1998 (Pearson 1999),
greater than a recent estimate (1.3/ac) at nearby Loon Lake (Pearson 2005a), far exceeded
the initial management goal of establishing a density of one 30-inch or larger muskie per
acre, and was considerably greater than muskie population densities reported at other
lakes in the nation. For example, most Wisconsin muskie lakes contain less than one
adult per acre (Simonson 2003). Margenau (1999) described a Wisconsin population
consisting of one adult muskie (≥ 30 in) as a high-density population. The number of
adult muskies in 5,650-acre Spirit Lake, Iowa declined from only 711 to 156 in the 1980s
(Larscheid et. al 1999) and the current goal is to maintain a density of only one adult
muskie per 7-10 acres.
Although the estimate of muskie population size was fairly precise (SE = 12%),
its accuracy may be questioned. After high catches the first three days, they declined
throughout the rest of the sampling. The number of recaptured muskies also decreased
and the percentage of recaptured muskies stayed relatively constant, varying from 12-
20% over the second half of the period except on the last day (30%). These factors could
indicate that once captured, tagged muskies were less likely to be recaptured. If the
percentage of tagged muskies captured during 2006 brood stock operations is greater than
16%, the 2005 population was probably overestimated and could be adjusted accordingly.
Regardless of the true size of the population, the fact that 899 individual muskies were
captured indicated Lake Webster contains many more muskies than a typical population.
Despite their high density, muskies continue to grow throughout their life and
growth is comparable to rates reported from other waters. Although muskies in Missouri
and Kentucky reach 30 inches by age-3 (Neuswanger et. al. 1994), they do not reach 30
inches until age-5 in Wisconsin (Simonson 2003). Muskies at Lake Webster were nearly
30 inches long by age-4. In Wisconsin, muskies reach 36 inches during age-7 and 40
inches after age-9, but reach 36 inches at Lake Webster by age-6 and 40 inches by age-7.
Apparently enough forage is available to support the current number of muskies despite
concerns that high densities can lead to excessive predatory demand (Wahl 1999) or
population imbalances (Margenau 1999).

21
As a result of the high density and quality size of muskies in Lake Webster,
muskie fishing interest has increased substantially over the years (Pearson 1987, 1991,
1999). Overall angler effort from April through November increased from 53,051 hours
in 1990 and 43,929 hours in 1998 to 70,829 hours in 2005, mainly due to increased
muskie fishing in spring and fall months. Excluding effort directed at muskies, anglers
fished 32,297 hours in 2005 for other species and their effort was similar to 1998 (29,432
hrs). Fishing effort during June through August varied from 19,952 to 31,651 hours
between 1987 and 1998 and was similar (27,816 hrs) in 2005. The percentage of boat
anglers who targeted muskies increased from 7% in 1987 and 6% in 1990 to 24% in 1998
and 60% in 2005. Like 1998, muskie interest accounted for most of the activity in the fall
months and was lowest in July and August. However, interest in spring muskie fishing
was greater in 2005 (63% of April effort) compared to 1998 (15%). As noted in 1998, a
high percentage of muskie anglers have been satisfied with fishing quality but satisfaction
may have decreased slightly. As many as 89% of muskie anglers rated fishing good and
10% rated fishing fair in 1998, compared to 80% and 15%, respectively, in 2005.
Apparently muskies and increased muskie fishing activity have not reduced the
satisfaction of other anglers who continue to fish at the lake. More bass anglers rated
fishing good in 2005 (57%) than 1998 (37%). Another 57% rated bass fishing fair in
1998 compared to 32% in 2005, so the combined total of satisfied bass anglers was
similar between years (89-94%). Only 6% of bluegill anglers rated fishing poor in 2005
compared to 30% in 1998. A much larger percentage of bluegill anglers considered
fishing good in 2005 (66%) than they did in 1998 (10%). The percentage of crappie
anglers who consider fishing good increased from 18% to 46%.
Although perceptions among anglers were that fishing quality was better in 2005
compared to 1998, anglers may have fished slightly fewer hours in 2005 for fish other
than muskies than they did in 1998 or 1990. However, differences in the way angler
preferences were calculated in 1998 may explain some of the decreases. Nevertheless,
bass accounted for 40% of all fish listed in the responses of anglers in 1998 and 21% of
the responses in 2005. Multiplying these figures by the overall effort each year yielded an
estimate of 17,572 hours of bass fishing in 1998 and 14,874 hours in 2005, a decrease of
15%. Likewise, bluegill effort decreased from 10,982 to 5,666 hours but crappie effort

22
was similar, 2,196 and 2,125 hours. However, more hours were directed at perch in 2005
(3,541) compared to 1998 (878). In 1990, estimates were that bass anglers fished 23,342
hours, bluegill anglers fished 18,037 hours, crappie anglers fished 4,244 hours, and perch
anglers fished 530 hours.
As expected with a build-up of the muskie population and with more anglers
targeting muskies, muskie catches are now greater than ever. Only 268 muskies were
harvested (67) or released (201) by anglers in 1987. Only four were taken in 1990 and
only 86 were caught and released. In 1998 anglers removed only 27 muskies but the
number caught and released (501) increased six-fold over 1990. By 2005, the number of
muskies removed by anglers still remained low (14) but the number caught and released
(2,201) was another four-fold greater. Although many more muskies were caught in
2005, the catch rate (1/23 hrs) of anglers who specifically targeted only muskies was
similar to the catch rate in 1998 (1/25 hrs). These catch rates were also similar to, if not
slightly better than, a 12-year average of one muskie per 27 hours of fishing in Wisconsin
(Simonson 2003). The low harvest figure of 1.8 muskies per 100 acres at Lake Webster
was also nearly identical to a 2001 average of 1.7 muskies per 100 acres in Wisconsin
and probably reflects the impacts of high minimum size limits and a strong catch-and-
release philosophy among muskie anglers.
As muskies catches have increased, harvest of most other species have generally
decreased (Table 15). Largemouth bass harvest decreased from 2,924 fish in 1990 to 210
in 2005, although there was no minimum size limit on bass and a daily creel limit of six
bass was in effect in 1990 compared to a 14-inch size limit and five-bass limit in 2005.
Although fewer bass were harvested, the combined total of bass removed or released in
2005 was 8,485 and approached the combined total of 10,373 in 1990. It exceeded the
combined total of 5,843 in 1998 when a 12-inch limit was in effect. The estimate that
2,555 legal-size bass (≥ 14-in) were released in 2005 may also indicate increased interest
in catch-and-release fishing among bass anglers and could explain some of the decline in
bass harvest, although overall bass catches also declined. Bluegills and sunfish showed
the largest harvest declines in 2005. Although fewer crappies were taken in 2005
compared to 1990 and 1998, even fewer were taken in 1987. In contrast, perch harvest
was greatest in 2005.

23
The economic value of muskie fishing at Lake Webster exceeded the value of
other fishing activity at the lake and the cost of the stocking program. Assuming each
fishing trip was valued at $53 (Fish and Wildlife Service 2002), muskie trips by anglers
who targeted only muskies were worth $339,147, representing 76% of the entire program
cost since its inception and worth more than 10 times the annual cost of stocking
($30,960). This annual benefit:cost ratio was higher than the 4:1 ratio reported at nearby
Loon Lake in 2004 (Pearson 2005a). The additional 683 trips by Lake Webster anglers
who fished for muskies and bass added $36,199 of economic worth. Bass fishing trips by
anglers fishing only for bass were valued at $124,126. Bluegill, crappie, and perch
fishing trips accounted for a total value of $73,140. Since many anglers who fished for
muskies were drawn from a wide geographic area, including out-of-state, the difference
in value of muskie fishing versus fishing for other species may have been even greater.
Although muskies have been stocked in Lake Webster for more than two decades,
there is little evidence to suggest they have altered the fish community at the lake. Based
on standard surveys conducted since 1976, bluegills have consistently ranked first by
number (Table 13). Despite a low catch by anglers, more bluegills were captured in the
2005 fish population survey that any previous survey. Average bluegill weights varied
from 0.06-0.11 pounds with no apparent trend. Although few 7-inch and larger bluegills
were present (Table 14), more 5- to 6½-inch bluegills were captured. More 2- to 3½-inch
bluegills were also collected, indicating muskies stockings, bass regulation changes, and
weed control efforts have probably not affected bluegill reproduction and recruitment.
Crappies have not been abundant at Lake Webster over the years and varied from 3-10%
of the catch by number and averaged 6%. Yellow perch, a preferred prey item for
muskies in Wisconsin (Bozek and Burri 1999), were more abundant prior to the start of
muskie stockings and were at low levels from 1985 through 1995, but have apparently
rebounded in recent years. Gizzard shad, the lake’s dominant non-game prey fish and
routinely found in the stomachs of Lake Webster muskies (personal communication with
local taxidermists), remain the most abundant forage fish by number and weight.
Consequently, the maintenance of an abundant gizzard shad forage base and the increase
in yellow perch numbers offer further evidence that muskie density has not exceeded the
lake’s carrying capacity.

24
The number and weight of bass collected in fish surveys have also been fairly
stable, although spring sampling indicated fewer, but more larger, bass were present in
2005. Bass catches in standard surveys varied from 47-143 and averaged 101 (Table 14).
The number caught in 2005 matched the catch in 1988 and was exceeded only by the
catch of 143 bass in 1995. The weight of bass varied from 40-73 pounds and averaged 56
pounds with no apparent trend over time. In contrast (Figure 5), density of 8-inch and
larger bass in 2005 based on spring electrofishing was half (5/ac) of what was present in
1990 (10/ac). Catch rates of 8-inch and larger bass also decreased from 92 to 44 per hour.
Density and catch rate of 8- to 11½-inch bass dropped 61%, while density and catch rate
of 12- to 13½-inch bass declined by over 50%. Among larger size groups however,
density and electrofishing catch rates increased but remained low. Density increased 9%
and catch rate increased 7% among 14- to 17½-inch bass and 67% and 64%, respectively,
among 18-inch and larger bass. The combined number of bass less than 14 inches
decreased from 7,219 in 1990 to 2,889 in 2005, while the number of 14-inch and larger
bass increased from 808 to 961. Although these figures represented only two years of
more than two decades of muskie management at Lake Webster, lower overall bass
densities but better size structure and greater densities of large bass were noted recently at
other Indiana lakes where muskies (Pearson 2005a) and walleyes (Pearson 2005b) were
stocked. Furthermore, despite the buildup of the muskie population at Lake Webster and
potential risk to fishing for native species, the angler catch rate of bass doubled from
0.3/hour in 1998 to 0.6/hour in 2005 and should alleviate some concerns that muskie
predation has reduced bass survival or adversely affected bass fishing.
SUMMARY AND RECOMMENDATIONS
To reiterate the summary from the 1998 study (Pearson 1999) in light on new
information obtained in 2005, Lake Webster continues to support a high-quality muskie
fishery that not only draws a substantial number of muskie anglers from a wide area but
also provides high-quality muskie fishing experiences. The stocking program, coupled
with more restrictive largemouth bass fishing regulations and changes in aquatic plant
management, has had no significant adverse effects on the native fish community. No
changes in current management strategies are needed or recommended.

25
REFERENCES
Bozek, M. A. and T. H. Burri. 1999. Diets of muskellunge in northern Wisconsin lakes. North American Journal of Fisheries Management 19:258-270. Fish and Wildlife Service. 2002. The 2001 national survey of fishing, hunting, and wildlife-associated recreation: Indiana. U. S. Interior Department and Commerce Department, Washington, DC Larscheid, J., J. Christianson, T. Gengerke, and W. Jorgensen, 1999. Survival, growth, and abundance of pellet-reared and minnow-reared muskellunge stocked in northwestern Iowa. North American Journal of Fisheries Management 19:230-237. Margenau, T. L. 1999. Muskellunge stocking strategies in Wisconsin: the first century and beyond. North American Journal of Fisheries Management 19:223-229. Neuswanger, D. J., A. S. Stephen, M. S. Kruse, R. Meade, V. C. Suppes. 1994. Muskellunge in Missouri: a 10-year strategic plan for program management. Missouri Department of Conservation, Jefferson City, MO Pearson, J. 1987. Muskie fishing interest and harvest at Lake Webster. Indiana Division of Fish and Wildlife, Indianapolis, IN Pearson, J. 1991. Abundance, angler utilization and impacts of muskellunge at Lake Webster. Indiana Division of Fish and Wildlife, Indianapolis, IN Pearson, J. 1999. Muskellunge population characteristics at Lake Webster, Indiana. Indiana Division of Fish and Wildlife, Indianapolis, IN Pearson, J. 2005a. Impacts of predator management on bluegill fishing at Loon Lake, Indiana. Indiana Division of Fish and Wildlife, Indianapolis, IN Pearson, J. 2005b. Largemouth bass density and size structure in large Indiana natural lakes. Project 202068 progress report. Indiana Division of Fish and Wildlife, Indianapolis, IN Simonson, T. 2003. Muskellunge management update. Wisconsin Department of Natural Resources, Madison, WI Wahl, D. H. 1999. An ecological context for evaluating the factors that influence muskellunge stocking success. North American Journal of Fisheries Management 19:238-248. Submitted by: Jed Pearson, fisheries biologist January 31, 2006 Approved by: ___________________________ Stu Shipman, regional supervisor

26
Table 1. Number, size and source of muskellunge stocked at Lake Webster from 1978
through 2005.
Year Number Inches Source 1978 48,483 fry Pennsylvania 1981 350 10-12 Muskies, Inc 1982 1,622 8-17 mixed sources 1983 300 10-12 Muskies, Inc 1984 3,240 6-11 DFW ponds 1985 350 10-12 Muskies, Inc 1986 860 7-13 DFW ponds 1987 0 --- --- 1988 3,294 5-8 DFW mixed 1989 1,760 7-9 Fawn River 1990 1,702 9-12 Fawn River 1991 3,144 8.5-11.5 Fawn River 1992 1,386 8-11 Fawn River 1993 1,009 7.5-9.5 Fawn River 1994 836 6.5-11 Fawn River 1995 2,370 7.5-9.5 Fawn River 1996 0 --- --- 1997 2,746 7-10 Fawn River 1998 3,870 8.5-11.5 Fawn River 1999 3,870 9.5-12 Fawn River 2000 3,870 9.5-13 Fawn River 2001 3,870 7.5-13 Fawn River 2002 3,870 8-12 Fawn River 2003 3,870 7-10.5 Fawn River 2004 3,994 8-11.5 Fawn River 2005 3,876 7.5-12 Fawn River
27
Table 2. Oxygen levels (ppm) and water clarity (secchi depth in ft) at Lake Webster from 1976 through 2005 (source - Division of Fish and Wildlife files).
Depth (ft) 7/1976 7/1985 7/1988 7/1990 7/1995 7/1998 7/2005 0 8.0 7.0 8.0 9.0 9.0 8.0 7.4 5 8.2 7.0 8.0 9.0 9.0 8.0 7.2 10 8.0 7.0 8.0 8.0 2.5 8.0 7.1 15 5.6 5.0 5.0 8.0 4.0 6.0 2.2 20 0.4 1.5 1.0 4.0 0.8 0.4 0.5 25 0.0 trace 0.6 2.0 1.2 0.4 0.4 30 0.0 trace 0.6 0.0 0.0 1.0 0.3 35 0.0 0.0 0.0 0.0 0.0 trace 0.3 Clarity (ft) 5.0 4.5 5.0 3.3 4.0 3.5 8.5
28
Table 3. Daily water temperature (F) and the number of muskies captured per day at
various trapping sites (#1-#12) at Lake Webster, spring 2005.
Date F 1 2 3 4 5 6 7 8 9 10 11 12 TOTAL Mar 29 -- 18 0 8 31 24 - - - - - - - 81 Mar 30 41 46 - 10 35 40 16 18 - - - - - 165 Mar 31 47 72 - 15 20 18 8 26 - - - - - 159 Apr 1 44 28 - - 28 9 - 6 - - - - - 71 Apr 3 45 37 - - 57 - - - - - - - - 94 Apr 4 47 9 - - 19 - - - - - - - - 28 Apr 5 50 - - - 21 - - - 8 15 - - - 44 Apr 6 53 - - - 38 - - - 25 21 15 - - 99 Apr 7 54 - - - 24 - 6 - 7 18 8 - - 63 Apr 8 56 - - - 10 - 0 - - 20 6 6 - 42 Apr 9 55 - - - 8 - 2 - - 12 7 1 - 30 Apr 11 57 - - - 4 13 2 - - 17 9 - - 45 Apr 12 53 - - - 4 4 2 - - 10 7 - - 27 Apr 13 49 - - - - - 3 - - 1 0 - 6 10 Apr 14 51 - - - - - - - - 7 4 - 2 15 TOTAL 210 0 33 299 108 39 50 40 121 56 7 8 971

29
Table 4. Daily water temperature (F), number of muskies caught (C), muskie deaths (D),
marked muskies at large (M), recaptured muskies (R), muskies transported to Fawn River
(T), muskies shipped back for release (S), untagged muskies released (U), Schnabel
population estimate (N), and standard error (SE) at Lake Webster, spring 2005.
Date F C D M R T S U C*M N SE Mar 29 --- 81 0 0 0 0 0 0 0 --- --- Mar 30 41 165 6 81 1 0 0 0 13365 6683 4725 Mar 31 47 159 5 239 1 0 0 0 38001 17122 9885 Apr 1 44 71 0 392 2 0 0 0 27832 15840 7084 Apr 2 traps not checked Apr 3* 45 94 3 461 9 0 0 0 43334 8752 2339 Apr 4 47 28 0 543 2 0 0 0 15204 8609 2152 Apr 5 50 44 2 569 3 0 0 0 25036 8567 1965 Apr 6 53 99 7 608 12 19 0 6 60192 7192 1292 Apr 7 54 63 2 663 10 22 15 0 41769 6457 1008 Apr 8 56 42 3 707 8 20 19 0 29694 6009 858 Apr 9 55 30 1 737 5 15 20 0 22110 5862 798 Apr 10 traps not checked Apr 11* 57 45 4 766 9 21 17 0 34470 5572 702 Apr 12 53 27 5 794 4 14 18 0 21438 5559 679 Apr 13 49 10 0 816 2 8 20 0 8160 5516 664 Apr 14 51 13 2 836 4 0 1 0 10868 5363 628 Apr 15 --- --- --- --- --- --- 8 --- --- --- --- TOTAL 971 40 844 72 119 118 6 5363 628 *numbers represent a two-day catch.
30
Table 5. Age frequency distribution of muskies per half-inch and the estimated number of
muskies present in Lake Webster per age per half-inch in spring 2005.
Age Estimate number/age
Inch 3 4 5 6 7 8 9 10 Rays 3 4 5 6 7 8 9 10 Sum
23.5 2 2 12 0 0 0 0 0 0 0 12
24.0 4 1 5 19 5 0 0 0 0 0 0 24
24.5 3 2 5 18 12 0 0 0 0 0 0 30
25.0 7 2 9 51 15 0 0 0 0 0 0 66
25.5 5 2 7 43 17 0 0 0 0 0 0 60
26.0 7 1 1 9 47 7 7 0 0 0 0 0 60
26.5 1 7 1 9 13 89 13 0 0 0 0 0 114
27.0 5 4 9 67 53 0 0 0 0 0 0 120
27.5 6 2 2 10 58 19 19 0 0 0 0 0 96
28.0 4 5 1 10 62 78 16 0 0 0 0 0 156
28.5 6 3 9 0 92 46 0 0 0 0 0 138
29.0 1 5 2 1 9 27 133 53 27 0 0 0 0 240
29.5 10 10 0 228 0 0 0 0 0 0 228
30.0 11 11 0 348 0 0 0 0 0 0 348
30.5 10 2 12 0 195 39 0 0 0 0 0 234
31.0 10 10 0 306 0 0 0 0 0 0 306
31.5 8 2 10 0 197 49 0 0 0 0 0 246
32.0 5 5 10 0 93 93 0 0 0 0 0 186
32.5 4 5 1 10 0 93 117 23 0 0 0 0 234
33.0 2 4 2 8 0 55 111 55 0 0 0 0 222
33.5 2 4 3 9 0 51 101 76 0 0 0 0 228
34.0 1 7 2 10 0 23 164 47 0 0 0 0 234
34.5 1 5 4 10 0 20 102 81 0 0 0 0 204
35.0 7 4 11 0 0 99 57 0 0 0 0 156
35.5 7 3 1 11 0 0 80 34 11 0 0 0 126
36.0 1 7 8 0 0 25 173 0 0 0 0 198
36.5 3 4 1 8 0 0 49 66 16 0 0 0 132
37.0 4 4 1 9 0 0 56 56 14 0 0 0 126
37.5 1 4 3 8 0 0 16 63 47 0 0 0 126
38.0 2 5 1 8 0 0 25 64 13 0 0 0 102
38.5 3 5 8 0 0 0 31 52 0 0 0 84
39.0 3 6 9 0 0 0 30 60 0 0 0 90
39.5 5 4 9 0 0 0 30 24 0 0 0 54
40.0 2 9 11 0 0 0 13 59 0 0 0 72
40.5 1 1 2 0 0 0 6 6 0 0 0 12
41.0 4 1 5 0 0 0 0 24 6 0 0 30
41.5 1 2 3 0 0 0 6 12 0 0 0 18
42.0 5 5 0 0 0 0 36 0 0 0 36
42.5 1 1 2 0 0 0 0 15 15 0 0 30
43.0 2 2 4 0 0 0 0 6 6 0 0 12
43.5 1 1 2 0 0 0 0 6 6 0 0 12
44.0 1 3 4 0 0 0 0 6 18 0 0 24
44.5 2 2 0 0 0 0 0 24 0 0 24
45.0 1 1 0 0 0 0 0 18 0 0 18
45.5 1 1 0 0 0 0 0 6 0 0 6
46.0 5 5 0 0 0 0 0 60 0 0 60
46.5 1 1 0 0 0 0 0 12 0 0 12
47.0 1 1 0 0 0 0 0 6 0 0 6
47.5 1 1 0 0 0 0 0 6 0 0 6
49.0 1 1 0 0 0 0 0 0 0 6 6
50.5 1 1 0 0 0 0 0 0 0 6 6
45 101 69 59 48 20 0 2 344 416 2127 1279 938 408 183 0 12 5363

31
Table 6. Length distribution of largemouth bass captured (Catch) and recaptured (Recaps)
at Lake Webster in spring 2005 (catch does not include recaptured fish).
04/25/05 04/25/05 05/02/05 05/02/05 05/09/05 05/09/05 05/16/05 05/16/05 Total Total
Inches Catch Recap Catch Recap Catch Recap Catch Recap Catch Percent Recaps Percent
<=3 0 0 1 0 0 0 0 0 1 0.07 0 0.00
3.5 0 0 0 0 1 0 1 0 2 0.13 0 0.00
4.0 0 0 5 0 8 0 12 0 25 1.66 0 0.00
4.5 4 0 5 0 7 0 28 1 44 2.92 1 0.68
5.0 4 0 9 0 10 1 31 1 54 3.58 2 1.36
5.5 4 0 11 0 4 0 19 0 38 2.52 0 0.00
6.0 4 0 2 0 5 0 3 0 14 0.93 0 0.00
6.5 4 0 2 0 1 0 6 1 13 0.86 1 0.68
7.0 25 0 27 0 16 1 31 5 99 6.57 6 4.08
7.5 49 0 40 1 31 5 77 13 197 13.07 19 12.93
8.0 33 0 32 1 32 3 29 5 126 8.36 9 6.12
8.5 16 0 26 1 14 3 31 5 87 5.77 9 6.12
9.0 33 0 18 5 19 2 19 7 89 5.91 14 9.52
9.5 17 0 15 0 19 4 36 8 87 5.77 12 8.16
10.0 20 0 19 1 22 6 19 6 80 5.31 13 8.84
10.5 21 0 10 4 22 3 16 2 69 4.58 9 6.12
11.0 19 0 15 2 17 3 15 0 66 4.38 5 3.40
11.5 6 0 11 1 17 2 10 4 44 2.92 7 4.76
12.0 10 0 6 1 10 2 12 3 38 2.52 6 4.08
12.5 8 0 12 0 5 2 7 1 32 2.12 3 2.04
13.0 6 0 5 0 6 1 4 0 21 1.39 1 0.68
13.5 7 0 8 0 5 2 3 1 23 1.53 3 2.04
14.0 6 0 6 1 8 1 2 2 22 1.46 4 2.72
14.5 8 0 8 0 4 1 7 0 27 1.79 1 0.68
15.0 7 0 2 0 9 1 9 0 27 1.79 1 0.68
15.5 3 0 9 0 9 2 6 0 27 1.79 2 1.36
16.0 3 0 9 1 10 3 5 2 27 1.79 6 4.08
16.5 4 0 4 0 9 0 6 2 23 1.53 2 1.36
17.0 7 0 3 0 7 1 3 1 20 1.33 2 1.36
17.5 7 0 4 0 10 2 4 0 25 1.66 2 1.36
18.0 4 0 6 1 3 0 1 0 14 0.93 1 0.68
18.5 6 0 7 0 5 2 3 1 21 1.39 3 2.04
19.0 5 0 3 0 5 1 3 2 16 1.06 3 2.04
19.5 0 0 1 0 1 0 1 0 3 0.20 0 0.00
20.0 1 0 1 0 1 0 0 0 3 0.20 0 0.00
20.5 0 0 0 0 1 0 0 0 1 0.07 0 0.00
21.0 1 0 0 0 0 0 0 0 1 0.07 0 0.00
21.5 0 0 0 0 0 0 0 0 0 0.00 0 0.00
>=22 0 0 0 0 1 0 0 0 1 0.07 0 0.00
Total 352 0 342 20 354 54 459 73 1507 147
Seconds 22927 22236 24217 23620 93000
<8 94 0 102 1 83 7 208 21 487 29
8-11.5 165 0 146 15 162 26 175 37 648 78
12-13.5 31 0 31 1 26 7 26 5 114 13
14-17.5 45 0 45 2 66 11 42 7 198 20
>=18 17 0 18 1 17 3 8 3 60 7

32
Table 7. Nightly electrofishing effort in hours (H), catches (C), marked bass at large (M),
recaptures (R), Schnabel population estimate (N), and standard error (SE) of 8-inch
and larger largemouth bass in Lake Webster and the Backwater Area during April-May
2005.
Date H C M R N SE 4/25/05 6.37 258 0 0 0 0 5/02/05 6.18 259 258 19 3,341 747 5/09/05 6.73 318 498 47 3,361 411 5/16/05 6.56 303 769 52 3,850 353

33
Table 8. Mean daily counts of boat anglers (meanB), shore anglers (meanS), length of a
fishing day (Hrs/day), fishing days per month (Day/m), estimated hours fished by boat
anglers (BoatHrs) and shore anglers (ShoreHrs), and total angling effort (TotalHrs) on
weekend (we) and weekdays (wd) per month at Lake Webster, April through November
2005.
Month Wky MeanB MeanS Hrs/d Day/m BoatHrs ShoreHrs TotalHrs
Apr we 41.42 4.00 12 8 3976 384 4360
Apr wd 12.36 0.88 12 20 2967 211 3179
May we 38.15 2.82 14 10 5340 395 5736
May wd 16.89 1.42 14 21 4965 417 5381
Jun we 29.89 4.00 16 8 3826 512 4338
Jun wd 16.27 2.20 16 22 5726 774 6500
Jul we 22.31 2.82 16 11 3926 497 4423
Jul wd 12.01 2.32 16 20 3844 741 4585
Aug we 28.92 2.33 16 8 3701 299 4000
Aug wd 9.58 1.21 16 23 3527 444 3970
Sep we 27.21 1.96 14 9 3428 247 3675
Sep wd 13.76 0.37 14 21 4044 109 4154
Oct we 51.89 0.64 12 10 6227 77 6304
Oct wd 16.91 0.36 12 21 4262 92 4353
Nov we 30.29 0.38 12 8 2907 37 2944
Nov wd 10.96 0.13 12 22 2892 35 2927
Sum 65559 5270 70829
Apr 6943 595 7539
May 10305 812 11117
Jun 9552 1286 10838
Jul 7770 1238 9008
Aug 7228 742 7970
Sep 7472 356 7829
Oct 10489 169 10657
Nov 5800 72 5871
Sum 65559 5270 70829
Weekends 33333 2447 35780
Weekdays 32226 2824 35049

34
Table 9. Number of interviewed angler parties who fished for various species or
combinations of various species at Lake Webster per month from April through
November 2005.
Species Apr May Jun Jul Aug Sep Oct Nov Total
Anything 12 40 47 48 42 26 11 3 229
Bass 27 30 56 90 103 48 26 380
Bass-muskie 10 20 16 21 10 12 12 4 105
Bass-perch 2 2
Bluegill 4 20 18 20 13 6 2 83
Bluegill-bass 1 10 1 3 15
Bluegill-bass-muskie 1 1
Bluegill-crappie 1 4 2 4 1 12
Bluegill-crappie-perch 6 6
Bluegill-muskie 1 2 3 1 4 11
Bluegill-perch 1 1 13 21 4 7 2 49
Bluegill-sunfish 5 3 8
Crappie 34 1 1 2 2 1 41
Crappie-bass 1 1
Crappie-muskie 2 2 4
Crappie-perch 1 1
Muskie 164 220 113 70 79 138 233 188 1205
Muskie-perch 2 1 2 1 6
Muskie-sunfish 1 1
Others 1 1 1 3
Perch 6 1 5 14 10 9 3 48
Sunfish 2 2
Sunfish-perch 1 1 2
Total 262 339 277 301 279 257 301 199 2215
35
Table 10. Observed harvest of bluegills (BG), crappies (CR), sunfish (SF), perch (YP),
other fish (OT), muskies (M), unmarked largemouth bass (UNMK) and marked
largemouth bass (MRKD), number of sub-legal bass (<14 in) released (R<14), number of
legal-size bass (R>14) released, number of sub-legal muskies (R<36) released, number of
legal muskies (R>36) released, accumulated interview hours (Int hrs), estimated fishing
hours (Fish Hrs), and expansion factors (ExpF) used to estimate total harvest and releases
by boat and shore anglers (B/S), fishing on weekends (we) or weekdays (wd), for the
creel survey at Lake Webster from April through November 2005.
Month Wkdy B/S BG CR SF YP OT MUS UNMK MRKD R<14 R>14 R<36 R>36 Int Hrs Fish Hrs ExpF
Apr we b 0 0 0 18 0 0 0 0 8 7 6 15 631.63 3976.00 6.29
Apr we s 0 0 0 13 0 0 0 0 2 0 2 0 60.63 384.00 6.33
Apr wd B 4 126 0 21 0 2 5 0 27 17 37 17 1153.80 2967.14 2.57
Apr wd s 3 15 0 0 0 0 0 0 0 5 0 0 45.63 211.43 4.63
May we b 63 0 0 25 0 0 0 0 9 13 37 21 1329.03 5340.42 4.02
May we s 12 0 0 5 0 0 0 0 2 1 0 1 70.33 395.21 5.62
May wd b 88 0 5 5 0 0 2 0 55 18 62 27 1634.73 4964.75 3.04
May wd s 60 0 0 8 0 0 0 0 1 1 2 1 112.10 416.50 3.72
Jun we b 95 0 3 33 0 0 5 0 145 68 8 3 753.98 3825.78 5.07
Jun we s 21 0 2 5 0 0 0 0 2 0 0 0 82.88 512.00 6.18
Jun wd b 164 1 0 60 0 0 5 2 46 44 35 12 1157.42 5725.87 4.95
Jun wd s 33 0 1 2 0 0 0 0 6 13 1 0 104.15 774.40 7.44
Jul we b 20 0 3 34 0 0 6 0 151 88 20 1 661.98 3926.48 5.93
Jul we s 27 0 4 9 0 0 0 1 3 2 0 0 47.65 496.57 10.42
Jul wd b 190 1 25 165 0 1 6 2 132 66 9 5 948.98 3843.56 4.05
Jul wd s 60 0 0 9 0 0 0 0 5 3 0 0 107.02 741.33 6.93
Aug we b 10 1 20 59 1 0 0 0 272 100 4 3 764.58 3701.33 4.84
Aug we s 4 0 0 18 0 0 0 0 0 0 0 0 71.35 298.67 4.19
Aug wd b 29 2 4 87 0 0 5 0 104 34 22 7 1047.67 3526.67 3.37
Aug wd s 22 0 0 19 0 0 0 0 9 4 0 0 78.27 443.76 5.67
Sep we b 22 0 0 107 0 0 2 1 121 21 4 2 915.80 3428.25 3.74
Sep we s 7 0 0 0 0 0 0 0 2 0 0 0 43.55 246.75 5.67
Sep wd b 66 0 7 211 0 0 4 0 60 15 28 7 1284.98 4044.13 3.15
Sep wd s 1 0 0 1 0 0 0 0 0 0 0 0 4.27 109.43 25.65
Oct we b 2 0 31 87 4 1 0 0 57 8 26 26 1184.97 6227.14 5.26
Oct we s 0 0 0 0 0 0 0 0 0 0 0 0 4.33 77.14 17.80
Oct wd b 19 0 9 177 0 0 2 0 23 6 27 23 1362.92 4261.50 3.13
Oct wd s 0 0 0 0 0 0 0 0 8 2 0 0 6.70 91.50 13.66
Nov we b 0 0 0 0 0 0 0 0 0 0 6 14 962.47 2907.43 3.02
Nov we s 0 0 0 8 0 0 0 0 0 0 0 0 0.77 36.57 47.70
Nov wd b 0 0 0 0 0 0 2 0 1 0 30 30 1048.58 2892.27 2.76
Nov wd s 0 0 0 0 0 0 0 0 0 0 0 0 2.22 35.20 15.88

36
Table 11. Size distribution of fish taken by anglers each month at Lake Webster from
April through November 2005.
Inches Apr May Jun Jul Aug Sep Oct Nov Total Percent Harvest
Bluegill
5.0 0 9 3 1 0 17 1 0 31 3.3 157
5.5 0 14 13 2 2 13 3 0 47 5.0 238
6.0 2 37 73 59 15 16 5 0 207 21.8 1047
6.5 2 40 87 92 20 11 9 0 261 27.5 1320
7.0 1 32 64 74 5 11 2 0 189 19.9 956
7.5 2 29 47 58 0 5 0 0 141 14.9 713
8.0 0 23 17 14 0 4 0 0 58 6.1 293
8.5 0 13 1 0 0 0 0 0 14 1.5 71
9.0 0 0 1 0 0 0 0 0 1 0.1 5
4801
Crappie
6.0 7 0 0 0 0 0 0 0 7 6.3 26
6.5 8 0 0 1 0 0 0 0 9 8.0 33
7.0 28 0 0 0 0 0 0 0 28 25.0 104
7.5 23 0 0 0 0 0 0 0 23 20.5 85
8.0 12 0 0 0 0 0 0 0 12 10.7 44
8.5 10 0 0 0 0 0 0 0 10 8.9 37
9.0 5 0 1 0 0 0 0 0 6 5.4 22
9.5 7 0 0 0 0 0 0 0 7 6.3 26
10.0 8 0 0 0 1 0 0 0 9 8.0 33
10.5 0 0 0 0 0 0 0 0 0 0.0 0
11.0 0 0 0 0 0 0 0 0 0 0.0 0
11.5 0 0 0 0 0 0 0 0 0 0.0 0
12.0 0 0 0 0 0 0 0 0 0 0.0 0
12.5 0 0 0 0 1 0 0 0 1 0.9 4
414
Sunfish
5.0 0 1 0 0 0 0 0 0 1 1.4 8
5.5 0 0 0 1 1 0 1 0 3 4.3 23
6.0 0 1 2 9 5 0 5 0 22 31.4 168
6.5 0 0 0 19 3 3 3 0 28 40.0 214
7.0 0 3 1 3 2 2 0 0 11 15.7 84
7.5 0 0 1 0 1 2 0 0 4 5.7 31
8.0 0 0 1 0 0 0 0 0 1 1.4 8

37
Table 11. Continued.
Inches Apr May Jun Jul Aug Sep Oct Nov Total Percent Harvest
Unmarked Bass
14.0 1 1 2 0 1 1 0 0 6 19.4 34
14.5 0 1 2 0 0 1 0 0 4 12.9 23
15.0 0 0 2 2 0 0 1 1 6 19.4 34
15.5 0 0 0 0 1 0 0 0 1 3.2 6
16.0 0 0 0 1 0 0 1 0 2 6.5 11
16.5 0 0 0 0 0 0 0 1 1 3.2 6
17.0 1 0 1 2 1 0 0 0 5 16.1 29
17.5 0 0 0 1 0 0 0 0 1 3.2 6
18.0 0 0 1 0 0 0 0 0 1 3.2 6
18.5 0 0 0 1 0 1 0 0 2 6.5 11
19.0 0 0 1 0 0 0 0 0 1 3.2 6
19.5 0 0 0 0 0 0 0 0 0 0.0 0
20.0 0 0 1 0 0 0 0 0 1 3.2 6
178
Marked Bass
14.0 0 0 1 0 0 1 0 0 2 28.6 9
14.5 0 0 0 0 0 0 0 0 0 0.0 0
15.0 0 0 0 0 0 0 0 0 0 0.0 0
15.5 0 0 0 1 0 0 0 0 1 14.3 5
16.0 0 0 0 0 0 0 0 0 0 0.0 0
16.5 0 0 0 0 0 0 0 0 0 0.0 0
17.0 0 0 0 0 0 0 0 0 0 0.0 0
18.0 0 0 1 0 0 0 0 0 1 14.3 5
18.5 0 1 0 1 0 0 0 0 2 28.6 9
19.0 0 0 0 1 0 0 0 0 1 14.3 5
32
Perch
5.0 0 14 0 0 6 11 6 0 37 3.0 154
5.5 0 3 0 0 5 14 9 0 31 2.5 129
6.0 8 3 19 1 7 21 33 0 92 7.4 383
6.5 9 5 27 26 31 39 106 0 243 19.4 1011
7.0 15 6 28 42 37 96 52 2 278 22.2 1156
7.5 13 5 12 70 31 75 46 3 255 20.4 1061
8.0 2 2 8 43 20 33 41 8 157 12.5 653
8.5 0 3 2 13 6 17 24 8 73 5.8 304
9.0 0 0 2 6 4 1 22 6 41 3.3 171
9.5 0 1 0 0 1 2 15 2 21 1.7 87
10.0 1 0 0 2 4 6 3 0 16 1.3 67
10.5 1 1 0 0 2 1 0 0 5 0.4 21
11.0 0 0 0 0 1 0 0 0 1 0.1 4
11.5 0 0 0 0 0 1 0 0 1 0.1 4
5203
Muskie
36.0 1 0 0 1 0 0 0 0 2 50.0 7
38.0 1 0 0 0 0 0 0 0 1 25.0 4
48.0 0 0 0 0 0 0 1 0 1 25.0 4
14

38
Table 12. Number of interviewed anglers parties who rated fishing as fair, good or poor
based on their species preference at Lake Webster from April through November 2005.
Species Good Fair Poor Total
Anything 122 88 19 229
Bass 218 120 42 380
Bass-muskie 66 26 13 105
Bass-perch 1 1 2
Bluegill 55 23 5 83
Bluegill-bass 8 6 1 15
Bluegill-bass-muskie 1 1
Bluegill-crappie 5 4 3 12
Bluegill-crappie-perch 3 3 6
Bluegill-muskie 5 4 2 11
Bluegill-perch 32 15 2 49
Bluegill-sunfish 2 4 2 8
Crappie 19 10 12 41
Crappie-bass 1 1
Crappie-muskie 1 2 1 4
Crappie-perch 1 1
Muskie 966 177 60 1203
Muskie-perch 5 1 6
Muskie-sunfish 1 1
Others 2 1 3
Perch 36 10 2 48
Sunfish 1 1 2
Sunfish-perch 2 2
Total 1551 494 165 2213

39
Table 13. Number and weight of fish collected during standard fish population surveys at
Lake Webster from 1976 through 2005.
Number
Species 1976 1985 1988 1990 1995 1998 2005 Bass 72 115 123 47 143 86 123 Bluegills 667 755 847 611 882 1,148 1,381 Bullheads 103 117 45 72 42 52 77 Crappies 69 131 49 130 63 101 65 Muskies 0 3 1 0 6 0 5 Perch 183 20 36 43 10 108 218 Pike 0 0 0 0 0 0 0 Redear 117 32 18 30 26 54 46 Other sunfish 66 63 48 34 47 39 100 Carp 18 18 3 1 4 2 1 Chubsuckers 15 4 2 7 0 0 2 Gar 15 12 9 13 8 6 6 Shad 273 182 65 310 119 174 154 Shiners 18 11 0 2 0 3 19 Others 22 11 15 10 35 10 8 Total 1,638 1,474 1,261 1,310 1,385 1,783 2,205
Pounds
Species 1976 1985 1988 1990 1995 1998 2005 Bass 39.5 62.5 72.9 41.8 64.4 64.0 45.8 Bluegills 55.5 72.6 54.4 64.5 71.5 116.7 113.0 Bullheads 67.8 66.3 33.2 46.6 19.9 31.9 40.9 Crappies 13.7 25.5 5.4 31.3 19.6 29.3 13.2 Muskies 0.0 7.0 3.8 0.0 27.0 0.0 38.7 Perch 7.0 1.8 3.8 7.0 1.7 16.8 37.2 Pike 0.0 0.0 0.0 0.0 0.0 0.0 0.0 Redear 23.1 5.1 2.8 5.6 4.1 8.9 8.9 Other sunfish 5.9 4.2 4.2 4.2 2.4 4.9 10.5 Carp 127.9 94.2 24.5 5.0 39.4 18.5 10.1 Chubsuckers 2.0 0.7 0.8 2.2 0.0 0.0 0.2 Gar 35.9 21.6 17.2 57.7 26.3 16.9 9.1 Shad 183.7 73.7 41.2 77.2 49.9 60.9 48.0 Shiners 1.6 1.1 0.0 0.2 0.0 0.4 1.6 Others 33.3 20.4 1.5 29.1 15.5 1.6 6.7 Total 596.9 456.7 265.7 372.4 341.7 370.8 383.8 Sampling gear and effort Electro-hours (ac) 3.00* 1.00 --- --- --- --- --- Electro-hours (dc) --- 1.25 1.00** 0.50 0.75 1.00 1.00 Gill net lifts 12 12 8 6 6 6 8 Trap net lifts 0 11 8 8 7 6 4 *includes 90 minutes of electrofishing during the day and 90 minutes at night. **includes 15 minutes when only bass were captured.

40
Table 14. Number of bluegills collected per size interval during standard fish population surveys at Lake Webster from 1976 through 2005. Inches 1976 1985 1988 1990 1995 1998 2005 1-1.5 3 0 0 2 0 2 11 2-2.5 50 9 17 3 68 245 373 3-3.5 80 25 127 40 166 172 225 4-4.5 115 200 296 83 196 61 87 5-5.5 201 356 266 305 289 198 328 6-6.5 192 146 138 169 150 404 354 7-7.5 26 19 3 9 13 64 3 8-8.5 0 0 0 0 0 1 0 Total 667 755 847 611 882 1,147 1,381 Mean (in) 4.7 4.9 4.5 5.0 4.4 4.5 4.0

41
Table 15. Estimated number of fish of various species taken by anglers during surveys
conducted at Lake Webster in 1987 (summer only), 1990, 1998 and 2005.
Species 1987 1990 1998 2005
Bass 616 2,924 600 210
Bluegills 11,313 37,566 13,859 4,801
Crappies 287 4,223 2,506 414
Muskies 67 4 27 14
Perch 1,125 2,865 1,946 5,203
Sunfish 1,308 4,010 1,174 534
Others 0 234 188 26
TOTAL 14,716 51,816 20,300 11,202
Hours fished 19,952 53,051 43,929 70,829
Bass released na 7,449 5,243 2,555
Muskies released 201 86 501 2,201

42
Figure 1. Locations and trap number of muskellunge trapping sites at Lake Webster
during spring 2005.

43
Figure 2. Number of muskies captured (gray columns) and recaptured (dark columns) per
size interval (inches) at Lake Webster, spring 2005.
0
10
20
30
40
50
60
24 26 29 31 34 36 39 41 44 46 51
Inches
Number

44
Figure 3. Number of largemouth bass captured (gray columns) and recaptured (dark
columns) per size interval (inches) at Lake Webster, spring 2005.
0
50
100
150
200
250
3 6 9 12 15 18 21
Inches
Number

45
Figure 4. Indiana counties of origin of muskie anglers who fished at Lake Webster in 2005.
Numbers represent the number of angler parties.

46
Figure 5. Locations (large circles) and rake scores (1-5) where curly-leaf pondweed was detected
at Lake Webster in May and July 2005 and where coontail and Eurasian water milfoil were
detected in July 2005. Small circles represent other sample sites.
Curly-leaf pondweed locations (May 2005) Curly-leaf pondweed locations (July 2005)
Coontail locations (July 2005) Eurasian water milfoil locations (July 2005)

47
Figure 5. Density (N/ac) and mean nightly electrofishing catch rates (N/hr) of four size categories
of largemouth bass at Lake Webster in spring 1990 (light columns) and 2005 (dark columns).
Density
Catch rates
0
1
2
3
4
5
6
7
8
9
8-11.5" 12-13.5" 14-17.5" 18+"
Size category (inches)
0
10
20
30
40
50
60
70
80
8-11.5" 12-13.5" 14-17.5" 18+"
Size category (inches)

48
FISH SURVEY REPORT Type of survey
Indiana Division of Fish and Wildlife Initial: Re-survey: X
Lake name County Date of survey (Month, day, year)
Lake Webster Kosciusko 7/18 - 7/21/05Biologist's name Date of approval (Month, day, year)
Jed Pearson
LOCATION
Quadrangle name Range Section
North Webster 7E 1,2,10-15,24Township Nearest town
33N North Webster
ACCESSIBILITY
State owned public access site Privately owned public access site Other access site
On Backwater Lake Marina on east shoreSurface acres Maximum depth (ft) Average depth (ft) Acre feet Water level (msl) Extreme fluctuations (ft)
774 52 12.3 7,165 840.7
INLETS
Name Location Origin
Tippecanoe River Backwater Lake - east side Crooked Lake
Gaff Ditch Backwater Lake - south end Runoff
Two unnamed ditches Northeast corner Tri-County FWA, runoff
OUTLET
Name Location
Tippecanoe River Southeast corner - flows to James Lake (Little Tippecanoe)Water level control
Concrete damPOOL ELEVATION (Feet MSL) ACRES Bottom type
TOP OF DAM
Boulder
TOP OF FLOOD CONTROL POOL Gravel
Sand XTOP OF CONSERVATION POOL Muck X
Clay
TOP OF MINIMUM POOL Marl
STREAMBED
Watershed use
General farming, woodlots and wetlands, residentialDevelopment of shoreline
Nearly all of the shoreline is developed. Less development has occurred in Backwater Area.
Previous surveys and investigations
Fish surveys,DNR,1976,1985,1988,1990,1995,1998;Angler surveys,DNR,1987,1990,1998;Muskie surveys,
DNR,1982-84,1998;Bass sampling,DNR,1990;Plant sampling,DNR,2003,2004.

49
SAMPLING EFFORT
ELECTROFISHING Day hours Night hours Total hours
1 1TRAPS Number of traps Days Total lifts
3 3 8 (ninth net damaged by boater)GILL NETS Number of nets Days Total lifts
2 2 4
PHYSICAL AND CHEMICAL CHARACTERISTICS
Color Turbidity
Blue-green 8 Feet 6 Inches (Secchi disk)
TEMPERATURE, DISSOLVED OXYGEN (ppm), TOTAL ALKALINITY (ppm), pH
Depth (ft) Degrees F Oxygen* Depth (ft) Degrees F Oxygen*
Surface 82.2 7.4
2 82.2 7.3
4 82.4 7.3
5 82.4 7.2
6 82.4 7.2
8 82.4 7.1
10 82.4 7.1
12 81.5 6.1
14 79.5 3.8
15 78.3 2.2
16 76.6 1.4
18 72.7 0.7
20 66.7 0.5
22 61.3 0.5
24 58.3 0.4
25 57.0 0.4
26 56.1 0.4
28 54.5 0.3
30 53.6 0.3
32 52.9 0.3
34 51.8 0.3
35 51.6 0.3
36 51.4 0.3
38 51.3 0.3
40 50.9 0.3
42 50.5 0.3
44 50.5 0.3
45 50.4 0.3
*ppm = parts per million

50
Relative Abundance, Size and Estimated Weight of Fish Collected at Lake Webster
Minimum Maximum
Common Name* Number Percent Length (in) Length (in) Weight (lb)** Percent
Bluegill 1381 62.6 0.9 7.0 113.03 29.4
Yellow perch 218 9.9 3.9 9.0 37.21 9.7
Gizzard shad 154 7.0 1.9 15.7 47.98 12.5
Largemouth bass 123 5.6 1.4 20.2 45.79 11.9
Pumpkinseed 72 3.3 2.8 6.8 7.96 2.1
Black crappie 65 2.9 3.7 10.0 13.16 3.4
Redear 46 2.1 2.8 4.8 8.88 2.3
Yellow bullhead 40 1.8 1.9 11.7 19.10 5.0
Brown bullhead 37 1.7 1.3 13.1 21.82 5.7
Golden shiner 19 0.9 1.8 7.9 1.59 0.4
Longear 16 0.7 2.7 5.1 0.77 0.2
Warmouth 12 0.5 3.6 7.1 1.78 0.5
Spotted gar 6 0.3 15.2 28.8 9.05 2.4
Brook silverside 6 0.3 1.9 3.9 0.02 0.0
Muskellunge 5 0.2 29.7 35.3 38.70 10.1
Lake chubsucker 2 0.1 5.6 6.2 0.22 0.1
Carp 1 0.0 28.2 10.11 2.6
Bowfin 1 0.0 26.6 6.66 1.7
Bluntnose minnow 1 0.0 2.9 0.01 0.0
2205 383.84
*Common names of fishes recognized by the American Fisheries Society.
**Weights estimated from standard length-weight regression models.

51
Number, catch by gear, percentage, estimated weight and age of bluegills
Length Catch by gear Total Percent Estimated Age Length Catch by gear Total Percent Estimated Age
(in) EF GN TN Number Weight (lb) (in) EF GN TN Number Weight (lb)
1.0 10 10 0.7 0.00 14.5
1.5 1 1 0.1 0.00 15.0
2.0 32 158 190 13.8 0.01 1 15.5
2.5 34 149 183 13.3 0.01 1 16.0
3.0 27 130 157 11.4 0.02 1 16.5
3.5 14 54 68 4.9 0.03 1,2 17.0
4.0 14 9 23 1.7 0.05 1,2 17.5
4.5 28 36 64 4.6 0.07 2,3 18.0
5.0 50 1 31 82 5.9 0.09 3,4 18.5
5.5 132 7 107 246 17.8 0.12 3,4,5 19.0
6.0 133 3 113 249 18.0 0.16 3,4 19.5
6.5 34 3 68 105 7.6 0.20 4,5 20.0
7.0 1 2 3 0.2 0.26 5 20.5
7.5 21.0
8.0 21.5
8.5 22.0
9.0 22.5
9.5 23.0
10.0 23.5
10.5 24.0
11.0 24.5
11.5 25.0
12.0
12.5
13.0
13.5
14.0 Total 1381 113.03
Electrofishing catch: 510 Gill net catch: 14 Trap net catch: 857

52
Number, catch by gear, percentage, estimated weight and age of gizzard shad
Length Catch by gear Total Percent Estimated Age Length Catch by gear Total Percent Estimated Age
(in) EF GN TN Number Weight (lb) (in) EF GN TN Number Weight (lb)
1.0 14.5 1 1 0.6 1.04
1.5 15.0
2.0 2 2 1.3 0.00 15.5 1 1 0.6 1.26
2.5 2 2 1.3 0.01 16.0
3.0 16.5
3.5 17.0
4.0 17.5
4.5 18.0
5.0 18.5
5.5 19.0
6.0 19.5
6.5 2 2 1.3 0.10 20.0
7.0 1 1 0.6 0.13 20.5
7.5 21.0
8.0 10 3 1 14 9.1 0.19 21.5
8.5 29 2 1 32 20.8 0.22 22.0
9.0 25 3 28 18.2 0.26 22.5
9.5 18 1 19 12.3 0.31 23.0
10.0 19 1 1 21 13.6 0.36 23.5
10.5 15 15 9.7 0.41 24.0
11.0 9 9 5.8 0.47 24.5
11.5 3 3 1.9 0.53 25.0
12.0 2 2 1.3 0.60
12.5
13.0 1 1 2 1.3 0.76
13.5
14.0 Total 154 47.98
Electrofishing catch: 140 Gill net catch: 11 Trap net catch: 3

53
Number, catch by gear, percentage, and estimated weight of largemouth bass (July sample)
Length Catch by gear Total Percent Estimated Age Length Catch by gear Total Percent Estimated Age
(in) EF GN TN Number Weight (lb) (in) EF GN TN Number Weight (lb)
1.0 14.5 1 1 0.8 1.53
1.5 7 7 5.7 0.00 15.0
2.0 9 9 7.3 0.00 15.5 2 2 1.6 1.88
2.5 12 12 9.8 0.01 16.0
3.0 16.5
3.5 17.0
4.0 17.5
4.5 18.0
5.0 1 1 2 1.6 0.06 18.5 1 1 0.8 3.24
5.5 4 4 3.3 0.08 19.0
6.0 4 2 6 4.9 0.10 19.5
6.5 16 1 17 13.8 0.13 20.0 2 2 1.6 4.11
7.0 8 8 6.5 0.16 20.5
7.5 1 1 0.8 0.20 21.0
8.0 1 1 2 1.6 0.25 21.5
8.5 6 1 7 5.7 0.30 22.0
9.0 11 11 8.9 0.35 22.5
9.5 10 10 8.1 0.42 23.0
10.0 5 5 4.1 0.49 23.5
10.5 7 7 5.7 0.57 24.0
11.0 3 1 4 3.3 0.65 24.5
11.5 3 3 2.4 0.75 25.0
12.0
12.5 1 1 0.8 0.97
13.0
13.5
14.0 1 1 0.8 1.37 Total 123 45.79
Electrofishing catch: 115 Gill net catch: 8 Trap net catch: 0

54
Number, catch by gear, percentage, estimated weight and age of yellow perch
Length Catch by gear Total Percent Estimated Age Length Catch by gear Total Percent Estimated Age
(in) EF GN TN Number Weight (lb) (in) EF GN TN Number Weight (lb)
1.0 14.5
1.5 15.0
2.0 15.5
2.5 16.0
3.0 16.5
3.5 17.0
4.0 1 1 0.5 0.03 1 17.5
4.5 1 1 0.5 0.04 1 18.0
5.0 5 3 8 3.7 0.06 1 18.5
5.5 2 5 2 9 4.1 0.08 1 19.0
6.0 2 10 4 16 7.3 0.10 2,4 19.5
6.5 3 21 21 45 20.6 0.13 2,4 20.0
7.0 14 14 31 59 27.1 0.17 4 20.5
7.5 18 13 11 42 19.3 0.21 4 21.0
8.0 14 4 10 28 12.8 0.25 4 21.5
8.5 3 1 2 6 2.8 0.31 4 22.0
9.0 2 1 3 1.4 0.37 4 22.5
9.5 23.0
10.0 23.5
10.5 24.0
11.0 24.5
11.5 25.0
12.0
12.5
13.0
13.5
14.0 Total 218 37.21
Electrofishing catch: 64 Gill net catch: 68 Trap net catch: 86

55
Bluegill
Intercept: 0.8 inch
BACK-CALCULATED LENGTH (inches) AT EACH AGE
Year Bluegill growth (solid line) compared to other
Class Count I II III IV V VI lakes (dotted line).
2004 20 1.5
stdev 0.31
2003 8 1.5 3.0
stdev 0.18 0.23
2002 5 1.8 3.0 4.3
stdev 0.21 0.26 0.51
2001 14 1.7 3.2 4.4 5.3
stdev 0.23 0.32 0.42 0.62
2000 4 1.6 3.2 4.3 5.5 6.0
stdev 0.16 0.30 0.42 0.75 0.64
1999 0
stdev
Mean* 1.6 3.1 4.3 5.4 6.0
SD 0.11 0.11 0.02 0.18
Count 51 31 23 18 4
* Age groups with less than three samples not included in year class averages
Largemouth bass
Intercept: 0.8 inch
BACK-CALCULATED LENGTH (inches) AT EACH AGE
Year Largemouth bass growth (solid line) compared to
Class Count I II III IV V VI other lakes (dotted line).
2004 18 4.9
stdev 0.55
2003 38 4.1 7.6
stdev 0.65 0.86
2002 29 4.2 7.3 9.7
stdev 0.66 0.91 0.84
2001 59 3.5 7.0 9.6 11.7
stdev 0.79 1.20 1.41 1.29
2000 39 3.9 7.3 10.7 12.7 14.0
stdev 0.86 1.31 1.36 1.24 1.32
1999 38 3.8 7.6 10.9 13.6 15.3 15.8
stdev 0.79 1.20 1.20 1.05 1.02 0.67Mean* 4.1 7.4 10.2 12.7 14.6 15.8
SD 0.46 0.26 0.67 0.98 0.88
Count 193 175 137 108 49 12
* Age groups with less than three samples not included in year class averages
Yellow perch
Intercept: 1.2 inch
BACK-CALCULATED LENGTH (inches) AT EACH AGE
Year Yellow perch growth (solid line) compared to
Class Count I II III IV V VI other lakes (dotted line).
2004 9 3.5
stdev 0.35
2003 3 3.4 4.9
stdev 0.23 0.37
2002 0
stdev
2001 24 2.7 4.0 5.3 6.4
stdev 0.38 0.35 0.54 0.79
2000 0
stdev
1999 0
stdev
Mean* 3.2 4.5 5.3 6.4
SD 0.43 0.68
Count 36 27 24 24
* Age groups with less than three samples not included in year class averages
0.0
2.0
4.0
6.0
8.0
1 2 3 4 5 6
Age
Inches
0.0
5.0
10.0
15.0
20.0
1 2 3 4 5 6
Age
Inches
2
0.0
2.0
4.0
6.0
8.0
10.0
12.0
1 2 3 4 5 6
Age
Inches
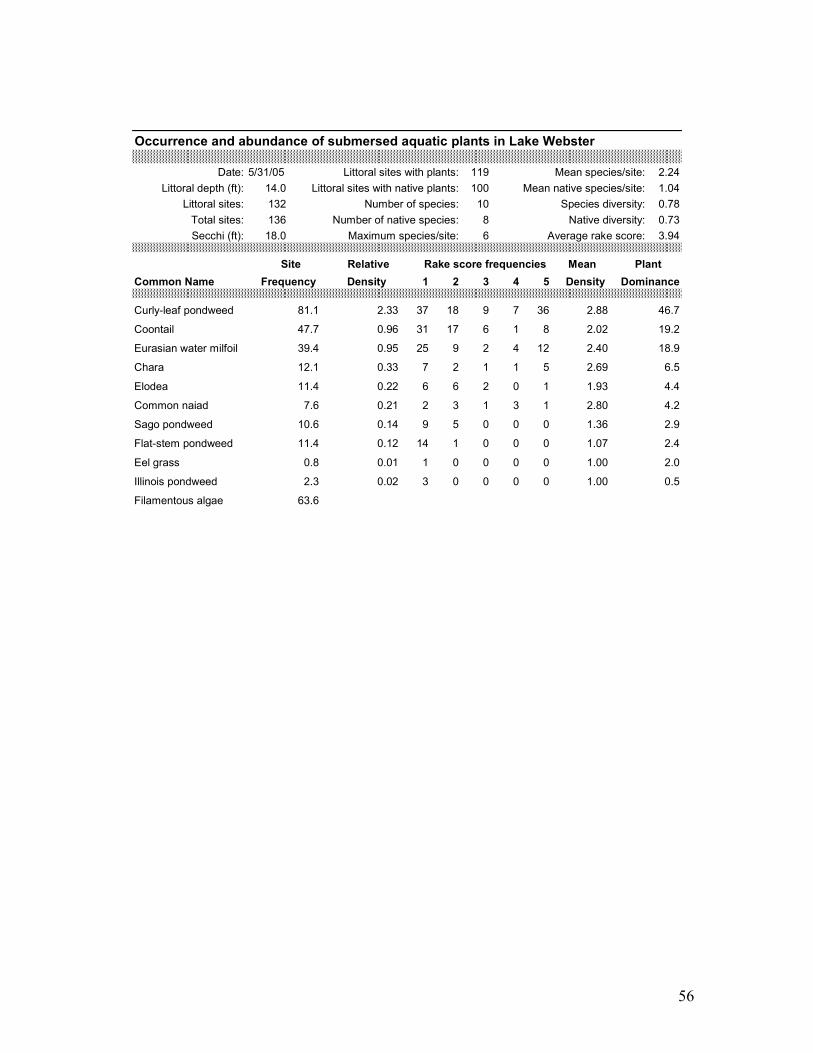
56
Occurrence and abundance of submersed aquatic plants in Lake Webster
Date: 5/31/05 Littoral sites with plants: 119 Mean species/site: 2.24
Littoral depth (ft): 14.0 Littoral sites with native plants: 100 Mean native species/site: 1.04
Littoral sites: 132 Number of species: 10 Species diversity: 0.78
Total sites: 136 Number of native species: 8 Native diversity: 0.73
Secchi (ft): 18.0 Maximum species/site: 6 Average rake score: 3.94
Site Relative Rake score frequencies Mean Plant
Common Name Frequency Density 1 2 3 4 5 Density Dominance
Curly-leaf pondweed 81.1 2.33 37 18 9 7 36 2.88 46.7
Coontail 47.7 0.96 31 17 6 1 8 2.02 19.2
Eurasian water milfoil 39.4 0.95 25 9 2 4 12 2.40 18.9
Chara 12.1 0.33 7 2 1 1 5 2.69 6.5
Elodea 11.4 0.22 6 6 2 0 1 1.93 4.4
Common naiad 7.6 0.21 2 3 1 3 1 2.80 4.2
Sago pondweed 10.6 0.14 9 5 0 0 0 1.36 2.9
Flat-stem pondweed 11.4 0.12 14 1 0 0 0 1.07 2.4
Eel grass 0.8 0.01 1 0 0 0 0 1.00 2.0
Illinois pondweed 2.3 0.02 3 0 0 0 0 1.00 0.5
Filamentous algae 63.6

57
Occurrence and abundance of submersed aquatic plants in Lake Webster
Date: 7/29/05 Littoral sites with plants: 113 Mean species/site: 1.58
Littoral depth (ft): 15.0 Littoral sites with native plants: 110 Mean native species/site: 1.32
Littoral sites: 134 Number of species: 13 Species diversity: 0.77
Total sites: 136 Number of native species: 11 Native diversity: 0.70
Secchi (ft): 8.5 Maximum species/site: 6 Average rake score: 3.28
Site Relative Rake score frequencies Mean Plant
Common Name Frequency Density 1 2 3 4 5 Density Dominance
Coontail 64.2 1.52 38 20 5 4 19 2.37 30.4
Common naiad 30.6 0.78 19 5 4 1 12 2.56 15.7
Chara 9.7 0.26 6 1 1 1 4 2.69 5.2
Flat-stem pondweed 9.7 0.22 5 4 2 0 2 2.23 4.3
Curly-leaf pondweed 14.2 0.16 17 2 0 0 0 1.11 3.1
Water stargrass 6.7 0.14 5 2 0 0 2 2.11 2.8
Eurasian water milfol 11.9 0.13 15 1 0 0 0 1.06 2.5
Leafy pondweed 3.7 0.07 4 0 0 0 1 1.80 1.3
Spiny naiad 0.7 0.04 0 0 0 0 1 5.00 0.7
Sago pondweed 2.2 0.03 2 1 0 0 0 1.33 0.6
Elodea 2.2 0.02 3 0 0 0 0 1.00 0.4
Variable pondweed 1.5 0.02 1 0 0 0 0 1.50 0.4
Large-leaf pondweed 0.7 0.01 1 0 0 0 0 1.00 0.1
Filamentous algae 64.9

58
Webster Lake Emergent Plant Beds 8/9/05
Mean Mean Mean Species Frequency of Occurrence Species Calculated values
Bed Sites Latitude Longitude Width SPA WAL ARA SWL CAT PIK PRL ARH PHR N N/site Acres Length
1 4 41.31663 -85.67090 40.5 100.0 25.0 75.0 3 2.00 0.11 103
2 7 41.31803 -85.67077 79.0 100.0 1 1.00 0.46 437
3 7 41.31843 -85.67143 60.0 100.0 1 1.00 0.30 323
4 3 41.31834 -85.67035 28.0 100.0 66.7 2 1.67 0.05 75
5 2 41.31940 -85.67020 24.0 100.0 100.0 50.0 3 2.50 0.03 55
6 4 41.31899 -85.67062 30.8 100.0 1 1.00 0.22 246
7 2 41.31942 -85.67043 27.0 100.0 1 1.00 0.02 32
8 8 41.31979 -85.67188 43.9 100.0 75.0 12.5 3 1.88 0.45 425
9 6 41.32026 -85.67301 97.5 100.0 1 1.00 0.74 320
10 4 41.32722 -85.66846 41.3 100.0 25.0 25.0 50.0 4 2.00 0.13 133
11 9 41.32757 -85.66782 77.3 100.0 22.2 33.3 33.3 22.2 5 2.11 1.41 725
12 8 41.33357 -85.67011 68.6 100.0 12.5 2 1.13 0.54 364
13 4 41.33430 -85.67512 83.3 75.0 100.0 25.0 50.0 25.0 5 2.75 0.30 126
14 9 41.33367 -85.67515 224.0 100.0 11.1 77.8 3 1.89 2.27 429
15 10 41.33271 -85.67520 60.6 30.0 100.0 20.0 20.0 10.0 60.0 6 2.40 0.75 706
16 13 41.32832 -85.67212 51.2 100.0 7.7 2 1.08 0.85 519
17 10 41.32902 -85.67695 414.9 90.0 30.0 10.0 20.0 4 1.50 13.01 1317
18 7 41.32862 -85.67785 202.7 85.7 28.6 28.6 28.6 4 1.71 3.58 564
19 4 41.33003 -85.69468 49.5 100.0 1 1.00 0.10 88
20 5 41.32737 -85.69343 93.6 100.0 60.0 40.0 3 2.00 0.64 250
21 5 41.32344 -85.69345 89.4 80.0 1 0.80 0.52 209
22 3 41.32252 -85.69320 42.0 100.0 1 1.00 0.11 105
23 3 41.32219 -85.69279 89.0 100.0 1 1.00 0.29 139
24 3 41.32134 -85.69217 41.0 100.0 33.3 2 1.33 0.09 96
25 3 41.32138 -85.68949 31.0 100.0 1 1.00 0.10 129
26 11 41.32144 -85.67668 93.5 100.0 63.6 9.09 3 1.64 1.62 742
27 3 41.32187 -85.67740 54.0 100.0 1 1.00 0.14 110
28 2 41.32030 -85.67692 33.0 100.0 1 1.00 0.02 31
29 2 41.31986 -85.67675 27.0 100.0 1 1.00 0.04 65
30 6 41.31992 -85.67656 66.5 100.0 1 1.00 0.68 332
31 5 41.32027 -85.67607 54.0 100.0 20.0 2 1.20 0.40 279
32 3 41.31848 -85.67318 43.0 100.0 33.3 33.3 3 1.67 0.13 127
33 2 41.31818 -85.67285 90.0 100.0 1 1.00 0.12 59
34 3 41.31743 -85.67157 32.0 100.0 1 1.00 0.07 95
35 2 41.31732 -85.67133 24.0 100.0 1 1.00 0.01 15
36 2 41.31658 -85.67121 10.5 100.0 1 1.00 0.01 42
37 3 41.31628 -85.67053 57.0 100.0 1 1.00 0.07 49
38 9 41.31535 -85.66929 51.7 100.0 1 1.00 0.69 437
39 3 41.31815 -85.66633 19.0 100.0 100.0 33.3 66.7 4 3.00 0.03 83
40 6 41.31736 -85.66664 54.5 100.0 66.7 33.3 3 2.00 0.66 492
41 8 41.31669 -85.66893 103.5 100.0 87.5 75.0 12.5 4 2.75 2.23 805
Sum 213 Mean 70.8 96.6 57.9 63.1 28.4 39.2 24.2 39.3 27.5 9.1 2.2 1.46
Count 41 6 9 7 10 4 9 3 Sum 34.00 11676
Isolated patches
Sum 29 Mean 48.3 55.2 0.0 3.4 3.4 0.0 0.0 0.0 0.0 4 1.10
Lake surface acreage: 774
Species present Percent surface coverage: 4.4
ARA Arrow arum Contour acreage within 10-ft depth:
ARH Arrowhead Percent 10-ft contour area coverage:
CAT Cattail Lake shoreline perimeter in miles: 7.9
PHR Phragmites Estimated emergent bed miles: 2.2
PIK Pickerelweed Bed edge:shoreline ratio (%): 27.9
PRL Purple loosestrife The map at the right depicts lakeward locations of
SPA Spatterdock emergent plant beds (small black dots), lakeward
SWL Swamp loosestrife centers of each bed (large dots), and patches
WAL Water lily (stars) of emergent plants in Lake Webster.
Data summary prepared by Jed Pearson - 11/1/05
Indiana Division of Fish and Wildlife