Embed Size (px)
Citation preview

CurrentTrendsinJuvenileIncarceration
PresentedbyBarryKrisbergApril25,2012

NATIONALTRENDS

YouthinResidentialPlacement,Counts,byGender,1975‐2010
Source: Sickmund, M., Sladky, T.J., Kang, W., and Puzzanchera, C. (2011) "Easy Access to the Census of Juveniles in Residential Placement." Online. Available: http://www.ojjdp.gov/ojstatbb/ezacjrp/ (for 1997‐2010)Smith, B. (1999). Children in custody: 20‐year trends in juvenile detention, correctional, and shelter facilities. Crime and Delinquency, (44)526. (for 1975‐1995)
Numbers of youth in residential placement, both male and female, have declined steadily for at least 10 years.
57,078
57,67964,424
72,611
77,015
89,720
90,77192,985
89,115
81,97578,998
75,017
61,358
17,192
14,24315,667
19,03516,717
17,917
14,28414,508
15,104 14,55613,723
11,7979,434
0
20,000
40,000
60,000
80,000
100,000
1975 1979 1983 1987 1991 1995 1997 1999 2001 2003 2006 2007 2010
Male
Female

YouthinResidentialPlacement,TotalCounts,1975‐2010
Source: Sickmund, M., Sladky, T.J., Kang, W., and Puzzanchera, C. (2011). "Easy Access to the Census of Juveniles in Residential Placement." Online. Available: http://www.ojjdp.gov/ojstatbb/ezacjrp/ (for 1997‐2010)Smith, B. (1999). Children in custody: 20‐year trends in juvenile detention, correctional, and shelter facilities. Crime and Delinquency, (44)526. (for 1975‐1995)
Total numbers of youth in residential placement are now lower than they have been for 35 years.
74,27071,922
80,091
91,64693,732
107,637105,055
107,493104,219
96,53192,721
86,814
70,792
0
20,000
40,000
60,000
80,000
100,000
120,000
1975 1979 1983 1987 1991 1995 1997 1999 2001 2003 2006 2007 2010

StateswiththeLargestDeclinesinResidentialPlacement,between1997and2010
Rank State % Change
1 Tennessee - 63%
2 Louisiana - 63%
3 Connecticut - 54%
4 Mississippi - 53%
5 New Jersey - 48%
6 Michigan - 46%
7 Wisconsin - 45%
8 New York - 43%
9 California - 42%
10 Arizona - 42%
Source: Sickmund, M., Sladky, T.J., Kang, W., and Puzzanchera, C. (2011) "Easy Access to the Census of Juveniles in Residential Placement." Online. Available: http://www.ojjdp.gov/ojstatbb/ezacjrp/

YouthinResidentialPlacement,Rates,1975‐2010
Sources: Sickmund, M., Sladky, T.J., Kang, W., and Puzzanchera, C. (2011) Easy Access to the Census of Juveniles in Residential Placement. Online. Available: http://www.ojjdp.gov/ojstatbb/ezacjrp/ (for 1997‐2010)Smith, B. (1999). Children in custody: 20‐year trends in juvenile detention, correctional, and shelter facilities. Crime and Delinquency, (44)526. (for 1975‐1995)
Rates of youth in residential placement have declined since 1995 and are lower now than 35 years ago.
241 251290
357 359381
356 355 355
306 295278
225
0
50
100
150
200
250
300
350
400
450
1975 1979 1983 1987 1991 1995 1997 1999 2001 2003 2006 2007 2010

YouthinDetentionCenters,Counts,1997‐2010
24,367
29,32431,320
24,26025,771 24,691
20,312
4,690 5,5167,421
5,495 5,158 4,927 3,807
0
5,000
10,000
15,000
20,000
25,000
30,000
35,000
1997 1999 2001 2003 2006 2007 2010
Male
Female
Source: Sickmund, M., Sladky, T.J., Kang, W., and Puzzanchera, C. (2011) "Easy Access to the Census of Juveniles in Residential Placement." Online. Available: http://www.ojjdp.gov/ojstatbb/ezacjrp/
Numbers of youth in detention centers, were lower in 2010 than any year since 1997.
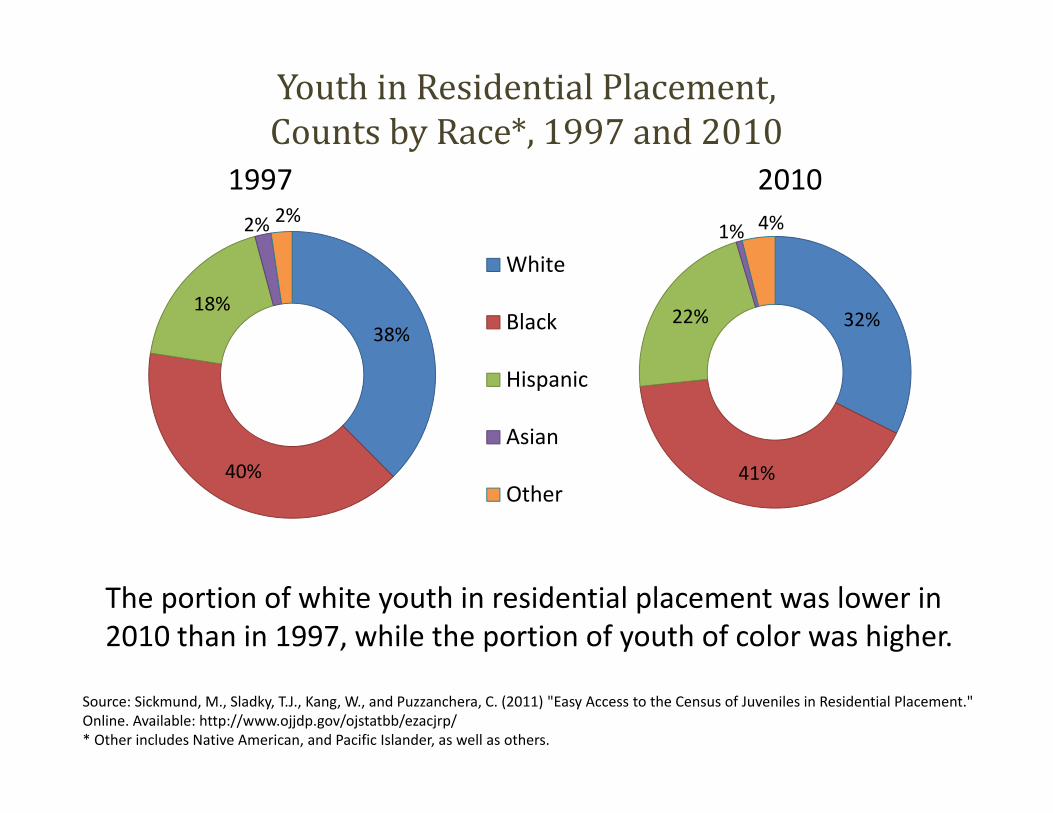
YouthinResidentialPlacement,CountsbyRace*,1997and2010
1997 2010
Source: Sickmund, M., Sladky, T.J., Kang, W., and Puzzanchera, C. (2011) "Easy Access to the Census of Juveniles in Residential Placement." Online. Available: http://www.ojjdp.gov/ojstatbb/ezacjrp/ * Other includes Native American, and Pacific Islander, as well as others.
38%
40%
18%
2% 2%
White
Black
Hispanic
Asian
Other
32%
41%
22%
1% 4%
The portion of white youth in residential placement was lower in 2010 than in 1997, while the portion of youth of color was higher.

YouthinResidentialPlacement,CountsbyAge,1997and2010
1997 2010
Source: Sickmund, M., Sladky, T.J., Kang, W., and Puzzanchera, C. (2011) "Easy Access to the Census of Juveniles in Residential Placement." Online. Available: http://www.ojjdp.gov/ojstatbb/ezacjrp/
2%
5%11%
20%
27%
23%
12%12 or younger
13
14
15
16
17
18 to 20
1%
3% 8%
18%
28%
28%
14%
Youth in residential placement were slightly older in 2010 than in 1997; there were more youth 16 and over.

YouthinResidentialPlacement,CountsbyAge,1997and2010
693
2,079
5,955
12,604
19,540
19,990
9,931
2,178
4,648
11,578
21,237
28,201
24,564
12,649
0 5,000 10,000 15,000 20,000 25,000 30,000
12 or younger
13
14
15
16
17
18 to 20
1997 2010
Source: Sickmund, M., Sladky, T.J., Kang, W., & Puzzanchera, C. (2011). "Easy Access to the Census of Juveniles in Residential Placement." Available: http://www.ojjdp.gov/ojstatbb/ezacjrp/

YouthinResidentialPlacement,MostSeriousOffense,Counts,1997and2010
33%
30%
9%
10%
12%6%
PersonoffensesPropertyoffensesDrug offenses
Public orderoffensesTechnicalviolationsStatusoffenses
37%
24%
7%
12%
16%4%
20101997
Source: Sickmund, M., Sladky, T.J., Kang, W., and Puzzanchera, C. (2011) "Easy Access to the Census of Juveniles in Residential Placement." Online. Available: http://www.ojjdp.gov/ojstatbb/ezacjrp/
The portion of youth in residential placement for person offenses increased from 1997 to 2010, while the portion for property, drugs, and status offenses declined.

Juvenile ArrestTrends,Counts,2001‐2010
1,360,895
1,040,453998,238
733,955
362,657306,498
0
200,000
400,000
600,000
800,000
1,000,000
1,200,000
1,400,000
1,600,000
2001 2002 2003 2004 2005 2006 2007 2008 2009 2010
Total
Male
Female
Source: FBI, Crime in the United States 2000‐2010, Table 33: Ten Year Arrest Trends.Note: includes all 29 offenses for which the FBI collects data (i.e., all Part I and II crimes).
Juvenile arrests for both boys and girls have declined steadily for at least 10 years.

YouthinLocalJails,AverageDailyPopulation,2000‐2010
7,6157,613
7,2476,869 7,083
6,7596,104
6,837
7,703 7,560
0
1,000
2,000
3,000
4,000
5,000
6,000
7,000
8,000
9,000
2000 2001 2002 2003 2004 2005 2006 2007 2008 2009 2010
Source: Bureau of Justice Statistics, Prison and Jail Inmates at Midyear Series, 2000‐2010.
The ADP of youth in local jails reached a low point in 2006 and has increased since then.

YouthinStatePrison,Counts,2000‐2010
3,896
3,1473,038
2,7412,485
2,208 2,3902,639 2,717
2,779
2,295
0
500
1,000
1,500
2,000
2,500
3,000
3,500
4,000
4,500
2000 2001 2002 2003 2004 2005 2006 2007 2008 2009 2010
* Youth are considered those under age 18.Source: Bureau of Justice Statistics, Prison and Jail Inmates at Midyear Series, 2000‐2010.
The counts of youth in state prisons declined from 2000 to 2006, increased until 2009, and declined again to 2010.

YouthinPrisons,CountsbyGender,2000‐2010
3,721
3,010 2,9272,627
2,375
2,1182,286
2,523 2,6262,645
2,217
175 137 111 114 110 90 104 116 91 134780
500
1,000
1,500
2,000
2,500
3,000
3,500
4,000
Male
Female
Source: Bureau of Justice Statistics, Prison and Jail Inmates at Midyear Series, 2000‐2010
Youth in state prisons are mostly male. The number of girls in adult prisons declined from 175 in 2000 to 78 in 2010.

YouthinStatePrisons,FemaleCounts,2000‐2010
175
137
111 114110
90104
116
91
134
78
020406080
100120140160180200
2000 2001 2002 2003 2004 2005 2006 2007 2008 2009 2010
Source: Bureau of Justice Statistics, Prison and Jail Inmates at Midyear Series, 2000‐2010.
A closer look at the numbers for girls in prison shows a general decline between 2000 and 2010, with fluctuations.

HighestStateRatesofJuvenileIncarceration,2010
Rates of youth per 100,000 in Residential Placement.
Rates have been rounded to the nearest multiple of three.
State of offense refers to where the juvenile committed the offense for which they are being held.
Includes youth ages 10 through the upper age of original juvenile court jurisdiction in each state.
Source: Sickmund, M., Sladky, T.J., Kang, W., and Puzzanchera, C. (2011) "Easy Access to the Census of Juveniles in Residential Placement." Online. Available: http://www.ojjdp.gov/ojstatbb/ezacjrp/
Rank State Rate per 100,000
1 South Dakota 575
2 Wyoming 440
3 Nebraska 378
4 Alaska 342
5 Oregon 319
6 Pennsylvania 316
7 West Virginia 316
8 Colorado 287
9 Indiana 276
10 California 271

Source: Sickmund, M., Sladky, T.J., Kang, W., and Puzzanchera, C. (2011) "Easy Access to the Census of Juveniles in Residential Placement." Online. Available: http://www.ojjdp.gov/ojstatbb/ezacjrp/
34%
22%6%
12%
24%
2%
30%
26%8%
10%
24%
2%
PersonoffensesPropertyoffensesDrug offenses
Public orderoffensesTechnicalviolationsStatus offenses
Youth inDetentionCenters,byMostSeriousOffense,Counts,1997and2010
1997 2010
The portion of youth in detention centers for person offenses increased from 1997 to 2010, while the portion for property, drugs, and public order offenses declined.

YouthinDetentionCenters,byRace,1997&2010
0 1 2 3 4 5 6
White
Black
Hispanic
API
Other
Relative Rate Index
2010
1997
Source: Sickmund, M., Sladky, T.J., Kang, W., and Puzzanchera, C. (2011) "Easy Access to the Census of Juveniles in Residential Placement." Online. Available: http://www.ojjdp.gov/ojstatbb/ezacjrp/ & Puzzanchera, C., Sladky, A. and Kang, W. (2011). Easy Access to Juvenile Populations: 1990‐2010. Online. Available: http://www.ojjdp.gov/ojstatbb/ezapop/
In 2010, there were more Black youth in detention than in 1997, relative to White youth. For both periods, of all youth of color, only API youth had an RRI lower than 1.

YouthinResidentialPlacement,byRace,1997&2010
0 1 2 3 4 5 6 7
White
Black
Hispanic
API
Other
Relative Rate Index
2010
1997
Source: Sickmund, M., Sladky, T.J., Kang, W., and Puzzanchera, C. (2011) "Easy Access to the Census of Juveniles in Residential Placement." Online. Available: http://www.ojjdp.gov/ojstatbb/ezacjrp/ & Puzzanchera, C., Sladky, A. and Kang, W. (2011). Easy Access to Juvenile Populations: 1990‐2010. Online. Available: http://www.ojjdp.gov/ojstatbb/ezapop/
In 2010, there were more “Other” youth in placement than in 1997, relative to White youth. For both periods, of all youth of color, only API youth had an RRI lower than 1.

THEEXPERIENCESOFJDAISITES

Commissioned by AECF to evaluate results in JDAI sites compared to their respective states and to the sites that were not part of the JDAI process.
• Compared site baseline years to 2010 and calculated the percent change.
• Used data from the JDAI Annual Results Report for the JDAI sites.
• Used data from the Census for Juveniles in Residential Placement for the states.
• Examined more than 80 sites in 23 states.
• Focused on ADP, commitments, and arrests (FBI data).
Findings are preliminary, but informative.
WarrenInstituteStudyofJDAIImpact

AggregatePercentChangeinADPCounts,BaselineYearto2010
Sources: Casey Annual Report 2010 (JDAI Sites), Census of Juveniles in Residential Placement (States).
* Non‐JDAI Sites were estimated based on a calculation of CJRP state total counts minus JDAI total counts.
Comparing baseline years to 2010, Casey sites saw a drop in their detention populations that was 2.5 times greater than that of the state totals and 5 times greater than that for the non‐JDAI sites.
‐41%
‐8%
‐17%
‐50%
‐40%
‐30%
‐20%
‐10%
0%JDAI Sites Non‐JDAI Sites State Totals

AggregatePercentChangeinCommitmentCounts,BaselineYearto2010
Sources: Casey Annual Report 2010 (JDAI Sites), Census of Juveniles in Residential Placement (States).
* Non‐JDAI Sites were estimated based on a calculation of CJRP state total counts minus JDAI total counts.
Comparing baseline years to 2010,the Casey sites saw a drop in commitment counts that was 33% greater than that of the state totals and 40% greater than that for the non‐JDAI Sites.
‐40%
‐25%
‐29%
‐50%
‐40%
‐30%
‐20%
‐10%
0%JDAI Sites Non‐JDAI Sites State Totals

PercentageChangeinADP,StatePartnerstoCountyPartners,1997‐2010
PercentageChangeinCommitments,StatePartnerstoCountyPartners,1997‐2010
Source: Casey Annual Results Report 2010.
‐43%
‐35%
‐50%
‐40%
‐30%
‐20%
‐10%
0%State Partners County Partners
‐44%
‐35%
‐50%
‐40%
‐30%
‐20%
‐10%
0%State Partners County Partners