Embed Size (px)
Citation preview
Sponsored by
The Meyer Fund for Sustainable Development Page 1 6/20/2011
ENERGIZINGTHENEXTGENERATIONWITHPHOTOVOLTAICS
CURRICULUMANDEXPERIMENTSUSINGTHE
PHOTOVOLTAICEDUCATIONKITS©
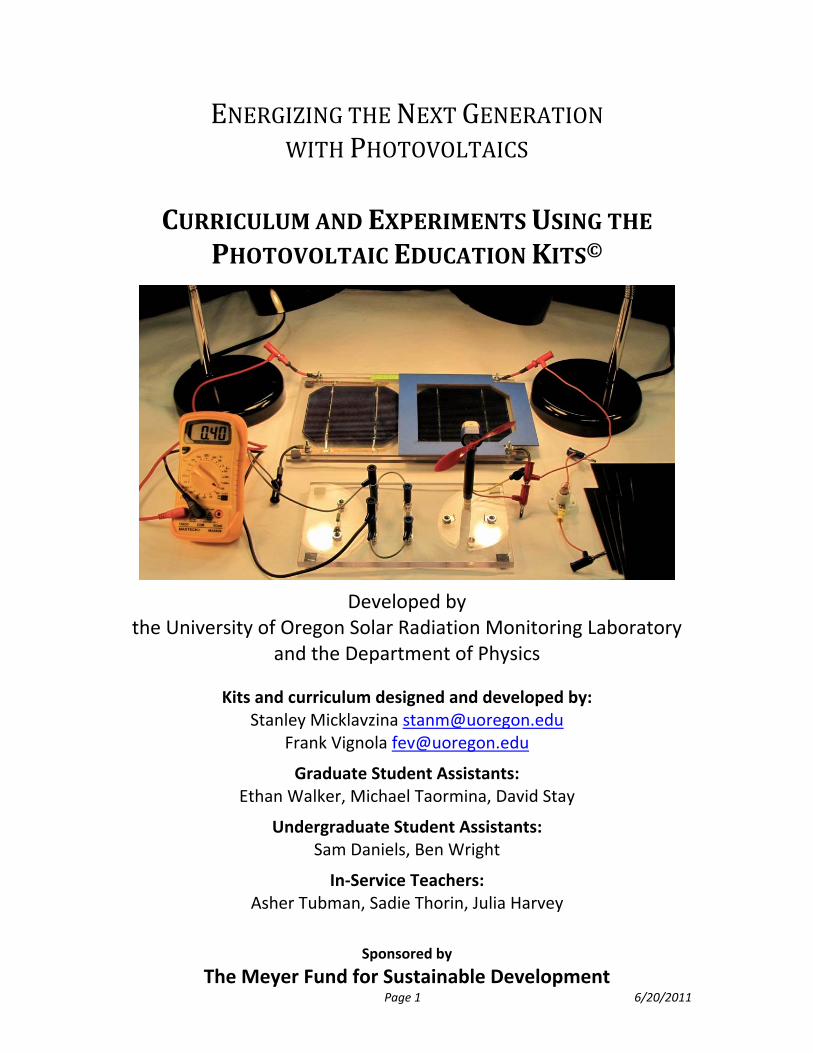
Developed by
the University of Oregon Solar Radiation Monitoring Laboratory and the Department of Physics
Kits and curriculum designed and developed by: Stanley Micklavzina [email protected]
Frank Vignola [email protected]
Graduate Student Assistants: Ethan Walker, Michael Taormina, David Stay
Undergraduate Student Assistants: Sam Daniels, Ben Wright
In‐Service Teachers: Asher Tubman, Sadie Thorin, Julia Harvey
Name: _____________________________________________ Kit#_______________ Per._______
Curriculum and Experiments Using the Photovoltaic Education Kits Page 2
ContentsMatching the course with standards
Activities
1. Solar Cells are Like Batteries – Series and Parallel PV Cell Connections
To teach how to measure the current and voltage output of photovoltaic cells.
To investigate the difference in behavior of solar cells when they are connected in series or in parallel.
To help answer the question of how solar cells behave like batteries.
2. PV Activity 2: Current Output vs. Shading
To investigate multiple PV cell output current dependence on shading.
3. Investigation of Loads on PV Cells
The purpose of this activity is to investigate the current and voltage output of photovoltaic cells when connected to various loads.
This activity includes an optional extra investigation related to power curves, an engineering characteristic of the PV cell.
4. Output Current and Light Spectrum (Wavelength)
To investigate wavelength (color) of light on the PV cell output current.
To answer the question of why fluorescent bulbs are more efficient than incandescent bulbs
5. Photocell Output vs. Lamp Distance
To investigate the photovoltaic (PV) cell output power dependence on the distance between the PV cell and an incandescent lamp.
6. Output Current and Sun Angle
To investigate PV cell output dependence on the sun angle
7. Power Output and Temperature
To investigate PV cell output dependence on temperature
Appendix A: Electricity Circuit Primer
To understand the concepts of Voltage and Current,
To learn how to connect Current and Voltage meters to a circuit
An introduction to concepts of circuit Resistance and Power.
Appendix B: Activity 5b: Voltage vs Lamp Distance
To investigate the dependence of the output Voltage of a PV cell on the distance between the PV cell and an incandescent lamp.
Appendix C: Vocabulary
Brief explanation of terminology used in the curricula
Appendix D: Measuring Electricity Appendix E: How a Photovoltaic Cell Works Appendix F: Review of several PV Kit Labs Appendix G: Sources for background information Appendix H: PV Lab Kit Components
Name: _____________________________________________ Kit#_______________ Per._______
Curriculum and Experiments Using the Photovoltaic Education Kits Page 3
Matching the Course with Standards ‐ by Asher Tubman The 1st three lab activities (Current vs Lamp Distance, Series and Parallel, and Output Load) address several relevant Oregon State Science Standards. While there are not many specific relevant physical science content standards (compared to California, for example) for these labs, both labs 1 and 2 are good applications of the ones listed below (Oregon Standards H.2P.3). Lab 2 is especially good for addressing how to apply the knowledge of constructing a simple circuit (California Standards EM5a and EM5b). The third lab is fits well with looking at how energy is dissipated (California Standards EM5c). In general, these can help refresh/reinforce the circuit content one is teaching, as well as show a good, practical application of the circuit knowledge
The use of these labs in general would be an excellent opportunity to broaden the context of physics learning, such as by teaching how the physics content is applied to everyday life. One could use these labs to address several of the Oregon Engineering Design Standards (H.4D.4‐6). One could use these to address issues of efficiency of energy sources, alternative energy sources, and show practical applications of physics content.
A 3rd use for these kits would be to address several of the Scientific Inquiry standards (H.3S.2, H.3S.3, and H.3S.5). One requirement for all high school students is to create a work sample, which includes a designed, executed and analyzed experiment. The kits lend themselves to this type of project very well. Between the filters, the fans, the resistors, the area of a cell shaded, the distance of a light from the panel and the brightness of the small light bulbs, combined with measurements of power, current or voltage, there are a variety of phenomenon that the students could pick to investigate. Some examples include looking at how the wavelength of light on the panel affected the rate at which the fans spin (measured with a photogate) or how a different light bulb in the lamp affected the current put out by the cell. These kits provide a great forum for the students to do some real inquiry‐based learning.
One caution about this type of lab is that it requires a high level of independence on the part of the students. It is important to make sure the students were all fairly comfortable with a certain amount of independent work, are well trained in lab behavior and expectations and were able to use the kits well.
Physical Science Content Standards
H.2: Interaction and Change: The components in a system can interact in dynamic ways that may result in change. In systems, changes occur with a flow of energy and/or transfer of matter.
H.2P.3: Describe the interactions of energy and matter including the law of conservation of energy.
Name: _____________________________________________ Kit#_______________ Per._______
Curriculum and Experiments Using the Photovoltaic Education Kits Page 4
Engineering Design Standards
H.4: Engineering design is a process of formulating problem statements, identifying criteria and constraints, proposing and testing possible solutions, incorporating modifications based on test data, and communicating the recommendations.
H.4D.4: Recommend a proposed solution, identify its strengths and weaknesses, and describe how it is better than alternative designs. Identify further engineering that might be done to refine the recommendations.
H.4D.5: Describe how new technologies enable new lines of scientific inquiry and are largely responsible for changes in how people live and work.
H.4D.6: Evaluate ways that ethics, public opinion, and government policy influence the work of engineers and scientists, and how the results of their work impact human society and the environment.
Core Standards for Scientific Inquiry
H.3 Scientific inquiry is the investigation of the natural world by a systematic process that includes proposing a testable question or hypothesis and developing procedures for questioning, collecting, analyzing, and interpreting multiple forms of accurate and relevant data to produce justifiable evidence‐based explanations and new explorations.
H.3S.2: Design and conduct a controlled experiment, field study, or other investigation to make systematic observations about the natural world, including the collection of sufficient and appropriate data.
H.3S.3: Analyze data and identify uncertainties. Draw a valid conclusion, explain how it is supported by the evidence, and communicate the findings of a scientific investigation
H.3S.5: Explain how technological problems and advances create a demand for new scientific knowledge and how new knowledge enables the creation of new technologies
CALIFORNIA STANDARDS
EM: Electric and Magnetic Phenomena
EM.5: Electric and magnetic phenomena are related and have many practical
applications. As a basis for understanding this concept:
EM.5.a: Students know how to predict the voltage or current in simple direct current (DC) electric circuits constructed from batteries, wires, resistors, and capacitors.
Name: _____________________________________________ Kit#_______________ Per._______
Curriculum and Experiments Using the Photovoltaic Education Kits Page 5
EM.5.b: Students know how to solve problems involving Ohm's law. EM.5.c: Students know any resistive element in a DC circuit dissipates energy,
which heats the resistor. Students can calculate the power (rate of energy dissipation) in any resistive circuit element by using the formula Power = IR (potential difference) x I (current) = 1² R.
EM.5.o: Students know how to apply the concepts of electrical and gravitational potential energy to solve problems involving conservation of energy.
By Stanley Micklavzina, Asher Tubman, and Frank Vignola for the Meyer Fund for Sustainable Development and the University of Oregon Department of Physics and Solar Radiation Monitoring Laboratory Page 1.1 6/20/2011
PV Activity 1: Series and Parallel PV Cell Connections©
To teach how to measure the current and voltage output of photovoltaic cells.
To investigate the difference in behavior of solar cells when they are connected in series or in parallel.
To help answer the question of how solar cells behave like batteries.
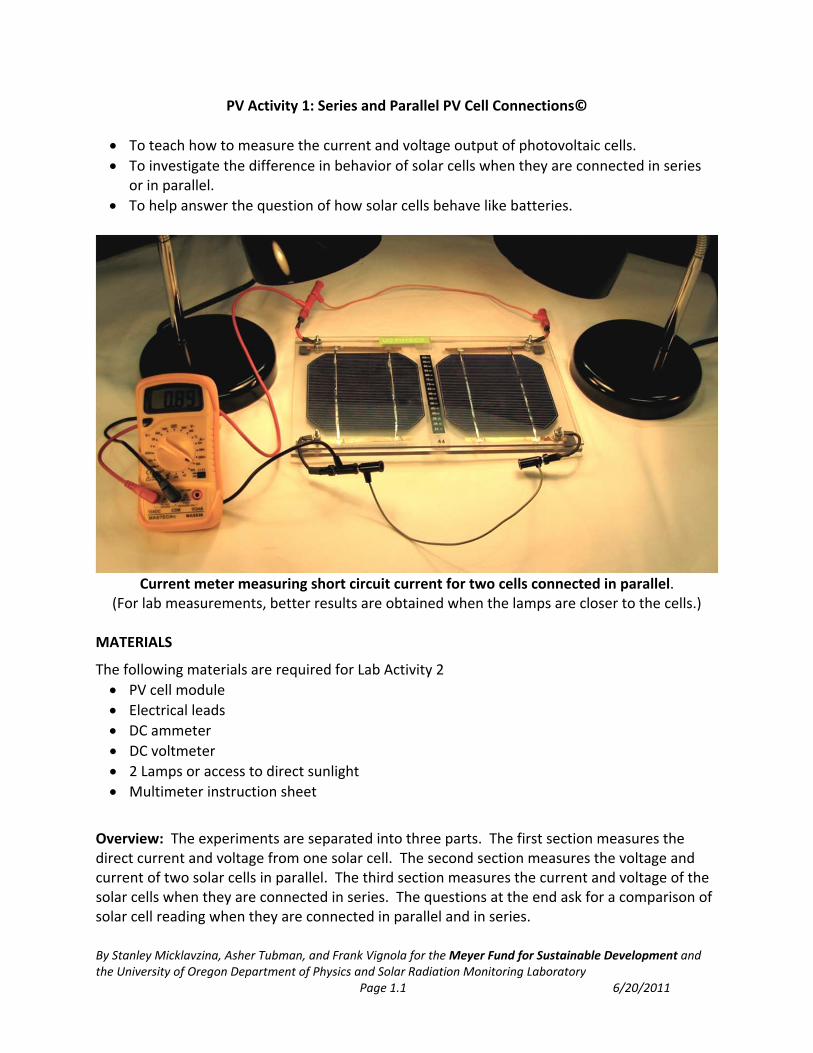
Current meter measuring short circuit current for two cells connected in parallel.
(For lab measurements, better results are obtained when the lamps are closer to the cells.)
MATERIALS
The following materials are required for Lab Activity 2
PV cell module
Electrical leads
DC ammeter
DC voltmeter
2 Lamps or access to direct sunlight
Multimeter instruction sheet
Overview: The experiments are separated into three parts. The first section measures the direct current and voltage from one solar cell. The second section measures the voltage and current of two solar cells in parallel. The third section measures the current and voltage of the solar cells when they are connected in series. The questions at the end ask for a comparison of solar cell reading when they are connected in parallel and in series.
Name:________________________________________ Kit #______________________ Per._______
PV Activity 1: Series and Parallel PV Cell Connections Page 1.2
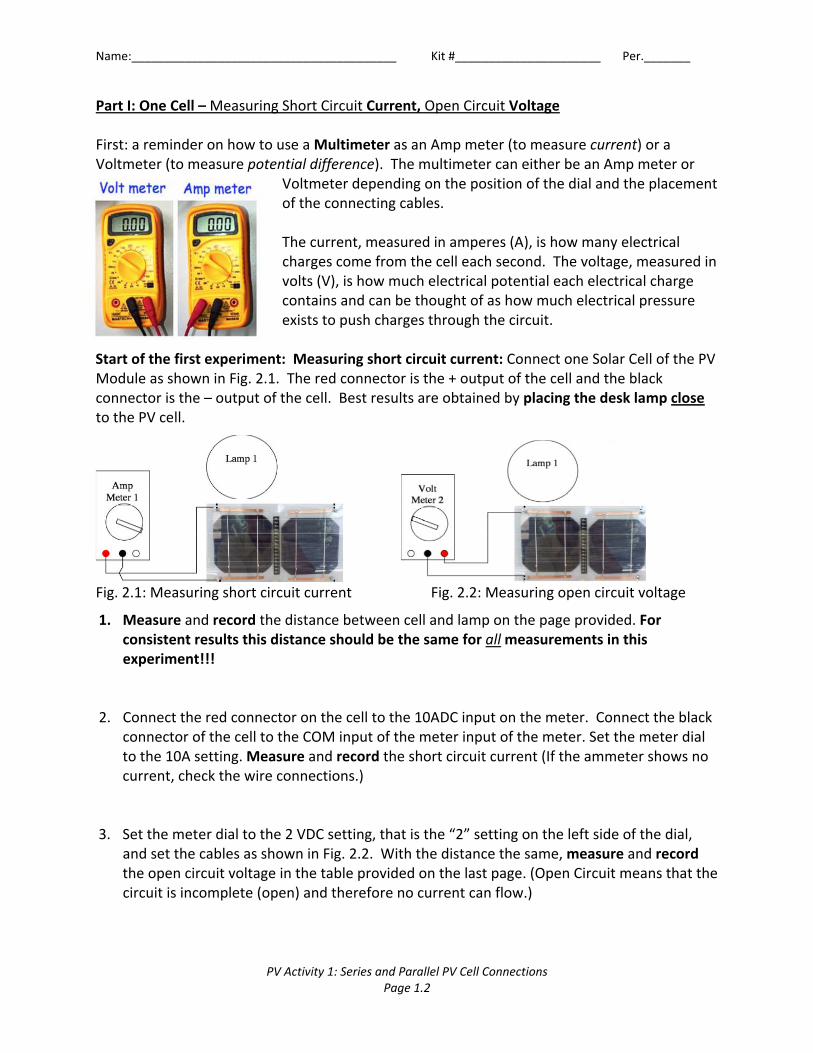
Part I: One Cell – Measuring Short Circuit Current, Open Circuit Voltage First: a reminder on how to use a Multimeter as an Amp meter (to measure current) or a Voltmeter (to measure potential difference). The multimeter can either be an Amp meter or
Voltmeter depending on the position of the dial and the placement of the connecting cables. The current, measured in amperes (A), is how many electrical charges come from the cell each second. The voltage, measured in volts (V), is how much electrical potential each electrical charge contains and can be thought of as how much electrical pressure exists to push charges through the circuit.
Start of the first experiment: Measuring short circuit current: Connect one Solar Cell of the PV Module as shown in Fig. 2.1. The red connector is the + output of the cell and the black connector is the – output of the cell. Best results are obtained by placing the desk lamp close to the PV cell.
Fig. 2.1: Measuring short circuit current Fig. 2.2: Measuring open circuit voltage
1. Measure and record the distance between cell and lamp on the page provided. For consistent results this distance should be the same for all measurements in this experiment!!!
2. Connect the red connector on the cell to the 10ADC input on the meter. Connect the black
connector of the cell to the COM input of the meter input of the meter. Set the meter dial to the 10A setting. Measure and record the short circuit current (If the ammeter shows no current, check the wire connections.)
3. Set the meter dial to the 2 VDC setting, that is the “2” setting on the left side of the dial,
and set the cables as shown in Fig. 2.2. With the distance the same, measure and record the open circuit voltage in the table provided on the last page. (Open Circuit means that the circuit is incomplete (open) and therefore no current can flow.)
Name:________________________________________ Kit #______________________ Per._______
PV Activity 1: Series and Parallel PV Cell Connections Page 1.3
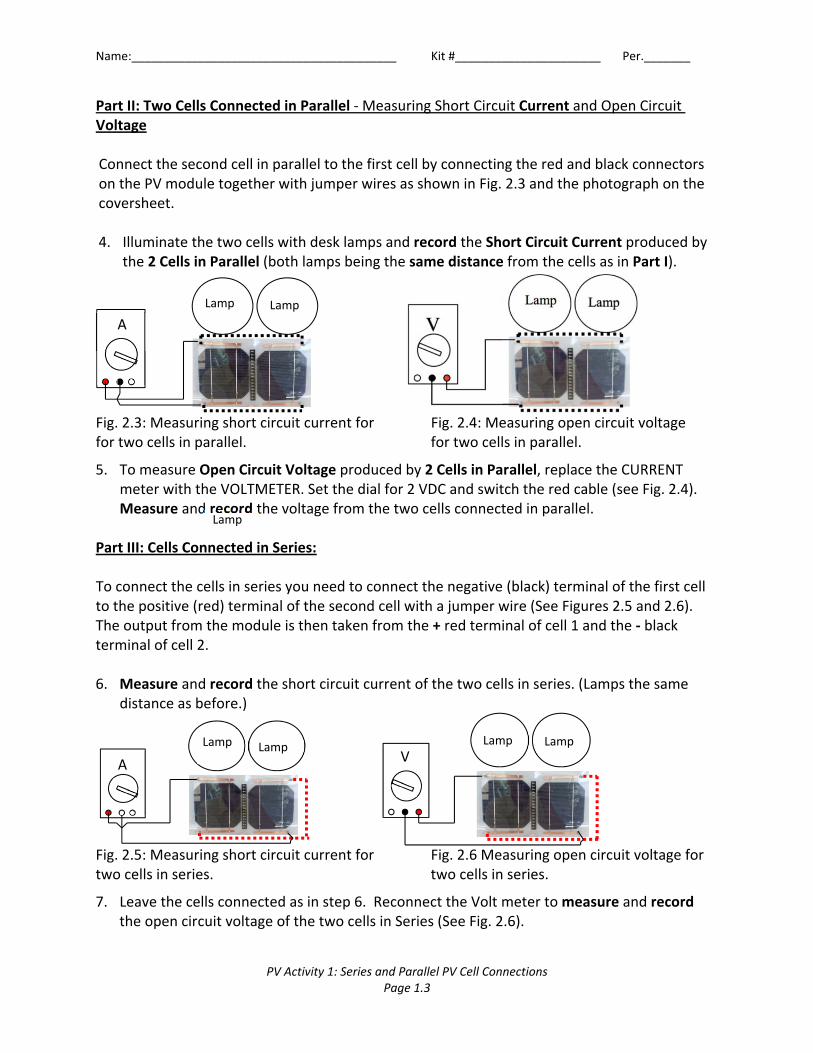
Part II: Two Cells Connected in Parallel ‐ Measuring Short Circuit Current and Open Circuit Voltage Connect the second cell in parallel to the first cell by connecting the red and black connectors on the PV module together with jumper wires as shown in Fig. 2.3 and the photograph on the coversheet. 4. Illuminate the two cells with desk lamps and record the Short Circuit Current produced by
the 2 Cells in Parallel (both lamps being the same distance from the cells as in Part I).
Fig. 2.3: Measuring short circuit current for Fig. 2.4: Measuring open circuit voltage for two cells in parallel. for two cells in parallel.
5. To measure Open Circuit Voltage produced by 2 Cells in Parallel, replace the CURRENT meter with the VOLTMETER. Set the dial for 2 VDC and switch the red cable (see Fig. 2.4). Measure and record the voltage from the two cells connected in parallel.
Part III: Cells Connected in Series: To connect the cells in series you need to connect the negative (black) terminal of the first cell to the positive (red) terminal of the second cell with a jumper wire (See Figures 2.5 and 2.6). The output from the module is then taken from the + red terminal of cell 1 and the ‐ black terminal of cell 2. 6. Measure and record the short circuit current of the two cells in series. (Lamps the same
distance as before.)
Fig. 2.5: Measuring short circuit current for Fig. 2.6 Measuring open circuit voltage for two cells in series. two cells in series.
7. Leave the cells connected as in step 6. Reconnect the Volt meter to measure and record the open circuit voltage of the two cells in Series (See Fig. 2.6).
Lamp
Lamp
V
Lamp
A
A
Lamp Lamp Lamp
Lamp
Name:________________________________________ Kit #______________________ Per._______
PV Activity 1: Series and Parallel PV Cell Connections Page 1.4
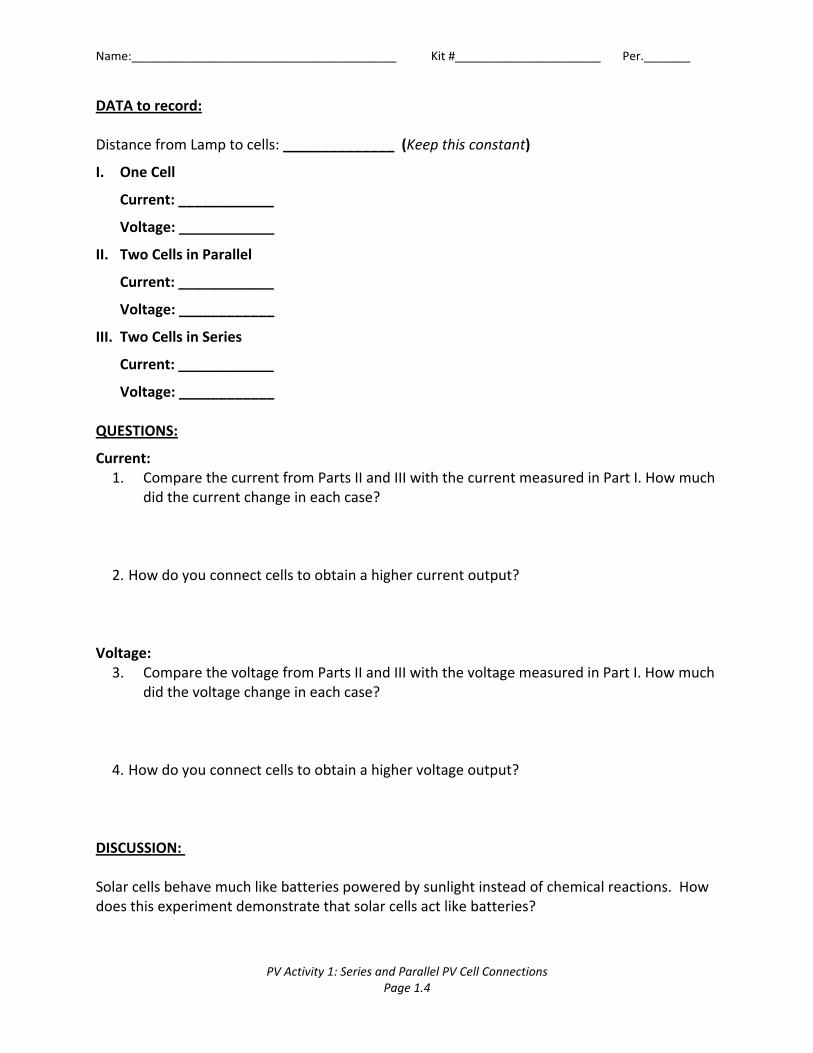
DATA to record:
Distance from Lamp to cells: ______________ (Keep this constant)
I. One Cell
Current: ____________
Voltage: ____________
II. Two Cells in Parallel
Current: ____________
Voltage: ____________
III. Two Cells in Series
Current: ____________
Voltage: ____________ QUESTIONS:
Current: 1. Compare the current from Parts II and III with the current measured in Part I. How much
did the current change in each case?
2. How do you connect cells to obtain a higher current output? Voltage:
3. Compare the voltage from Parts II and III with the voltage measured in Part I. How much did the voltage change in each case?
4. How do you connect cells to obtain a higher voltage output? DISCUSSION: Solar cells behave much like batteries powered by sunlight instead of chemical reactions. How does this experiment demonstrate that solar cells act like batteries?
By Stanley Micklavzina and Frank Vignola for the Meyer Fund for Sustainable Development and the University of Oregon Department of Physics and Solar Radiation Monitoring Laboratory Page 2.1 6/20/2011
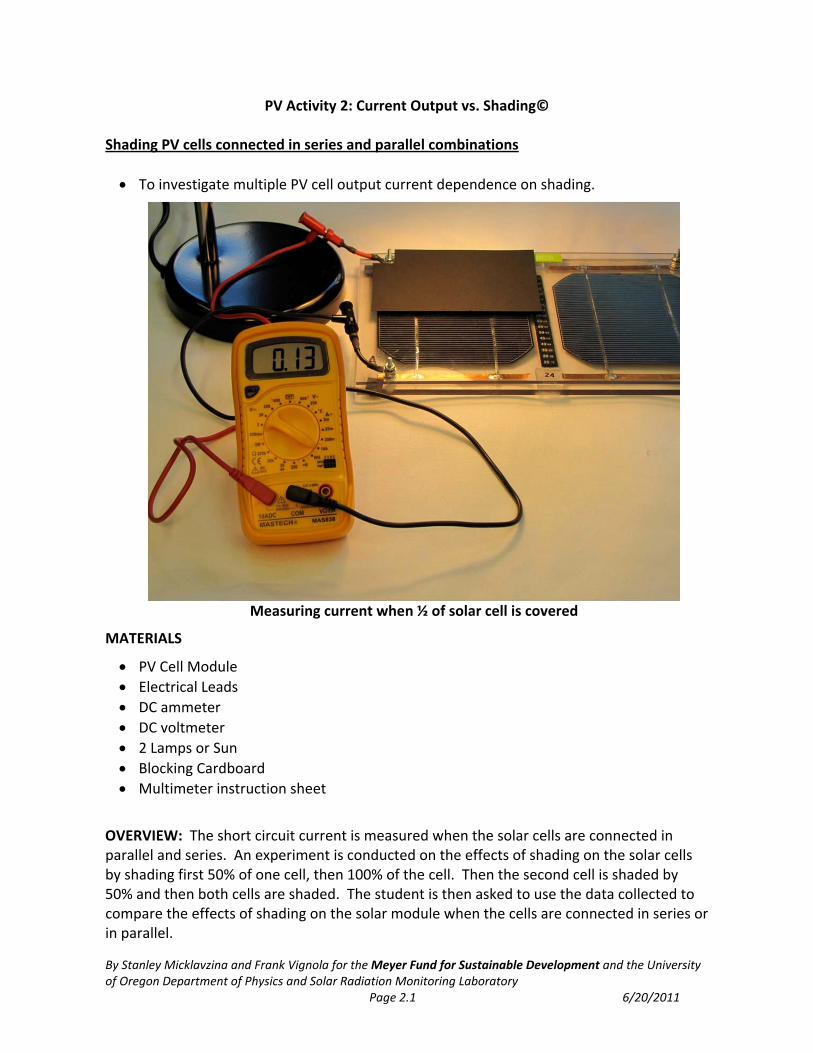
PV Activity 2: Current Output vs. Shading©
Shading PV cells connected in series and parallel combinations
To investigate multiple PV cell output current dependence on shading.
Measuring current when ½ of solar cell is covered
MATERIALS
PV Cell Module
Electrical Leads
DC ammeter
DC voltmeter
2 Lamps or Sun
Blocking Cardboard
Multimeter instruction sheet
OVERVIEW: The short circuit current is measured when the solar cells are connected in parallel and series. An experiment is conducted on the effects of shading on the solar cells by shading first 50% of one cell, then 100% of the cell. Then the second cell is shaded by 50% and then both cells are shaded. The student is then asked to use the data collected to compare the effects of shading on the solar module when the cells are connected in series or in parallel.
Name: _____________________________________ Kit #___________ Period __________
PV Activity 2: Current Output vs. Shading Page 2.2
A
Lamp
Lamp
Fig. 2.3: Connections for measuring short circuit current with solar cells connected in parallel.
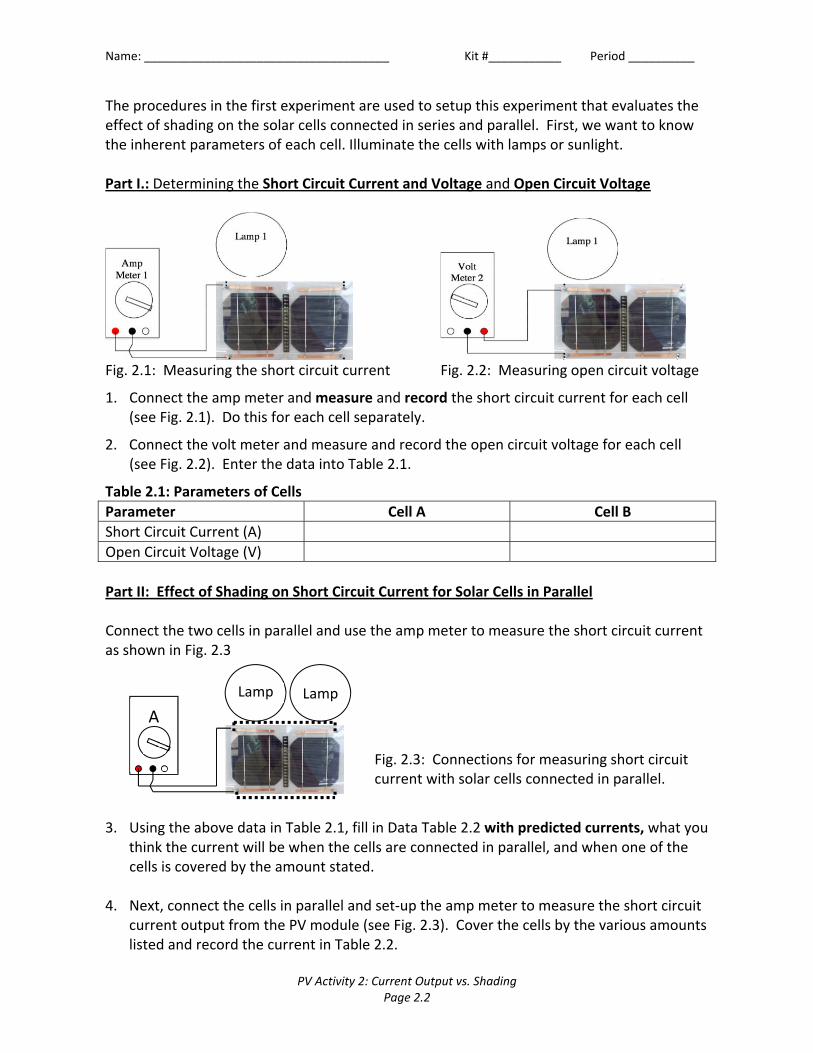
The procedures in the first experiment are used to setup this experiment that evaluates the effect of shading on the solar cells connected in series and parallel. First, we want to know the inherent parameters of each cell. Illuminate the cells with lamps or sunlight. Part I.: Determining the Short Circuit Current and Voltage and Open Circuit Voltage
Fig. 2.1: Measuring the short circuit current Fig. 2.2: Measuring open circuit voltage
1. Connect the amp meter and measure and record the short circuit current for each cell (see Fig. 2.1). Do this for each cell separately.
2. Connect the volt meter and measure and record the open circuit voltage for each cell (see Fig. 2.2). Enter the data into Table 2.1.
Table 2.1: Parameters of Cells
Parameter Cell A Cell B
Short Circuit Current (A)
Open Circuit Voltage (V)
Part II: Effect of Shading on Short Circuit Current for Solar Cells in Parallel Connect the two cells in parallel and use the amp meter to measure the short circuit current as shown in Fig. 2.3
3. Using the above data in Table 2.1, fill in Data Table 2.2 with predicted currents, what you
think the current will be when the cells are connected in parallel, and when one of the cells is covered by the amount stated.
4. Next, connect the cells in parallel and set‐up the amp meter to measure the short circuit
current output from the PV module (see Fig. 2.3). Cover the cells by the various amounts listed and record the current in Table 2.2.
Name: _____________________________________ Kit #___________ Period __________
PV Activity 2: Current Output vs. Shading Page 2.3
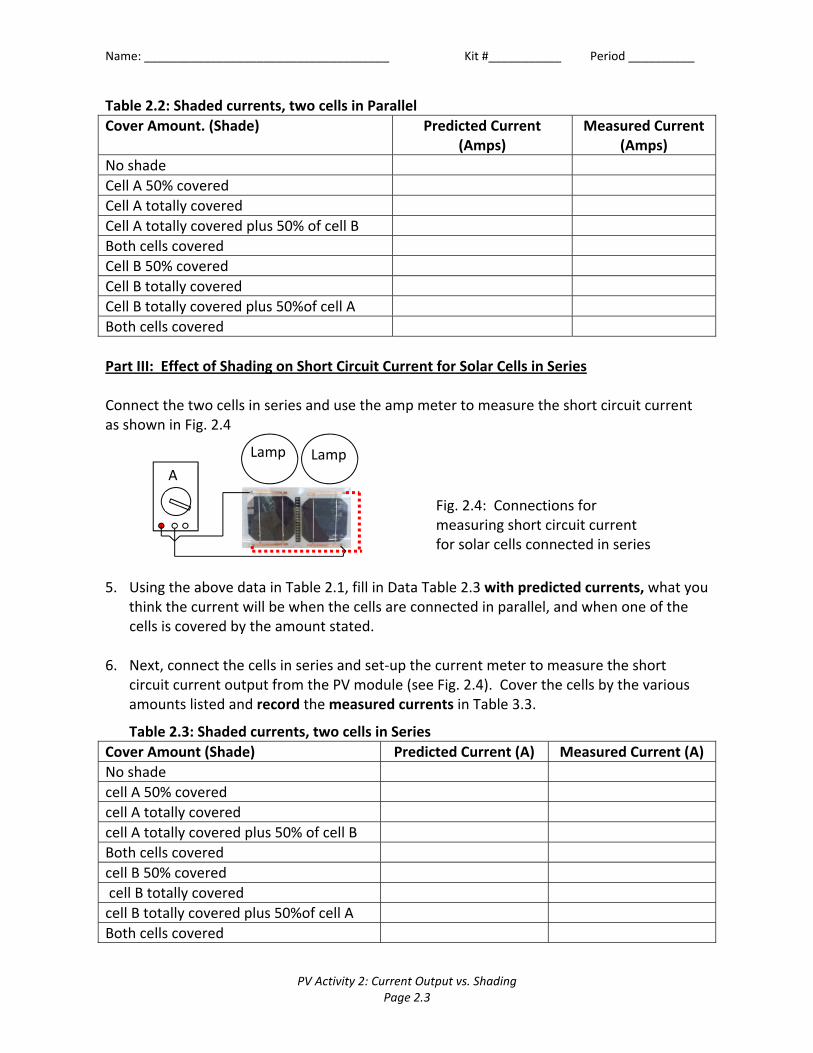
Fig. 2.4: Connections for measuring short circuit current for solar cells connected in series
Table 2.2: Shaded currents, two cells in Parallel
Cover Amount. (Shade) Predicted Current (Amps)
Measured Current (Amps)
No shade
Cell A 50% covered
Cell A totally covered
Cell A totally covered plus 50% of cell B
Both cells covered
Cell B 50% covered
Cell B totally covered
Cell B totally covered plus 50%of cell A
Both cells covered
Part III: Effect of Shading on Short Circuit Current for Solar Cells in Series
Connect the two cells in series and use the amp meter to measure the short circuit current as shown in Fig. 2.4
5. Using the above data in Table 2.1, fill in Data Table 2.3 with predicted currents, what you
think the current will be when the cells are connected in parallel, and when one of the cells is covered by the amount stated.
6. Next, connect the cells in series and set‐up the current meter to measure the short circuit current output from the PV module (see Fig. 2.4). Cover the cells by the various amounts listed and record the measured currents in Table 3.3.
Table 2.3: Shaded currents, two cells in Series
Cover Amount (Shade) Predicted Current (A) Measured Current (A)
No shade
cell A 50% covered
cell A totally covered
cell A totally covered plus 50% of cell B
Both cells covered
cell B 50% covered
cell B totally covered
cell B totally covered plus 50%of cell A
Both cells covered
A
Lamp Lamp
Name: _____________________________________ Kit #___________ Period __________
PV Activity 2: Current Output vs. Shading Page 2.4
Questions: What relationship exists between the amount of shade and current output in the parallel case? Does the current decrease by 1/2 when one cell is covered? Discussion: What relationship exists between the amount of shade and current output in the series case? (You can plot a graph of Current vs. Amount of Shade to try and see what kind of relationship exists.) Does shading affect the solar module different if the cells are connected in series than if they are connected parallel? If yes, why is this so? EXTRA INVESTICATION SUGGESTION. You can repeat the experiment and measure the voltage instead of the current.
By Stanley Micklavzina, Asher Tubman, and Frank Vignola for the Meyer Fund for Sustainable Development and the University of Oregon Department of Physics and the Solar Radiation Monitoring Laboratory Page 3.1 6/20/2011
PVActivity3–PVLoads©
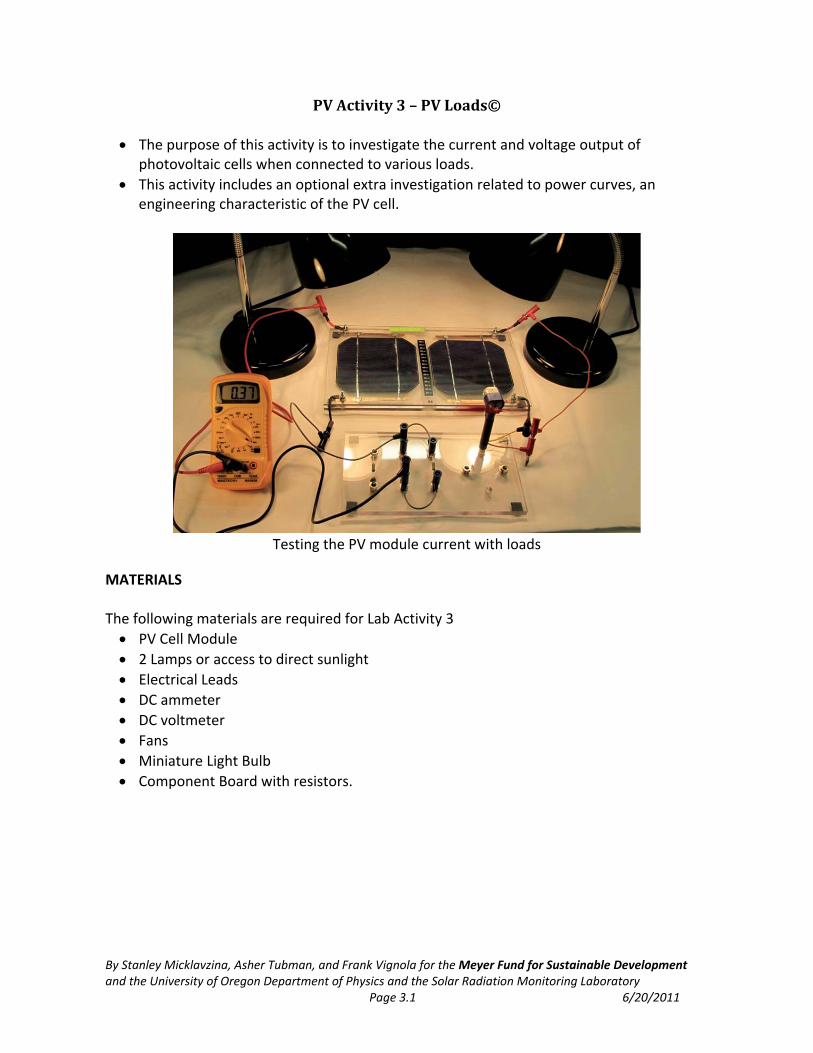
The purpose of this activity is to investigate the current and voltage output of photovoltaic cells when connected to various loads.
This activity includes an optional extra investigation related to power curves, an engineering characteristic of the PV cell.
Testing the PV module current with loads
MATERIALS The following materials are required for Lab Activity 3
PV Cell Module
2 Lamps or access to direct sunlight
Electrical Leads
DC ammeter
DC voltmeter
Fans
Miniature Light Bulb
Component Board with resistors.
Name: _____________________________ Kit #______________ Per:________
PV Activity 3 – PV Loads Page 3.2
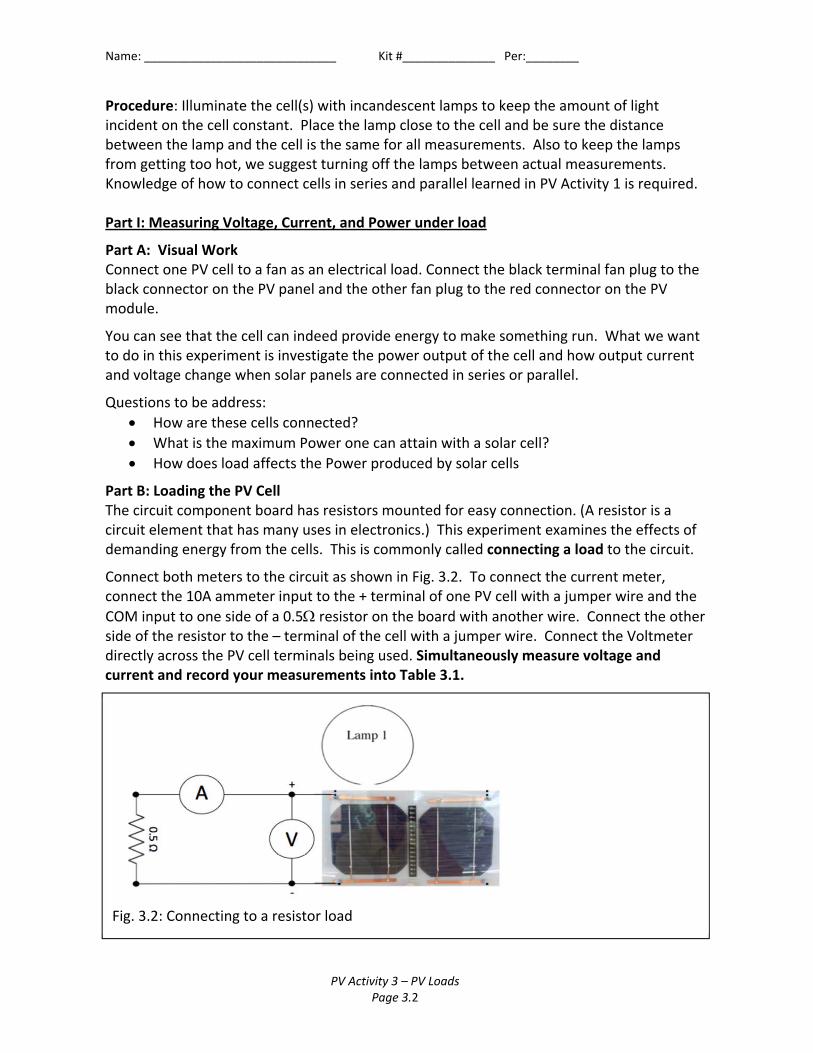
Fig. 3.2: Connecting to a resistor load
Procedure: Illuminate the cell(s) with incandescent lamps to keep the amount of light incident on the cell constant. Place the lamp close to the cell and be sure the distance between the lamp and the cell is the same for all measurements. Also to keep the lamps from getting too hot, we suggest turning off the lamps between actual measurements. Knowledge of how to connect cells in series and parallel learned in PV Activity 1 is required. Part I: Measuring Voltage, Current, and Power under load
Part A: Visual Work Connect one PV cell to a fan as an electrical load. Connect the black terminal fan plug to the black connector on the PV panel and the other fan plug to the red connector on the PV module.
You can see that the cell can indeed provide energy to make something run. What we want to do in this experiment is investigate the power output of the cell and how output current and voltage change when solar panels are connected in series or parallel.
Questions to be address:
How are these cells connected?
What is the maximum Power one can attain with a solar cell?
How does load affects the Power produced by solar cells
Part B: Loading the PV Cell The circuit component board has resistors mounted for easy connection. (A resistor is a circuit element that has many uses in electronics.) This experiment examines the effects of demanding energy from the cells. This is commonly called connecting a load to the circuit.
Connect both meters to the circuit as shown in Fig. 3.2. To connect the current meter, connect the 10A ammeter input to the + terminal of one PV cell with a jumper wire and the
COM input to one side of a 0.5 resistor on the board with another wire. Connect the other side of the resistor to the – terminal of the cell with a jumper wire. Connect the Voltmeter directly across the PV cell terminals being used. Simultaneously measure voltage and current and record your measurements into Table 3.1.
Name: _____________________________ Kit #______________ Per:________
PV Activity 3 – PV Loads Page 3.3
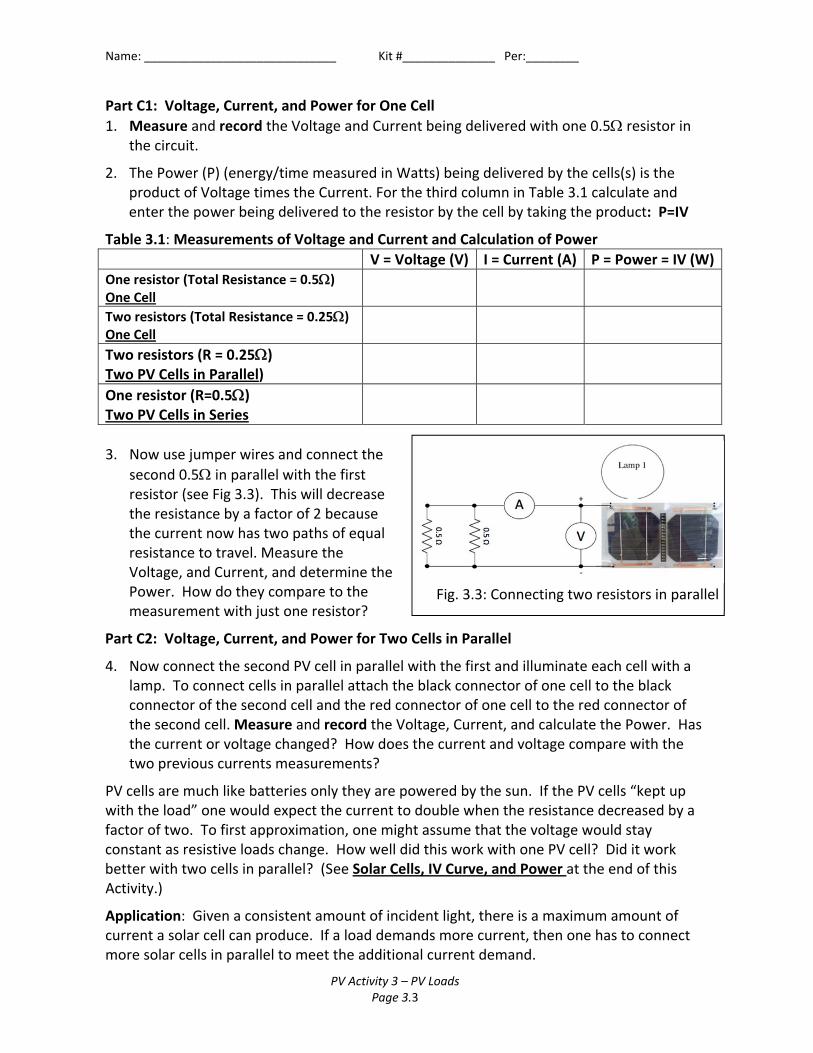
Fig. 3.3: Connecting two resistors in parallel
Part C1: Voltage, Current, and Power for One Cell
1. Measure and record the Voltage and Current being delivered with one 0.5 resistor in the circuit.
2. The Power (P) (energy/time measured in Watts) being delivered by the cells(s) is the product of Voltage times the Current. For the third column in Table 3.1 calculate and enter the power being delivered to the resistor by the cell by taking the product: P=IV
Table 3.1: Measurements of Voltage and Current and Calculation of Power
V = Voltage (V) I = Current (A) P = Power = IV (W)One resistor (Total Resistance = 0.5) One Cell
Two resistors (Total Resistance = 0.25) One Cell
Two resistors (R = 0.25) Two PV Cells in Parallel)
One resistor (R=0.5) Two PV Cells in Series
3. Now use jumper wires and connect the
second 0.5 in parallel with the first resistor (see Fig 3.3). This will decrease the resistance by a factor of 2 because the current now has two paths of equal resistance to travel. Measure the Voltage, and Current, and determine the Power. How do they compare to the measurement with just one resistor?
Part C2: Voltage, Current, and Power for Two Cells in Parallel
4. Now connect the second PV cell in parallel with the first and illuminate each cell with a lamp. To connect cells in parallel attach the black connector of one cell to the black connector of the second cell and the red connector of one cell to the red connector of the second cell. Measure and record the Voltage, Current, and calculate the Power. Has the current or voltage changed? How does the current and voltage compare with the two previous currents measurements?
PV cells are much like batteries only they are powered by the sun. If the PV cells “kept up with the load” one would expect the current to double when the resistance decreased by a factor of two. To first approximation, one might assume that the voltage would stay constant as resistive loads change. How well did this work with one PV cell? Did it work better with two cells in parallel? (See Solar Cells, IV Curve, and Power at the end of this Activity.)
Application: Given a consistent amount of incident light, there is a maximum amount of current a solar cell can produce. If a load demands more current, then one has to connect more solar cells in parallel to meet the additional current demand.
Name: _____________________________ Kit #______________ Per:________
PV Activity 3 – PV Loads Page 3.4
Part D: Power, Two Cells in Series
5. Connect the two cells in series (refer to PV Activity 1) to one 0.5 resistor. Measure and record the Current, Voltage and calculate the Power in Table 3.1. How does the Power
compare with one 0.5 connected to one cell measured in Part C Step 1? How much did the voltage and current change?
Application: Voltage (energy per charge) is related to the energy delivered by each charge. Two PV cells connected in series increases the energy for each charge. However, the current remains constant. The power delivered is higher since the energy per charge is greater and but the number of changes remains the same. This is one reason why solar cells are connected in series in Solar Panels, to be able to provide enough voltage to meet the rated requirements.
Discussion: Write down your comments and what you learned or questions you have after completing Part I. Part II: Rated Voltage and Power
Devices are designed to operate at a specific Voltage and Power. The electrical charges must have the right energy in order to make the device operate properly. This Part will look at this aspect of an electrical circuit.
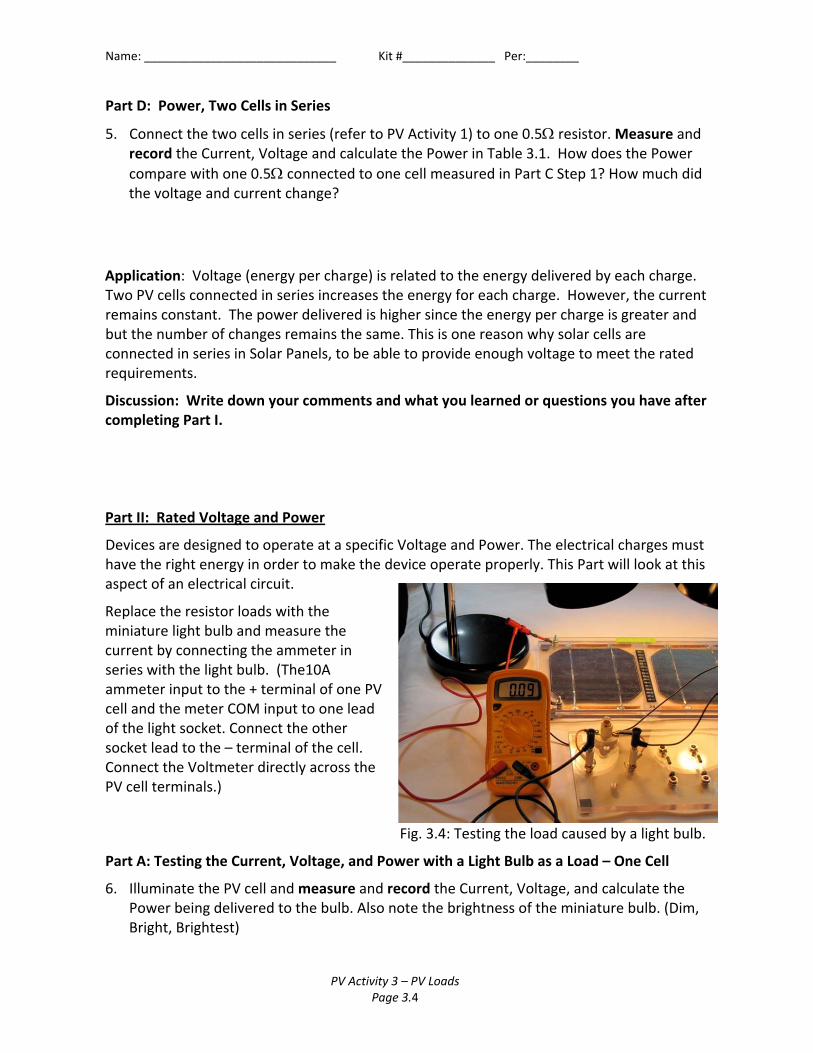
Replace the resistor loads with the miniature light bulb and measure the current by connecting the ammeter in series with the light bulb. (The10A ammeter input to the + terminal of one PV cell and the meter COM input to one lead of the light socket. Connect the other socket lead to the – terminal of the cell. Connect the Voltmeter directly across the PV cell terminals.)
Fig. 3.4: Testing the load caused by a light bulb.
Part A: Testing the Current, Voltage, and Power with a Light Bulb as a Load – One Cell
6. Illuminate the PV cell and measure and record the Current, Voltage, and calculate the Power being delivered to the bulb. Also note the brightness of the miniature bulb. (Dim, Bright, Brightest)
Name: _____________________________ Kit #______________ Per:________
PV Activity 3 – PV Loads Page 3.5
Part B: Testing the Current, Voltage, and Power with a Light Bulb as a Load – Two Cells
7. Connect the second PV cell in parallel with the first cell and again measure the Current, Voltage, and Power delivered to the miniature bulb. Is the bulb brighter than it was in step 1?
8. Connect the second PV cell in series with the first cell. Again measure the Current, Voltage, and Power being delivered to the miniature bulb. Is the bulb brighter than in steps 1 and 2? Which produces the brightest light output, the cells connected in series or parallel?
Table 3.2: Current, Voltage, and Power with a Light Bulb
Voltage (V) Current (A) Power (W) Bulb Brightness
Light Bulb, One Cell
Light Bulb, Two Cells in Parallel
Light Bulb, Two Cells in Series
Application: Devices are designed to consume power at a particular voltage. Cells must be connected in series and parallel combinations to provide power (P=IV) at the required voltage. The miniature bulb requires at least 1V to light properly, so there is a need to connect cells in series to obtain the voltage needed for the light bulb to light. If we wanted to light a high number of bulbs, at some point we would need to increase the current capability. Adding an additional two cells in series to get the proper voltage, and then connect this set of connected series cells in parallel to increase the available current being delivered to the bulbs.
You can see that it takes a combination of cells to construct a Solar Panel. Some cells must be connected in series to meet the desired voltage and these series connected cells must be connected in parallel to produce the needed current. The same holds true for designing a system with solar panels. Individual solar panels must be connected in series and parallel combinations to obtain a system operating at a desired voltage and power output. Discussion: Write down your comments and what you learned or questions you have after completing Part II. Extra Exercise: Assume each PV Cell is capable of delivering 0.5V and 1.5 Amps. How would you connect PV cells to obtain 3V with a power output of 9 Watts?
Name: _____________________________ Kit #______________ Per:________
PV Activity 3 – PV Loads Page 3.6
Part III A Power Curve (Extra for Experts!) Any electrically powered system has parameters where it operates. One parameter for PV cells is called The Power Curve, used by engineers to determine how to design a system for maximum efficiency. This exercise shows how the power curve for a PV cell can be determined.
As you investigated in Part I C, the amount of power a PV cell puts out is dependent on the load it is delivering power too. By taking a few more data point you can plot the power curve for these cells and determine at what load resistance is the maximum power delivered.. (Note: For this part we must take into account the actual resistance of the
current meter. Ideally it would be zero, but its actual value is 0.044) 1. Transfer your data from Table1 into the first two rows of Table 3 and record the
measurements below into Table 3.
2. Connect jumper wires to parallel connect the two 0.50 resistors to the 0.25. (Total resistance is now 0.125) This connection will again decrease the resistance by another factor of 2 from before, or by a factor of 4 from the first measurement. USE ONLY ONE CELL and record the Voltage, Current, and Power.
3. Disconnect the resistors and now connect the current meter directly across the OPV cell terminals. To measure the short circuit current. Keep the voltmeter connected across the terminals. (Ideally, the Resistance here would be zero, and the Voltage
would also be zero. However, the current meter has a resistance of 0.044 therefore we do not quite have a complete short circuit.)
4. Disconnect current meter. You can now measure the open circuit Voltage, Current and Power are now zero. The Voltmeter will still have a reading since it is connected directly to the PV cell
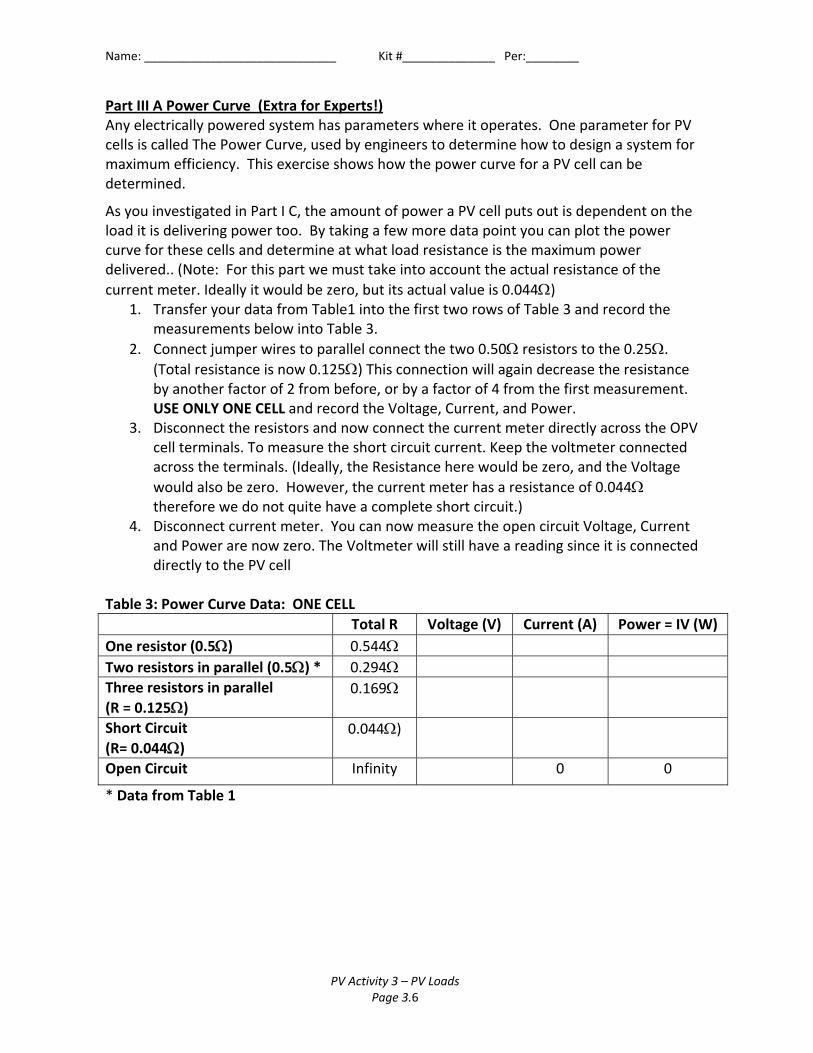
Table 3: Power Curve Data: ONE CELL
Total R Voltage (V) Current (A) Power = IV (W)
One resistor (0.5) 0.544
Two resistors in parallel (0.5) * 0.294
Three resistors in parallel
(R = 0.125) 0.169
Short Circuit
(R= 0.044) 0.044)
Open Circuit Infinity 0 0
* Data from Table 1
Name: _____________________________ Kit #______________ Per:________
PV Activity 3 – PV Loads Page 3.7
To investigate Power Curves of a PV cell, you will need to plot a number of graphs. Current vs. Voltage: This graph would show you at that at some point, the linear relationship between current and voltage starts to break down at low resistance because the cell cannot provide enough current. This is what we observed in Part C. Power vs. Voltage: Roughly the same as the previous graph, just looked at in regards to Power. You can see there is a point where the Power peaks. Power vs. Resistance: You can actually determine the resistive load where the maximum Power would be delivered. This would be the Peak Power rating. The Peak Power is when the resistance of the course is equal to the resistance of the load. Pretty advanced stuff, but this is what is looked at when systems are engineered and given rated specifications. Discussion and results if you have performed this exercise.
Name: _____________________________ Kit #______________ Per:________
PV Activity 3 – PV Loads Page 3.8
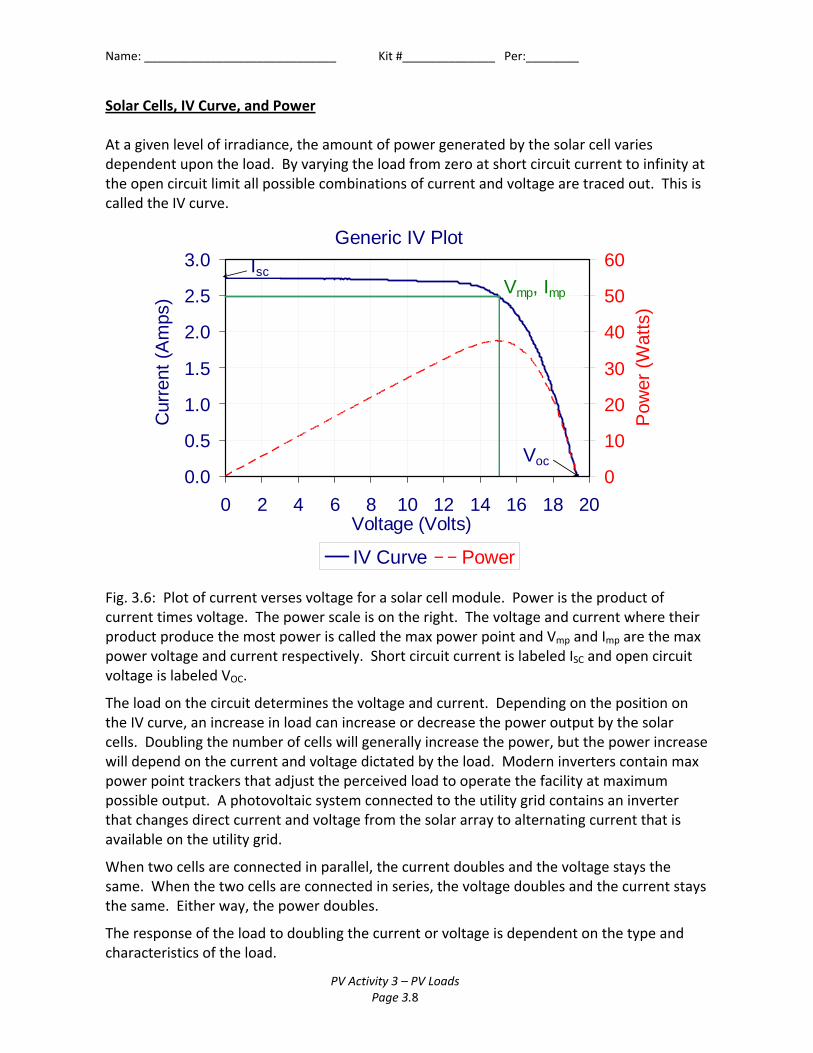
Solar Cells, IV Curve, and Power At a given level of irradiance, the amount of power generated by the solar cell varies dependent upon the load. By varying the load from zero at short circuit current to infinity at the open circuit limit all possible combinations of current and voltage are traced out. This is called the IV curve.
Fig. 3.6: Plot of current verses voltage for a solar cell module. Power is the product of current times voltage. The power scale is on the right. The voltage and current where their product produce the most power is called the max power point and Vmp and Imp are the max power voltage and current respectively. Short circuit current is labeled ISC and open circuit voltage is labeled VOC.
The load on the circuit determines the voltage and current. Depending on the position on the IV curve, an increase in load can increase or decrease the power output by the solar cells. Doubling the number of cells will generally increase the power, but the power increase will depend on the current and voltage dictated by the load. Modern inverters contain max power point trackers that adjust the perceived load to operate the facility at maximum possible output. A photovoltaic system connected to the utility grid contains an inverter that changes direct current and voltage from the solar array to alternating current that is available on the utility grid.
When two cells are connected in parallel, the current doubles and the voltage stays the same. When the two cells are connected in series, the voltage doubles and the current stays the same. Either way, the power doubles.
The response of the load to doubling the current or voltage is dependent on the type and characteristics of the load.
Generic IV Plot
0.0
0.5
1.0
1.5
2.0
2.5
3.0
0 2 4 6 8 10 12 14 16 18 20Voltage (Volts)
Cur
rent
(A
mps
)
0
10
20
30
40
50
60
Pow
er (
Wat
ts)
IV Curve Power
Vmp, Imp
Isc
Voc
By Stanley Micklavzina, Asher Tubman, and Frank Vignola for the Meyer Fund for Sustainable Development and the University of Oregon Department of Physics and the Solar Radiation Monitoring Laboratory Page 4.1 6/20/2011
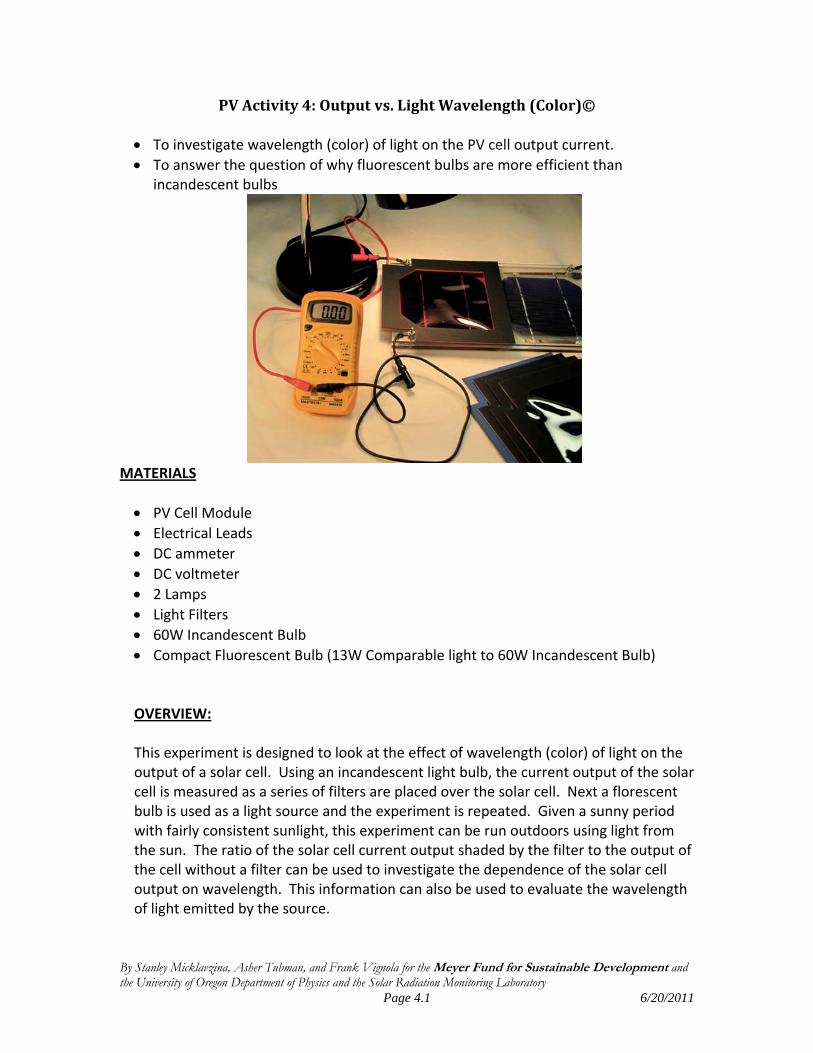
PVActivity4:Outputvs.LightWavelength(Color)©
To investigate wavelength (color) of light on the PV cell output current.
To answer the question of why fluorescent bulbs are more efficient than incandescent bulbs
MATERIALS
PV Cell Module
Electrical Leads
DC ammeter
DC voltmeter
2 Lamps
Light Filters
60W Incandescent Bulb
Compact Fluorescent Bulb (13W Comparable light to 60W Incandescent Bulb) OVERVIEW: This experiment is designed to look at the effect of wavelength (color) of light on the output of a solar cell. Using an incandescent light bulb, the current output of the solar cell is measured as a series of filters are placed over the solar cell. Next a florescent bulb is used as a light source and the experiment is repeated. Given a sunny period with fairly consistent sunlight, this experiment can be run outdoors using light from the sun. The ratio of the solar cell current output shaded by the filter to the output of the cell without a filter can be used to investigate the dependence of the solar cell output on wavelength. This information can also be used to evaluate the wavelength of light emitted by the source.
Name: ________________________________ Kit #___________ Per.__________
PV Activity 4: Output vs. Light Wavelength (Color) Page 4.2
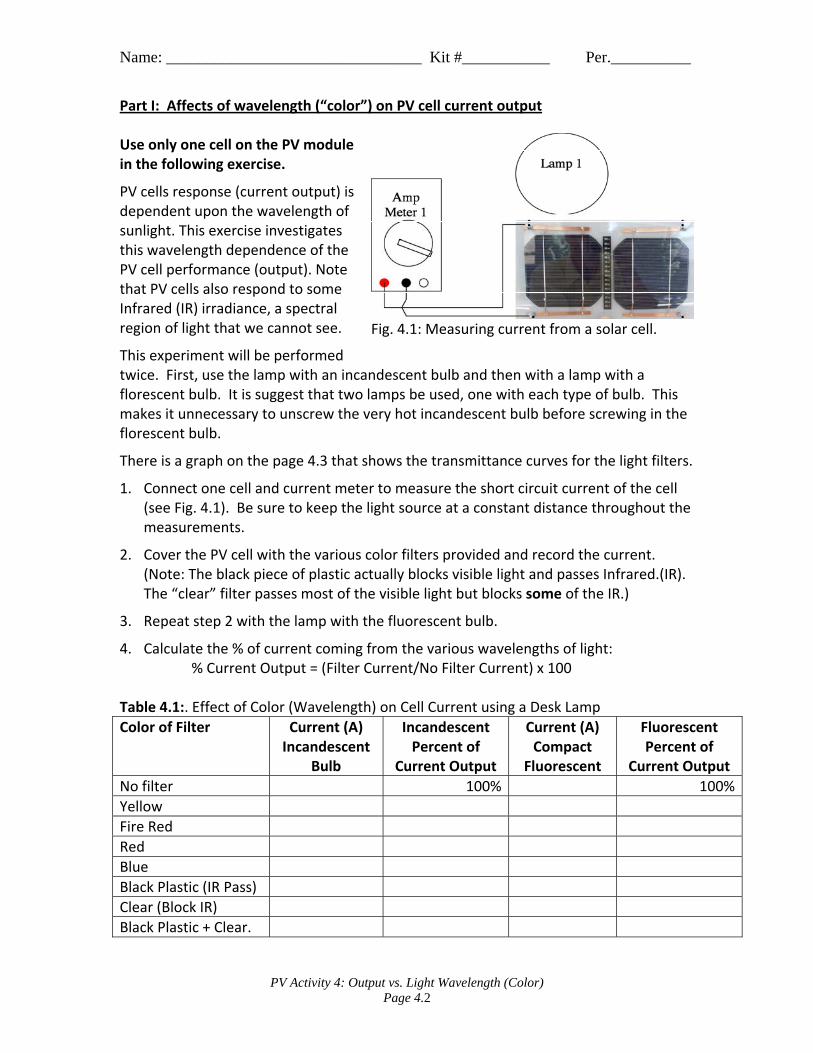
Part I: Affects of wavelength (“color”) on PV cell current output Use only one cell on the PV module in the following exercise.
PV cells response (current output) is dependent upon the wavelength of sunlight. This exercise investigates this wavelength dependence of the PV cell performance (output). Note that PV cells also respond to some Infrared (IR) irradiance, a spectral region of light that we cannot see.
This experiment will be performed twice. First, use the lamp with an incandescent bulb and then with a lamp with a florescent bulb. It is suggest that two lamps be used, one with each type of bulb. This makes it unnecessary to unscrew the very hot incandescent bulb before screwing in the florescent bulb.
There is a graph on the page 4.3 that shows the transmittance curves for the light filters.
1. Connect one cell and current meter to measure the short circuit current of the cell (see Fig. 4.1). Be sure to keep the light source at a constant distance throughout the measurements.
2. Cover the PV cell with the various color filters provided and record the current. (Note: The black piece of plastic actually blocks visible light and passes Infrared.(IR). The “clear” filter passes most of the visible light but blocks some of the IR.)
3. Repeat step 2 with the lamp with the fluorescent bulb.
4. Calculate the % of current coming from the various wavelengths of light: % Current Output = (Filter Current/No Filter Current) x 100
Table 4.1:. Effect of Color (Wavelength) on Cell Current using a Desk Lamp
Color of Filter Current (A) Incandescent
Bulb
Incandescent Percent of
Current Output
Current (A) Compact
Fluorescent
Fluorescent Percent of
Current Output
No filter 100% 100%
Yellow
Fire Red
Red
Blue
Black Plastic (IR Pass)
Clear (Block IR)
Black Plastic + Clear.
Fig. 4.1: Measuring current from a solar cell.
Name: ________________________________ Kit #___________ Per.__________
PV Activity 4: Output vs. Light Wavelength (Color) Page 4.3
Spectral distribution of light from lamps
0.00000
0.00001
0.00002
0.00003
0.00004
0.00005
300 400 500 600 700 800 900 1000 1100
Wavelength (nm)
Intensity (W/m
2‐nm)
Florescent Light Incandesent light
Blue Filter Transmission
0%
10%
20%
30%
40%
50%
60%
70%
80%
90%
100%
300 400 500 600 700 800 900 1000 1100
Wavelength (nm)
% T
rans
mis
sion
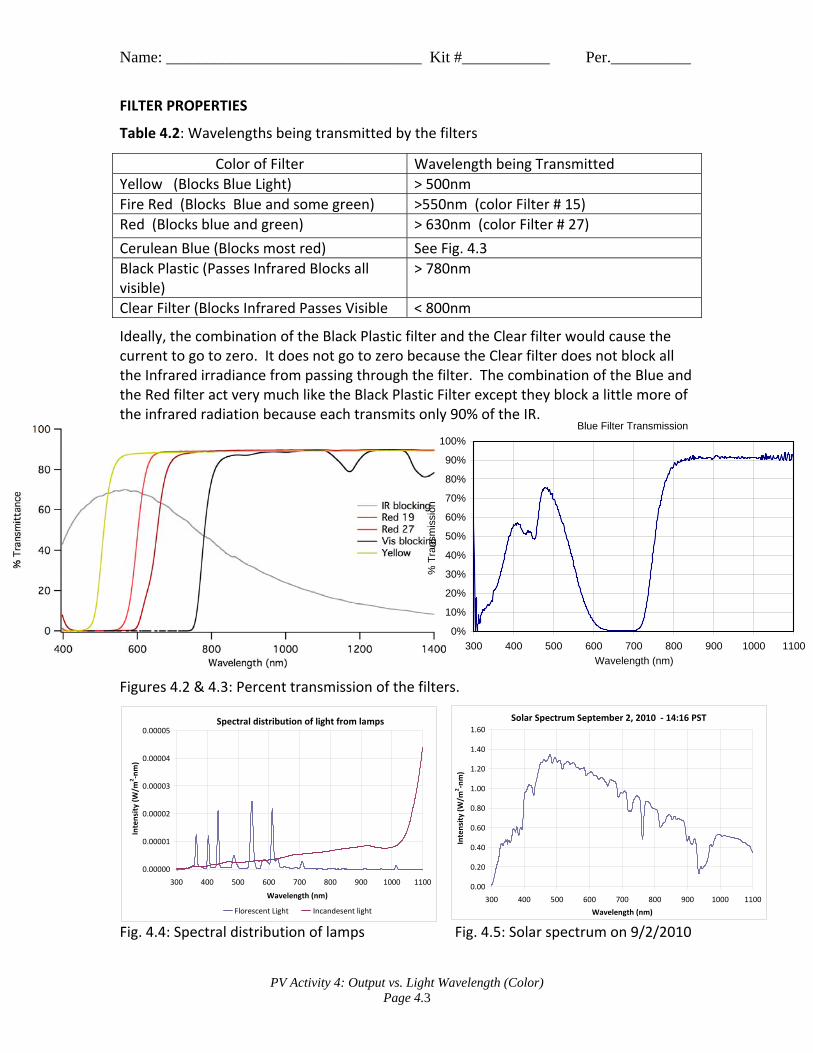
FILTER PROPERTIES
Table 4.2: Wavelengths being transmitted by the filters
Ideally, the combination of the Black Plastic filter and the Clear filter would cause the current to go to zero. It does not go to zero because the Clear filter does not block all the Infrared irradiance from passing through the filter. The combination of the Blue and the Red filter act very much like the Black Plastic Filter except they block a little more of the infrared radiation because each transmits only 90% of the IR.
Figures 4.2 & 4.3: Percent transmission of the filters.
Solar Spectrum September 2, 2010 ‐ 14:16 PST
0.00
0.20
0.40
0.60
0.80
1.00
1.20
1.40
1.60
300 400 500 600 700 800 900 1000 1100
Wavelength (nm)
Intensity (W/m
2‐nm)
Fig. 4.4: Spectral distribution of lamps Fig. 4.5: Solar spectrum on 9/2/2010
Color of Filter Wavelength being Transmitted
Yellow (Blocks Blue Light) > 500nm
Fire Red (Blocks Blue and some green) >550nm (color Filter # 15)
Red (Blocks blue and green) > 630nm (color Filter # 27)
Cerulean Blue (Blocks most red) See Fig. 4.3
Black Plastic (Passes Infrared Blocks all visible)
> 780nm
Clear Filter (Blocks Infrared Passes Visible < 800nm
Name: ________________________________ Kit #___________ Per.__________
PV Activity 4: Output vs. Light Wavelength (Color) Page 4.4
Discuss your results and include answers to the following questions. What part of the light spectrum has produced the most current from the PV Cell, Visible or Infrared (IR)? (You can observe the table data or a suggested analysis would be to graph % Current Output vs. Wavelength for the Yellow, Fire Red, Red, Blue, and Visible Blocking filters.) Why is the current output form the PV cell less for the Compact Fluorescent bulb while the illumination is about the same? Why are Compact Fluorescent bulbs replacing Incandescent bulbs in businesses and households?
Name: ________________________________ Kit #___________ Per.__________
PV Activity 4: Output vs. Light Wavelength (Color) Page 4.5
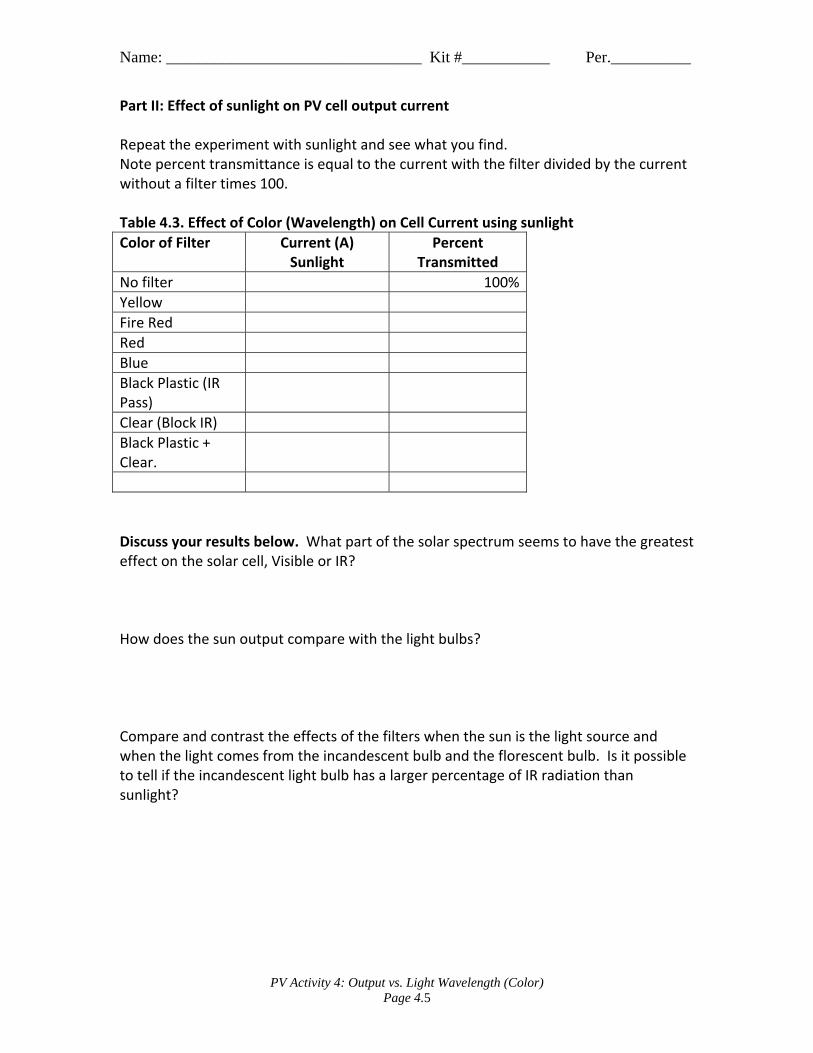
Part II: Effect of sunlight on PV cell output current Repeat the experiment with sunlight and see what you find. Note percent transmittance is equal to the current with the filter divided by the current without a filter times 100. Table 4.3. Effect of Color (Wavelength) on Cell Current using sunlight
Color of Filter Current (A) Sunlight
Percent Transmitted
No filter 100%
Yellow
Fire Red
Red
Blue
Black Plastic (IR Pass)
Clear (Block IR)
Black Plastic + Clear.
Discuss your results below. What part of the solar spectrum seems to have the greatest effect on the solar cell, Visible or IR? How does the sun output compare with the light bulbs? Compare and contrast the effects of the filters when the sun is the light source and when the light comes from the incandescent bulb and the florescent bulb. Is it possible to tell if the incandescent light bulb has a larger percentage of IR radiation than sunlight?
Name: ________________________________ Kit #___________ Per.__________
PV Activity 4: Output vs. Light Wavelength (Color) Page 4.6
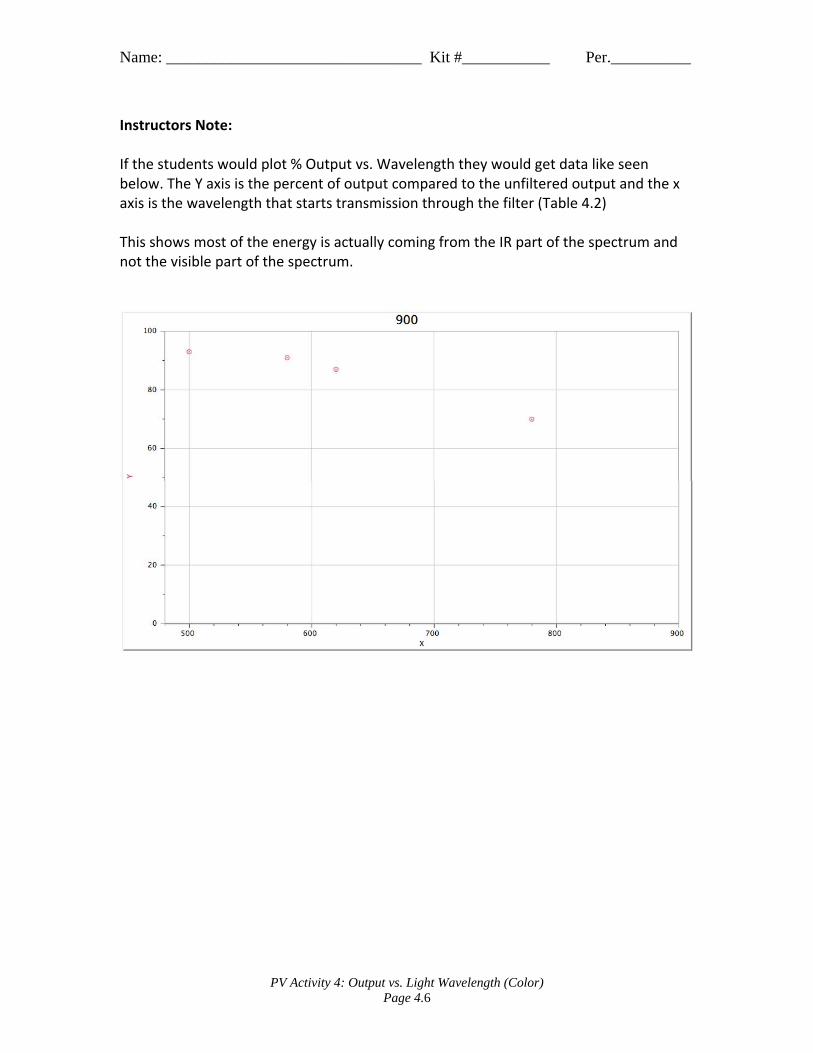
Instructors Note: If the students would plot % Output vs. Wavelength they would get data like seen below. The Y axis is the percent of output compared to the unfiltered output and the x axis is the wavelength that starts transmission through the filter (Table 4.2) This shows most of the energy is actually coming from the IR part of the spectrum and not the visible part of the spectrum.
By Stanley Micklavzina, Asher Tubman, and Frank Vignola for the Meyer Fund for Sustainable Development and the University of Oregon Department of Physics and Solar Radiation Monitoring Laboratory Page 5.1 6/20/2011
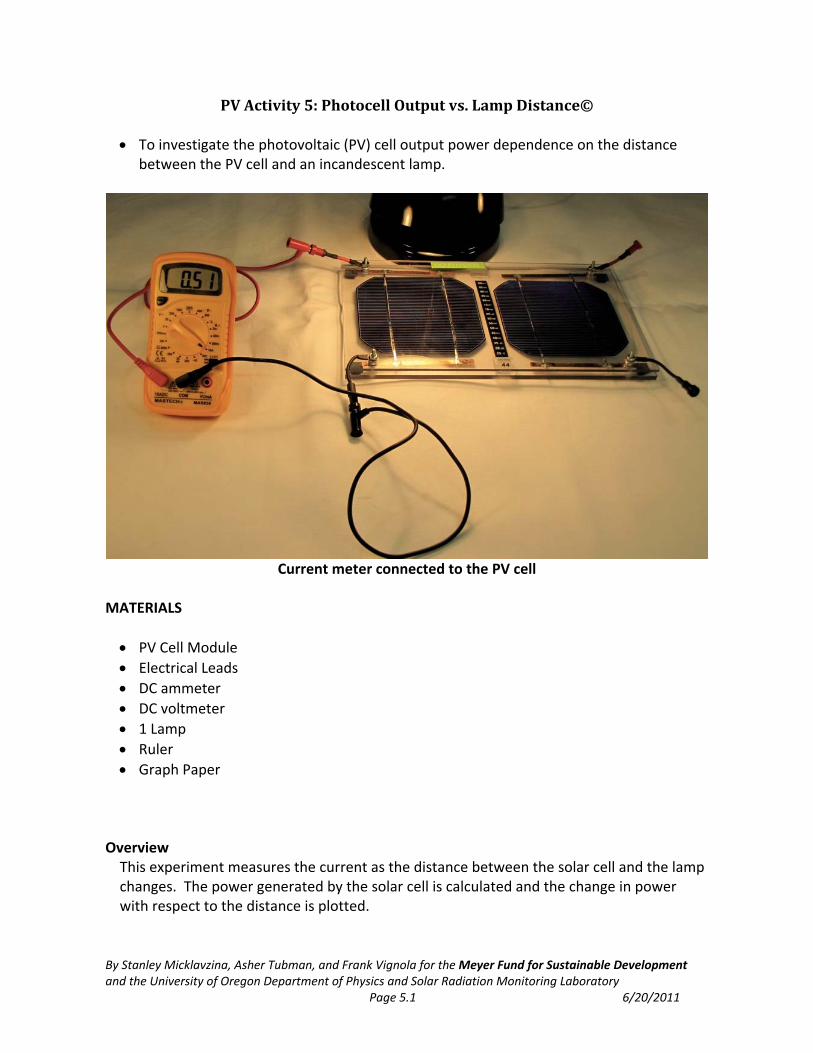
PVActivity5:PhotocellOutputvs.LampDistance©
To investigate the photovoltaic (PV) cell output power dependence on the distance between the PV cell and an incandescent lamp.
Current meter connected to the PV cell
MATERIALS
PV Cell Module
Electrical Leads
DC ammeter
DC voltmeter
1 Lamp
Ruler
Graph Paper
Overview This experiment measures the current as the distance between the solar cell and the lamp changes. The power generated by the solar cell is calculated and the change in power with respect to the distance is plotted.
Name: ______________________________________ Kit # ____________ Per: ___
PV Activity 1: Photocell Output vs. Lamp Distance Page 5.2
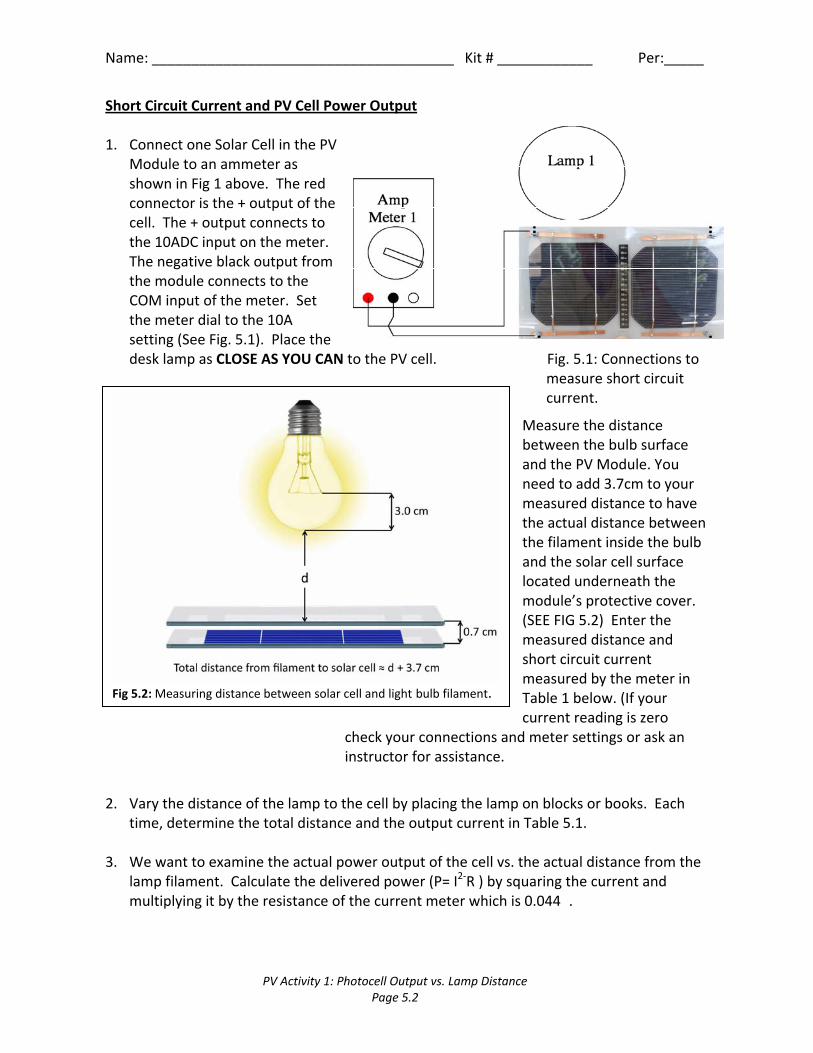
Short Circuit Current and PV Cell Power Output 1. Connect one Solar Cell in the PV
Module to an ammeter as shown in Fig 1 above. The red connector is the + output of the cell. The + output connects to the 10ADC input on the meter. The negative black output from the module connects to the COM input of the meter. Set the meter dial to the 10A setting (See Fig. 5.1). Place the desk lamp as CLOSE AS YOU CAN to the PV cell. Fig. 5.1: Connections to
measure short circuit current.
Measure the distance between the bulb surface and the PV Module. You need to add 3.7cm to your measured distance to have the actual distance between the filament inside the bulb and the solar cell surface located underneath the module’s protective cover. (SEE FIG 5.2) Enter the measured distance and short circuit current measured by the meter in Table 1 below. (If your current reading is zero
check your connections and meter settings or ask an instructor for assistance.
2. Vary the distance of the lamp to the cell by placing the lamp on blocks or books. Each
time, determine the total distance and the output current in Table 5.1. 3. We want to examine the actual power output of the cell vs. the actual distance from the
lamp filament. Calculate the delivered power (P= I2‐R ) by squaring the current and multiplying it by the resistance of the current meter which is 0.044�.
Fig 5.2: Measuring distance between solar cell and light bulb filament.
Name: ______________________________________ Kit # ____________ Per: ___
PV Activity 1: Photocell Output vs. Lamp Distance Page 5.3
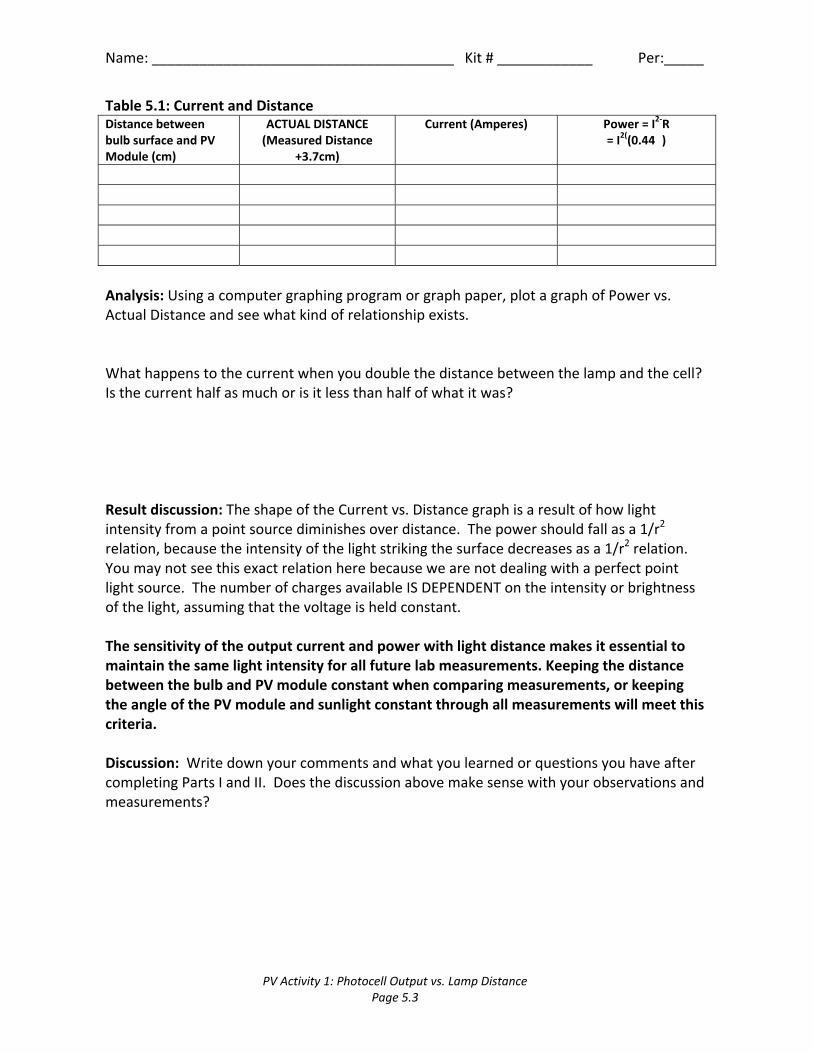
Table 5.1: Current and Distance Distance between bulb surface and PV Module (cm)
ACTUAL DISTANCE(Measured Distance
+3.7cm)
Current (Amperes) Power = I2‐R= I2((0.44�)
Analysis: Using a computer graphing program or graph paper, plot a graph of Power vs. Actual Distance and see what kind of relationship exists. What happens to the current when you double the distance between the lamp and the cell? Is the current half as much or is it less than half of what it was? Result discussion: The shape of the Current vs. Distance graph is a result of how light intensity from a point source diminishes over distance. The power should fall as a 1/r2 relation, because the intensity of the light striking the surface decreases as a 1/r2 relation. You may not see this exact relation here because we are not dealing with a perfect point light source. The number of charges available IS DEPENDENT on the intensity or brightness of the light, assuming that the voltage is held constant. The sensitivity of the output current and power with light distance makes it essential to maintain the same light intensity for all future lab measurements. Keeping the distance between the bulb and PV module constant when comparing measurements, or keeping the angle of the PV module and sunlight constant through all measurements will meet this criteria. Discussion: Write down your comments and what you learned or questions you have after completing Parts I and II. Does the discussion above make sense with your observations and measurements?
By Stanley Micklavzina, James Utterback and Frank Vignola for the Meyer Fund for Sustainable Development and the University of Oregon Department of Physics and Solar Radiation Monitoring Laboratory Page 6.1 6/20/2011
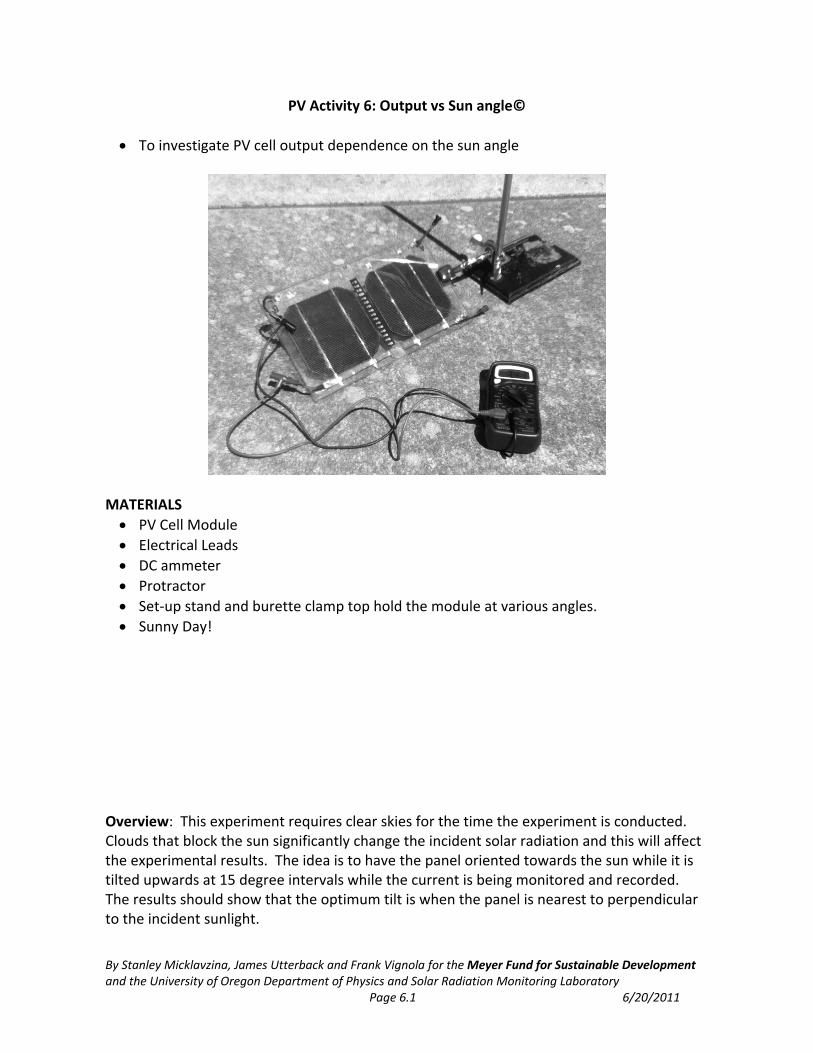
PV Activity 6: Output vs Sun angle©
To investigate PV cell output dependence on the sun angle
MATERIALS
PV Cell Module
Electrical Leads
DC ammeter
Protractor
Set‐up stand and burette clamp top hold the module at various angles.
Sunny Day! Overview: This experiment requires clear skies for the time the experiment is conducted. Clouds that block the sun significantly change the incident solar radiation and this will affect the experimental results. The idea is to have the panel oriented towards the sun while it is tilted upwards at 15 degree intervals while the current is being monitored and recorded. The results should show that the optimum tilt is when the panel is nearest to perpendicular to the incident sunlight.
Name: _____________________________________ Kit # _____ Per: _______________
PV Activity 6: Output vs. Sun angle Page 6.2
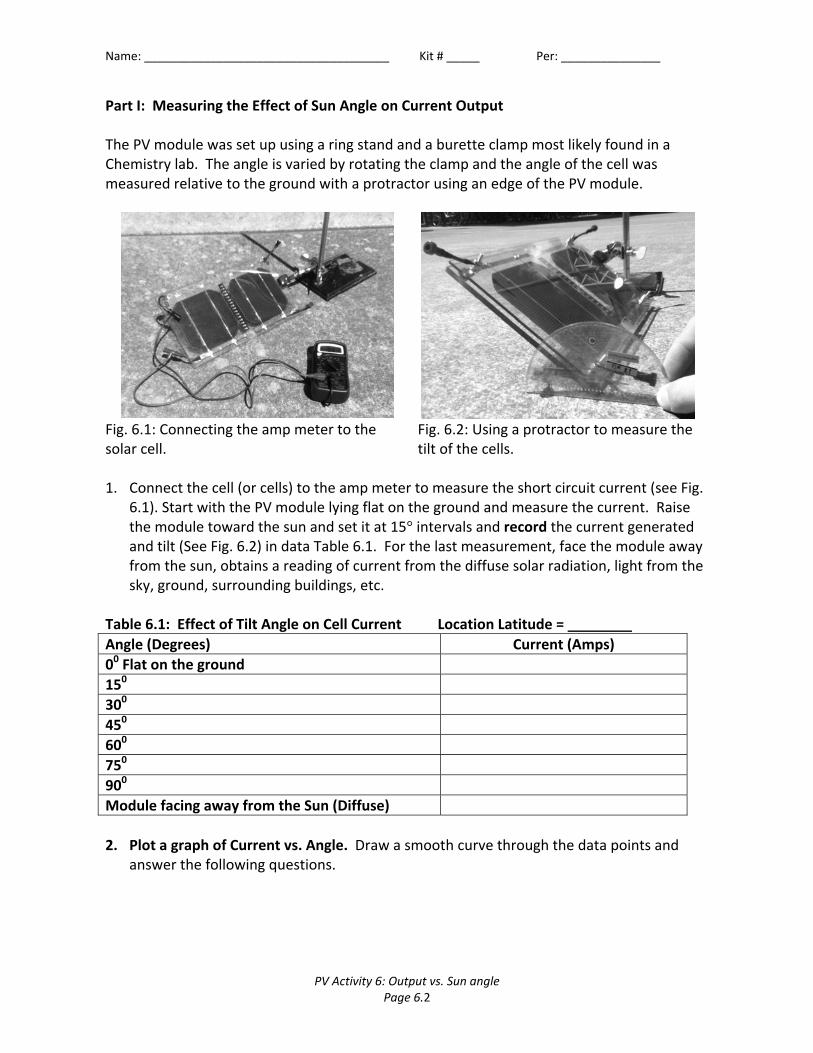
Part I: Measuring the Effect of Sun Angle on Current Output The PV module was set up using a ring stand and a burette clamp most likely found in a Chemistry lab. The angle is varied by rotating the clamp and the angle of the cell was measured relative to the ground with a protractor using an edge of the PV module.
Fig. 6.1: Connecting the amp meter to the Fig. 6.2: Using a protractor to measure the solar cell. tilt of the cells. 1. Connect the cell (or cells) to the amp meter to measure the short circuit current (see Fig.
6.1). Start with the PV module lying flat on the ground and measure the current. Raise the module toward the sun and set it at 15° intervals and record the current generated and tilt (See Fig. 6.2) in data Table 6.1. For the last measurement, face the module away from the sun, obtains a reading of current from the diffuse solar radiation, light from the sky, ground, surrounding buildings, etc.
Table 6.1: Effect of Tilt Angle on Cell Current Location Latitude =
Angle (Degrees) Current (Amps)
00 Flat on the ground
150
300
450
600
750
900
Module facing away from the Sun (Diffuse)
2. Plot a graph of Current vs. Angle. Draw a smooth curve through the data points and
answer the following questions.
Name: _____________________________________ Kit # _____ Per: _______________
PV Activity 6: Output vs. Sun angle Page 6.3
Questions: 1) At what angle is the current a maximum? 2) How does this angle compare with the latitude of the location? 3) How would this angle change over the seasons? 4) How does the maximum current compare to the current if the solar module is flat on ground? How would this change over the seasons? 5) You can see that light from the sky and surrounding environment also produces current. What percentage of the maximum current is from diffuse radiation? Discussion: An Optional Experiment: ‐ Enhanced Reflectance By placing a highly reflective surface, such as a sheet of aluminum foil between the sun and the module, the amount of ground reflected irradiance can increase significantly. Repeat the initial experiment with the aluminum reflector and compare the results. Before conducting the experiment, estimate the increase in current. After conducting the experiment, compare the estimate with the actual increase or decrease. Explain the experimental results.
Name: _____________________________________ Kit # _____ Per: _______________
PV Activity 6: Output vs. Sun angle Page 6.4
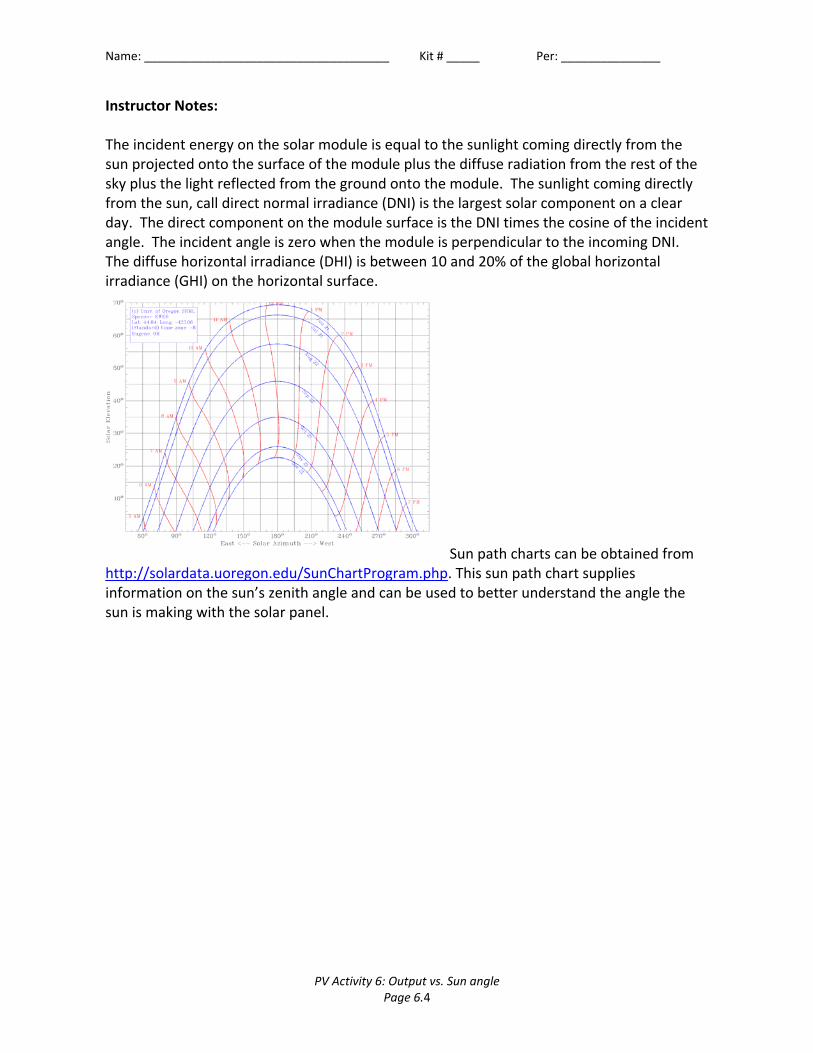
Instructor Notes: The incident energy on the solar module is equal to the sunlight coming directly from the sun projected onto the surface of the module plus the diffuse radiation from the rest of the sky plus the light reflected from the ground onto the module. The sunlight coming directly from the sun, call direct normal irradiance (DNI) is the largest solar component on a clear day. The direct component on the module surface is the DNI times the cosine of the incident angle. The incident angle is zero when the module is perpendicular to the incoming DNI. The diffuse horizontal irradiance (DHI) is between 10 and 20% of the global horizontal irradiance (GHI) on the horizontal surface.
Sun path charts can be obtained from
http://solardata.uoregon.edu/SunChartProgram.php. This sun path chart supplies information on the sun’s zenith angle and can be used to better understand the angle the sun is making with the solar panel.
Name: _____________________________________ Kit # _____ Per: _______________
PV Activity 6: Output vs. Sun angle Page 6.5
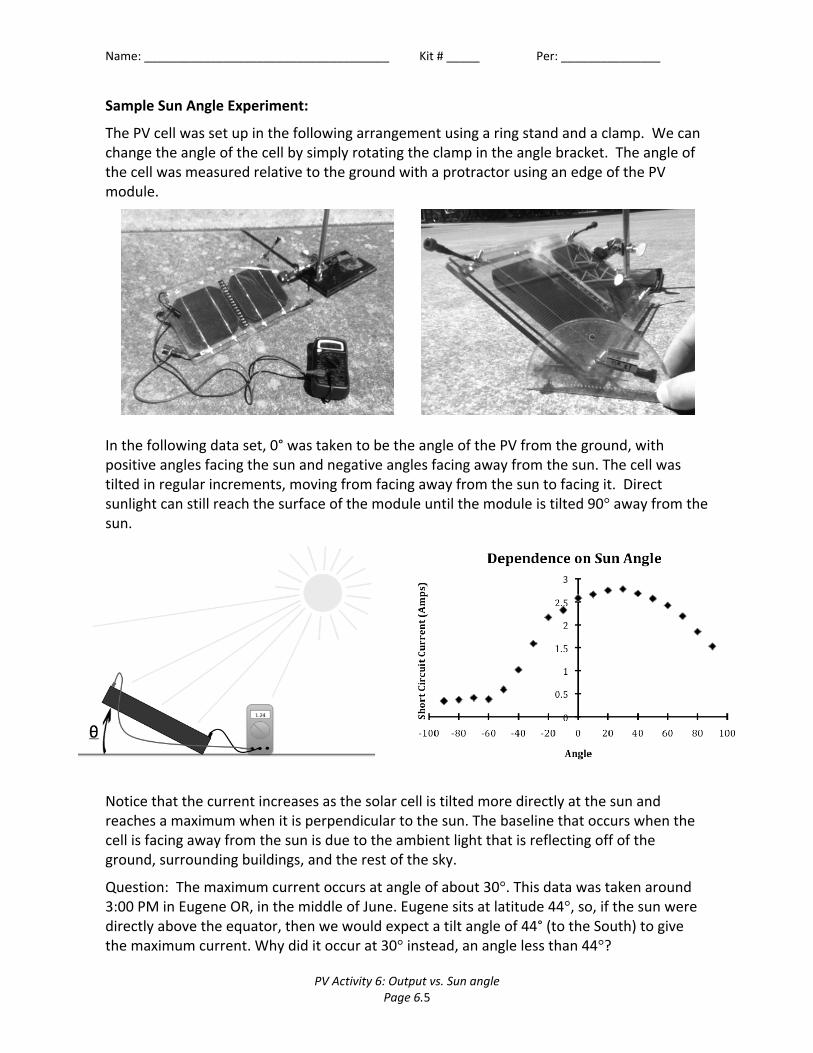
Sample Sun Angle Experiment:
The PV cell was set up in the following arrangement using a ring stand and a clamp. We can change the angle of the cell by simply rotating the clamp in the angle bracket. The angle of the cell was measured relative to the ground with a protractor using an edge of the PV module.
In the following data set, 0° was taken to be the angle of the PV from the ground, with positive angles facing the sun and negative angles facing away from the sun. The cell was tilted in regular increments, moving from facing away from the sun to facing it. Direct sunlight can still reach the surface of the module until the module is tilted 90° away from the sun.
Notice that the current increases as the solar cell is tilted more directly at the sun and reaches a maximum when it is perpendicular to the sun. The baseline that occurs when the cell is facing away from the sun is due to the ambient light that is reflecting off of the ground, surrounding buildings, and the rest of the sky.
Question: The maximum current occurs at angle of about 30°. This data was taken around 3:00 PM in Eugene OR, in the middle of June. Eugene sits at latitude 44°, so, if the sun were directly above the equator, then we would expect a tilt angle of 44° (to the South) to give the maximum current. Why did it occur at 30° instead, an angle less than 44°?
By Raghu Parthasarathy for the Meyer for the Meyer Fund for Sustainable Development and the University of Oregon Department of Physics and Solar Radiation Monitoring Laboratory Page 7.1 6/20/2011
PVActivity7:Outputvs.PVCellTemperature©
To investigate PV cell output dependence on temperature MATERIALS
PV Cell Module
DC ammeter
Meter with temperature probe
Lamp
Tray of ice or chilled metal slabs
Tray of hot water Overview: The experiment measures the open circuit voltage when temperature increased. The experiment is best performed if one starts out with the coldest temperature and lets the PV cell increase was it warms up exposure to the light source. One can also use a try of hot water to warm the cell. Be careful to keep the water away from the cells and meters.
Name:_______________________________________ Kit #___________ Per.__________
PV Activity 7: Output vs. Cell Temperature Page 7.2
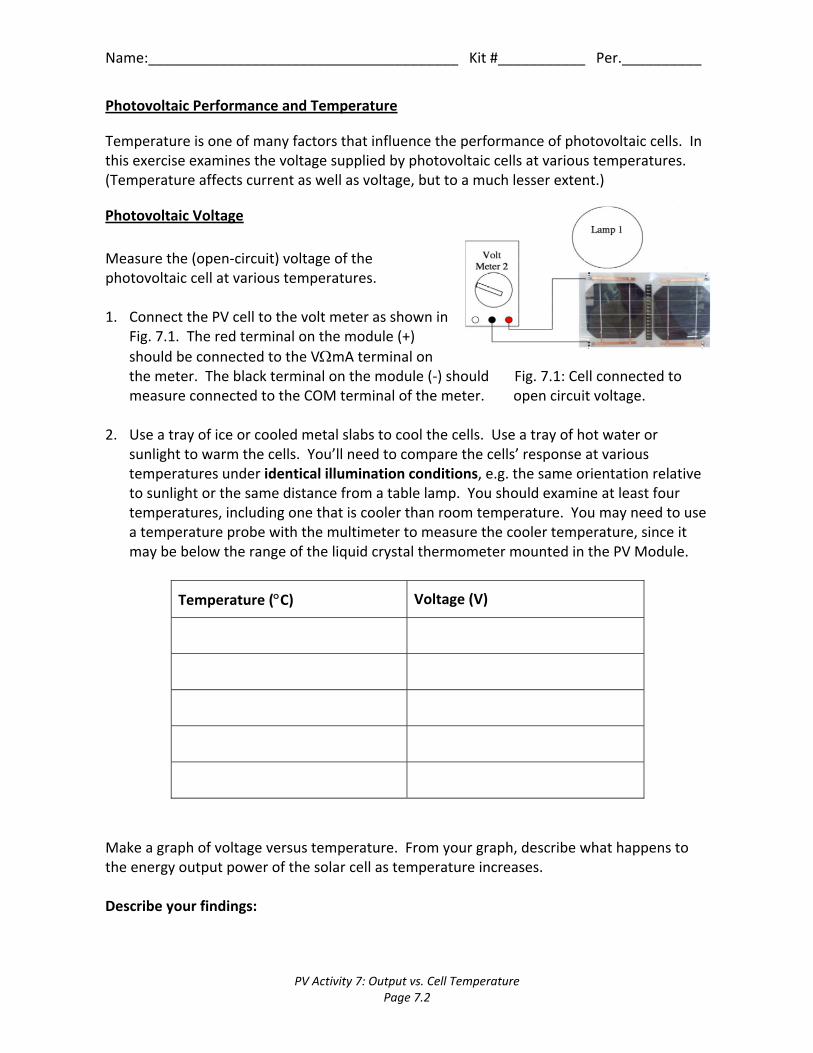
Photovoltaic Performance and Temperature
Temperature is one of many factors that influence the performance of photovoltaic cells. In this exercise examines the voltage supplied by photovoltaic cells at various temperatures. (Temperature affects current as well as voltage, but to a much lesser extent.)
Photovoltaic Voltage
Measure the (open‐circuit) voltage of the photovoltaic cell at various temperatures. 1. Connect the PV cell to the volt meter as shown in
Fig. 7.1. The red terminal on the module (+)
should be connected to the VmA terminal on the meter. The black terminal on the module (‐) should Fig. 7.1: Cell connected to measure connected to the COM terminal of the meter. open circuit voltage.
2. Use a tray of ice or cooled metal slabs to cool the cells. Use a tray of hot water or
sunlight to warm the cells. You’ll need to compare the cells’ response at various temperatures under identical illumination conditions, e.g. the same orientation relative to sunlight or the same distance from a table lamp. You should examine at least four temperatures, including one that is cooler than room temperature. You may need to use a temperature probe with the multimeter to measure the cooler temperature, since it may be below the range of the liquid crystal thermometer mounted in the PV Module.
Temperature (C) Voltage (V)
Make a graph of voltage versus temperature. From your graph, describe what happens to the energy output power of the solar cell as temperature increases. Describe your findings:
Name:_______________________________________ Kit #___________ Per.__________
PV Activity 7: Output vs. Cell Temperature Page 7.3
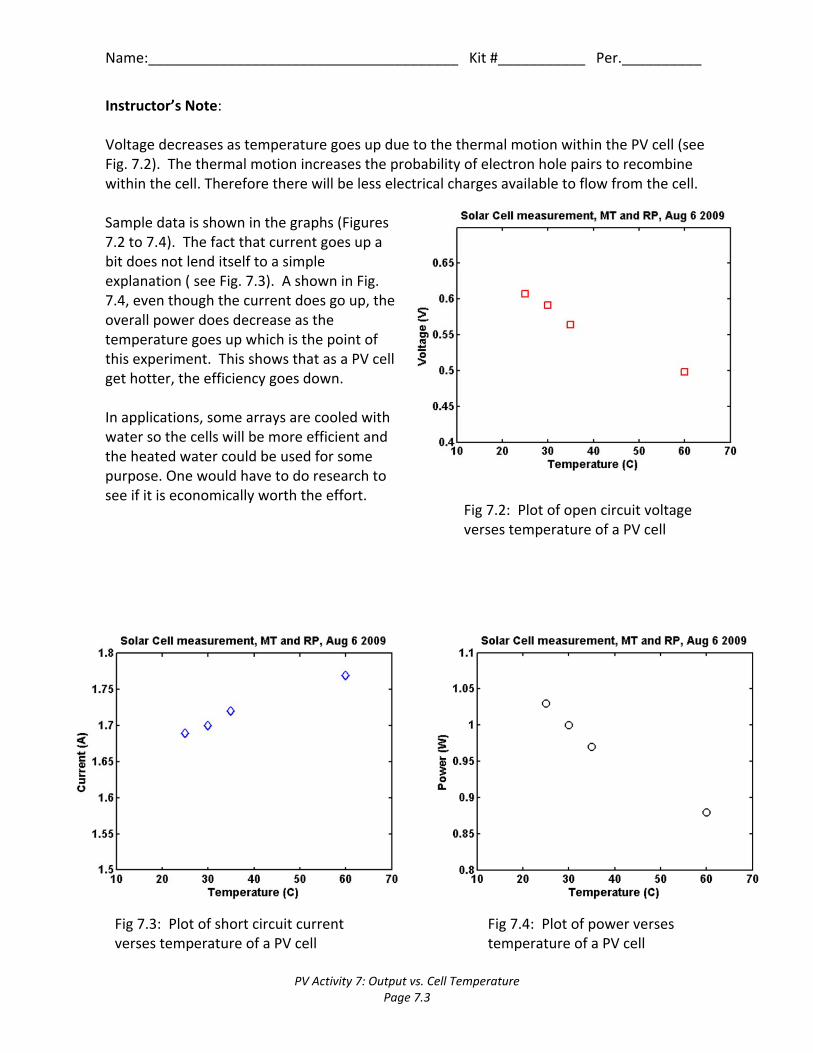
Fig 7.4: Plot of power verses temperature of a PV cell
Fig 7.2: Plot of open circuit voltage verses temperature of a PV cell
Fig 7.3: Plot of short circuit current verses temperature of a PV cell
Instructor’s Note: Voltage decreases as temperature goes up due to the thermal motion within the PV cell (see Fig. 7.2). The thermal motion increases the probability of electron hole pairs to recombine within the cell. Therefore there will be less electrical charges available to flow from the cell. Sample data is shown in the graphs (Figures 7.2 to 7.4). The fact that current goes up a bit does not lend itself to a simple explanation ( see Fig. 7.3). A shown in Fig. 7.4, even though the current does go up, the overall power does decrease as the temperature goes up which is the point of this experiment. This shows that as a PV cell get hotter, the efficiency goes down. In applications, some arrays are cooled with water so the cells will be more efficient and the heated water could be used for some purpose. One would have to do research to see if it is economically worth the effort.
By Stanley Micklavzina for the Meyer Fund for Sustainable Development and the University of Oregon Department of Physics and Solar Radiation Monitoring Laboratory Page A.1 6/20/2011
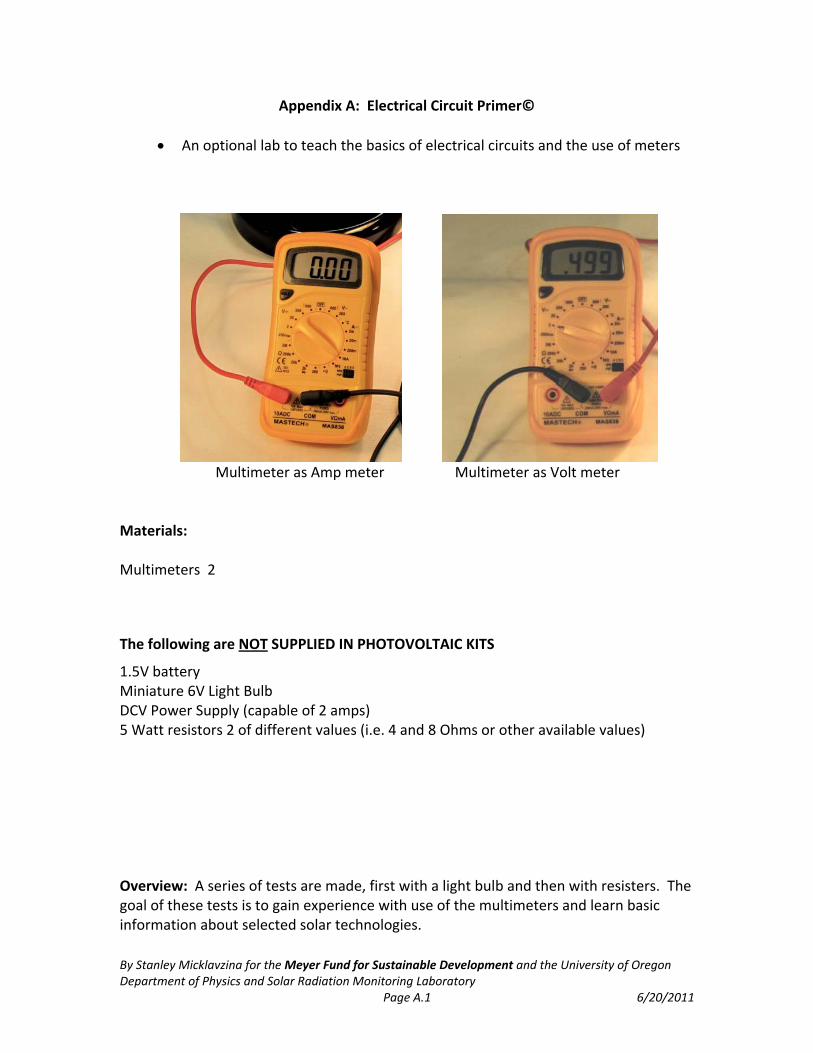
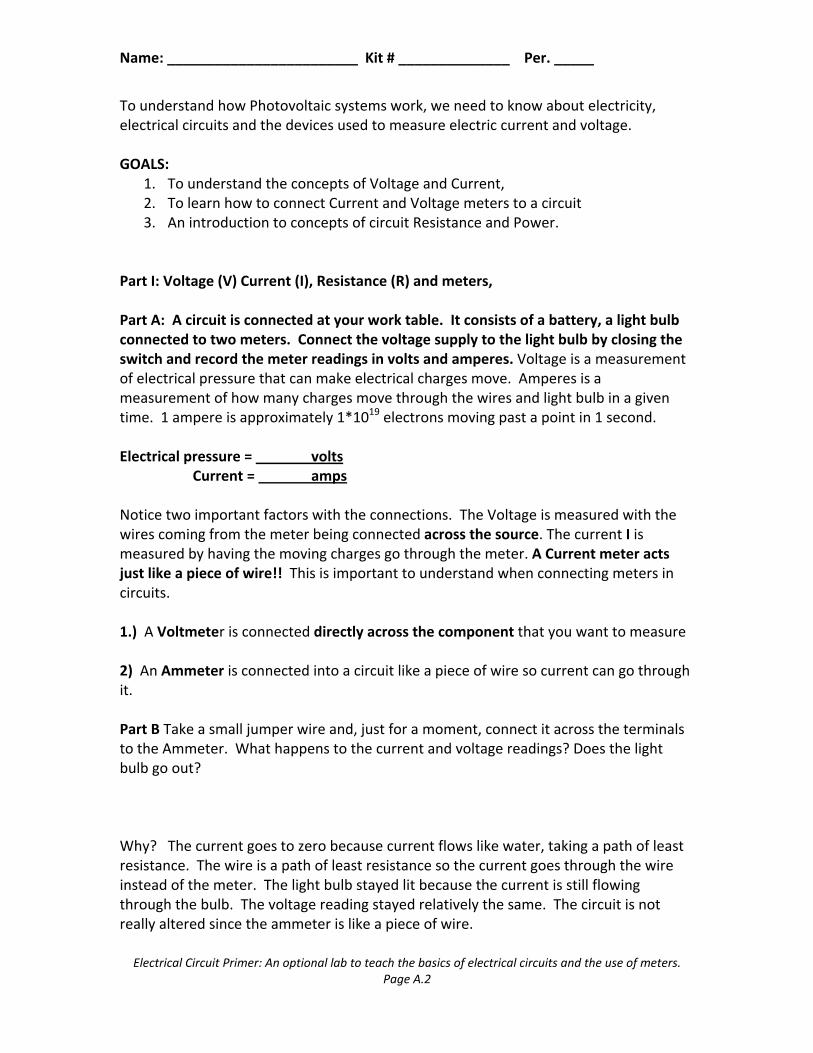
Appendix A: Electrical Circuit Primer©
An optional lab to teach the basics of electrical circuits and the use of meters
Multimeter as Amp meter Multimeter as Volt meter
Materials: Multimeters 2
The following are NOT SUPPLIED IN PHOTOVOLTAIC KITS
1.5V battery Miniature 6V Light Bulb DCV Power Supply (capable of 2 amps) 5 Watt resistors 2 of different values (i.e. 4 and 8 Ohms or other available values) Overview: A series of tests are made, first with a light bulb and then with resisters. The goal of these tests is to gain experience with use of the multimeters and learn basic information about selected solar technologies.
Name: ________________________ Kit # ______________ Per. _____
Electrical Circuit Primer: An optional lab to teach the basics of electrical circuits and the use of meters. Page A.2
To understand how Photovoltaic systems work, we need to know about electricity, electrical circuits and the devices used to measure electric current and voltage. GOALS:
1. To understand the concepts of Voltage and Current, 2. To learn how to connect Current and Voltage meters to a circuit 3. An introduction to concepts of circuit Resistance and Power.
Part I: Voltage (V) Current (I), Resistance (R) and meters, Part A: A circuit is connected at your work table. It consists of a battery, a light bulb connected to two meters. Connect the voltage supply to the light bulb by closing the switch and record the meter readings in volts and amperes. Voltage is a measurement of electrical pressure that can make electrical charges move. Amperes is a measurement of how many charges move through the wires and light bulb in a given time. 1 ampere is approximately 1*1019 electrons moving past a point in 1 second. Electrical pressure = volts
Current = amps Notice two important factors with the connections. The Voltage is measured with the wires coming from the meter being connected across the source. The current I is measured by having the moving charges go through the meter. A Current meter acts just like a piece of wire!! This is important to understand when connecting meters in circuits. 1.) A Voltmeter is connected directly across the component that you want to measure 2) An Ammeter is connected into a circuit like a piece of wire so current can go through it. Part B Take a small jumper wire and, just for a moment, connect it across the terminals to the Ammeter. What happens to the current and voltage readings? Does the light bulb go out? Why? The current goes to zero because current flows like water, taking a path of least resistance. The wire is a path of least resistance so the current goes through the wire instead of the meter. The light bulb stayed lit because the current is still flowing through the bulb. The voltage reading stayed relatively the same. The circuit is not really altered since the ammeter is like a piece of wire.
Name: ________________________ Kit # ______________ Per. _____
Electrical Circuit Primer: An optional lab to teach the basics of electrical circuits and the use of meters. Page A.3
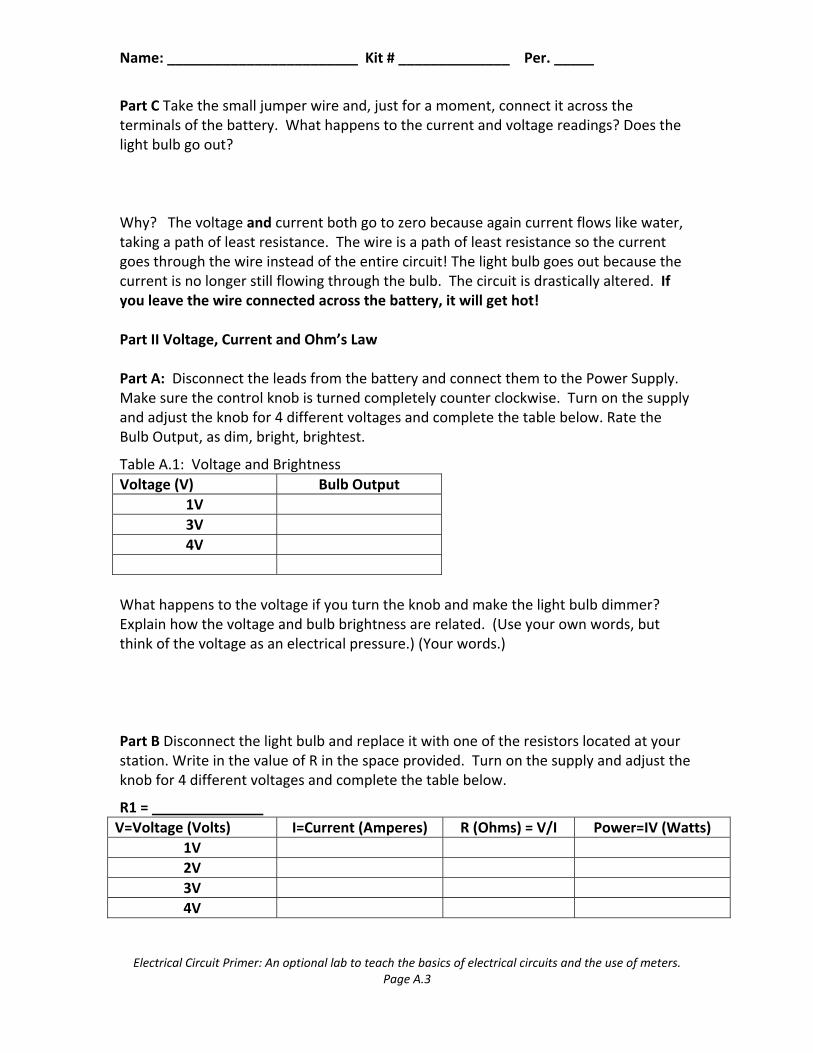
Part C Take the small jumper wire and, just for a moment, connect it across the terminals of the battery. What happens to the current and voltage readings? Does the light bulb go out? Why? The voltage and current both go to zero because again current flows like water, taking a path of least resistance. The wire is a path of least resistance so the current goes through the wire instead of the entire circuit! The light bulb goes out because the current is no longer still flowing through the bulb. The circuit is drastically altered. If you leave the wire connected across the battery, it will get hot! Part II Voltage, Current and Ohm’s Law Part A: Disconnect the leads from the battery and connect them to the Power Supply. Make sure the control knob is turned completely counter clockwise. Turn on the supply and adjust the knob for 4 different voltages and complete the table below. Rate the Bulb Output, as dim, bright, brightest.
Table A.1: Voltage and Brightness
Voltage (V) Bulb Output
1V
3V
4V
What happens to the voltage if you turn the knob and make the light bulb dimmer? Explain how the voltage and bulb brightness are related. (Use your own words, but think of the voltage as an electrical pressure.) (Your words.) Part B Disconnect the light bulb and replace it with one of the resistors located at your station. Write in the value of R in the space provided. Turn on the supply and adjust the knob for 4 different voltages and complete the table below.
R1 =
V=Voltage (Volts) I=Current (Amperes) R (Ohms) = V/I Power=IV (Watts)
1V
2V
3V
4V
Name: ________________________ Kit # ______________ Per. _____
Electrical Circuit Primer: An optional lab to teach the basics of electrical circuits and the use of meters. Page A.4
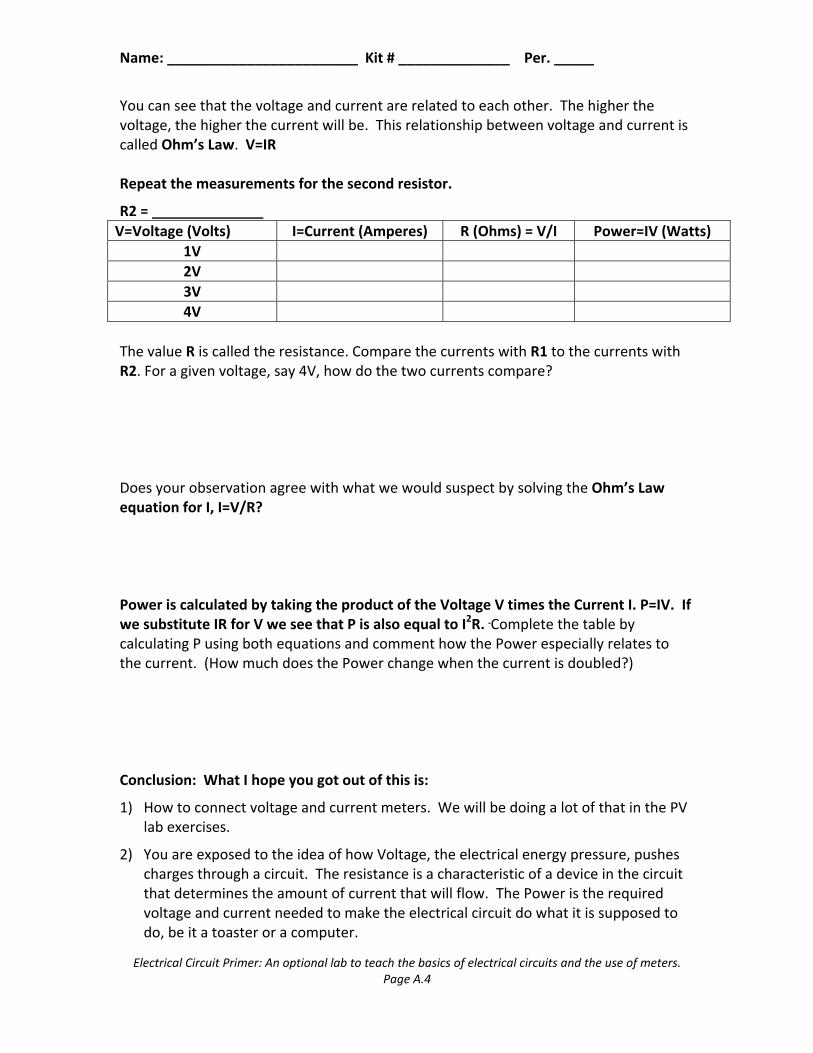
You can see that the voltage and current are related to each other. The higher the voltage, the higher the current will be. This relationship between voltage and current is called Ohm’s Law. V=IR Repeat the measurements for the second resistor.
R2 =
V=Voltage (Volts) I=Current (Amperes) R (Ohms) = V/I Power=IV (Watts)
1V
2V
3V
4V
The value R is called the resistance. Compare the currents with R1 to the currents with R2. For a given voltage, say 4V, how do the two currents compare? Does your observation agree with what we would suspect by solving the Ohm’s Law equation for I, I=V/R? Power is calculated by taking the product of the Voltage V times the Current I. P=IV. If we substitute IR for V we see that P is also equal to I2R. Complete the table by calculating P using both equations and comment how the Power especially relates to the current. (How much does the Power change when the current is doubled?) Conclusion: What I hope you got out of this is:
1) How to connect voltage and current meters. We will be doing a lot of that in the PV lab exercises.
2) You are exposed to the idea of how Voltage, the electrical energy pressure, pushes charges through a circuit. The resistance is a characteristic of a device in the circuit that determines the amount of current that will flow. The Power is the required voltage and current needed to make the electrical circuit do what it is supposed to do, be it a toaster or a computer.
By Stanley Micklavzina, Asher Tubman, and Frank Vignola for the Meyer Fund for Sustainable Development and the University of Oregon Department of Physics and Solar Radiation Monitoring Laboratory. Page B.1 6/20/2011
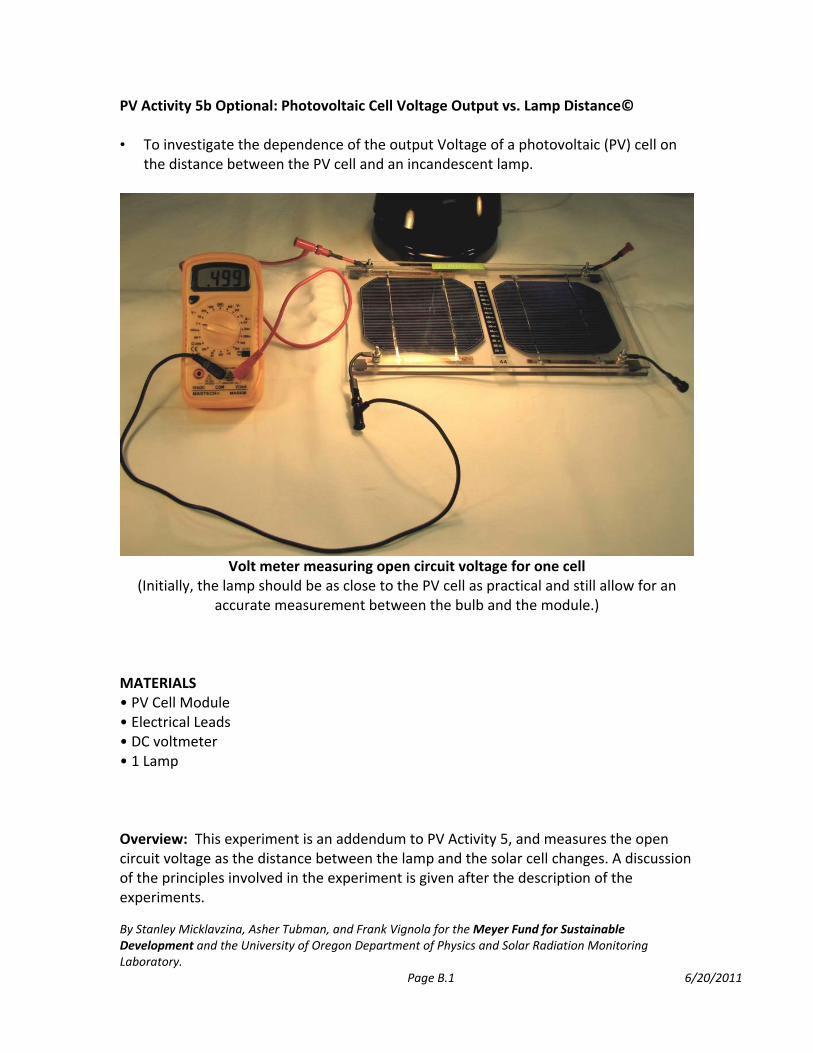
PV Activity 5b Optional: Photovoltaic Cell Voltage Output vs. Lamp Distance© • To investigate the dependence of the output Voltage of a photovoltaic (PV) cell on
the distance between the PV cell and an incandescent lamp.
Volt meter measuring open circuit voltage for one cell
(Initially, the lamp should be as close to the PV cell as practical and still allow for an accurate measurement between the bulb and the module.)
MATERIALS • PV Cell Module • Electrical Leads • DC voltmeter • 1 Lamp Overview: This experiment is an addendum to PV Activity 5, and measures the open circuit voltage as the distance between the lamp and the solar cell changes. A discussion of the principles involved in the experiment is given after the description of the experiments.
Name: _____________________________ Kit#____________ Per._________
PV Activity 3b Optional: Photovoltaic Cell Voltage Output vs. Lamp Distance Page B.2
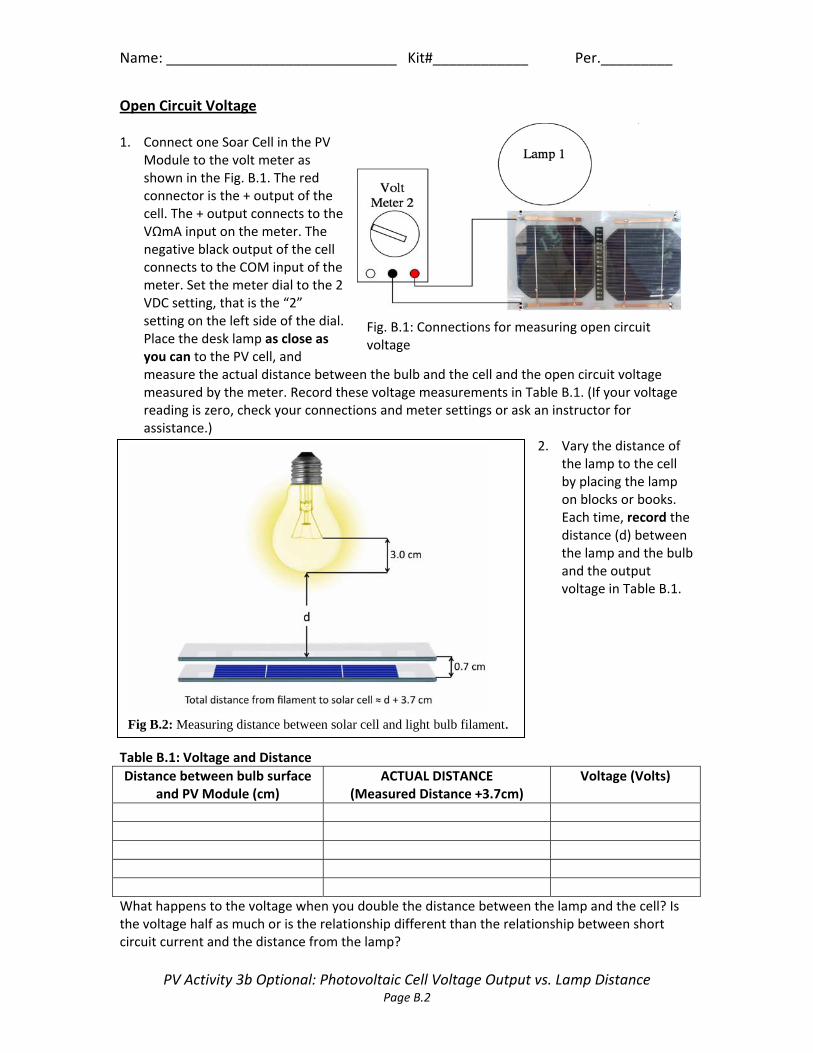
Fig. B.1: Connections for measuring open circuit voltage
Open Circuit Voltage 1. Connect one Soar Cell in the PV
Module to the volt meter as shown in the Fig. B.1. The red connector is the + output of the cell. The + output connects to the VΩmA input on the meter. The negative black output of the cell connects to the COM input of the meter. Set the meter dial to the 2 VDC setting, that is the “2” setting on the left side of the dial. Place the desk lamp as close as you can to the PV cell, and measure the actual distance between the bulb and the cell and the open circuit voltage measured by the meter. Record these voltage measurements in Table B.1. (If your voltage reading is zero, check your connections and meter settings or ask an instructor for assistance.)
2. Vary the distance of the lamp to the cell by placing the lamp on blocks or books. Each time, record the distance (d) between the lamp and the bulb and the output voltage in Table B.1.
Table B.1: Voltage and Distance
Distance between bulb surface and PV Module (cm)
ACTUAL DISTANCE (Measured Distance +3.7cm)
Voltage (Volts)
What happens to the voltage when you double the distance between the lamp and the cell? Is the voltage half as much or is the relationship different than the relationship between short circuit current and the distance from the lamp?
Fig B.2: Measuring distance between solar cell and light bulb filament.
Name: _____________________________ Kit#____________ Per._________
PV Activity 3b Optional: Photovoltaic Cell Voltage Output vs. Lamp Distance Page B.3
Result discussion: The shape of the Power vs. Distance graph obtained in PV Activity 5 is a result of how light intensity from a point source diminishes over distance. The power falls as a 1/r2 relation, because the number of photons striking the surface would decrease as a 1/r2 relation.
The open circuit voltage output of the cell is mainly related to the intrinsic nature of the solar cell. Silicon based solar cells are created by bring silicon doped with atoms with one extra and one lacking valence electron together. At the interface of the two types of materials, an electric field is created when the extra valence electrons fill in the holes left around the atoms lacking one valence electron. The difference in the charges of the nucleus of the doping atoms creates an electric field that gives rise to the open circuit voltage. The open circuit voltage can be thought of as the field holding the electrons and the holes apart. This voltage changes with temperature and other factors.
The short circuit current is the maximum number of charges that can flow each second from the cell. The number of charges available IS DEPENDENT on the intensity of the light. Each flowing charge resulted from the interaction with a photon of light. The intensity of the light is directly related to the number of photons striking the solar cell. Solar cells are also dependent upon the wavelength of the light (see PV Activity 4), but in general, the more intense the light, the more photons strike the cell, the more current is available. You should have observed that the voltage also increases with intensity, with a maximum voltage in the range of 0.5V – 0.6V.
The sensitivity of the output current and power with light distance makes it essential to maintain the same light intensity for all future lab measurements. This criterion is met by keeping the distance between the bulb and PV module constant when comparing measurements, or keeping the angle of the PV module and sunlight constant, assuming the intensity of the sunlight is not varying.
Discussion:
1) Write down your comments and what you learned or questions you have after completing Table B.1.
2) Are your observations consistent with the discussion above? 3) How do your observations confirm or conflict with the discussion about? 4) How would you improve on the experiment?
For the Meyer Fund for Sustainable Development and the University of Oregon Department of Physics and Solar Radiation Monitoring Laboratory Page C.1 6/20/2011
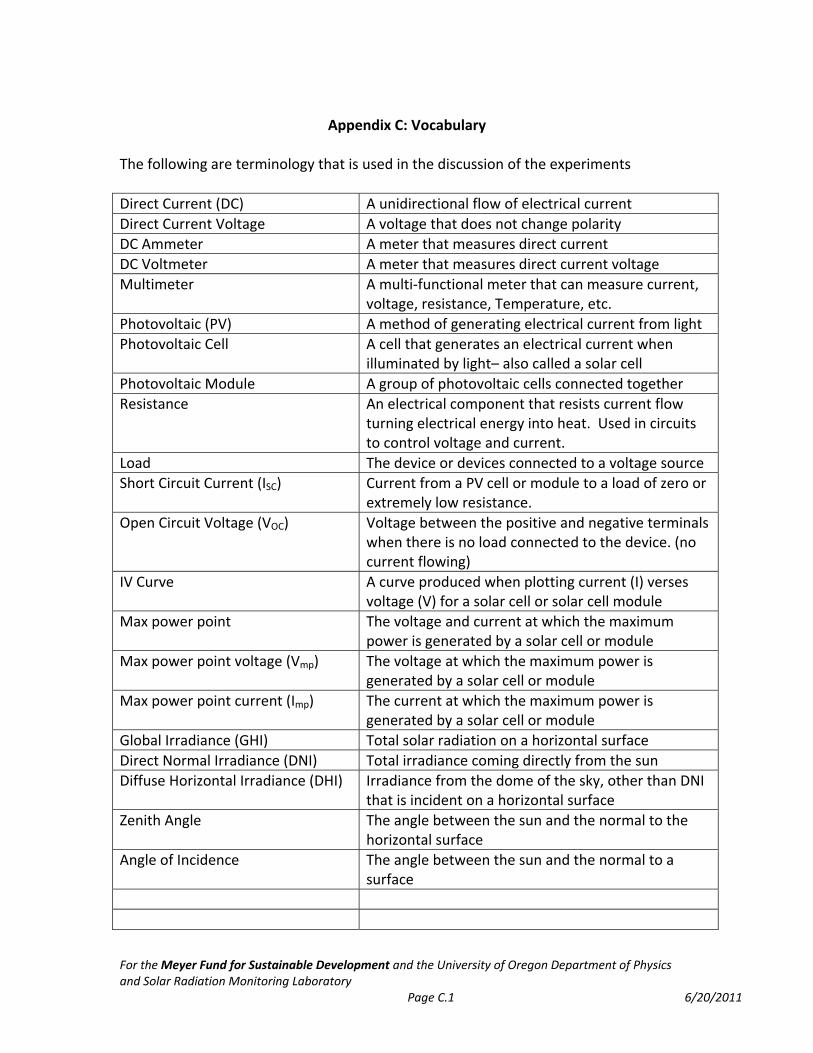
Appendix C: Vocabulary
The following are terminology that is used in the discussion of the experiments
Direct Current (DC) A unidirectional flow of electrical current
Direct Current Voltage A voltage that does not change polarity
DC Ammeter A meter that measures direct current
DC Voltmeter A meter that measures direct current voltage
Multimeter A multi‐functional meter that can measure current, voltage, resistance, Temperature, etc.
Photovoltaic (PV) A method of generating electrical current from light
Photovoltaic Cell A cell that generates an electrical current when illuminated by light– also called a solar cell
Photovoltaic Module A group of photovoltaic cells connected together
Resistance An electrical component that resists current flow turning electrical energy into heat. Used in circuits to control voltage and current.
Load The device or devices connected to a voltage source
Short Circuit Current (ISC) Current from a PV cell or module to a load of zero or extremely low resistance.
Open Circuit Voltage (VOC) Voltage between the positive and negative terminals when there is no load connected to the device. (no current flowing)
IV Curve A curve produced when plotting current (I) verses voltage (V) for a solar cell or solar cell module
Max power point The voltage and current at which the maximum power is generated by a solar cell or module
Max power point voltage (Vmp) The voltage at which the maximum power is generated by a solar cell or module
Max power point current (Imp) The current at which the maximum power is generated by a solar cell or module
Global Irradiance (GHI) Total solar radiation on a horizontal surface
Direct Normal Irradiance (DNI) Total irradiance coming directly from the sun
Diffuse Horizontal Irradiance (DHI) Irradiance from the dome of the sky, other than DNI that is incident on a horizontal surface
Zenith Angle The angle between the sun and the normal to the horizontal surface
Angle of Incidence The angle between the sun and the normal to a surface
The NEED Project P.O. Box 10101, Manassas, VA 20108 1.800.875.5029 www.NEED.org 13
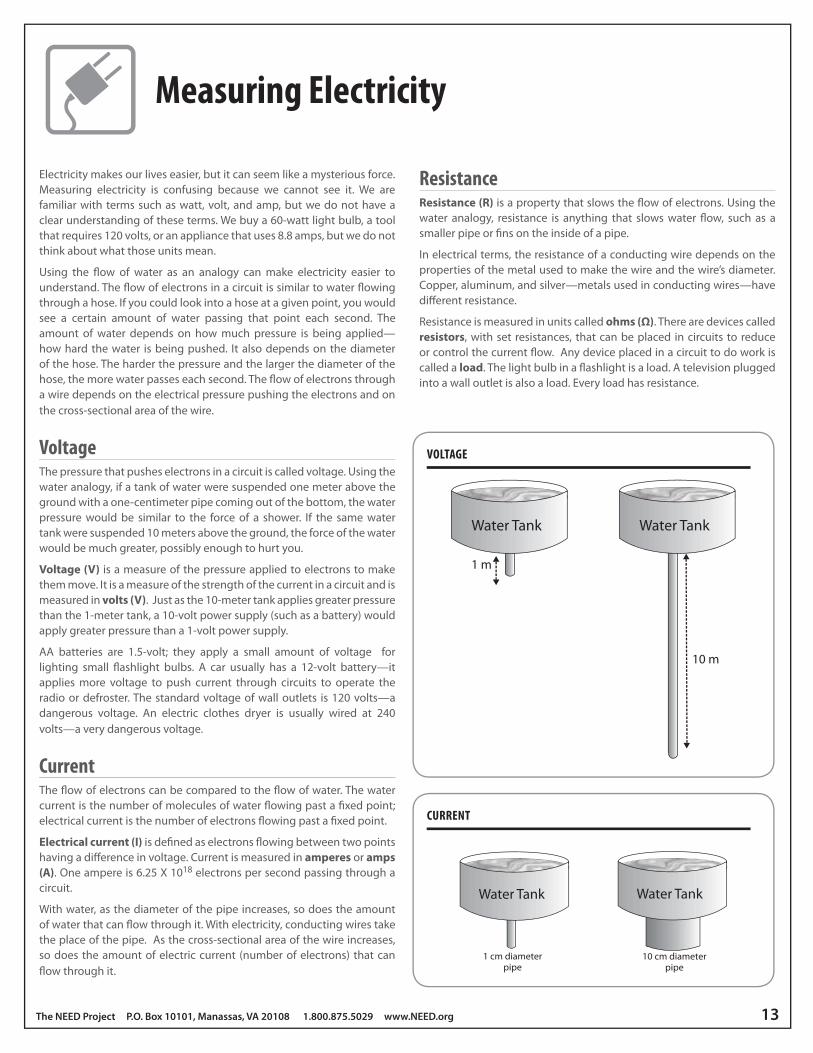
Electricity makes our lives easier, but it can seem like a mysterious force. Measuring electricity is confusing because we cannot see it. We are familiar with terms such as watt, volt, and amp, but we do not have a clear understanding of these terms. We buy a 60-watt light bulb, a tool that requires 120 volts, or an appliance that uses 8.8 amps, but we do not think about what those units mean.
Using the flow of water as an analogy can make electricity easier to understand. The flow of electrons in a circuit is similar to water flowing through a hose. If you could look into a hose at a given point, you would see a certain amount of water passing that point each second. The amount of water depends on how much pressure is being applied—how hard the water is being pushed. It also depends on the diameter of the hose. The harder the pressure and the larger the diameter of the hose, the more water passes each second. The flow of electrons through a wire depends on the electrical pressure pushing the electrons and on the cross-sectional area of the wire.
VoltageThe pressure that pushes electrons in a circuit is called voltage. Using the water analogy, if a tank of water were suspended one meter above the ground with a one-centimeter pipe coming out of the bottom, the water pressure would be similar to the force of a shower. If the same water tank were suspended 10 meters above the ground, the force of the water would be much greater, possibly enough to hurt you.
Voltage (V) is a measure of the pressure applied to electrons to make them move. It is a measure of the strength of the current in a circuit and is measured in volts (V). Just as the 10-meter tank applies greater pressure than the 1-meter tank, a 10-volt power supply (such as a battery) would apply greater pressure than a 1-volt power supply.
AA batteries are 1.5-volt; they apply a small amount of voltage for lighting small flashlight bulbs. A car usually has a 12-volt battery—it applies more voltage to push current through circuits to operate the radio or defroster. The standard voltage of wall outlets is 120 volts—a dangerous voltage. An electric clothes dryer is usually wired at 240 volts—a very dangerous voltage.
CurrentThe flow of electrons can be compared to the flow of water. The water current is the number of molecules of water flowing past a fixed point; electrical current is the number of electrons flowing past a fixed point.
Electrical current (I) is defined as electrons flowing between two points having a difference in voltage. Current is measured in amperes or amps (A). One ampere is 6.25 X 10¹⁸ electrons per second passing through a circuit.
With water, as the diameter of the pipe increases, so does the amount of water that can flow through it. With electricity, conducting wires take the place of the pipe. As the cross-sectional area of the wire increases, so does the amount of electric current (number of electrons) that can flow through it.
ResistanceResistance (R) is a property that slows the flow of electrons. Using the water analogy, resistance is anything that slows water flow, such as a smaller pipe or fins on the inside of a pipe.
In electrical terms, the resistance of a conducting wire depends on the properties of the metal used to make the wire and the wire’s diameter. Copper, aluminum, and silver—metals used in conducting wires—have different resistance.
Resistance is measured in units called ohms (Ω). There are devices called resistors, with set resistances, that can be placed in circuits to reduce or control the current flow. Any device placed in a circuit to do work is called a load. The light bulb in a flashlight is a load. A television plugged into a wall outlet is also a load. Every load has resistance.
Measuring Electricity
Water Tank
1 m
Water Tank
10 m
VOLTAGE
Water Tank
1 cm diameterpipe
Water Tank
10 cm diameterpipe
CURRENT
14 Photovoltaics
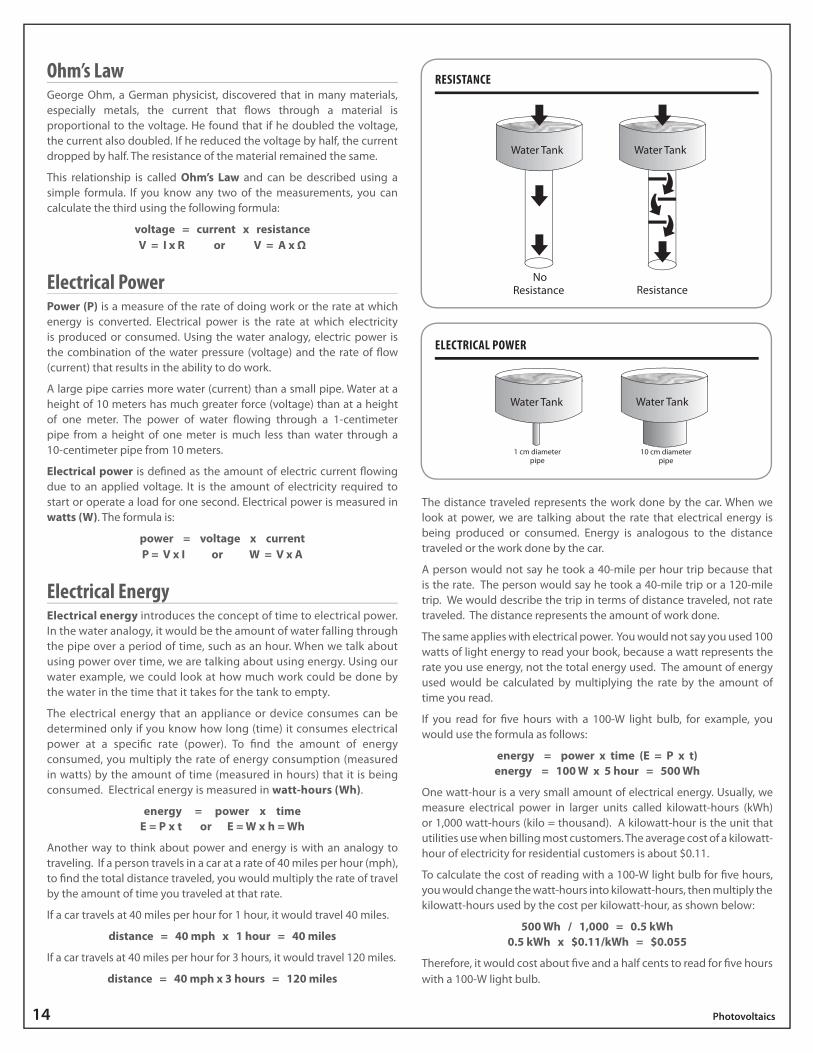
Ohm’s LawGeorge Ohm, a German physicist, discovered that in many materials, especially metals, the current that flows through a material is proportional to the voltage. He found that if he doubled the voltage, the current also doubled. If he reduced the voltage by half, the current dropped by half. The resistance of the material remained the same.
This relationship is called Ohm’s Law and can be described using a simple formula. If you know any two of the measurements, you can calculate the third using the following formula:
voltage = current x resistanceV = I x R or V = A x Ω
Electrical PowerPower (P) is a measure of the rate of doing work or the rate at which energy is converted. Electrical power is the rate at which electricity is produced or consumed. Using the water analogy, electric power is the combination of the water pressure (voltage) and the rate of flow (current) that results in the ability to do work.
A large pipe carries more water (current) than a small pipe. Water at a height of 10 meters has much greater force (voltage) than at a height of one meter. The power of water flowing through a 1-centimeter pipe from a height of one meter is much less than water through a 10-centimeter pipe from 10 meters.
Electrical power is defined as the amount of electric current flowing due to an applied voltage. It is the amount of electricity required to start or operate a load for one second. Electrical power is measured in watts (W). The formula is:
power = voltage x current P = V x I or W = V x A
Electrical EnergyElectrical energy introduces the concept of time to electrical power. In the water analogy, it would be the amount of water falling through the pipe over a period of time, such as an hour. When we talk about using power over time, we are talking about using energy. Using our water example, we could look at how much work could be done by the water in the time that it takes for the tank to empty.
The electrical energy that an appliance or device consumes can be determined only if you know how long (time) it consumes electrical power at a specific rate (power). To find the amount of energy consumed, you multiply the rate of energy consumption (measured in watts) by the amount of time (measured in hours) that it is being consumed. Electrical energy is measured in watt-hours (Wh).
energy = power x time E = P x t or E = W x h = Wh
Another way to think about power and energy is with an analogy to traveling. If a person travels in a car at a rate of 40 miles per hour (mph), to find the total distance traveled, you would multiply the rate of travel by the amount of time you traveled at that rate.
If a car travels at 40 miles per hour for 1 hour, it would travel 40 miles.
distance = 40 mph x 1 hour = 40 miles
If a car travels at 40 miles per hour for 3 hours, it would travel 120 miles.
distance = 40 mph x 3 hours = 120 miles
The distance traveled represents the work done by the car. When we look at power, we are talking about the rate that electrical energy is being produced or consumed. Energy is analogous to the distance traveled or the work done by the car.
A person would not say he took a 40-mile per hour trip because that is the rate. The person would say he took a 40-mile trip or a 120-mile trip. We would describe the trip in terms of distance traveled, not rate traveled. The distance represents the amount of work done.
The same applies with electrical power. You would not say you used 100 watts of light energy to read your book, because a watt represents the rate you use energy, not the total energy used. The amount of energy used would be calculated by multiplying the rate by the amount of time you read.
If you read for five hours with a 100-W light bulb, for example, you would use the formula as follows:
energy = power x time (E = P x t)energy = 100 W x 5 hour = 500 Wh
One watt-hour is a very small amount of electrical energy. Usually, we measure electrical power in larger units called kilowatt-hours (kWh) or 1,000 watt-hours (kilo = thousand). A kilowatt-hour is the unit that utilities use when billing most customers. The average cost of a kilowatt-hour of electricity for residential customers is about $0.11.
To calculate the cost of reading with a 100-W light bulb for five hours, you would change the watt-hours into kilowatt-hours, then multiply the kilowatt-hours used by the cost per kilowatt-hour, as shown below:
500 Wh / 1,000 = 0.5 kWh0.5 kWh x $0.11/kWh = $0.055
Therefore, it would cost about five and a half cents to read for five hours with a 100-W light bulb.
Water Tank
NoResistance
Water Tank
Resistance
RESISTANCE
Water Tank
1 cm diameterpipe
Water Tank
10 cm diameterpipe
ELECTRICAL POWER
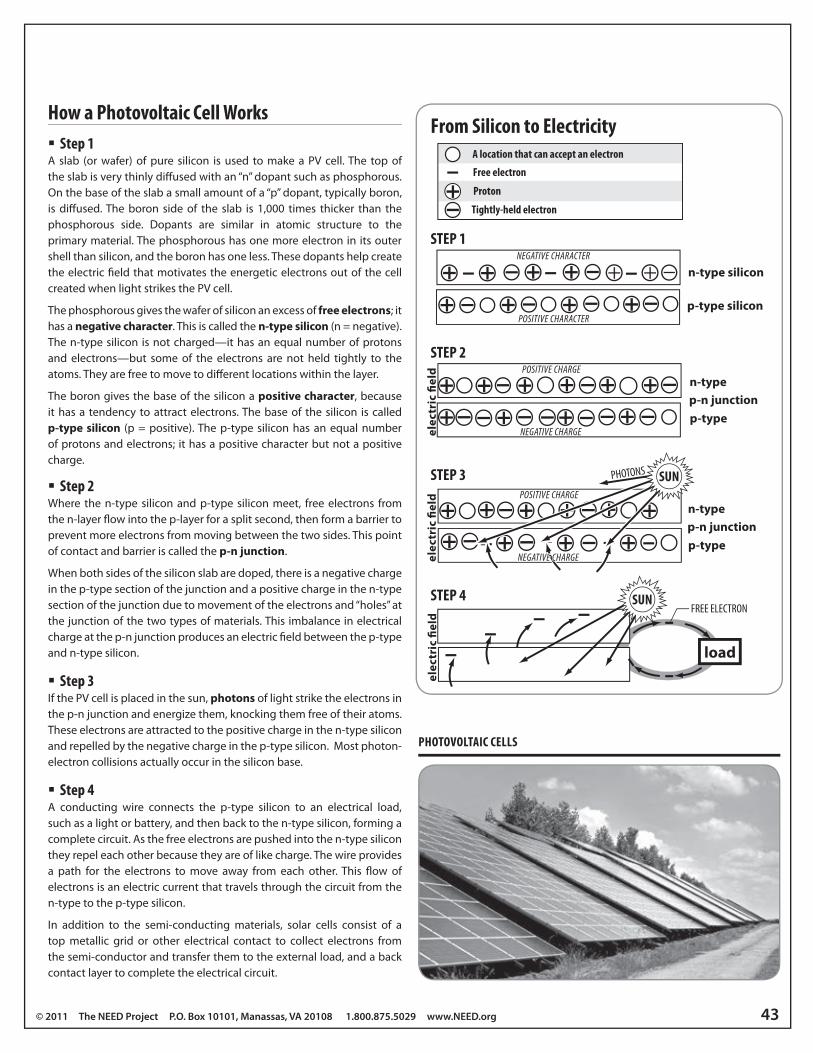
© 2011 The NEED Project P.O. Box 10101, Manassas, VA 20108 1.800.875.5029 www.NEED.org 43
How a Photovoltaic Cell Works
� Step 1A slab (or wafer) of pure silicon is used to make a PV cell. The top of the slab is very thinly diffused with an “n” dopant such as phosphorous. On the base of the slab a small amount of a “p” dopant, typically boron, is diffused. The boron side of the slab is 1,000 times thicker than the phosphorous side. Dopants are similar in atomic structure to the primary material. The phosphorous has one more electron in its outer shell than silicon, and the boron has one less. These dopants help create the electric field that motivates the energetic electrons out of the cell created when light strikes the PV cell.
The phosphorous gives the wafer of silicon an excess of free electrons; it has a negative character. This is called the n-type silicon (n = negative). The n-type silicon is not charged—it has an equal number of protons and electrons—but some of the electrons are not held tightly to the atoms. They are free to move to different locations within the layer.
The boron gives the base of the silicon a positive character, because it has a tendency to attract electrons. The base of the silicon is called p-type silicon (p = positive). The p-type silicon has an equal number of protons and electrons; it has a positive character but not a positive charge.
� Step 2Where the n-type silicon and p-type silicon meet, free electrons from the n-layer flow into the p-layer for a split second, then form a barrier to prevent more electrons from moving between the two sides. This point of contact and barrier is called the p-n junction.
When both sides of the silicon slab are doped, there is a negative charge in the p-type section of the junction and a positive charge in the n-type section of the junction due to movement of the electrons and “holes” at the junction of the two types of materials. This imbalance in electrical charge at the p-n junction produces an electric field between the p-type and n-type silicon.
� Step 3If the PV cell is placed in the sun, photons of light strike the electrons in the p-n junction and energize them, knocking them free of their atoms. These electrons are attracted to the positive charge in the n-type silicon and repelled by the negative charge in the p-type silicon. Most photon-electron collisions actually occur in the silicon base.
� Step 4A conducting wire connects the p-type silicon to an electrical load, such as a light or battery, and then back to the n-type silicon, forming a complete circuit. As the free electrons are pushed into the n-type silicon they repel each other because they are of like charge. The wire provides a path for the electrons to move away from each other. This flow of electrons is an electric current that travels through the circuit from the n-type to the p-type silicon.
In addition to the semi-conducting materials, solar cells consist of a top metallic grid or other electrical contact to collect electrons from the semi-conductor and transfer them to the external load, and a back contact layer to complete the electrical circuit.
n-type silicon
p-type silicon
NEGATIVE CHARACTER
POSITIVE CHARACTER
elec
tric
fiel
d POSITIVE CHARGE
NEGATIVE CHARGE
n-type
p-typep-n junction
A location that can accept an electron
Proton
Tightly-held electron
Free electron
From Silicon to Electricity
STEP 1
STEP 2
FREE ELECTRON
load
elec
tric
fiel
d
sunSUNSTEP 4
elec
tric
fiel
d
PHOTONS
n-type
p-typep-n junction
POSITIVE CHARGE
NEGATIVE CHARGE
SUNSTEP 3
PHOTOVOLTAIC CELLS
By Asher Tubman for the Meyer Fund for Sustainable Development and the University of Oregon Department of Physics and Solar Radiation Monitoring Laboratory
Page F.1 6/20/2011
Appendix F: Review of PV Panels Labs These kits were used for the first year of a two IB physics class. This is a college‐credit physics course that covers certain topics the first year, and certain ones the second. This class also has specific lab requirements, which the kits helped meet, as I will discuss. The kits were used primarily as a follow‐up/ reinforcement/ application of an electrical circuits unit. I would like to use these kits as supplements to a unit on alternative energy as well, which another teacher at our school did in her Environmental Science class. Series and Parallel Connections:
The first thing we did with the kits was the series‐parallel lab. This helped refresh/reinforce the circuits content we had been covering. This also showed a good, practical application of the circuit knowledge. Thirdly, this gave the students experience with the kits, which was important for what came next. The lab instructions were a little long, and I did wind up condensing this lab to make it more digestible by my students. Another benefit to my altered version is that all the data and questions are answered on a sheet separate from the instructions. This allows me to save lots of paper by only making one class set of instructions and individual data sheets. One thing that this does require, however, is a thorough pre‐lab explanation on the part of the teacher, as well as a good explanation of the purpose of the lab. Inquiry Activities:
This class has a particular requirement where students are to run their own "inquiry" investigations. These are full‐blown labs where the students must pick some phenomenon to investigate, and then design, carry out, and analyze the data from the experiment. The kits lent themselves to this type of project very well. Between the filters, the fans, the resistors, the area of a cell shaded, the distance of a light from the panel and the brightness of the small light bulbs, there was a variety of phenomenon that the students could pick to investigate. Each student had to come up with their own variation, which usually looked at the relationship between one of the items listed above, and the power, current or voltage in the circuit. Some examples included looking at how the wavelength of light on the panel affected the rate at which the fans spin (measured with a Vernier photogate) or how a different light bulb in the lamp affected the current put out by the cell. These kits really provided a great forum for the students to do some real inquiry‐based learning. The students came up with their own versions of almost all the labs. I should note that while this project was theoretically specific to the IB physics class, it doesn't need to be. There is a big push to get more inquiry‐type labs in the classroom,
Appendix F: Review of PV Panels Labs Page F.2
and this would be good for any physics class. One caution about this type of lab is that it requires a high level of independence on the part of the students. As a teacher I had to make sure the students were all fairly comfortable with a certain amount of independent work, and were able to use the kits well. The kits worked fine in this regard, however, as this unit came towards the end of the year, and the students were well trained in lab behavior and expectations by then. General Thoughts
Another really great use for these would be having all the students look at the wavelength dependence of the voltage. As the IB physics class is a two year course, I will likely use them for this purpose next year. The topic of power load is also covered in a unit called Energy, Power and climate change, and I will likely use the kits for that purpose as well. There are quite a few options for what labs could be done with these kits. As far a curriculum support, I feel that a teacher should really only pick two or three of these to do, as any one lab setup can get overwhelming of done for an extended period of time. Also, it is important that a teacher be familiar with how the labs will support the content they wish to teach, and are able to run the labs appropriately. I will certainly use these kits again next year, and will talk to the freshman physical science teachers about using them in their curriculum as well.
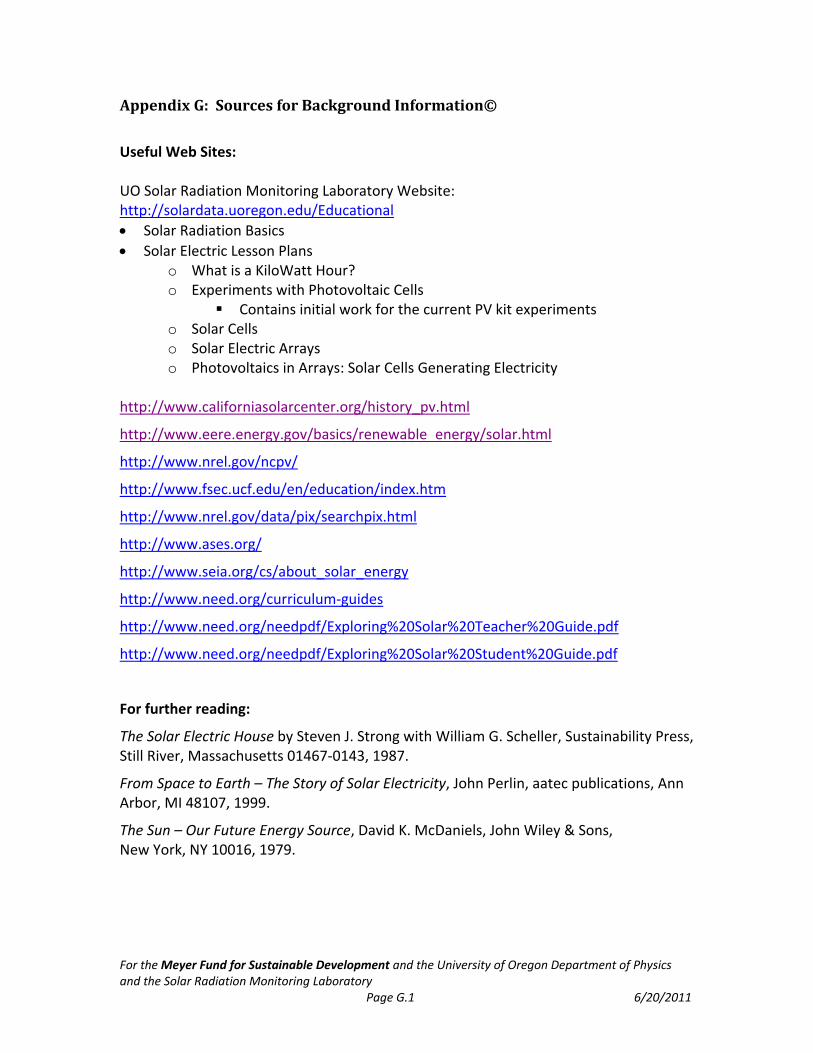
For the Meyer Fund for Sustainable Development and the University of Oregon Department of Physics and the Solar Radiation Monitoring Laboratory Page G.1 6/20/2011
AppendixG:SourcesforBackgroundInformation©
Useful Web Sites: UO Solar Radiation Monitoring Laboratory Website: http://solardata.uoregon.edu/Educational
Solar Radiation Basics
Solar Electric Lesson Plans o What is a KiloWatt Hour? o Experiments with Photovoltaic Cells
Contains initial work for the current PV kit experiments o Solar Cells o Solar Electric Arrays o Photovoltaics in Arrays: Solar Cells Generating Electricity
http://www.californiasolarcenter.org/history_pv.html
http://www.eere.energy.gov/basics/renewable_energy/solar.html
http://www.nrel.gov/ncpv/
http://www.fsec.ucf.edu/en/education/index.htm
http://www.nrel.gov/data/pix/searchpix.html
http://www.ases.org/
http://www.seia.org/cs/about_solar_energy
http://www.need.org/curriculum‐guides
http://www.need.org/needpdf/Exploring%20Solar%20Teacher%20Guide.pdf
http://www.need.org/needpdf/Exploring%20Solar%20Student%20Guide.pdf
For further reading:
The Solar Electric House by Steven J. Strong with William G. Scheller, Sustainability Press, Still River, Massachusetts 01467‐0143, 1987.
From Space to Earth – The Story of Solar Electricity, John Perlin, aatec publications, Ann Arbor, MI 48107, 1999.
The Sun – Our Future Energy Source, David K. McDaniels, John Wiley & Sons, New York, NY 10016, 1979.
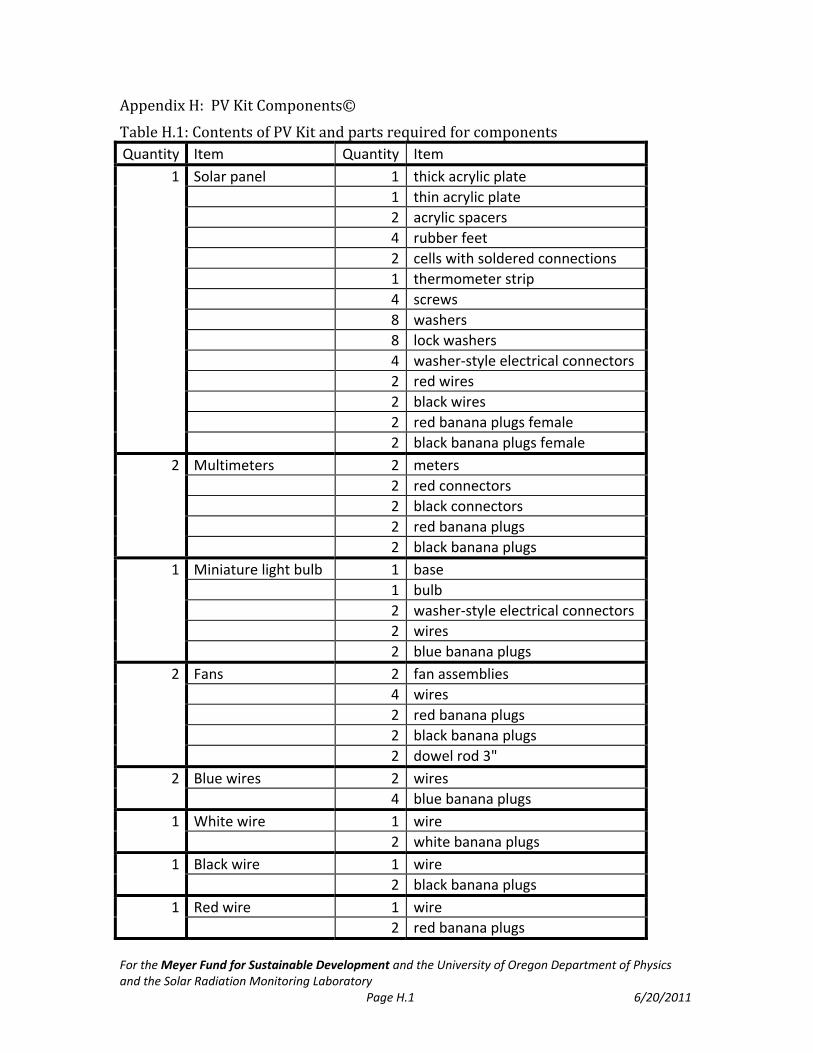
For the Meyer Fund for Sustainable Development and the University of Oregon Department of Physics and the Solar Radiation Monitoring Laboratory Page H.1 6/20/2011
AppendixH:PVKitComponents©
TableH.1:ContentsofPVKitandpartsrequiredforcomponentsQuantity Item Quantity Item
1 Solar panel 1 thick acrylic plate
1 thin acrylic plate
2 acrylic spacers
4 rubber feet
2 cells with soldered connections
1 thermometer strip
4 screws
8 washers
8 lock washers
4 washer‐style electrical connectors
2 red wires
2 black wires
2 red banana plugs female
2 black banana plugs female
2 Multimeters 2 meters
2 red connectors
2 black connectors
2 red banana plugs
2 black banana plugs
1 Miniature light bulb 1 base
1 bulb
2 washer‐style electrical connectors
2 wires
2 blue banana plugs
2 Fans 2 fan assemblies
4 wires
2 red banana plugs
2 black banana plugs
2 dowel rod 3"
2 Blue wires 2 wires
4 blue banana plugs
1 White wire 1 wire
2 white banana plugs
1 Black wire 1 wire
2 black banana plugs
1 Red wire 1 wire
2 red banana plugs
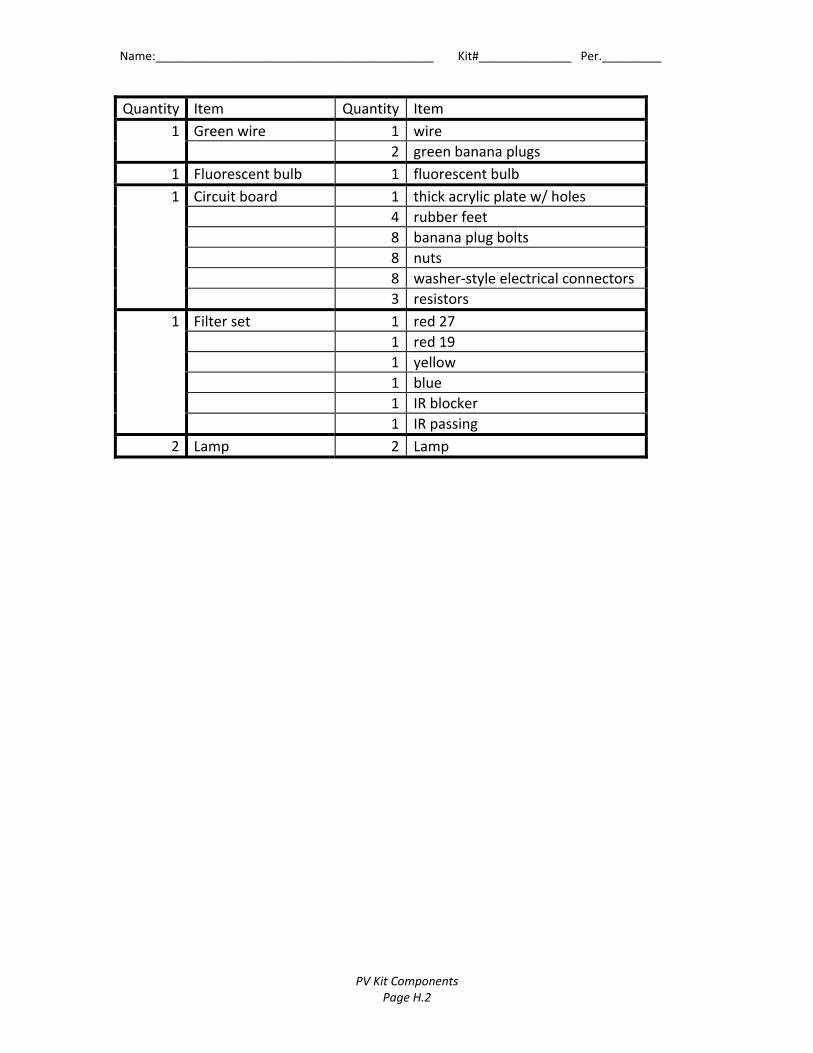
Name:__________________________________________ Kit#______________ Per._________
PV Kit Components Page H.2
Quantity Item Quantity Item
1 Green wire 1 wire
2 green banana plugs
1 Fluorescent bulb 1 fluorescent bulb
1 Circuit board 1 thick acrylic plate w/ holes
4 rubber feet
8 banana plug bolts
8 nuts
8 washer‐style electrical connectors
3 resistors
1 Filter set 1 red 27
1 red 19
1 yellow
1 blue
1 IR blocker
1 IR passing
2 Lamp 2 Lamp
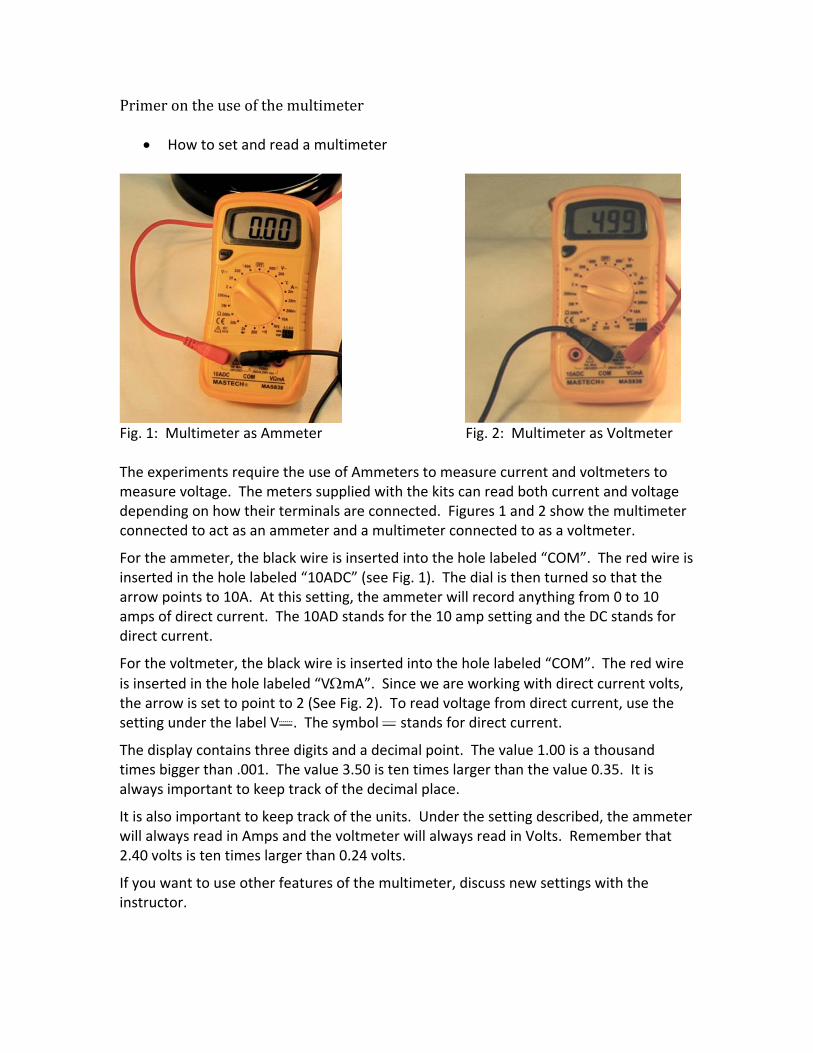
Primerontheuseofthemultimeter
How to set and read a multimeter
Fig. 1: Multimeter as Ammeter Fig. 2: Multimeter as Voltmeter The experiments require the use of Ammeters to measure current and voltmeters to measure voltage. The meters supplied with the kits can read both current and voltage depending on how their terminals are connected. Figures 1 and 2 show the multimeter connected to act as an ammeter and a multimeter connected to as a voltmeter.
For the ammeter, the black wire is inserted into the hole labeled “COM”. The red wire is inserted in the hole labeled “10ADC” (see Fig. 1). The dial is then turned so that the arrow points to 10A. At this setting, the ammeter will record anything from 0 to 10 amps of direct current. The 10AD stands for the 10 amp setting and the DC stands for direct current.
For the voltmeter, the black wire is inserted into the hole labeled “COM”. The red wire
is inserted in the hole labeled “VmA”. Since we are working with direct current volts, the arrow is set to point to 2 (See Fig. 2). To read voltage from direct current, use the setting under the label V . The symbol stands for direct current.
The display contains three digits and a decimal point. The value 1.00 is a thousand times bigger than .001. The value 3.50 is ten times larger than the value 0.35. It is always important to keep track of the decimal place.
It is also important to keep track of the units. Under the setting described, the ammeter will always read in Amps and the voltmeter will always read in Volts. Remember that 2.40 volts is ten times larger than 0.24 volts.
If you want to use other features of the multimeter, discuss new settings with the instructor.